
 Open Access Article
 This Open Access Article is licensed under a Creative Commons Attribution-Non Commercial 3.0 Unported Licence
Evaluation of the formation and antifouling properties of a novel adsorptive homogeneous mixed matrix membrane with in situ generated Zr-based nanoparticles†
Mei Zhang‡
a,
Fan Ni‡b,
Jinsong He *a and
Yan Liuc
*a and
Yan Liuc
aInstitute of Ecological and Environmental Sciences, Sichuan Agricultural University, Chengdu, Sichuan 611130, China. E-mail: hejinsong@sicau.edu.cn
bDepartment of Chemical Engineering, Northwest University for Nationalities, Lanzhou, Gansu 730030, China
cCollege of Environmental Sciences, Sichuan Agricultural University, Chengdu, Sichuan 611130, China
First published on 24th February 2021
Abstract
In situ generation is a powerful technique used to prepare homogenous adsorptive mixed matrix membranes (MMMs) containing functional nanoparticles, although the mechanism of formation of the membranes is not yet clear and there have been few published evaluations of membrane fouling. We therefore used this method to prepare a novel homogeneous adsorptive Zr-based nanoparticle–polyethersulfone (PES) MMM and systematically studied the mechanism of membrane formation at the atomic level. As the amount of ZrOCl2·8H2O in the casting solution increased, the phase inversion kinetics changed from instantaneous demixing due to the thermodynamic enhancement effect to a delayed demixing process caused by viscosity hindrance. The in situ generation of nanoparticles in these MMMs can be divided into three stages: the migration stage, the exfoliation stage and the stable stage. Our findings provide a fundamental understanding of the interface chemistry in the development of in situ generated MMMs. M2 showed a higher adsorption of As(V) than the pure PES membrane and could be reused after regeneration. The removal of As(V) from the M2 filtration system mainly took place via adsorption rather than size exclusion, as confirmed by EDS and experimental data. The presence of humic acid slightly inhibited the removal of As(V) during the filtration process as a result of the barrier effect caused by the formation of a filter cake via humic acid fouling. The filtration of a bovine serum albumin solution showed that the MMM with in situ generated nanoparticles had better antifouling properties than the PES membrane alone in multiple applications as a result of the enhanced hydrophilic surface.
1. Introduction
A new class of mixed matrix membranes (MMMs) containing functional nanoparticles has recently attracted much attention in the field of membrane technology. These functionalized MMMs have unique adsorptive, catalytic or antifouling properties.1–3 Adsorptive MMMs containing various types of nanoparticle (e.g. zinc oxide,4 iron oxide,5 titanium oxide,6 Zr7 and Ag8) have been developed on the laboratory scale. These studies have proved that adsorptive MMMs can be used to remove contaminants from water,9,10 but the development of adsorptive MMMs by traditional methods such as physical blending or dip-coating faces a number of challenges, including the agglomeration of nanoparticles within the MMM and the potential leakage of the nano-sorbent,11,12 which could reduce the performance of the MMMs.An in situ generation method has recently been developed to prepare homogeneous adsorptive MMMs. This method integrates the formation of the nanoparticles within the polymer matrix with phase inversion processes in one simple step in a coagulation bath. The resulting nanoparticles are well dispersed at the molecular level within the polymer matrix.13 In addition, the interpenetrating networks formed between the nanoparticles and the polymeric membrane increase the compatibility between these two phases and improve the stability of the nanoparticles within the membrane.
We have successfully prepared several types of homogeneous adsorptive MMMs by an in situ generation method14,15 and significantly improved both the distribution of the nanoparticles generated in situ and the compatibility between the nanoparticles and the polymeric membrane. We explored the mechanism of membrane formation in terms of the phase inversion process.14 However, to our knowledge, there has been no previous study of the membrane formation mechanism from the viewpoint of the in situ generation of nanoparticles.
Membrane fouling is an important issue in the application of MMMs and can affect performance.16,17 Natural organic pollutants easily adhere to the membrane surface, or even the inner channel of the membrane, as a result of the natural hydrophobicity of the membrane materials. This may cause a decrease in the water flux and the lifetime of the membrane17,18 Membrane fouling can also increase operating costs, energy consumption and the cost of maintenance.19,20 However, there has so far been only limited work evaluating the effects of fouling on the properties of adsorptive MMMs.
We prepared a novel homogenous Zr-based nanoparticle–polyethersulfone (PES) adsorptive MMM via an in situ generation method for use in the removal of arsenic from water. Our previous work has shown that Zr-based sorbents have a high adsorption capacity for arsenic.21 We investigated the properties of the membrane, including the morphology, the distribution of the in situ generated nanoparticles, the surface hydrophilicity, the porosity and the water flux. We also studied the mechanism of formation of the membrane in terms of the in situ formation of the nanoparticles and evaluated the adsorption of arsenic and the fouling performance of the membrane.
2. Material and methods
2.1. Materials
All the chemicals used in this study were of analytical grade. PES with a molecular weight of 28![[thin space (1/6-em)]](https://www.rsc.org/images/entities/char_2009.gif) 000 Da was purchased from German BASF. Zirconium oxychloride octahydrate (ZrOCl2·8H2O) was purchased from Kai ma chemical (Tianjin) Co., Ltd. Bovine serum protein (BSA, Mw = 68000 Da) was purchased from Solarbio technology (Beijing) Co., Ltd. Humic acid (HA), di-sodium hydrogen arsenate heptahydrate (Na2HAsO4·7H2O), dimethyl sulfoxide (DMSO), sulfuric acid (H2SO4) and other chemicals were purchased from Chengdu Kelong Chemical Reagent Plant.
000 Da was purchased from German BASF. Zirconium oxychloride octahydrate (ZrOCl2·8H2O) was purchased from Kai ma chemical (Tianjin) Co., Ltd. Bovine serum protein (BSA, Mw = 68000 Da) was purchased from Solarbio technology (Beijing) Co., Ltd. Humic acid (HA), di-sodium hydrogen arsenate heptahydrate (Na2HAsO4·7H2O), dimethyl sulfoxide (DMSO), sulfuric acid (H2SO4) and other chemicals were purchased from Chengdu Kelong Chemical Reagent Plant.
2.2. Preparation of Zr-based NPs/PES mixed matrix membrane
ZrOCl2·8H2O was used as the precursor of Zr-NPs, which was first dissolved in DMSO under ultrasonic vibration, and PES as the membrane polymer was then added into DMSO. The composition of casting solution was shown in Table 1.| Membrane | PES (wt%) | DMSO (wt%) | ZrOCl2·8H2O (wt%) | Zr content in designed membrane (wt%) |
|---|---|---|---|---|
| M0 | 16 | 84 | 0 | 0.00 |
| M0.5 | 16 | 84 | 0.5 | 0.87 |
| M1 | 16 | 84 | 1 | 1.72 |
| M1.5 | 16 | 84 | 1.5 | 2.56 |
| M2 | 16 | 84 | 2 | 3.38 |
The casting solution was shaken at 25 °C for 48 h to obtain a homogeneous solution. Then the uniform solution stayed for 24 h to remove the bubbles. After that, an appropriate amount of casting solution was spread uniformly on the surface of clean and dry glass plate with a casting thickness of 150 μm by a membrane scraper. After exposure to air for 10 s, the wet film was immersed into the coagulation bath with 1 wt% H2SO4 for 12 h at 25 °C. Finally, the prepared membrane was immersed in deionized (DI) water for 24 h to remove residual solvent and unreacted chemicals, prior to air drying at room temperature for subsequent experiments. Additionally, some white fine particles appeared around the membrane surface during the phase inversion process, which were collected and washed by DI water for further analysis.
2.3. Characterization of membranes
The morphology of the top surface and cross-section of the membranes were investigated by scanning electron microscope (SEM) (Quanta 250, FEI, USA). The cross-section samples of each membrane could be obtained by liquid nitrogen freezing crack method. The element distribution of in situ generated particles Zr-NPs in the membranes was analyzed by energy dispersive X-ray spectroscopy (EDS).
The cloud point of the casting solution was measured by a method described in the literature14. In details, DI water as non-solvent was continuously added into the casting solution in a glass bottle in a water bath with a constant temperature of 50 °C, until the casting solution turned irreversibly turbid. The amount of additional DI water at the end of titration was recorded. Each casting solution was measured for three times.
The viscosity of each casting solution was measured by a viscometer (Fangrui NDJ-5S, Shanghai, China) at 25 °C at a rotation rate of 60 rpm.17 Each casting solution was measured for three times to minimize the experimental error.
The phase inversion kinetics was studied by measuring the light transmittance. The experiments were carried out according to a method reported in other studies.14 The light transmittance curves with respect to the time were recorded and plotted.
The water contact angle was measured by the sessile drop method using a contact angle instrument (Fangrui JYC-2, Shanghai, China).22 In order to reduce the experimental error, three contact angles were measured for each sample, and three samples of each membrane were tested.
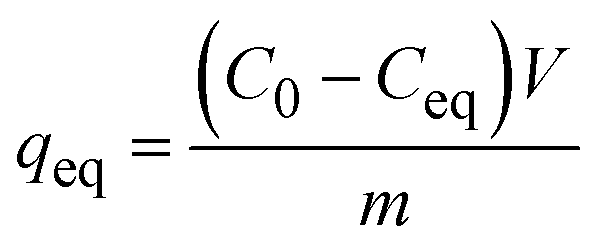
The porosity of the membrane was determined by the gravimetric method.23 The membrane sample was immersed in water for 24 h to get saturated. After removing the excessive water on the surface of the membrane with filter paper, the wet membrane was weighed and recorded. Then the wet membrane was dried at 25 °C for 12 h to get the weight of dried membrane. Three samples of each type of membrane were tested. The porosity of the membrane was calculated as follows:15
 | (1) |
The water flux (WF) was measured by a dead-end filtration cell (Model 8050, Millipore Corporation) with an effective filter area of 12.56 cm2. The WF was measured at steady-state flow under a trans-membrane pressure (TMP) of 4.35 psi (0.03 MPa). The WF was determined as follows:24
 | (2) |
2.4. Adsorption experiments
 | (3) |
In the adsorption isotherm experiment, 0.05 g different types of membranes were added into 50 mL of As(V) solutions with different initial concentration and shaken for 48 h. The pH was controlled as constant at pH 7.0 ± 0.1. Finally, the treated solutions were collected and filtered with 0.45 μm filters. The concentration of As(V) was measured by ICP-OES.
In the pH effect experiment, 0.05 g M2 was added to 50 mL As(V) solution with initial concentration of 5 mg L−1 under the pH ranging from 2.0–12.0. The other procedures were the same as the adsorption isotherm experiment. The concentration of Zr ions released into the final solutions was measured by ICP-OES.
The effects of co-existing substances such as anions (carbonate, silicate, phosphate and nitrate species) and nature organic matters (NOMs, represented by HA) on the adsorption performance were studied. The initial As(V) concentration was 5 mg L−1, and the concentrations of co-existing substances used in this study were prepared referred to their actual concentration levels in natural water. The other procedures were the same as the adsorption isotherm experiments.
The regeneration experiments were conducted with three adsorption–desorption cycles. In each cycle, the membrane was added into 200 mL As(V) solution with concentration of 20 mg L−1 at constant pH 7.0 and shaken for 48 h. Thereafter, the used membrane was regenerated by 0.01 M NaOH solution followed by 0.01 M H2SO4 solution for 12 h. The regenerated membrane was washed by DI water and dried for reuse in the next cycle.
To further study the effect of membrane structure on the filtration performance, the filtration of other substances, i.e. PEG, sulphate, and nitrate ions, were also studied in a long-term running under the same TMP. The concentrations of other substances were set as 1 mg L−1, which is much higher than that of As(V) filtration system. The concentration of sulphate and nitrate anions were measured by Ion Chromatography (IC) (ICS-5000+, Thermo, US). The concentration of PEG was measured at λmax = 210 nm by an UV-vis spectrophotometer (P4 UV-visible spectrophotometer, Mapada, China). And the concentrations of Zr ions released into the permeate were measured by ICP-MS.
In addition, regarding the wide existence of NOMs (represented by HA) in natural water, the effect of HA (5 mg L−1) on the filtration performance was also studied. The dynamic filtration experiment of 50 μg L−1 As(V) and 5 mg/LHA solution was also performed by using M2. The other conditions were the same as the aforementioned. Moreover, to further investigate the filtration process, the morphology and element analysis of the used membrane were studied by SEM-EDS.
2.5. Membrane fouling experiments
In this study, to evaluate the membrane fouling performance, the BSA filtration experiments of M0 and M2 was conducted using the same dead-end filtration cell (Model 8050) and a solution reservoir (Model RC800, Millipore), with nitrogen gas as pressure gas in the feed side. The BSA filtration experiments were conducted for three cycles. In details, each membrane was pre-compressed with DI water at 0.05 MPa for 40 min to get a steady flux, and then the pressure was reduced to the operating pressure of 0.03 MPa. The pure water flux was recorded as J0 until the flux was stable enough. Thereafter, 0.5 g L−1 BSA in phosphate buffer saline (PBS) at pH 7.0 represented as simulated organic fouling solution was used as feed solution at the same operating pressure and the fluxes were recorded as J1. After filtration of BSA solution, the used membrane was back washed with DI water for 3 h. The water flux of cleaned membrane was measured again at the same condition and recorded as J2 for the second cycle, and J3 for the third cycle, respectively. The above filtration process of DI water filtration-BSA filtration-back wash was repeated for twice under the same conditions. In order to evaluate the membrane fouling performance, the BSA rejection rate (R) and the flux recovery rate (FRR) of the membrane were calculated. The concentrations of BSA in the feed solution and permeate solution were measured at 280 nm by the same UV-vis spectrophotometer, the rejection rate (R) of BSA by membranes was determined as follows:24
 | (4) |
The flux recovery rate (FRR) of the membrane was calculated as follows:26
 | (5) |
Generally, the membrane fouling is composed of two parts: reversible and irreversible fouling. The flux loss caused by reversible fouling (Rr), irreversible fouling (Rir), and total fouling (Rt) of BSA to the membrane can be determined by the following equations:24
 | (6) |
 | (7) |
 | (8) |
3. Results and discussion
3.1. Characterization of membrane
 | ||
| Fig. 1 (a) TEM image and (b) FTIR spectrum of the particles generated in situ. | ||
 | ||
| Fig. 2 XPS spectra of M2: (a) wide scan spectrum and (b) high-resolution spectrum of Zr 3d. | ||
 | ||
| Fig. 3 EDS mapping of M2: (a) cross-sectional SEM image, (b) C Ka1, (c) O Ka1, (d) S Ka1 and (e) Zr La1. | ||
3.2. Mechanism of membrane formation
3.2.1.1. Thermodynamics of casting solution. The thermodynamics of the casting solution used in the phase inversion process have an important role in the phase demixing rate and therefore affect the structure of the membrane.29 In general, the viscosity and cloud point are the two primary parameters used to describe the thermodynamics of the casting solution.30 Fig. 4 shows that the addition of ZrOCl2·8H2O to the casting solution dramatically changes these two parameters. More specifically, the viscosity of the casting solution is significantly increased with increasing amounts of ZrOCl2·8H2O in the casting solution, whereas the cloud point clearly decreases. These findings are consistent with previously reported work.14 The dissolution of the additive ZrOCl2·8H2O, which contains hydrophilic groups, in the DMSO solvent reduces the amount of DMSO available to dissolve PES. The degree of PES–solvent interaction is therefore decreased, increasing the viscosity of the casting solution.31 The greater the amount of ZrOCl2·8H2O added to the casting solution, the less DMSO is available for the dissolution of PES. As a result, the phase compatibility of ZrOCl2·8H2O–PES–DMSO decreases, further reducing the thermodynamic stability of the casting solution. The viscosity increases from M0 to M2, whereas the cloud point slightly decreases. For example, the viscosity of M2 increases to about twice that of M0 (from 290 to 628 mPa s), whereas the corresponding cloud point shows relatively a small change from 3.6 to 2.8%.
 | ||
| Fig. 4 Cloud point and viscosity of different casting solutions. | ||
3.2.1.2. Phase inversion kinetics. We evaluated the phase inversion kinetics of the membrane by measuring the changes in the transmittance of light. The transmittance of light in the membrane-forming process reflects the exchange rate between the solvent and non-solvent. Fig. 5 shows that the phase inversion process took longer to complete as the amount of Zr in the casting solution increased – for example, M2 required the longest time (about 8 s) to sufficiently complete the phase inversion process, whereas M0.5 only required about 3 s to finish the phase transformation. The phase inversion process changed from instantaneous phase demixing for M0 to delayed phase demixing for M2.
 | ||
| Fig. 5 Light transmittance curves of different casting solutions. | ||
This phenomenon can be attributed to the changes in viscosity and thermodynamic stability of the casting solutions. A high-viscosity casting solution can lead to a large difference in the concentration of solvent and non-solvent at the interface between the casting solution and the coagulation bath, which can slow the mutual diffusion rate of the solvent and non-solvent and inhibit the demixing process (the viscosity hinderance effect).32 By contrast, the thermodynamic instability of the casting solution usually accelerates the exchange rate of the solvent and non-solvent, increasing the demixing rate (the thermodynamic enhancement effect).18 As a consequence, the demixing rate is determined by the relative contributions of these two effects. When the glass plate was immersed into the coagulation bath, the thermodynamic instability led to a rapid exchange between the solvent outside the membrane surface and the non-solvent. In addition, the precursor of the Zr additive increased the hydrophilicity of the casting solution, resulting in an acceleration of the exchange rate. With continuous phase inversion, the inner solvent will migrate outwards to coagulation bath, with the rate of migration mainly determined by the rheological resistance. The significant reduction in the demixing rate after 2 s in M1.5 and M2.0 is therefore mainly a result of the viscosity hindrance effect, which prevents exchange between the solvent inside the membrane and the non-solvent. The exchange rate was increased for M0.5, but was little changed for M1.0, which had a lower viscosity than M2. The thermodynamic enhancement effect plays a dominant part in the phase inversion kinetics for lower loadings of the Zr precursor in the casting solution, whereas the viscosity hinderance effect has the primary role at higher loadings.
 | ||
| Fig. 6 In situ generation of the Zr nanoparticles: (a) quality of released Zr in coagulation bath; (b) quality of Zr in the formed membrane; and (c) the content of Zr in formed membrane plotted against time. | ||
The release of Zr can be divided into three stages. In stage 1, within the first 8 s, the Zr concentration in coagulation bath changes at a low rate. In particular, a very limited amount of Zr dissolved in DMSO (about 1.0–1.5% of the designed Zr content in the casting solution) migrates from the casting solution into the coagulation bath, accompanied by the formation of a nascent membrane via a phase inversion process. In this stage, the migration of Zr is mainly a result of the demixing process, in which the solvent DMSO is exchanged by the non-solvent, which migrates from the casting solution to the coagulation bath. This stage is referred to as the migration stage. In stage 2 from 0.13 min (i.e. 8 s) to 10 min, Zr is continuously released into the coagulation bath at a faster rate than in the first stage. As the nascent membrane is formed, the in situ generated Zr-based nanoparticles or unreacted Zr ions on the top surface and on the outer surface of the inner pores of the membrane tend to move into the hydrophilic coagulation bath from the interface between the hydrophilic nanoparticles and the hydrophobic polymer. The second stage is therefore referred to as the exfoliation stage. In the third stage, the amount of Zr released in the coagulation bath increases slowly and reaches a stable state within 1 h for all membranes. The in situ generation of Zr-based nanoparticles is therefore complete within 1 h. This last stage is referred to as the stable stage. These three stages can be used to describe the in situ generation of nanoparticles in terms of the in situ reaction in the coagulation bath and provide a new way of understanding the mechanism of formation of in situ generated MMMs.
The in situ generation of nanoparticles requires a longer time to complete than the phase inversion process. At least 1 h is required for the completion of both processes in the coagulation bath.
As the loading of the Zr precursor in the casting solution increases, the amount of Zr released also increases, although the quality of the Zr remaining within the membrane (Fig. 6b) increases from M0.5 to M2 (i.e. 7.40–29.94 mg g−1-membrane). Fig. 6c shows that the corresponding amount of Zr remaining in all the mixed membranes can reach >85%. In particular, the amount of Zr remaining in the membrane for M0.5 is about 85% of the designed amount, whereas the Zr content in the other membranes remains relatively stable at about 88%, despite the increased quality of Zr from M1 to M2. M2 (88.53%) have the highest content of in situ generated nanoparticles in the formed membrane.
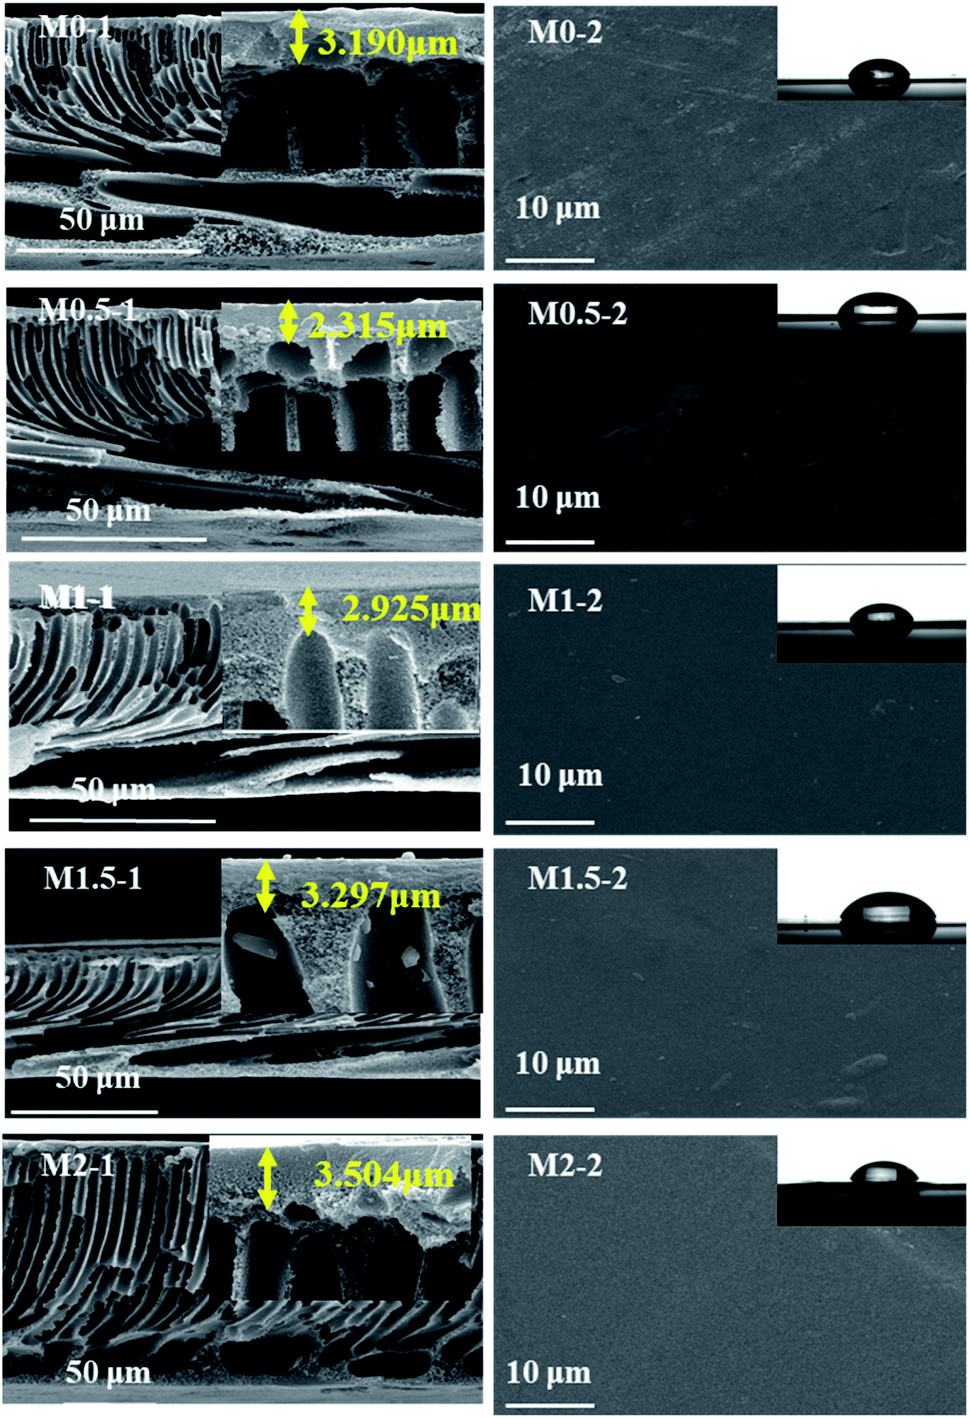 | ||
| Fig. 7 SEM images of cross-section (left) and top surface (right) of M0–M2. Insets: enlarged images of top thin layers (left) and photographs of the water contact angle (right) of each type of membrane. | ||
| Membrane | Porosity (%) | Water contact angle (°) | Water flux (L m−2 h−1) | Zr content in formed membrane (wt%) |
|---|---|---|---|---|
| M0 | 72.21 ± 0.02 | 67.54 ± 1.98 | 67.63 ± 5.39 | 0.00 |
| M0.5 | 78.64 ± 0.02 | 62.44 ± 2.24 | 91.18 ± 5.08 | 0.74 |
| M1 | 77.06 ± 0.02 | 60.72 ± 2.05 | 117.15 ± 8.72 | 1.51 |
| M1.5 | 76.88 ± 0.02 | 57.60 ± 2.12 | 132.04 ± 2.67 | 2.21 |
| M2 | 75.51 ± 0.03 | 54.35 ± 2.31 | 127.6 ± 4.65 | 2.99 |
The water contact angle is widely used to evaluate the hydrophilicity of membranes. In general, a smaller contact angle indicates a better surface hydrophilicity.33 The contact angles of the prepared membranes decreases as the amount of nanoparticles inside increases (Table 2), indicating that the hydrophilicity of the membrane can be improved by the presence of the in situ generated nanoparticles. As the structure of the top surface is similar for different membranes, it is the surface composition that has a key role in determining the hydrophilicity of the surface.34 The amount of Zr-based nanoparticles within the membranes increases from M0 to M2, which results in more hydrophilic components becoming available on the surface of the membrane.
The pure water flux of the MMMs increases significantly with the increase in the amount of ZrOCl2·8H2O in the casting solution from M0.5 to M1.5 and decreases slightly for M2, all of which are higher than M0 (Table 2). Although the porosity of the MMMs slightly decreases from M1 to M2, the hydrophilic in situ generated Zr-based nanoparticles within the membrane greatly improve the hydrophilicity of the MMMs, leading to an enhanced permeability to water.
The Zr content in the membrane matrix increases as the amount of loading increases, which increases the surface hydrophilicity of the membrane. The morphology of the top surface is very similar for different membranes and the surface hydrophilicity is mainly affected by the surface composition. The change in surface hydrophilicity is related to the amount of Zr remaining in the membrane. The trend in the resulting water permeability also corresponds to the amount of Zr remaining in the membrane. These results suggest that the in situ generation of nanoparticles process also has an important role in controlling the properties of the membrane, including the surface composition, surface hydrophilicity and permeability to water.
The structure and properties of the membrane can therefore be well controlled by adjusting the phase inversion process and the in situ generation of nanoparticles.
3.3. Adsorption performance
 | ||
| Fig. 8 Adsorption of As(V) onto the Zr-based nanoparticle–PES membrane: (a) adsorption isotherm and modelling curves, (b) effect of pH, (c) effect of co-substances and (d) regeneration of M2. Experimental conditions: membrane dosage = 1 g L−1, [As]0 = 5 mg L−1 for (b and c), pH = 7 ± 0.1 and T = 20 ± 1 °C. | ||
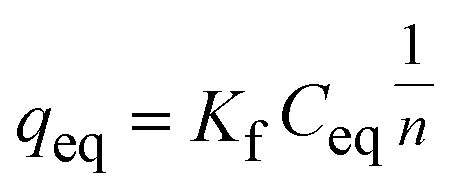
We used Langmuir and Freundlich isotherm models to describe the adsorption isotherm. The Langmuir equation can be expressed as:38
 | (9) |
 | (10) |
Table 3 summarizes the parameters of the Langmuir and Freundlich isotherm models. The Langmuir model describes the adsorption data well, with a correlation coefficient (r2) of 0.917–0.951 and a χ2 value of 0.019–0.146. The fitting curves for the Freundlich model deviate from the experimental data, with an r2 of 0.808–0.828 and a χ2 value of 0.041–0.496. The Langmuir isotherm model therefore provides a better description of the experimental data than the Freundlich isotherm model. This indicates that the adsorption of As(V) on the mixed membrane can be controlled by a monolayer adsorption process.
| Membrane | Langmuir isotherm | Freundlich isotherm | ||||||
|---|---|---|---|---|---|---|---|---|
| qmax (mg g−1) | B (L mg−1) | r2 | χ2 | Kf | n | r2 | χ2 | |
| M0.5 | 1.832 | 0.517 | 0.917 | 0.145 | 0.647 | 2.364 | 0.820 | 0.350 |
| M1 | 3.622 | 0.535 | 0.927 | 0.063 | 1.270 | 2.049 | 0.828 | 0.041 |
| M1.5 | 5.124 | 0.675 | 0.922 | 0.139 | 2.059 | 2.544 | 0.808 | 0.496 |
| M2 | 6.327 | 1.084 | 0.951 | 0.018 | 3.120 | 3.012 | 0.827 | 0.148 |
The trend in the change in the b value is contrast to the trend in the change in the contact angle, so that a lower contact angle is measured with higher values of b. An increased load of in situ generated Zr-based nanoparticles within the membranes leads to a lower contact angle, which can result in a more hydrophilic membrane surface and a stronger adsorption of As(V). Based on the Langmuir isotherm model, the maximum adsorption capacity of M2 was 6.327 mg g−1. M2 was therefore selected for subsequent experiments because it shows the highest content of Zr-based nanoparticles and the highest capacity for the adsorption of As(V).
We also investigated the release of Zr-based nanoparticles after adsorption. Fig. 8b indicates that no Zr ion is detected at any pH. This suggests that no leakage of nanoparticles occurs during the adsorption process, further confirming the stability of the in situ generated nanoparticles in the membrane matrix.
000 Å, which is much higher than the size of As(V) anions. These findings suggest that the removal of As(V) by M2 should be mainly attributed to adsorption rather than size exclusion effect. To further distinguish both contributions, the effect of membrane structure on the filtration performance was also studied by using other substances (such as PEG, and sulphate and nitration anions), which has no interaction with Zr-NPs. The results shown in Fig. S2† demonstrate that almost all of these substances can go through the membrane matrix and enter into the permeate, indicating that the top thin layer and inner pores have little rejection effect on these substances. This result further confirms that the removal of As(V) should be ascribed to the adsorption effect. More importantly, the long-term filtration was operated without occurrence of Zr leakage, suggesting that the M2 possesses a long-term stability under the filtration conditions.
 | ||
| Fig. 9 Dynamic filtration of As(V) by M2. Experimental conditions: TMP = 0.005 MPa, pH = 7.0 ± 0.1, T = 20 ± 1 °C, As(V) = 50 μg L−1 and humic acid = 5 mg L−1. | ||
 | ||
| Fig. 10 SEM-EDS mapping of M2 after dynamic filtration experiment: (a) SEM image, (b) EDS spectrum, (c) Zr La and (d) As La. (1) Top surface of single As(V) system, (2) cross-section of single As(V) system and (3) low-resolution image of top surface and (4) high-resolution image of top surface of As(V) and humic acid (5 mg L−1). | ||
The presence of 5 mg L−1 humic acid in a mixed binary solution of As(V)–humic acid slightly decreases the filtration performance. The volume of the permeate with a concentration of As(V) below the breakthrough point reaches 3284 bed volume, which is 8.34% less than that for the As(V)-only results. The presence of humic acid in the batch experiment greatly reduces the adsorption of As(V). The presence of humic acid in the filtration process affects the removal of As(V) via two mechanisms: (1) humic acid can adhere to the membrane matrix and block the sites available for adsorption;41 or (2) the humic acid rejected by size sieving could form a filter cake layer on the membrane surface (Fig. 10). The signal of elemental As is also detected on the surface of the filter cake layer. This indicates that the filter cake layer can act as a barrier to prevent As(V) ions from flowing across from the top surface of the membrane to the base of the membrane, enhancing the removal of As ions. The slight reduction in the removal of As(V) in the presence of humic acid can be mainly ascribed to the barrier effect of the humic acid filter cake.
3.4. Antifouling performance
Membrane fouling is a common problem and can reduce the permeability of the membrane, decrease selectivity, increase energy consumption and shorten the life of the membrane.42We used a bovine serum albumin (BSA) solution to represent organic matter in the filtration process and investigated the antifouling ability of M0 and M2. The hydrophilicity of the membrane generally affects its antifouling ability. The stronger the hydrophilicity of the membrane, the higher its antifouling ability.1 Table 2 shows that the contact angle of M0 is 67.54° and that of M2 is 54.35°, suggesting that M2 has a higher hydrophilicity and anti-pollution properties than M0. Table 4 shows the results of three cycles of BSA rejection rate (R) experiments with M0 and M2. The value of R of M2 was higher than that of M0 in all cycles. For example, the R of BSA was 78.1% in the first cycle of M2 and 69.0% in the second cycle of M2, which is about 1.46 and 2.11 times of the R in the corresponding cycles for M0. This suggests that the addition of Zr-based nanoparticles could increase the anti-pollution effect of the membrane due to the increase in the hydrophilicity of the membrane surface and pore walls. Compared with the first cycle, the R of BSA for M0 dramatically decreased from 53.6 to 32.7% in the second cycle, whereas the R for M2 slightly decreased by 9.1%. This suggests that the MMM with in situ generated nanoparticles may have better antifouling properties than the PES membrane alone in multiple applications.
| Antifouling evaluation parameters | M0 | M2 | ||||
|---|---|---|---|---|---|---|
| First cycle | Second cycle | Third cycle | First cycle | Second cycle | Third cycle | |
| R (%) | 53.6 | 32.7 | 30.8 | 78.1 | 69.0 | 58.2 |
| FRR (%) | 59.5 | 49.8 | 46.3 | 76.4 | 64.2 | 61.9 |
| Rt (%) | 58.2 | 62.8 | 68.6 | 44.1 | 58.9 | 65.5 |
| Rir (%) | 40.5 | 50.2 | 53.7 | 23.6 | 35.8 | 38.0 |
| Rr (%) | 17.7 | 12.6 | 14.9 | 20.5 | 23.1 | 27.5 |
The flux recovery rate is also an important parameter in the evaluation of antifouling properties.34 In general, a higher flux recovery rate suggests a better antifouling performance. Fig. 11 shows the flux curves of M0 and M2. The flux of M0 and M2 is relatively stable in the first cycle of deionized water filtration. However, after each cycle of BSA filtration, the flux of M2 and M0 decreased significantly, which can be attributed to the deposition and adsorption of protein on the membrane surface as a result of the formation of the filter cake during the filtration of BSA.19,37 Table 4 shows that, after the first backwash, the values of FRR of M0 and M2 are 59.8 and 76.4%, respectively, whereas after the 3rd backwash, the FRR values of M0 and M2 decrease to 46.3% and 61.9%, respectively. The flux recovery of M2 is higher than that of M0, which is related to the hydrophilicity of the membrane. The generated hydrophilic Zr-based nanoparticles therefore improve the hydrophilicity of the PES, which immobilizes the water around the PES matrix, forming a hydration layer on the surface of the membrane.43 This water layer acts as a barrier to prevent protein from attaching to the mixed membrane. The hydrophobic PES membrane tends to adsorb proteins, which act as a barrier and cause a significant low flow recovery.
 | ||
| Fig. 11 Flux variation of M0 and M2 during two cycles of filtration BSA solution. | ||
To further analyse the antifouling properties of the membranes, we analysed the compositions of the membrane fouling products, including both reversible and irreversible fouling products (Table 4). In the two filtration cycles, although the reversible fouling (Rr) of M2 increases compared with M0, the irreversible (Rir) and corresponding total (Rt) fouling continuously decreases. This is because the hydrated layer formed around the in situ generated membrane can prevent the protein molecules from forming a solid bond with the membrane material, thereby reducing pollution by organic matter. This further verifies that M2 has a higher antifouling ability than M0.
The M2 membrane has a comparable FRR to other previously reported antifouling PES membranes under similar measurement conditions (76.4% versus 62.5–80.8%).24,25,44,45 This indicates that the antifouling ability of the pure PES membrane can be improved by the addition of in situ generated hydrophilic nanoparticles. Furthermore, the present membrane M2 also displays comparable adsorption capacity to other reported adsorptive membranes, regarding its loading amount of NPs and relatively easy one-step preparation process as shown in Table 5.
| Membranes | pH | Content of additive in membrane (%) | Ce of As(V) (mg L−1) | qmax based on membrane dosage (mg g−1) | BSA rejectiona (%) | FRRa (%) | Reference |
|---|---|---|---|---|---|---|---|
| a Represents the data obtained from 1st cycle of BSA filtration. | |||||||
| Cu nanoparticles intercalated in carbon nanotube membranes | 7.0 | 2.31 | 0.09 | 0.084 | — | — | 10 |
| PVDF/zirconia (0.5) blend flat sheet membrane | 3–4 | 0.5 | 40 | 4.5 | — | — | 46 |
| Iron oxyhydroxides in an adsorption-submerged membrane | 8.1 | 44.5 | 0.01 | 6.2 | — | — | 47 |
| Polyethersulfone mixed matrix membranes embedded with Zr-incorporated SBA-15 materials | 7.6 | 6.2 | — | — | 56.8 | 60.0 | 1 |
| Polyethersulfone ultrafiltration membrane modified with a CuO/ZnO nanocomposite | 7.0 | 0.2 | — | — | 99 | 50.1 | 45 |
| Mixed matrix polyethersulfone membranes blended with magnetic nanoparticles | 7.0 | 0.1 | — | — | — | 65–70 | 16 |
| Self-assembly of TiO2 nanoparticles/PES ultrafiltration membrane | 7.4 | 2.0 | — | — | 95.5 ± 0.9 | 67.6 | 24 |
| In situ generated Zr-based nanoparticles/PES mixed matrix membrane | 7.0 | 2.99 | 8.0 | 6.327 | 78.1 | 76.4 | This study |
4. Conclusions
We developed a novel Zr-based nanoparticle–PES adsorptive MMM using an in situ generation method. The in situ generation of nanoparticles was investigated to explore the mechanism for the formation of the membrane. We also explored the antifouling performance of the MMM to evaluate its use in practical applications. The XPS and EDS results showed that the Zr-based nanoparticles generated in situ were homogenously distributed within the PES membrane. The phase inversion process varied from an instantaneous demixing process caused by an increase in thermostability to a delayed demixing process caused by viscosity hindrance. The resultant structure of the MMMs changed from a larger finger-like macro-void structure (M0.5 and M1) to a suppressed finger-liker macro-void structure (M2) with increasing amounts of in situ generated nanoparticles.The release of Zr in the coagulation batch suggested that the in situ generation process can be divided into three stages: a migration, an exfoliation and a stable stage. M2 had an enhanced hydrophilicity, water flux, adsorption and antifouling performance over the PES membrane, including a higher adsorption of As, a higher rejection of BSA and higher FRR values after water backwashing. M2 can effectively remove As, mainly by adsorption effects, during filtration processes. Even in the presence of humic acid, M2 can maintain a high efficiency for the removal of As via adsorption and size exclusion effects. These findings provide a new insight into the mechanism of formation of in situ generated nanoparticle–polymer MMMs and a comprehensive evaluation of adsorptive MMMs for practical water treatment systems.
Conflicts of interest
There are no conflicts to declare.Acknowledgements
This study was supported by the National Natural Science Foundation of China (grant numbers 51708372, 51508465); Science and Technology Department of Sichuan Province, China (grant no. 2020YFH0132 & 2018JY0457); the Education Department of Sichuan Province, China (grant number 18ZA0372); and the Fundamental Research Funds for the Central Universities, China (grant number 31920190075).References
- J. Guo, A. Sotto, A. Martín and J. Kim, Preparation and characterization of polyethersulfone mixed matrix membranes embedded with Ti- or Zr-incorporated SBA-15 materials, J. Ind. Eng. Chem., 2017, 45, 257–265 CrossRef CAS
.
- J. He, Y. Song and J. P. Chen, Development of a novel biochar/PSF mixed matrix membrane and study of key parameters in treatment of copper and lead contaminated water, Chemosphere, 2017, 186, 1033–1045 CrossRef CAS
- X.-F. Sun, J. Qin, P.-F. Xia, B.-B. Guo, C.-M. Yang, C. Song and S.-G. Wang, Graphene oxide–silver nanoparticle membrane for biofouling control and water purification, Chem. Eng. J., 2015, 281, 53–59 CrossRef CAS
- M. Sheikh, M. Pazirofteh, M. Dehghani, M. Asghari, M. Rezakazemi, C. Valderrama and J.-L. Cortina, Application of ZnO nanostructures in ceramic and polymeric membranes for water and wastewater technologies: a review, Chem. Eng. J., 2020, 391, 123475 CrossRef CAS
- N. Ghaemi, S. S. Madaeni, P. Daraei, H. Rajabi, S. Zinadini, A. Alizadeh, R. Heydari, M. Beygzadeh and S. Ghouzivand, Polyethersulfone membrane enhanced with iron oxide nanoparticles for copper removal from water: application of new functionalized Fe3O4 nanoparticles, Chem. Eng. J., 2015, 263, 101–112 CrossRef CAS
- M. Shaban, H. AbdAllah, L. Said, H. S. Hamdy and A. Abdel Khalek, Titanium dioxide nanotubes embedded mixed matrix PES membranes characterization and membrane performance, Chem. Eng. Res. Des., 2015, 95, 307–316 CrossRef CAS
- G. Wei, J. Qi, P. Lin, S. Pan, X. Sun, J. Shen, W. Han, L. Wang and J. Li, Polyethersulfone enwrapped hydrous zirconium oxide nanoparticles for efficient removal of Pb(II) from aqueous solution, Chem. Eng. J., 2018, 349, 500–508 CrossRef CAS
- E. Mahmoudi, L. Y. Ng, M. M. Ba-Abbad and A. W. Mohammad, Novel nanohybrid polysulfone membrane embedded with silver nanoparticles on graphene oxide nanoplates, Chem. Eng. J., 2015, 277, 1–10 CrossRef CAS
- J. E. Efome, D. Rana, T. Matsuura and C. Q. Lan, Experiment and modeling for flux and permeate concentration of heavy metal ion in adsorptive membrane filtration using a metal–organic framework incorporated nanofibrous membrane, Chem. Eng. J., 2018, 352, 737–744 CrossRef CAS
- H. Luan, B. Teychene and H. Huang, Efficient removal of As(III) by Cu nanoparticles intercalated in carbon nanotube membranes for drinking water treatment, Chem. Eng. J., 2019, 355, 341–350 CrossRef CAS
- S. Kango, S. Kalia, A. Celli, J. Njuguna, Y. Habibi and R. Kumar, Surface modification of inorganic nanoparticles for development of organic–inorganic nanocomposites—a review, Prog. Polym. Sci., 2013, 38, 1232–1261 CrossRef CAS
- J. Yin and B. Deng, Polymer-matrix nanocomposite membranes for water treatment, J. Membr. Sci., 2015, 479, 256–275 CrossRef CAS
- X. Li, R. Pang, J. Li, X. Sun, J. Shen, W. Han and L. Wang, In situ formation of Ag nanoparticles in PVDF ultrafiltration membrane to mitigate organic and bacterial fouling, Desalination, 2013, 324, 48–56 CrossRef CAS
- J. He, A. Cui, F. Ni, S. Deng, F. Shen, C. Song, L. Lou, D. Tian, C. Huang and L. Long, In situ-generated yttrium-based nanoparticle/polyethersulfone composite adsorptive membranes: Development, characterization, and membrane formation mechanism, J. Colloid Interface Sci., 2019, 536, 710–721 CrossRef CAS
- J. He, D. Xiong, P. Zhou, X. Xiao, F. Ni, S. Deng, F. Shen, D. Tian, L. Long and L. Luo, A novel homogenous in situ generated ferrihydrite nanoparticles/polyethersulfone composite membrane for removal of lead from water: development, characterization, performance and mechanism, Chem. Eng. J., 2020, 393, 124696 CrossRef CAS
- P. Daraei, S. S. Madaeni, N. Ghaemi, M. A. Khadivi, B. Astinchap and R. Moradian, Fouling resistant mixed matrix polyethersulfone membranes blended with magnetic nanoparticles: study of magnetic field induced casting, Sep. Purif. Technol., 2013, 109, 111–121 CrossRef CAS
- J. Wang, M. Qiu and C. He, A zwitterionic polymer/PES membrane for enhanced antifouling performance and promoting hemocompatibility, J. Membr. Sci., 2020, 606, 118119 CrossRef CAS
- F. Wang, Y. Wu and Y. Huang, Novel application of graphene oxide to improve hydrophilicity and mechanical strength of aramid nanofiber hybrid membrane, Composites, Part A, 2018, 110, 126–132 CrossRef CAS
- H. Gong, Z. Jin, Q. Wang, J. Zuo, J. Wu and K. Wang, Effects of adsorbent cake layer on membrane fouling during hybrid coagulation/adsorption microfiltration for sewage organic recovery, Chem. Eng. J., 2017, 317, 751–757 CrossRef CAS
- M. Li, J. C. Bradley, A. R. Badireddy and H. Lu, Ultrafiltration membranes functionalized with lipophilic bismuth dimercaptopropanol nanoparticles: anti-fouling behavior and mechanisms, Chem. Eng. J., 2017, 313, 293–300 CrossRef CAS
- J. He, T. Matsuura and J. P. Chen, A novel Zr-based nanoparticle-embedded PSF blend hollow fiber membrane for treatment of arsenate contaminated water: material development, adsorption and filtration studies, and characterization, J. Membr. Sci., 2014, 452, 433–445 CrossRef CAS
- G. Moradi, S. Zinadini, L. Rajabi and A. Ashraf Derakhshan, Removal of heavy metal ions using a new high performance nanofiltration membrane modified with curcumin boehmite nanoparticles, Chem. Eng. J., 2020, 390, 124546 CrossRef CAS
- S. Liu, M. Liu, Z. Xu, Y. Wei and X. Guo, A novel PES–TiO2 hollow fiber hybrid membrane prepared via sol–gel process assisted reverse thermally induced phase separation (RTIPS) method, J. Membr. Sci., 2017, 528, 303–315 CrossRef CAS
- X. Li, X. Fang, R. Pang, J. Li, X. Sun, J. Shen, W. Han and L. Wang, Self-assembly of TiO2 nanoparticles around the pores of PES ultrafiltration membrane for mitigating organic fouling, J. Membr. Sci., 2014, 467, 226–235 CrossRef CAS
- M. Kumar, A. M. Isloor, T. Somasekhara Rao, A. F. Ismail, R. Farnood and P. M. G. Nambissan, Removal of toxic arsenic from aqueous media using polyphenylsulfone/cellulose acetate hollow fiber membranes containing zirconium oxide, Chem. Eng. J., 2020, 393, 124367 CrossRef CAS
- X. Li, A. Sotto, J. Li and B. Van der Bruggen, Progress and perspectives for synthesis of sustainable antifouling composite membranes containing in situ generated nanoparticles, J. Membr. Sci., 2017, 524, 502–528 CrossRef CAS
- M. S. Shamsudin, S. F. Azha, L. Sellaoui, M. Badawi, Y. O. Al-Ghamdi, A. Bonilla-Petriciolet and S. Ismail, Fabrication and characterization of a thin coated adsorbent for antibiotic and analgesic adsorption: experimental investigation and statistical physical modelling, Chem. Eng. J., 2020, 401, 126007 CrossRef CAS
- Y. Ma, Y. Zheng and J. P. Chen, A zirconium based nanoparticle for significantly enhanced adsorption of arsenate: synthesis, characterization and performance, J. Colloid Interface Sci., 2011, 354, 785–792 CrossRef CAS
- A. F. Ismail and A. Mansourizadeh, A comparative study on the structure and performance of porous polyvinylidene fluoride and polysulfone hollow fiber membranes for CO2 absorption, J. Membr. Sci., 2010, 365, 319–328 CrossRef CAS
- T. V. Plisko, A. V. Penkova, K. S. Burts, A. V. Bildyukevich, M. E. Dmitrenko, G. B. Melnikova, R. R. Atta, A. S. Mazur, A. A. Zolotarev and A. B. Missyul, Effect of Pluronic F127 on porous and dense membrane structure formation via non-solvent induced and evaporation induced phase separation, J. Membr. Sci., 2019, 580, 336–349 CrossRef CAS
- Y. Zhang, X. Jing, K. Jing, L. Chang and W. Bao, Study on the pore structure and oxygen-containing functional groups devoting to the hydrophilic force of dewatered lignite, Appl. Surf. Sci., 2015, 324, 90–98 CrossRef CAS
- N. A. A. Sani, W. J. Lau, N. A. H. M. Nordin and A. F. Ismail, Influence of organic solvents and operating conditions on the performance of polyphenylsulfone (PPSU)/copper-1,3,5-benzenetricarboxylate (Cu-BTC) solvent resistant nanofiltration (SRNF) membranes, Chem. Eng. Res. Des., 2016, 115, 66–76 CrossRef CAS
- L. Bai, H. Wu, J. Ding, A. Ding, X. Zhang, N. Ren, G. Li and H. Liang, Cellulose nanocrystal-blended polyethersulfone membranes for enhanced removal of natural organic matter and alleviation of membrane fouling, Chem. Eng. J., 2020, 382, 122919 CrossRef CAS
- H. Wang, W. Wang, L. Wang, B. Zhao, Z. Zhang, X. Xia, H. Yang, Y. Xue and N. Chang, Enhancement of hydrophilicity and the resistance for irreversible fouling of polysulfone (PSF) membrane immobilized with graphene oxide (GO) through chloromethylated and quaternized reaction, Chem. Eng. J., 2018, 334, 2068–2078 CrossRef CAS
- X. Fang, J. Li, X. Li, X. Sun, J. Shen, W. Han and L. Wang, Polyethyleneimine, an effective additive for polyethersulfone ultrafiltration membrane with enhanced permeability and selectivity, J. Membr. Sci., 2015, 476, 216–223 CrossRef CAS
- S. Zinadini, A. A. L. Zinatizadeh, M. Rahimi and V. Vatanpour, Magnetic field-augmented coagulation bath during phase inversion for preparation of ZnFe2O4/SiO2/PES nanofiltration membrane: a novel method for flux enhancement and fouling resistance, J. Ind. Eng. Chem., 2017, 46, 9–18 CrossRef CAS
- P. G. Balkanloo, M. Mahmoudian and M. T. Hosseinzadeh, A comparative study between MMT–Fe3O4/PES, MMT-HBE/PES, and MMT-acid activated/PES mixed matrix membranes, Chem. Eng. J., 2020, 396, 125188 CrossRef
- J. He, T. S. Siah and J. P. Chen, Performance of an optimized Zr-based nanoparticle-embedded PSF blend hollow fiber membrane in treatment of fluoride contaminated water, Water Res., 2014, 56, 88–97 CrossRef CAS
- T. K. Das, T. S. Sakthivel, A. Jeyaranjan, S. Seal and A. N. Bezbaruah, Ultra-high arsenic adsorption by graphene oxide iron nanohybrid: removal mechanisms and potential applications, Chemosphere, 2020, 253, 126702 CrossRef CAS
- Y. Su, W. Yang, W. Sun, Q. Li and J. K. Shang, Synthesis of mesoporous cerium–zirconium binary oxide nanoadsorbents by a solvothermal process and their effective adsorption of phosphate from water, Chem. Eng. J., 2015, 268, 270–279 CrossRef CAS
- A. Bortun, M. Bortun, J. Pardini, S. A. Khainakov and J. R. García, Effect of competitive ions on the arsenic removal by mesoporous hydrous zirconium oxide from drinking water, Mater. Res. Bull., 2010, 45, 1628–1634 CrossRef CAS
- B. Jiang, X. Sun, L. Wang, S. Wang, R. Liu and S. Wang, Polyethersulfone membranes modified with D-tyrosine for biofouling mitigation: synergistic effect of surface hydrophilicity and anti-microbial properties, Chem. Eng. J., 2017, 311, 135–142 CrossRef CAS
- X. Lu, H. Wang, X. Liu, Z. Song, N. Jiang, F. Xie, Q. Zheng and D. Lin, Functional separators prepared via in situ growth of hollow CoSO4 hydrate arrays on pristine polypropylene membrane for high performance lithium–sulfur batteries, J. Alloys Compd., 2020, 838, 155618 CrossRef CAS
- J. Huang, K. Zhang, K. Wang, Z. Xie, B. Ladewig and H. Wang, Fabrication of polyethersulfone-mesoporous silica nanocomposite ultrafiltration membranes with antifouling properties, J. Membr. Sci., 2012, 423–424, 362–370 CrossRef CAS
- N. Nasrollahi, V. Vatanpour, S. Aber and N. M. Mahmoodi, Preparation and characterization of a novel polyethersulfone (PES) ultrafiltration membrane modified with a CuO/ZnO nanocomposite to
improve permeability and antifouling properties, Sep. Purif. Technol., 2018, 192, 369–382 CrossRef CAS
- Y. Zheng, S. Zou, K. G. N. Nanayakkara, T. Matsuura and J. P. Chen, Adsorptive removal of arsenic from aqueous solution by a PVDF/zirconia blend flat sheet membrane, J. Membr. Sci., 2011, 374, 1–11 CrossRef CAS
- M. Usman, M. Zarebanadkouki, M. Waseem, L. Katsoyiannis and M. Ernst, Mathematical modeling of arsenic(V) adsorption onto iron oxyhydroxides in an adsorption-submerged membrane hybrid system, J. Hazard. Mater., 2020, 1232221 Search PubMed
Footnotes |
| † Electronic supplementary information (ESI) available. See DOI: 10.1039/d0ra10330f |
| ‡ Co-first author. |
| This journal is © The Royal Society of Chemistry 2021 |