
 Open Access Article
 This Open Access Article is licensed under a Creative Commons Attribution-Non Commercial 3.0 Unported Licence
Dual-emission ratio fluorescence for selective and sensitive detection of ferric ions and ascorbic acid based on one-pot synthesis of glutathione protected gold nanoclusters†
Shuai Zhanga,
Cong Zhanga,
Xiaodong Shaob,
Rentian Guana,
Yingying Hua,
Keying Zhanga,
Wenjing Liua,
Min Hong a and
Qiaoli Yue*a
a and
Qiaoli Yue*a
aShandong Provincial Key Laboratory of Chrmical Energy Storage and Novel Cell Technology, School of Chemistry and Chemical Engineering, Liaocheng University, China. E-mail: yueqiaoli@yahoo.com
bNanobioengineering/Bioelectronics Laboratory, Department of Biomedical Engineering, Florida International University, Miami, FL 33174, USA. E-mail: licz@fiu.edu
First published on 11th May 2021
Abstract
A fluorometric method was proposed for the determination of Fe3+ and ascorbic acid (AA) based on blue and red dual fluorescence emissions of glutathione (GSH) stabilized-gold nanoclusters (AuNCs). AuNCs were synthesized from GSH and tetrachloroauric acid. The fluorescence peaks of AuNCs were at 425 nm and 585 nm, respectively. In the presence of Fe3+, the fluorescence peak at 425 nm can be enhanced and that at 585 nm can be quenched. There is a good linear relationship between the fluorescence intensity ratio for the 425 and 585 nm peaks (F425/F585) and the concentration of Fe3+ in the range of 0.75–125 μM. However, when AA was added to the AuNCs–Fe3+ system, the value of F425/F585 decreased consistently with the concentration of AA in the range of 0.25–35 μM. The limit of detection for Fe3+ and AA was 227 and 75.8 nM, respectively. The interaction between AuNCs and Fe3+ can induce the ligand–metal charge transfer (LMCT) effect leading to the fluorescence increment at 425 nm, while AA can reduce Fe3+ to Fe2+. The production of Fe2+ can not enhance or quench the fluorescence of AuNCs. By comparison with previous literature, the AuNCs prepared here show two fluorescence peaks without additional fluorescence labels. Furthermore, the method was successfully applied in the determination of Fe3+ and AA in some real samples, such as water, human serum and tablets.
Introduction
As important metal ions in the biological system, iron ions (Fe3+) play an important role in physiological and pathological processes such as cell metabolism, oxygen transport, enzyme catalysis, electron transfer and RNA synthesis.1,2 In general, iron deficiency leads to anemia, hypotension, and weakened immunity.3 In contrast, excessive intake of Fe3+ will lead to the production of highly reactive oxygen species, thus damaging nucleic acids, lipids and proteins in humans and animals.4 In addition, the cytotoxicity of Fe3+ may cause some diseases, such as Parkinson's disease and Alzheimer's disease.5 Therefore, the accurate determination of Fe3+ is of great significance in health and environmental monitoring.Ascorbic acid (vitamin C, AA) is an important micronutrient, antioxidant, and neurochemical. It plays a key role in various oxidative stress-related diseases such as Parkinson's disease, Alzheimer's disease, cardiovascular disease and some types of cancer.6–10 Studies have shown that AA can reduce oxidative stress generated by metal ions in neurons, thereby inhibiting neurodegeneration induced by mitochondrial autophagy.11 AA provides neuroprotection in brain injury/dysfunction, regulates nerve function, removes free radicals from cells, and ACTS as an anti-scurvy agent.6,12,13 Therefore, a rapid, sensitive and selective detection of AA in biological fluids is still an active topic in biosensor research and in various fields such as cell biology, drug screening and medical diagnosis.9
The traditional metal ion detection methods include atomic absorption spectrometry, inductively coupled plasma atomic emission spectrometry, voltammetry, extraction spectrophotometry, resonance light scattering spectrometry, etc.14–16 The detection methods for AA include chromatography, capillary electrophoresis, colorimetry, electrochemical methods, etc.6–9 Due to its high sensitivity and easy operation, fluorescence spectrometry is becoming increasingly important in quantitative analysis. Some nanomaterials and organic molecules can be used as fluorescent probes to detect Fe3+ and AA.17–22 However, these probes are usually difficult to prepare.
As a new type of luminescent nanomaterials, metal nanoclusters have attracted much attention in recent years in the fields of chemistry, biology, materials science and so on. Fluorescent AuNCs are widely used in sensing, biomarkers and bioimaging due to their small size, ease of preparation, good biocompatibility and high fluorescence. In particular, AuNCs with GSH as a template have the advantages of high fluorescence intensity and obvious emission peak, and the emission peak is basically after 550 nm. In this case, the corresponding fluorescent substance can be added to AuNCs system as a marker to form a dual-emission system.23–26 These fluorescent materials usually include metal organic framework compounds (MOFs), carbon dots (CDs) and some fluorescent organic compounds, which usually show blue emission. The composite materials form a “blue-red” double emissions system, and the ratio-type AuNCs probes can be developed.
In this work, we synthesized a new type of red fluorescence AuNCs with GSH as template and stabilizer. AuNCs showed double fluorescence peaks without the addition of fluorescence markers, which is different from the above methods. Thus the influence of some species can be effectively eliminated, for example, the common Hg2+ quenching effect on the fluorescence of AuNCs. Furthermore, the AuNCs were used for the detection of Fe3+ and AA with high sensitivity and selectivity.
Experimental section
Materials and reagents
GSH, AA and HAuCl4·3H2O were ordered from Shanghai Perfemiker Material Tech Co., Ltd (Shanghai, China, http://www.canspecsci.com). Amino acids and other organic species were obtained from Beijing Solarbio Science & Technology Co., Ltd (Beijing, China, http://www.solarbio.com). There were L-cysteine (Cys), glutamic acid (Glu), proline (Pro), methionine (Met), L-aspartic acid (Asp), glycine (Gly) and melamine (Mel), and o-phenanthroline, o-phenylenediamine, urea, and uric acid (UA). Acid, base and some common salts were purchased from Aladdin Reagent Co., Ltd (Shanghai, China). They included HCl, HAc, NaOH, NaCl, quinine sulphate, NaH2PO4, Na2HPO4, NaAc, and FeNO3, FeSO4, CuCl2, HgCl2, Zn(CH3COO)2, Mn(NO3)2, Pb(NO3)2, MgCl2, CoCl2, BaCl2, CrCl3, NaCl, NiSO4·6H2O, CdCl2, and CaCl2. All chemicals from commercial sources were of analytical grade and used directly without further purification if no special instructions. All solutions were prepared and diluted by ultrapure water from Milli-Q water purified system.Instruments
Fluorescence spectra were obtained on an F-7000 spectrophotometer (Hitachi, Japan). Absorption spectral measurements were carried out on a UV-2550 ultraviolet spectrophotometer (Shimadzu, Japan). Transmission electron microscope (TEM) data were performed on a JEM 2100 electron microscope (JEOL Ltd, Japan). TEM worked with an acceleration voltage at 200 kV, and a carbon-coated copper grid was used for sample suspension. Fourier Transform infrared (FT-IR) spectra were carried out on a Nicolet 6700 FT-IR spectrophotometer (Thermo Scientific Ltd, USA). X-ray photoelectron spectroscopy (XPS) measurements were undertaken with a K-Alpha spectrometer (Thermo Scientific Ltd, USA). Digital photos of AuNCs solution under UV lamp illumination were captured by a Coolpix 4500 digital camera.Preparation of AuNCs
AuNCs were prepared using a hydrothermal method by referencing to previous method with some changes.27 GSH was employed for the reduction and stabilization of AuNCs. Before use, all glasswares were washed carefully with Aqua Regia. 10 mL HAuCl4 (20 mM) was diluted with 87 mL deionized water, at room temperature. 3 mL GSH solution (100 mM) was added to the HAuCl4 solution under moderate magnetic stirring. The mixture of GSH and HAuCl4 was heated gradually to 80 °C with continuous stirring for 15 hours. It indicated the formation of AuNCs with red fluorescence when the transparent solution gradually changed to golden yellow solution. After cooling to room temperature, the AuNCs products were obtained and stored at 4 °C before use.Determination of Fe3+ and AA
Determination of Fe3+ or AA was performed in aqueous solution at room temperature. Firstly, standard stock solutions with different concentrations were prepared by dissolving Fe3+ or AA in deionized water. Then 0.5 mL AuNCs was added to 1.5 mL microcentrifuge tube and diluted to 1 mL. Then Fe3+ solutions with different concentrations were added and mixed in a vortex mixer for 10 min. The fluorescence spectra of AuNCs for the obtained solutions (Ex 390 nm) were recorded in the presence and absence of Fe3+, respectively. Subsequently, AA was detected in aqueous solution at room temperature. A series of AA solutions were added and mixed with AuNCs–Fe3+ solution in a vortex mixer for 10 min. The fluorescence spectra of AuNCs–Fe3+ (Ex 390 nm) were recorded with and without AA, respectively.Pretreatment of real samples
Tap water samples were collected from the laboratory of Department of Chemistry at Liaocheng University. Lake water samples were obtained from the artificial lake inside the campus of Liaocheng University. After all water samples were settled overnight, the supernatant was diluted with ultra-pure water. The fetal bovine serum samples were diluted directly with ultra-pure water, and the standard solutions of Fe3+ with different concentrations were spiked. VC tablets were grounded into fine powder, and dissolved in ultra-pure water. The supernatant was diluted with ultra-pure water. In order to verify the accuracy of the method, Fe3+ and AA in the same samples were simultaneously determined by the national standard methods.28Results and discussion
Design strategy
The assay strategy for the determination of Fe3+ and AA was shown in Scheme 1. Firstly, AuNCs with blue and red fluorescence emissions were synthesized with GSH, which was for the reduction and stabilization of AuNCs. Under excitation of 390 nm, AuNCs showed two fluorescence peaks at 425 and 585 nm, respectively. The fluorescence intensity at 585 nm can be quenched by Fe3+, while that of 425 nm can be enhanced simultaneously. Furthermore, the fluorescence ratio at 425 and 585 nm (F425/F585) increased gradually with the concentration of Fe3+ increase. Thus, the fluorescence of AuNCs can be used to determine Fe3+. When AA was added to the AuNCs–Fe3+ system, however, the fluorescence of AuNCs was recovered gradually. And then the AuNCs–Fe3+ system can be employed for the determination of AA.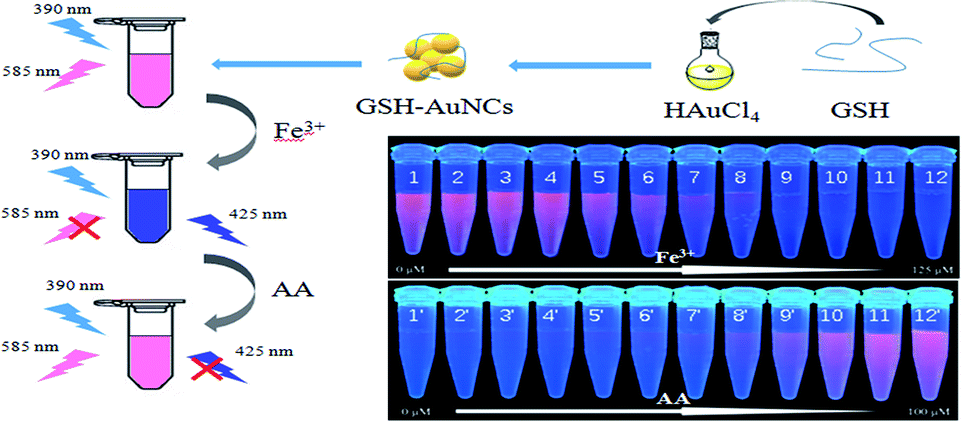 | ||
| Scheme 1 Schematic illustration for synthesis of AuNCs and their application in the determination of Fe3+ and AA. | ||
Characterization of GSH–AuNCs with and without analytes
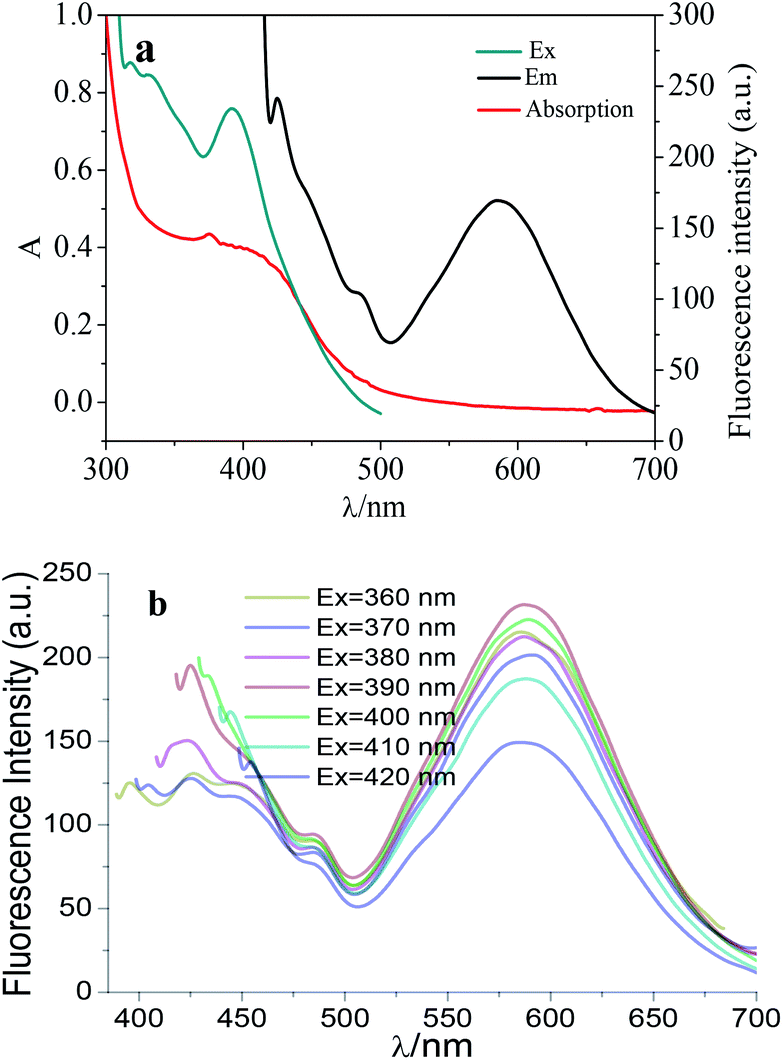 | ||
| Fig. 1 The absorption and fluorescence spectra of AuNCs (a) and the effect of excitation wavelength on the emission spectrum of AuNCs (b). The emission and excitation wavelength were fixed at 585 nm (a) and 390 nm (b), respectively. | ||
It can be clearly observed that there are double emission peaks at 425 nm and 585 nm in the fluorescence spectra of AuNCs, respectively (Fig. S1, in ESI†). In the presence of Fe3+, the fluorescence intensity at 585 nm is quenched, and that of 425 nm is enhanced. When AA was added to the system of AuNCs–Fe3+, the fluorescence for AuNCs was recovered at 585 and 425 nm. Moreover, the fluorescence change of AuNCs induced by AA can be ignored completely. It can be deduced that the fluorescence recovery for AuNCs induced by AA can be ascribed to the interaction between Fe3+ and AA.
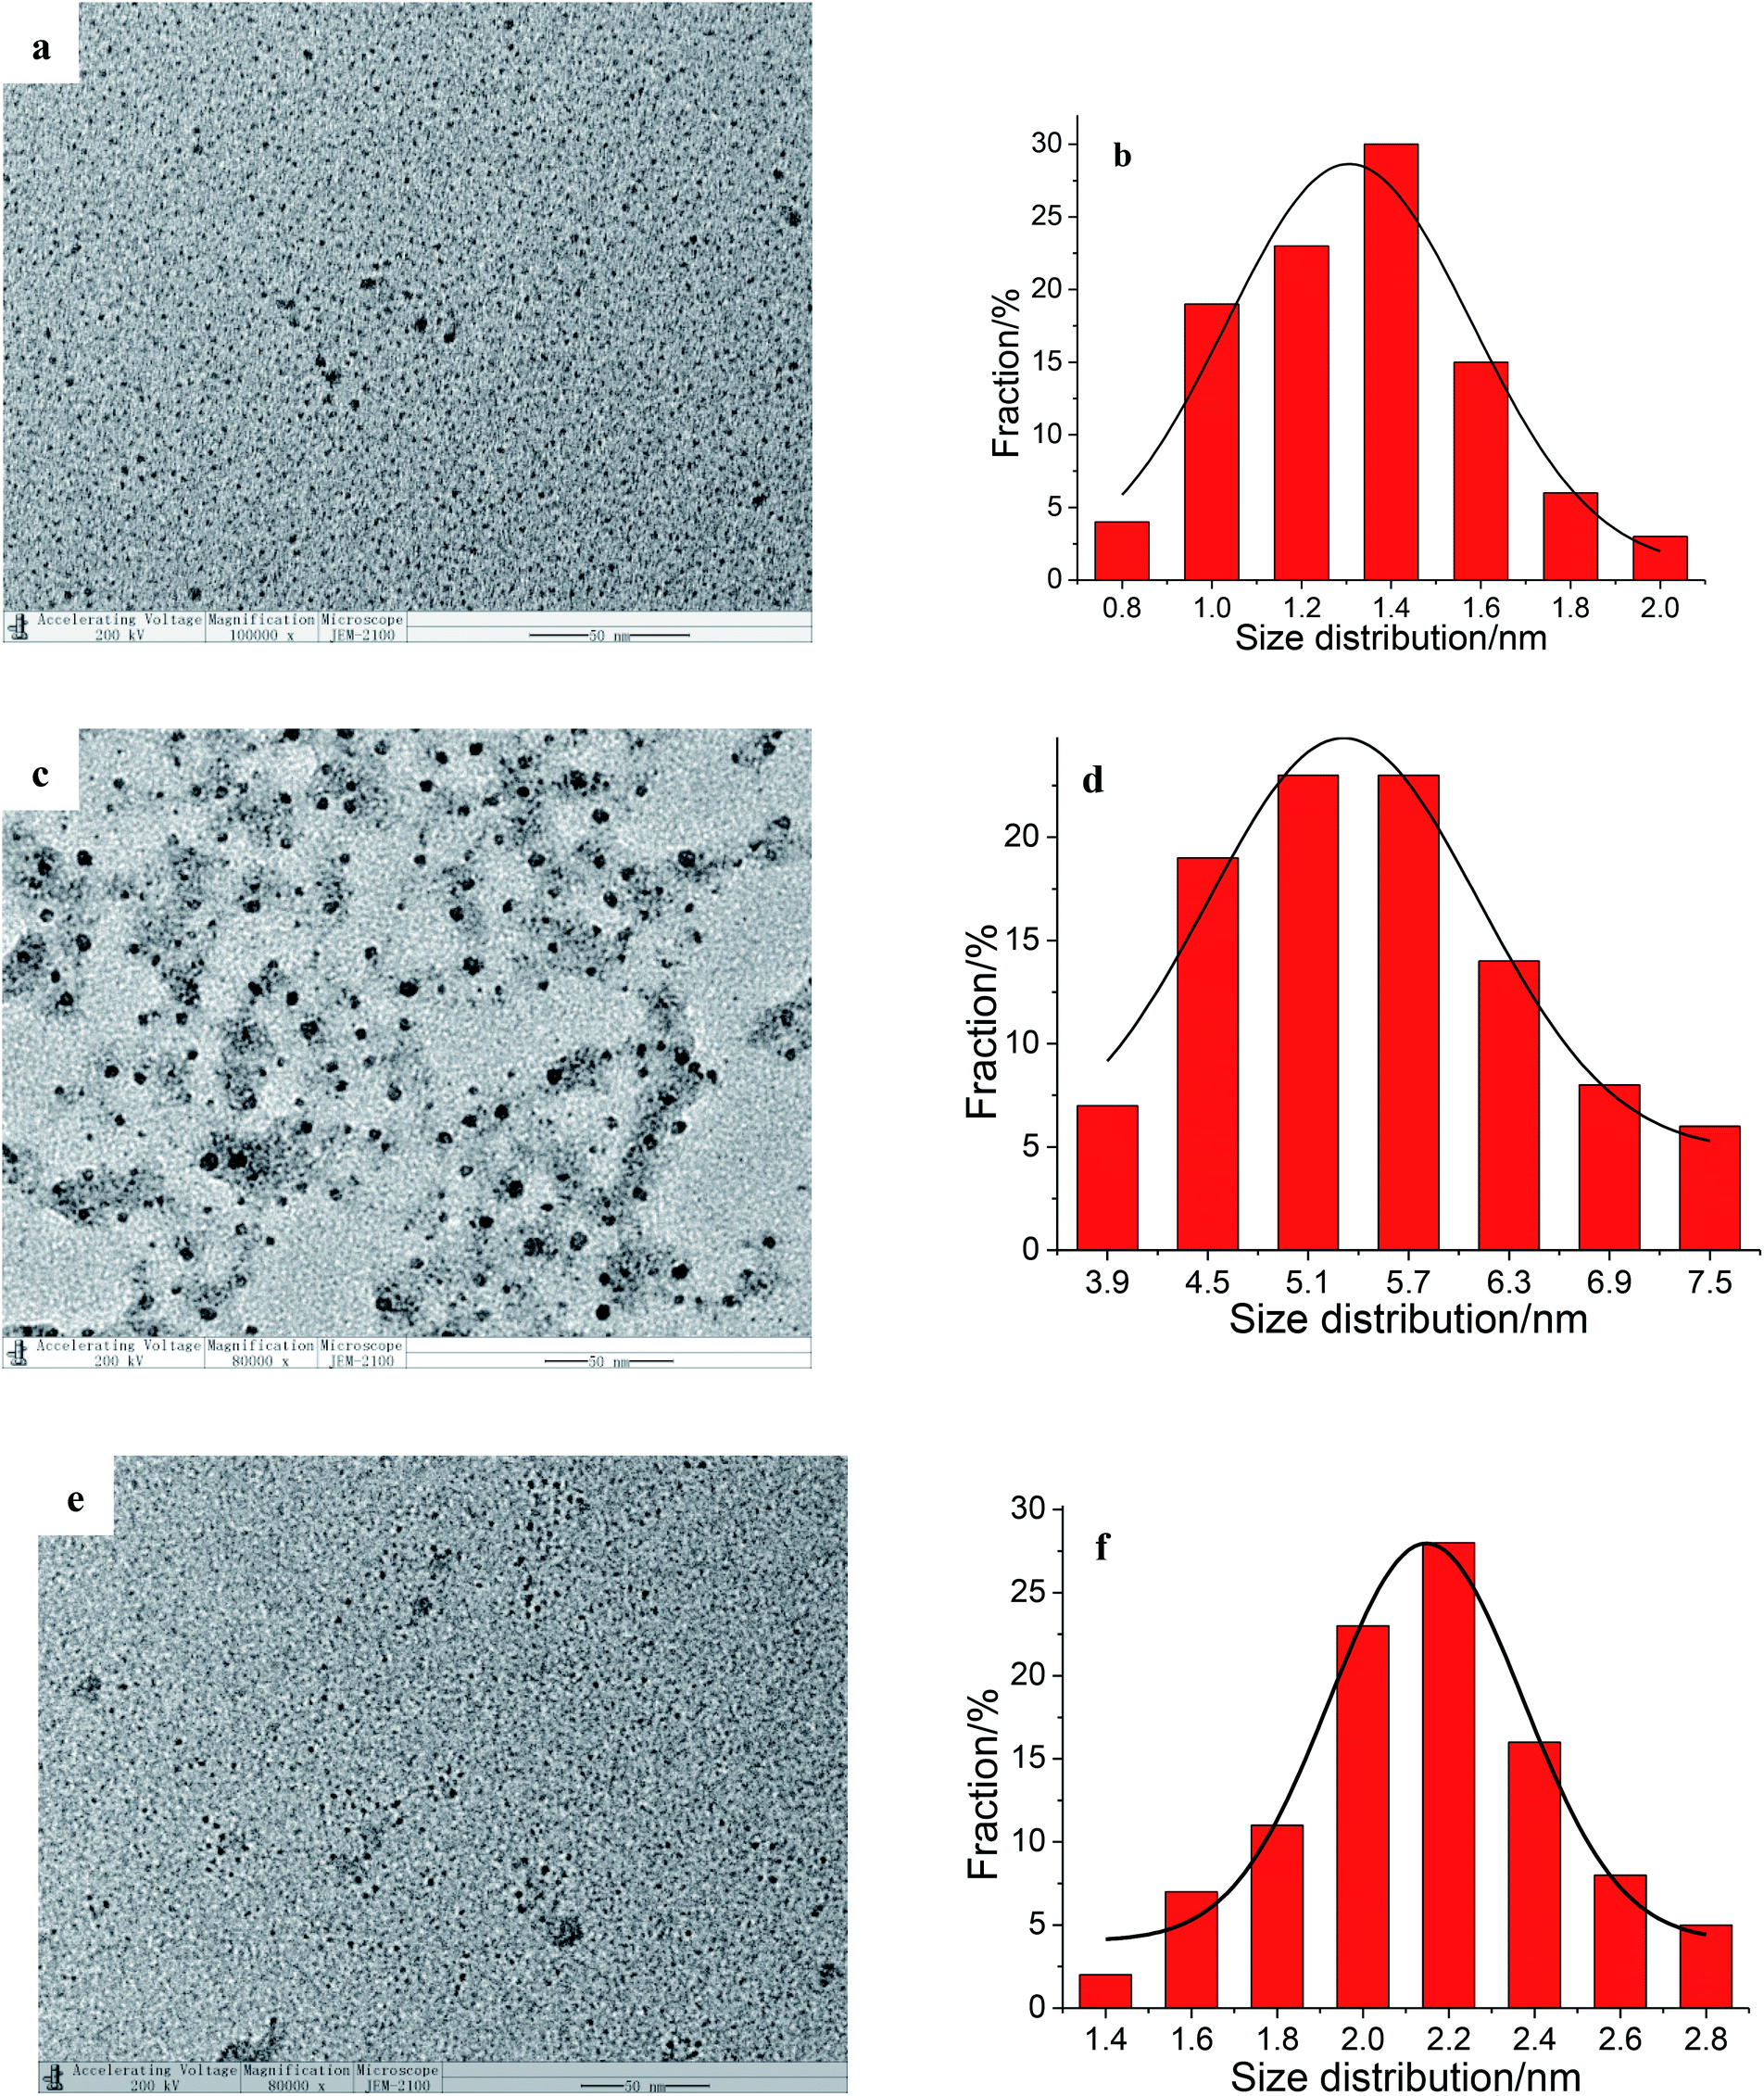 | ||
| Fig. 2 TEM images of AuNCs (a), AuNCs + Fe3+ (c), and AuNCs + Fe3+ + AA (e) and the corresponding size distribution of them (b), (d) and (f), respectively. Concentration: AuNCs 0.1 mg mL−1, Fe3+ 0.1 mM, and AA 0.1 mM. | ||
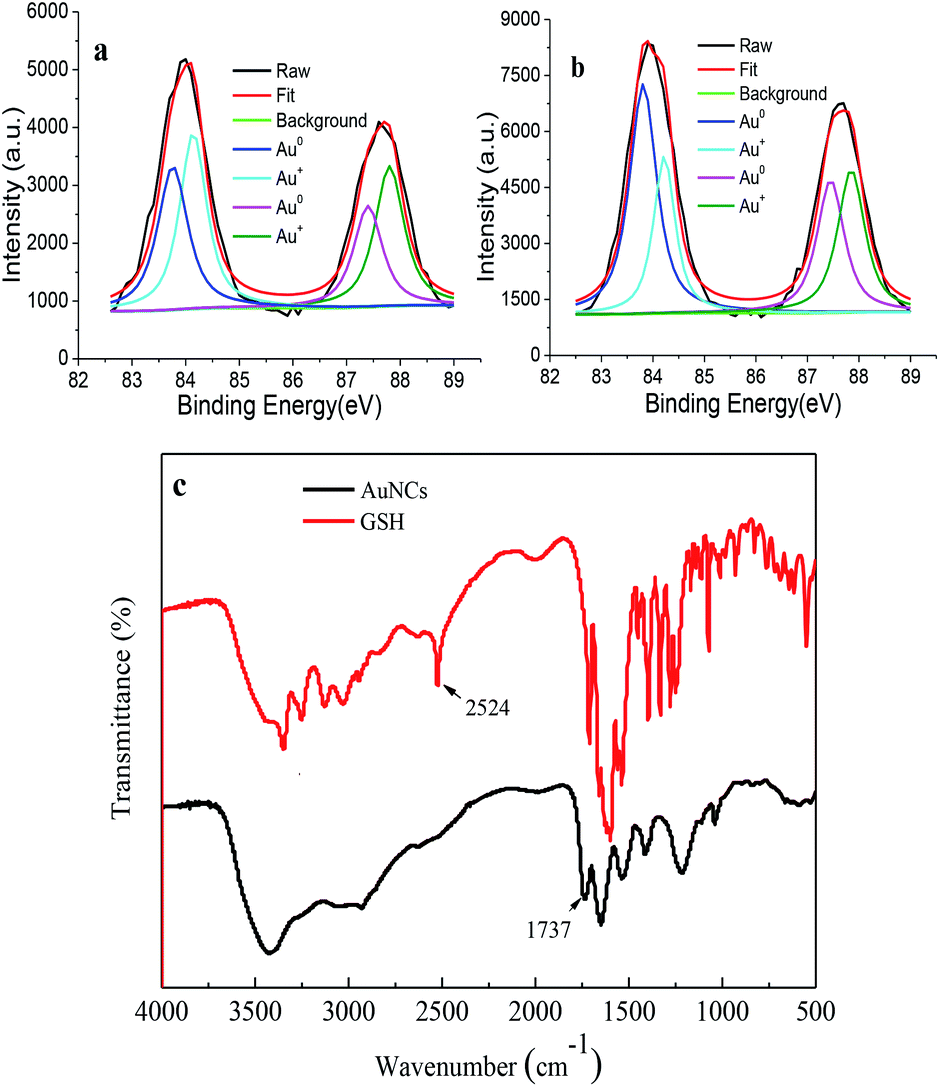 | ||
| Fig. 3 HR-XPS of Au in the systems of AuNCs (a) and AuNCs + Fe3+ (b), and FT-IR spectra of AuNCs and GSH (c). Concentration: AuNCs 0.1 mg mL−1, Fe3+ 0.1 mM. | ||
Optimization of conditions
To achieve the optimum detection performance, the conditions for synthesis of AuNCs and determination of Fe3+ and AA were studied including reaction time, reaction temperature, buffer species, pH, and ion strength.Effect of synthesis conditions
As illustrated in Scheme 1, AuNCs were prepared by a one pot process using HAuCl4 and GSH as precursors with a molar ratio of 2![[thin space (1/6-em)]](https://www.rsc.org/images/entities/char_2009.gif) :3. The synthesis conditions were investigated by comparing the optical properties of AuNCs, such as the molar ratio of precursors, reaction temperature and hydrothermal time, as shown in Fig. S2 (in ESI†). Fig. S2a (in ESI†) shows a fluorescence intensity change with the molar ratio of HAuCl4 to GSH from 2:1 to 2:7, with the fluorescence intensity reaching its peak at 2:3. As shown in Fig. S2b (in ESI†), as the reaction temperature rises from 40 °C to 80 °C, the fluorescence intensity of AuNCs increases, while it decreases in the range of 80–100 °C. Finally, we study the effect of reaction time on the fluorescence intensity of AuNCs. From 4th hour, the fluorescence intensity is measured every 2 hours. When the intensity varies from 4 to 24 hours, the heating time of the hydrothermal reaction shows a maximum of 16 hours (Fig. S2c, in ESI†). Therefore, AuNCs were prepared from HAuCl4 and GSH with a series of optimum synthesis conditions including a molar ratio of 2:3 (HAuCl4:GSH), heating at 80 °C for 16 hours.
:3. The synthesis conditions were investigated by comparing the optical properties of AuNCs, such as the molar ratio of precursors, reaction temperature and hydrothermal time, as shown in Fig. S2 (in ESI†). Fig. S2a (in ESI†) shows a fluorescence intensity change with the molar ratio of HAuCl4 to GSH from 2:1 to 2:7, with the fluorescence intensity reaching its peak at 2:3. As shown in Fig. S2b (in ESI†), as the reaction temperature rises from 40 °C to 80 °C, the fluorescence intensity of AuNCs increases, while it decreases in the range of 80–100 °C. Finally, we study the effect of reaction time on the fluorescence intensity of AuNCs. From 4th hour, the fluorescence intensity is measured every 2 hours. When the intensity varies from 4 to 24 hours, the heating time of the hydrothermal reaction shows a maximum of 16 hours (Fig. S2c, in ESI†). Therefore, AuNCs were prepared from HAuCl4 and GSH with a series of optimum synthesis conditions including a molar ratio of 2:3 (HAuCl4:GSH), heating at 80 °C for 16 hours.
Effect of analysis conditions
The effects of pH and ionic strength were optimized. Fig. S3a (in ESI†) shows that the fluorescence intensity ratios of AuNCs and AuNCs–Fe3+ are not significantly changed in the pH range of 2–12. The results show that AuNCs and AuNCs–Fe3+ show good stability in a wide pH range. For the detection of AA, it can be observed that in the solution with pH varying from 4 to 11, the fluorescence intensity ratios are relatively stable. Therefore, considering the efficiency and stability of the experiment, ultrapure water with pH 6.0 was used for the determination.Salt tolerance is one of the most common challenges when conducting nanosensing systems on complex samples. NaCl was employed to regulate the ionic strength, and the effect of NaCl concentration on the fluorescence intensity of AuNCs was investigated. As shown in Fig. S3b (in ESI†), the fluorescence intensity of AuNCs does not change obviously in the concentration range of 0–0.5 M NaCl. It can be concluded that the fluorescence intensity of AuNCs does not change obviously in a wide ionic strength range.
Sensitivity
Fluorescence titrations are conducted to evaluate the sensitivity of AuNCs for Fe3+ and AA under optimum conditions. AuNCs are prepared with the molar ratio of HAuCl4:GSH at 2:3, heating at 80 °C for 16 hours and ultrapure water as media with pH 6.0. In the presence of Fe3+ (0.75, 1.5, 10, 15, 25, 40, 50, 65, 80, 100, 110, and 125 μM), the fluorescence intensity of AuNCs at 585 nm was quenched regularly as shown in Fig. 4a, while the fluorescence intensity at 425 nm increased. Fig. 4b depicts a good linear relationship between the ratio of the fluorescence intensity of the two emission peaks (F425 nm/F585 nm, simplified as F1/F2) and the concentration of Fe3+ ranges from 0.75 μM to 125 μM (with a linear correlation coefficient, r2 = 0.9998). The limit of detection (LOD) is 227 nM using 3.29SB/m, rooting in the criterion of the IUPAC recommendation. In this equation, SB is the standard deviation of the blank (n = 5) and m is the slope of the linear calibration curve, respectively. At the same time, the fluorescence quenching of AuNCs with the increase of Fe3+ concentration can be observed in the UV light (365 nm) (Fig. 4e).
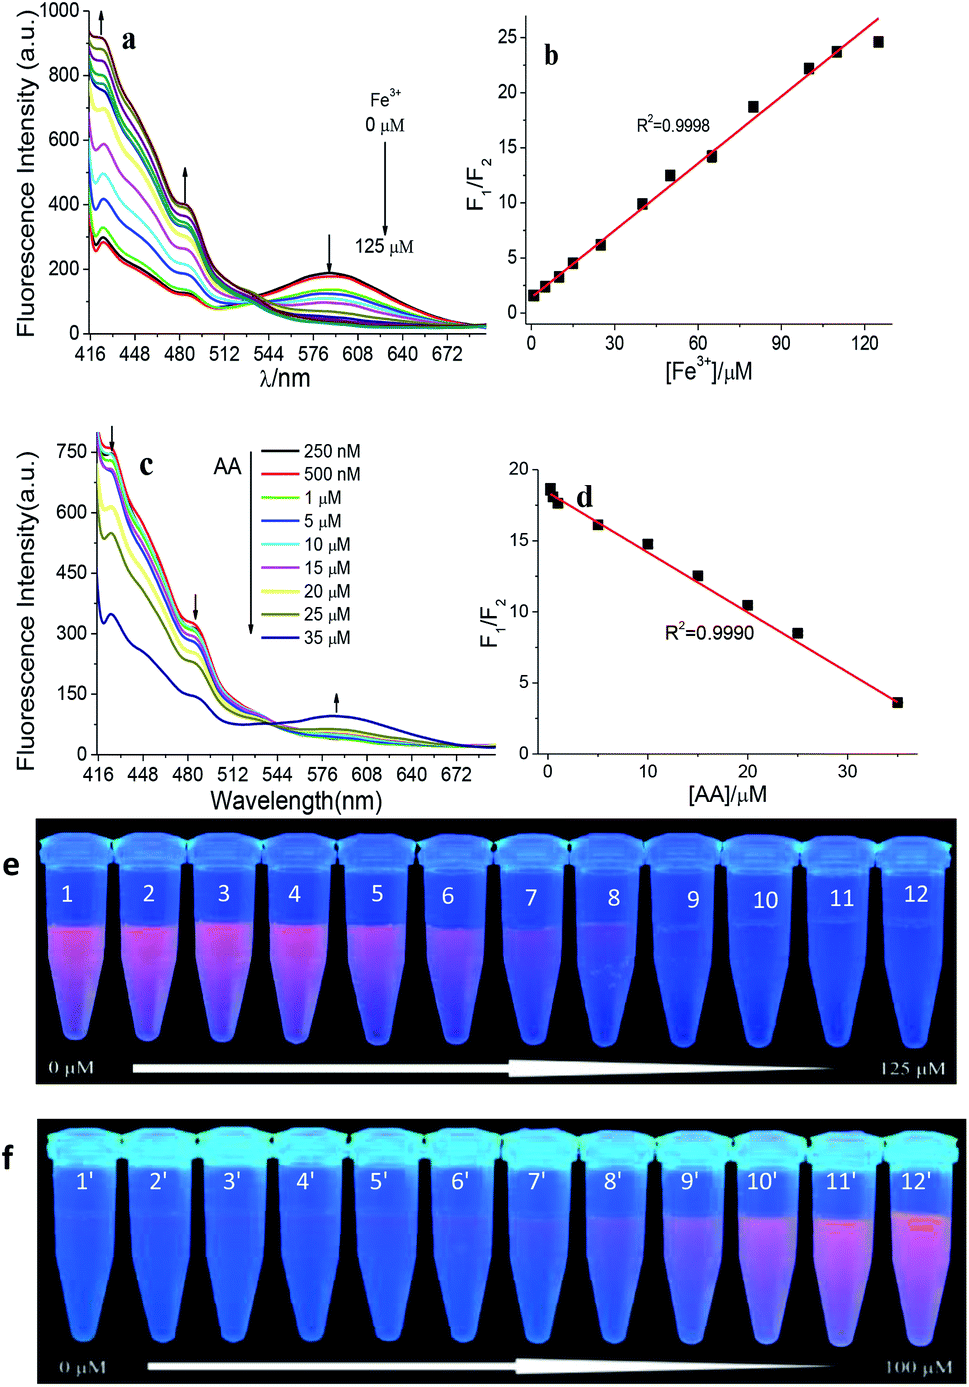 | ||
| Fig. 4 Fluorescence spectra of AuNCs with and without Fe3+ (a) and corresponding linear response of fluorescence ratio to concentration of Fe3+ (b), the fluorescence spectra of AuNCs + Fe3+ with and without AA (c) and corresponding linear response of fluorescence ratio to concentration of AA (0.25, 0.5, 1,5, 10, 15, 20, 25, and 35 mM) (d), the fluorescence quenching of AuNCs with the increase of Fe3+ concentration can be observed in the UV light (365 nm) (e), and the fluorescence increasing of AuNCs with the increase of Fe3+ concentration can be observed in the UV light (365 nm) (f). Conditions: AuNCs, 0.1 mg mL−1, pH 6.0, and 25 °C. | ||
Fig. 4c exhibits that the fluorescence peaks of AuNCs at 585 nm and 425 nm are recovered gradually, after the addition of AA with different concentrations (0.25, 0.5, 1, 5, 10, 15, 20, 25, and 35 μM) into AuNCs–Fe3+ system. There is a good linear relationship between F1/F2 and the concentration of AA in the range of 0.25–30 μM (r2 = 0.9990) (Fig. 4d). The LOD is 75.8 nM with the calculation from 3.29SB/m. Then the AuNCs–Fe3+ system was established to detect AA sensitively. In addition, the fluorescence recovery of AuNCs ascribed from AA can also be observed from the digital photos under the 365 nm UV lamp with increase of AA concentration (Fig. 4f).
Specificity and reusability
Firstly, the selectivity of Fe3+ detection was investigated. A series of AuNCs samples were prepared by adding 100 μM Fe3+ or 1 mM other metal ion species. When Fe3+ was added to AuNCs, a drastic change of F1/F2 can be obtained in Fig. 5a. There are slight change of F1/F2 for other metal ions including Cu2+, Hg2+, Zn2+, Ca2+, Mg2+, Pb2+, Cr3+, Co2+, Ba2+, Cd2+, Ni2+, and Mn2+, even at 10 times higher concentration than that of Fe3+. Furthermore, the specificity for the determination of Fe3+ was also studied with the coexistence of Fe3+ and all other metal ions. The F1/F2 value of AuNCs–Fe3+ is almost as same as that of AuNCs–Fe3+ with other metal ions (Fig. 5b). Therefore, AuNCs can be used as a fluorescence probe for the determination of Fe3+ with high specificity.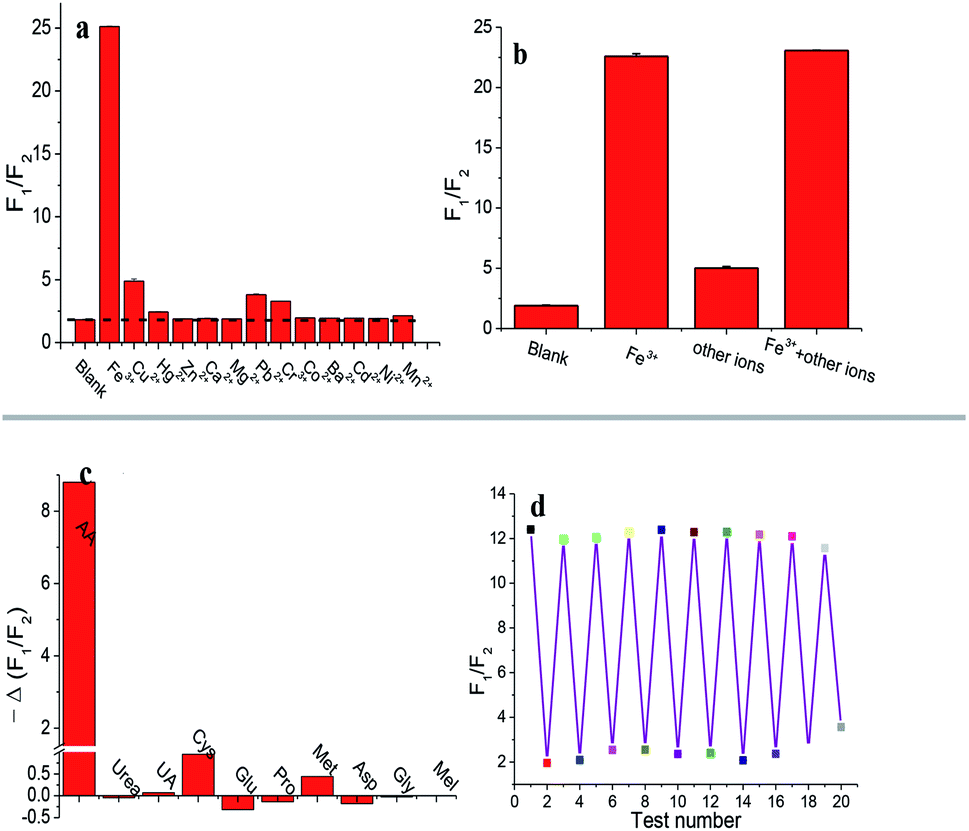 | ||
| Fig. 5 Effect of metal ions (a) and comparison of metal ions mixture and Fe3+ (b) on the fluorescence ratio of AuNCs, effect of several common biomolecules on the fluorescence ratio of AuNCs–Fe3+ (c), and cycle times of the AuNCs fluorescence system for Fe3+ and AA (d). | ||
The specificity of AA detection was also tested for AuNCs–Fe3+ system. Several common biomolecules as common distractors in biological samples were investigated, including urea, UA, Cys, Glu, Pro, Met, Asp, Gly and Mel. Fig. 5c depicts the fluorescence recovery of AuNCs–Fe3+ system in various common biomolecules, indicating that the sensing system has a high selectivity for AA determination. The present method was compared with other reports for Fe3+ and AA assays listed in Table 1. By comparison, the present method has a wider linear range and a lower detection limit.
| Nanomaterials | Fe3+ | AA | Ref. | ||
|---|---|---|---|---|---|
| Lineral range (μM) | LOD (μM) | Lineral range (μM) | LOD (μM) | ||
| G-CDs | 0.05–10 | 13.7 | 0.2–11 | 0.082 | 17 |
| CNCs | 20–100 | 3.96 | 2–12 | 0.972 | 18 |
| BNQDs | 1–130 | 0.143 | 1–100 | 83.3 | 19 |
| CDs | 0–0.38 | 0.37 | 0–0.78 | 0.079 | 20 |
| C dots | 0–50 | 0.12 | 0–23 | 0.32 | 21 |
| N,S-CDs | 0–10 | 0.0366 | 0–30 | 0.1025 | 22 |
| AuNCs | 0.75–125 | 0.227 | 0.25–35 | 0.0758 | This work |
Finally, the reusability of AuNCs was carried out for Fe3+ and AA determination, since Fe3+ can quench and AA can recover the fluorescence of AuNCs, respectively. The value of F1/F2 for AuNCs can increase with the addition of Fe3+, while decrease in the presence of AA. As Fig. 5d showed, the value of F1/F2 for AuNCs–Fe3+ slides down in the presence of AA and goes up with the addition of Fe3+. The change of F1/F2 value is basically stable for AuNCs–Fe3+ and AuNCs–Fe3+–AA with the test number no more than 17. Thus, the AuNCs fluorescence system can be reused for 8 cycle times.
Analysis of real samples
To confirm the practical application of the method, a series of water and drug samples were prepared for the determination of Fe3+ and AA. In addition, fetal bovine serum was used as the second true Matrix, so the feasibility of using AuNCs as fluorescence probe to determine Fe3+ in water samples and serum was evaluated. After the sample is pretreated as described in the experiment section, the concentration of Fe3+ was investigated by this method and the National Standard o-phenanthroline method,31 respectively. It can be seen from Table 2 that the recovery of Fe3+ in three samples is varying from 90.7% to 106.0%. At the same time, t-test results are listed by comparison with the results obtained from the two methods. There was no significant difference between the optimal value and the experimental data with the confidence level of 0.95. These results confirm the potential of the sensing system for quantitative analysis of Fe3+ in environmental and biological samples. Then, in order to test the practicability of AuNCs–Fe3+ system, it was applied to the determination of AA in tablets. For this purpose, the VC tablets samples were prepared according to the previous work.32 AA was determined by this method and o-phenylenediamine method.33 The results are shown in Table 2. The t-test shows that there is no essential difference between the results of our method and those of the national standard method at the confidence level of 0.95. It is considered that the system is feasible for the determination of AA in complex samples.| Sample | Present method | Reference method | t-test | |||
|---|---|---|---|---|---|---|
| Added (μM) | Found (μM) | Recovery (%) | RSDb (%) | |||
| a The results were from three separated measurements.b RSD, relative standard deviation.c Samples for Fe3+ detection.d Samples for AA detection. | ||||||
| Tap waterc | 0.0 | 1.4 | — | 4.07 | 1.1 ± 0.00 | 0.01 |
| 25.0 | 26.8 | 101.5 | 4.53 | 25.5 ± 0.18 | 0.20 | |
| 50.0 | 51.2 | 99.7 | 2.07 | 56.0 ± 0.31 | 0.01 | |
| Lake waterc | 0.0 | 0.9 | — | 4.36 | 0.5 ± 0.00 | 0.00 |
| 25.0 | 26.4 | 102.4 | 2.33 | 30.0 ± 0.48 | 0.00 | |
| 50.0 | 48.9 | 96.1 | 3.95 | 56.7 ± 0.36 | 0.02 | |
| Serumc | 0.0 | 0.9 | — | 4.38 | 0.9 ± 0.18 | 0.72 |
| 25.0 | 27.4 | 106.0 | 1.14 | 27.5 ± 0.00 | 0.66 | |
| 50.0 | 46.2 | 90.7 | 0.53 | 49.7 ± 0.00 | 0.00 | |
| Drugd | 0.0 | 6.0 | — | 4.49 | 5.6 ± 0.07 | 0.11 |
| 10.0 | 15.2 | 92.28 | 4.56 | 15.7 ± 0.20 | 0.38 | |
| 20.0 | 24.7 | 93.34 | 1.58 | 24.7 ± 0.09 | 1.00 | |
Possible mechanism for detection of Fe3+ and AA
As can be seen clearly from Fig. 4a, with the increase of Fe3+ concentration, the fluorescence intensity of AuNCs decreases gradually at 585 nm and increases sharply at 425 nm. Gradually at 585 nm and increases sharply at 425 nm.Due to the surface ligand, the surface motif optimization and reconstruction, the Au(I)–thiolate motif reconstruction determines the dual-emission characteristics of GSH–AuNCs.34 Their emission properties show strong dependence on the particle size, the amount of surface Au+ (ref. 35) and the surface ligands.35,36 The blue emission at 425 nm is the ligand–metal charge transfer (LMCT) effect from the Au(I)–carboxyl group (the oxygen atom in the carboxylate ligands to the Au(I)) to the Au(0) core and subsequent radiative relaxation.35 The photoluminescence peak at 585 nm is the LMCT from the surface of Au(I)–GSH motif to the Au(0) core. The combination of Fe3+ and the carboxyl group has little effect on the charge transfer from the Au(I)–carboxyl group to the Au(0) core. Fe3+ crosslinks the nanoclusters, and enhances the rigidity of the Au(I)–carboxyl group motif, thus enhances the fluorescence intensity at 425 nm. After the addition of Fe3+, AuNCs has a strong aggregation in the TEM image (Fig. 2). The aggregation of AuNCs is owing to the strong coordination of Fe3+ with Au(I)–GSH. Since Fe3+ has an electron-withdrawing capacity, the interaction between Fe3+ and the surface of Au(I)–GSH motif can reduce the charge transfer effect from the Au(I)–GSH motif to the Au(0) core. And thus the fluorescence intensity at 585 nm decreases.
To prove the redox reaction between Fe3+ and AA, a series of experiments including spectrophotometry and cyclic voltammetry measurements were carried out (Fig. S1 in ESI†). The fluorescence spectra (Fig. S1a in ESI†) illustrates distinctly that Fe3+ quenches the red emission of AuNCs and AA recoveries the AuNCs–Fe3+ fluorescence, respectively. Undoubtedly, Fe3+ and AA don't have fluorescence signal at the AuNCs emission band. Furthermore, the fluorescence change of AuNCs can be strongly ignored induced by AA. So, Fe3+ can only reacted with AA. From absorption spectra (Fig. S1b in ESI†), it can be distinctly observed that the absorption peak is at 268 and 286 nm for AA and Fe3+, respectively, while there is no obvious absorption peak for Fe3+–AA in the range of 220–600 nm. The reaction of Fe3+ and AA can be demonstrated. Fig. S1c (in ESI†) depicts the anodic oxidation peak for AA disappears in the Fe3+–AA system, and the redox reaction is irreversible for Fe3+ and AA and in the presence of AuNCs.
Conclusions
In summary, a simple approach was proposed to prepare dual-emission AuNCs with GSH as stabilizing reagent. AuNCs show bright pink emission with two fluorescence peaks at 425 and 585 nm, respectively. Fe3+ can quench the fluorescence of AuNCs at 585 nm, while Fe3+ can enhance that at 425 nm. Therefore, a ratiometric fluorescence system is constructed for the determination of Fe3+. In the presence of AA, however, the fluorescence of AuNCs can be recovered due to the interaction between AA and Fe3+. The redox reaction of AA and Fe3+ can weaken the effect of Fe3+ on the surface of AuNCs. And then the AuNCs–Fe3+ system is employed for the detection of AA. Comparing with previous works for Fe3+ and AA assays, the approach exhibits lower LOD. Furthermore, the proposed AuNCs system was successfully used to determine Fe3+ and AA in lake water, human serum, and drug samples. It holds a potential application in the fields related to environmental, biological and pharmaceutical studies.Conflicts of interest
There are no conflicts to declare.Acknowledgements
This work was supported financially by the Natural Science Foundation of China (91543206), the Natural Science Foundation (ZR2014BQ017, ZR2015BM024, and 2013SJGZ07) and research foundation of Liaocheng University.Notes and references
- L. R. Lynch, Nutr. Rev., 1997, 55, 102–110 CrossRef PubMed.
- C. D. Ankan and R. A. Doong, ACS Appl. Mater. Interfaces, 2016, 8, 21002–21010 CrossRef PubMed.
- J. D. Haas and T. Brownlie, J. Nutr., 2001, 131, 676S–688S CrossRef CAS PubMed.
- M. Zheng, H. Q. Tan, Z. G. Xie, L. G. Zhang, X. B. Jing and Z. C. Sun, ACS Appl. Mater. Interfaces, 2013, 5, 1078–1083 CrossRef CAS PubMed.
- X. Y. Mu, L. Qi, J. Qiao and H. M. Ma, Anal. Methods, 2014, 6, 6445–6451 RSC.
- D. Wang, C. Chen, X. B. Ke, N. Kang, Y. Q. Shen, Y. L. Liu, H. J. Wang, C. Q. Chen and R. Li, ACS Appl. Mater. Interfaces, 2015, 7, 3030–3040 CrossRef CAS PubMed.
- K. Etsu, N. Yuko and K. Shosuke, Anal. Chem., 1992, 64, 1505–1507 CrossRef.
- Y. Y. Peng, Y. W. Zhang and J. N. Ye, J. Agric. Food Chem., 2008, 56, 1838–1844 CrossRef CAS PubMed.
- H. J. Cheng, X. Y. Wang and H. Wei, Anal. Chem., 2015, 87, 8889–8895 CrossRef CAS PubMed.
- X. H. Zhu, T. B. Zhao, Z. Nie, Y. Liu and S. Z. Yao, Anal. Chem., 2015, 87, 8524–8530 CrossRef CAS PubMed.
- P. Imagard, P. P. Carolina, C. Eduardo, C. Pablo, L. Susan and S. A. Juan, J. Biol. Chem., 2009, 284, 13306–13315 CrossRef PubMed.
- M. E. Rice, Trends Neurosci., 2000, 23, 209–216 CrossRef CAS PubMed.
- Y. Oscar, C. Julie, D. M. Wong, G. J. Patti, S. R. Antonion, H. B. Paul, S. A. Trauger, C. Desponts, S. Ding and G. Siuzdak, Nat. Chem. Biol., 2010, 6, 411–417 CrossRef PubMed.
- P. Nahid and H. Reza, Anal. Chim. Acta, 2005, 549, 124–128 CrossRef.
- H. C. Chang, Y. F. Chang, N. C. Fan and J. A. Ho, ACS Appl. Mater. Interfaces, 2014, 6, 18824–18831 CrossRef CAS PubMed.
- B. A. Kairdolf, X. M. Qian and S. M. Nie, Anal. Chem., 2017, 89, 1015–1031 CrossRef CAS PubMed.
- Y. L. Kong, Y. He, J. Zhou, S. H. Zhong and G. W. Song, ChemistrySelect, 2020, 5, 3828 CrossRef CAS.
- V. Raveendran, A. R. S. Babu and N. K. Renuka, RSC Adv., 2019, 9, 12070 RSC.
- M. Shamsipur, K. Molaei, F. Molaabasi, M. Alipour, N. Alizadeh, S. Hosseinkhani and M. Hosseini, Talanta, 2018, 183, 122 CrossRef CAS PubMed.
- J. Bi, H. Wang, T. Kamal, B.-W. Zhu and M. Tan, RSC Adv., 2017, 7, 30481 RSC.
- Q. X. An, Q. L. Lin, X. H. Huang, R. J. Zhou, X. Guo, W. Z. Xu, S. Y. Wang, D. Xu and H. T. Chang, Dyes Pigm., 2021, 185, 108878 CrossRef CAS.
- Y. J. Nie, J. Q. Guo, Y. H. Deng and W. Weng, J. Saudi Chem. Soc., 2020, 24, 865–873 CrossRef CAS.
- Y. X. Jia, X. J. Zhang, C. X. Yin, X. Zhang, J. P. Zhang, X. W. Wang and J. W. Xin, Anal. Methods, 2019, 11, 3974–3980 RSC.
- X. J. Wu, F. Kong, C. Q. Zhao and S. N. Ding, Analyst, 2019, 144, 2523–2530 RSC.
- L. Wang, H. X. Cao, Y. S. He, C. G. Pan, T. K. Sun, X. Y. Zhang, C. Y. Wang and G. X. Liang, J. Saudi Chem. Soc., 2019, 282, 78–84 CAS.
- M. L. Guo, J. T. Chi, Y. J. Li, G. I. N. Waterhouse, S. Y. Ai, J. Y. Hou and X. Y. Li, Microchim. Acta, 2020, 187, 534 CrossRef CAS PubMed.
- S. Li, P. C. Huang and F. Y. Wu, New J. Chem., 2017, 41, 717–723 RSC.
- National food safety standards determination of amino acids in foods, GB5009.124-2016.
- D. Bain, S. Maity, B. Paramanik and A. Patra, ACS Sustainable Chem. Eng., 2018, 6, 2334–2343 CrossRef CAS.
- S. C. Zhou, Y. Y. Duan, F. Wang and C. Y. Wang, Nanoscale, 2017, 9, 4981–4988 RSC.
- Water treatment chemicals-general method for determination of iron content, GB/T22596-2008.
- W. W. Cui, Y. Y. Wang, D. D. Yang and J. X. Du, Microchim. Acta, 2017, 184, 4749–4755 CrossRef CAS.
- Determination of total ascorbic acid in feeds—o-phenylenediamine fluorometry, GB/T17816-1999.
- X. F. Lou, F. F. Yu, Z. Cao, Y. Xu, L. Yang and H. L. Liu, Chem. Commun., 2020, 56, 7112–7115 RSC.
- Y. T. Chen, T. Q. Yang, H. F. Pan, Y. F. Yuan, L. Chen, M. W. Liu, K. Zhang, S. J. Zhang, P. Wu and J. H. Xu, J. Am. Chem. Soc., 2014, 136, 1686–1689 CrossRef CAS PubMed.
- T. Q. Yang, S. Dai, H. Tan, Y. X. Zong, Y. Y. Liu, J. Q. Chen, K. Zhang, P. Wu, S. J. Zhang, J. H. Xu and Y. Tian, J. Phys. Chem. C, 2019, 123, 18638–18645 CrossRef CAS.
Footnote |
| † Electronic supplementary information (ESI) available. See DOI: 10.1039/d0ra10281d |
| This journal is © The Royal Society of Chemistry 2021 |