
 Open Access Article
 This Open Access Article is licensed under a Creative Commons Attribution-Non Commercial 3.0 Unported Licence
Orderly aligned manganese-based nanotube arrays with controllable secondary structures
Xiaoyan Huang a,
Zhuoxi Lianga,
Jiqiu Wenb,
Yong Liub,
Ayoub Taallaha,
Xin Yaoa,
Zhiyou Zhanga,
Tian Yu*ac and
Sijie Zhang*a
a,
Zhuoxi Lianga,
Jiqiu Wenb,
Yong Liub,
Ayoub Taallaha,
Xin Yaoa,
Zhiyou Zhanga,
Tian Yu*ac and
Sijie Zhang*a
aCollege of Physics, Sichuan University, Chengdu, 610065, China. E-mail: work_tian@scu.edu.cn; sijie.zhang@scu.edu.cn
bAnalytical & Testing Center, Sichuan University, Chengdu, 610065, China
cDepartment of Electrical and Computer Engineering, University of California, Los Angeles, California 90095, USA
First published on 22nd February 2021
Abstract
By combining a hard template with a dynamic negative template, orderly aligned micrometer-length manganese nanotubes (Mn-NTs) decorated with nanopores on their walls as the secondary structure are successfully grown by electrodeposition in aqueous solution. These nanopores were characterized and analyzed statistically. It is found that these nanopores evolve along the growth direction of the Mn-NTs and their morphology is well controlled by the deposition potential. In addition, the morphology evolution of the nanopores exhibits distinguished size distribution compared with that found in conventional nanoporous foam grown solely by the dynamic template approach, which is attributed to the nanoconfinement of the hard template.
1. Introduction
One-dimensional materials with their rich properties and varied structures have been extensively studied.1–3 The recent rapid development of renewable and portable energy storage devices has triggered wide interest in exploring metal-based one-dimensional nanomaterials for energy storage applications,4–7 for example, functioning as three-dimensional architecture collectors in various energy storage devices.7–9The controllable growth of one-dimensional nanomaterials is essential and crucial to achieving advanced energy storage performance. It is known that the morphology of the nanomaterials has profound influences on the performances of the device.10–12 Generally, nanomaterials with larger specific surface area and higher porosity are favorable since they provide more reaction activity centers.12–14 In particular, comparing with other one-dimensional nanomaterials,1,15 the nanotubes (NTs) are more attractive because their thin nanotubes walls and hollow channels further facilitate ion/charge diffusion.16 To further increase the porosity and advance the ion/charge diffusion, introducing secondary structures is one of the promising strategies.17,18 However, the preparation of NTs with controllable secondary structures often involves sophisticated growth design and requires particular growth controls.19,20 Thus, there is a pressing need for realizing simple and convenient preparation of NTs with controllable secondary structures. Besides, from the practical device point of view, assembling the NTs also plays a pivotal role. As orderly assembling nanomaterials on a massive-scale is still full of challenges, random overlapping of the NTs is hardly avoidable, which frequently causes lousy connection and deteriorates the device performances.21,22 Therefore, in addition to realizing the preparation of NTs with controllable secondary structures, it is also desired to achieve the growth of orderly organized NTs.
In this paper, combining the hard-templated growth with the dynamic negative template we demonstrate the growth of orderly aligned NTs decorated with nanopores on their wall as the desired secondary structures. We choose manganese (Mn) as our model materials because Mn-based one-dimensional nanomaterials have shown great potential for energy storage applications23–26 and the convenient growth of orderly aligned Mn-NTs in aqueous is rarely reported. It is found that the nanopores as the secondary structure of the Mn-NTs can be conveniently controlled by electrodeposition potential. Along the growth direction of the Mn-NTs, these nanopores exhibit an inverted size distribution compared with that found in conventional nanoporous foam prepared by dynamic template approach.27 The formation and evolution of these nanopores are understood based on nanochannel confined hydrogen evolution during the growth of the Mn-NTs.
2. Experimental
In our experiments, commercial anodic aluminum oxide (AAO) with an average pore diameter of dAAO = 200 nm was used as the hard template. An Au/Cu seed layer of 50 nm in thickness was pre-evaporated on the bottom of the AAO templates, which function as the working electrode (WE) during the electrodeposition and serves as a seed layer for the growth of the Mn-NTs. The electrodeposition was conducted at room temperature using a home-made electrochemical cell, where a saturated calomel electrode (SCE) and a platinum (Pt) mesh were used as the reference electrode (RE) and the counter electrode (CE), respectively. The electrolyte is an aqueous solution of 0.3 M MnSO4 and 0.5 M (NH4)2SO4, which is prepared by dissolving analytical reagents in deionized water without any further purification. The (NH4)2SO4 is used to buffer the pH of the electrolyte and help the formation of manganese–ammonia complexes, which effectively prevent the precipitation of manganese hydroxides and oxides in our weakly alkaline electrolyte. An electrochemical workstation (VersaSTAT3) was employed for controlling the deposition potential as well as monitoring the deposition. Different potentials Edep. = −2 V, −2.5 V, and −3 V were applied, and the deposition time was kept at tdep. = 3600 s. The hard template was removed by selective etching using KOH (1 M) to clearly characterize the morphology of the obtained Mn-NTs in the arrays. The pre-preparation process and removal of the AAO template are sketched in Fig. 1. The morphology, element, and material composition of these Mn-NTs were examined by scanning electron microscopy (SEM, JSM-7500F), energy dispersive spectroscopy (EDS, Oxford instrument X-Max), and X-ray diffraction (XRD, PANalytical EMPYREAN), respectively.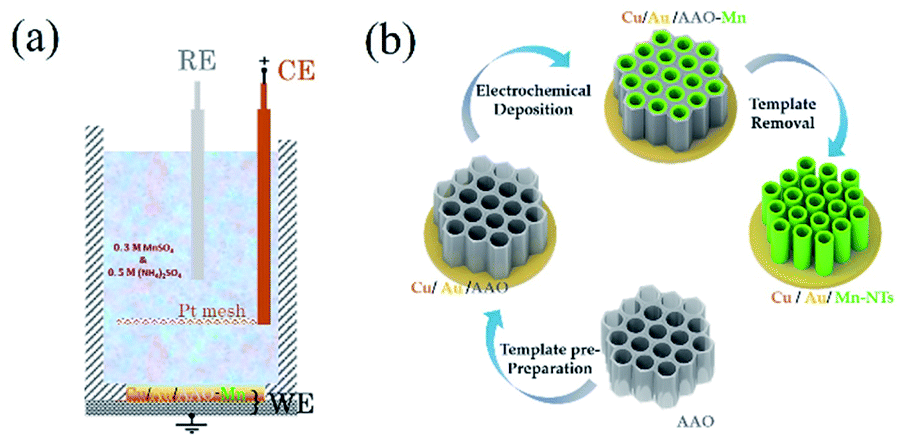 | ||
| Fig. 1 (a) Illustrates the setup of our electrochemical cell. (b) Sketches the main process for Mn-NTs growth. | ||
3. Results and discussion
Directly growth of metallic Mn-based one-dimensional materials by aqueous electrochemical deposition is achieved. As an example, Fig. 2(a) shows the typical SEM images after template removal. As seen, a brunch of nanotubes (NTs) stands orderly on the seed layer, which constitutes a monolithic three-dimensional architecture. The length (l) of the NTs depends on the tdep. as well as on the Edep.. With the Edep. = −2.5 V and tdep. = 3600 s, the l is found almost equal to the thickness of the AAO template (∼55 μm). As indicated in the inset of Fig. 2(a), the mean growth rate increases gradually as reducing Edep. from −2 V to −3 V. The typical EDS is shown in Fig. 2(b), where a small amount of Al and O are also found in addition to Mn, Cu, and Au. Usually, the O traced at metallic nanomaterials is attributed to inevitable nature oxidization at the metal surface.28 Noting that Al exists as well, we suggest that the observed O is mainly originated from the residual AAO (amorphous AlOx) rather than MnOx or Mn(OH)x. This is further confirmed by XRD measurement. As shown in Fig. 1(c), polycrystal peaks corresponding to Mn, Cu, and Au are identified. The peaks located at 2θ = 42.23, 48.07, 51.43, 73.06, and 85.66 (unit in deg) are consistent with reflection from (101), (110), (112), and (211) planes of Mn (PDF #17-0910), respectively. No noticeable amorphous background nor peak corresponding to MnOx/Mn(OH)x is observed, which excludes severe surface oxidization of Mn-NTs.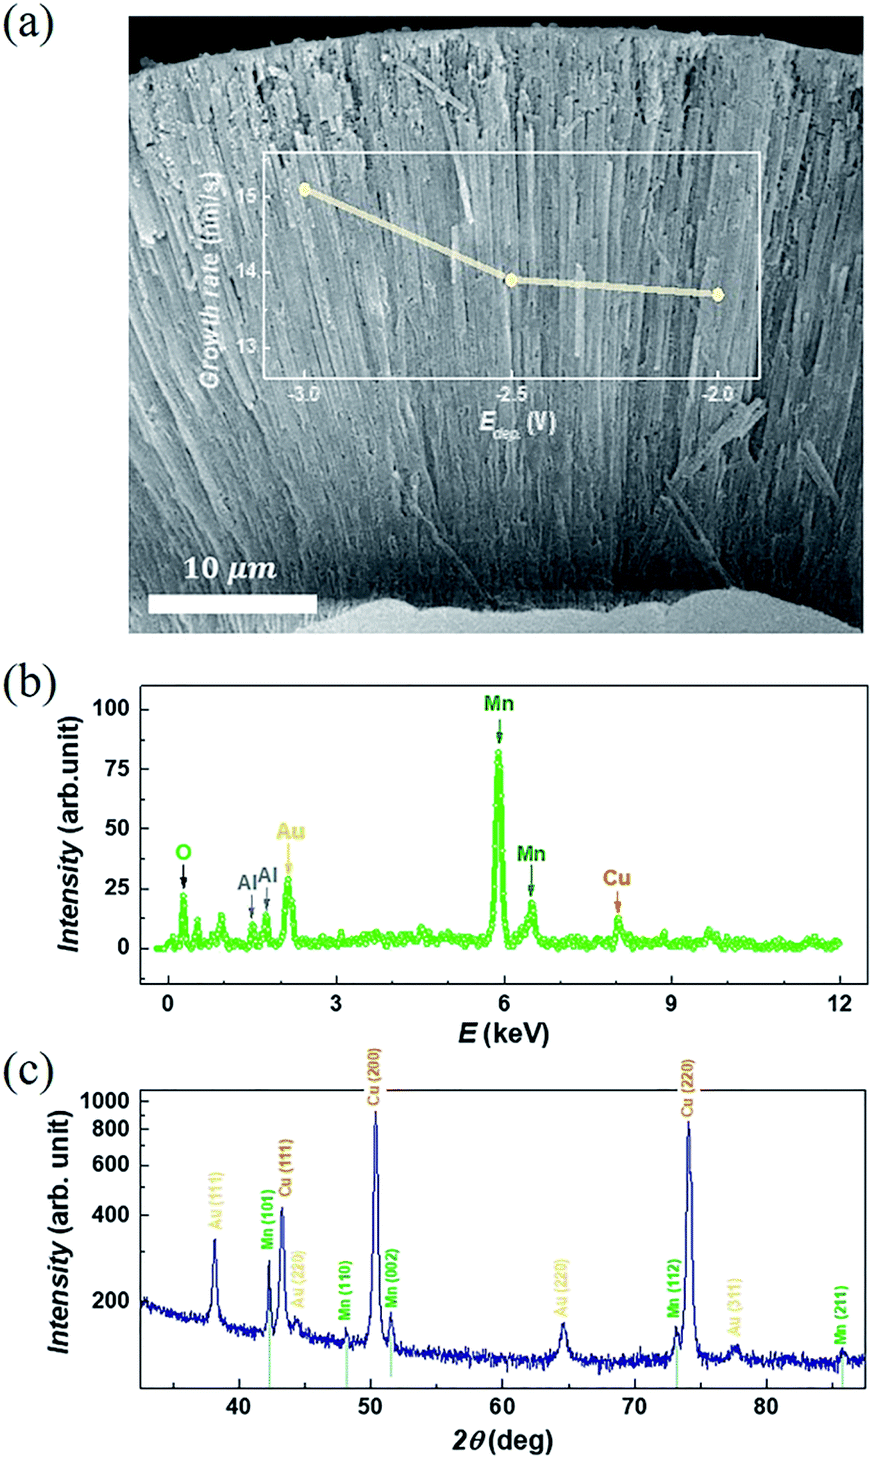 | ||
| Fig. 2 (a) Typical SEM image for NTs deposited under Edep. = −2.5 V. The inset of (a) summarizes the mean growth rate at various Edep.. (b and c) Shows the EDS and XRD result for obtained NTs, respectively. | ||
Fig. 3(a) presents a closer SEM image for Mn-NTs grown at the Edep. = −2.5 V. It is noteworthy that the nanotube walls are embedded with a series of nanopores, which unambitiously constitute the desired secondary structures. These nanopores are irregular in shape but exhibit a notable morphology transformation along the Mn-NTs growth direction: The nanopores near the WE (cathode) are larger in size and less in number, whereas the nanopores away from the WE are much small and enormous in number. To quantitatively describe this morphology change along Mn-NTs growth direction, we further investigated the nanopores size distribution. The Mn-NTs were divided into 3 regions, saying that the bottom region (first 5–15 μm near the WE), the middle region (following 20–30 μm), and the top region (35–45 μm), respectively. A series of raw SEM images were then acquired for each of these regions. Each of these raw images was then divided into 12. And for each of the raw images, 7 equal-area sections were randomly selected for counting the nanopore number and calculating size (unit in nm2). Finally, count-area histograms were constructed for each region by plotting the Ni against Ai, where Ni is the number of nanopores whose size falls in the ith statistic interval, Ai (unit in nm2) represents the size of the nanopores fall in this statistic interval and is equal to the mean area of the ith statistic interval. For all the statistics, the length of the statistic interval is kept at 50 nm2.
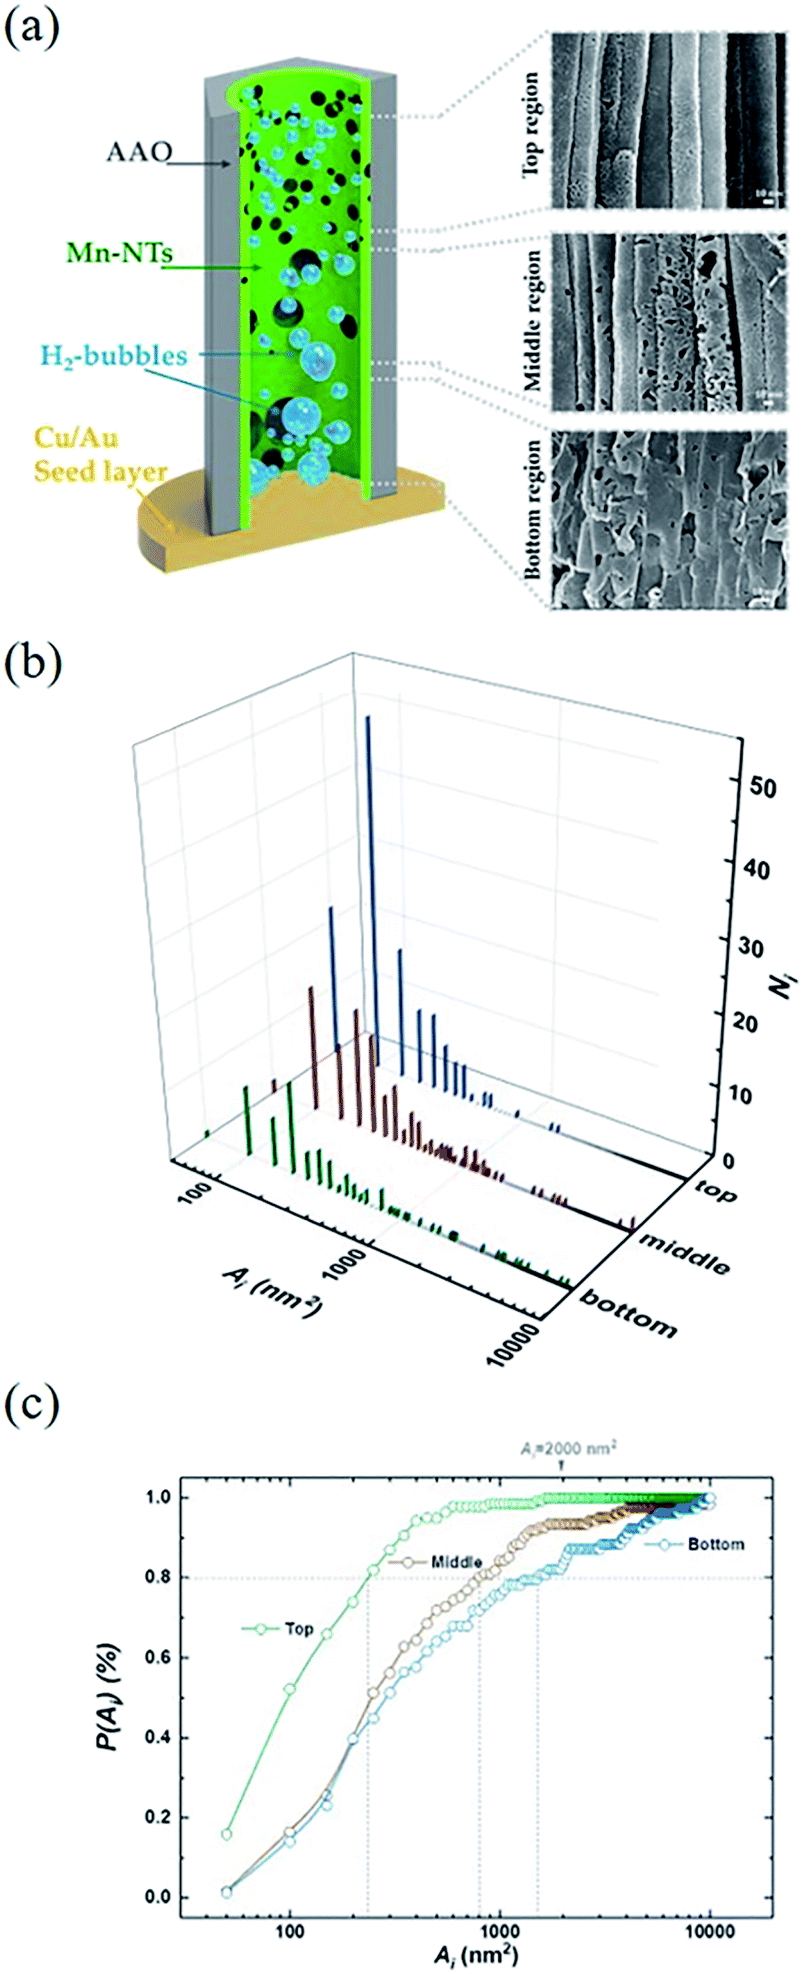 | ||
| Fig. 3 (a) Presents typical SEM images for different regions of the Mn-NTs deposited at Edep. = −2.5 V. (b) Shows corresponding count-area histograms. (c) Further illustrates the morphology transformation of nanopores by plotting P(Ai). | ||
Fig. 3(b) shows the count-area histogram (Ai − Ni) for Mn-NTs deposited at Edep. = −2.5 V. It is seen that for all different regions, the most frequently observed nanopores are the nanopores smaller than 150 nm2. This is saying in other words that the nanopore size distribution is shifted towards the small nanopore direction for each region. It is also noticed that the chance of finding large size nanopores becomes rarer and rarer as we approaching the top region. For instance, the chance to find the nanopores larger than 2000 nm2 is 15.6%, 6.5%, and 0% respectively for the bottom, middle, and top regions. Besides, the Ai − Ni provides us a base to quantitatively analyze the morphology change along Mn-NTs growth direction. The total number of nanopores Nt for the top, middle, and bottom region is easily calculated as 138, 121, and 78, respectively, suggesting that the top region has more nanopores than the middle region and the bottom region has the least nanopores. This result is consistent with our previous direct observation that the nanopores near the bottom are less in number whereas the nanopores near the top are enormous in number. A percentage ratio describing the contribution of nanopores with different sizes can be further defined based on the Ai − Ni as:
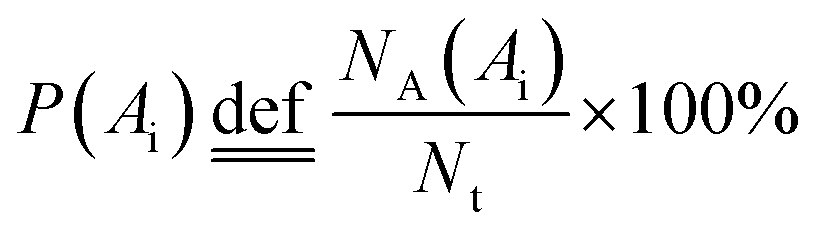
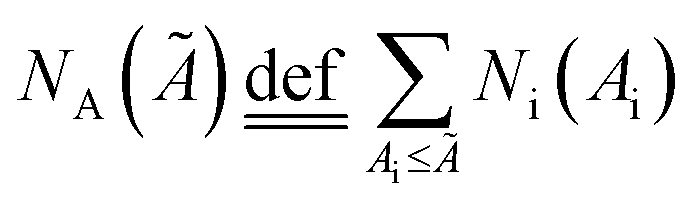 is the total number of nanopore with their size smaller than a given upper limit Ã. In Fig. 3(c) we plot P(Ai) as a function of Ai for different regions. From this plot, it is straightforward to find that in the top region 80% of the nanopores are contributed by nanopores smaller than 250 nm2, meanwhile, large nanopores of size up to 800 nm2 and 1500 nm2 must be involved for the middle and bottom region respectively. Therefore, the size of the dominative nanopores does decrease from the bottom to the top along the Mn-NTs growth direction, which is in agreement with our direct observation that the dominative nanopores near the bottom are larger whereas the nanopores near the top are much small.
Considering that the standard reduction potential for Mn2+/Mn is −1.18 V vs. SCE,28,29 the deposition of Mn-NTs at the WE is always accompanied by the precipitation of hydrogen:28,30–32
 | (1) |
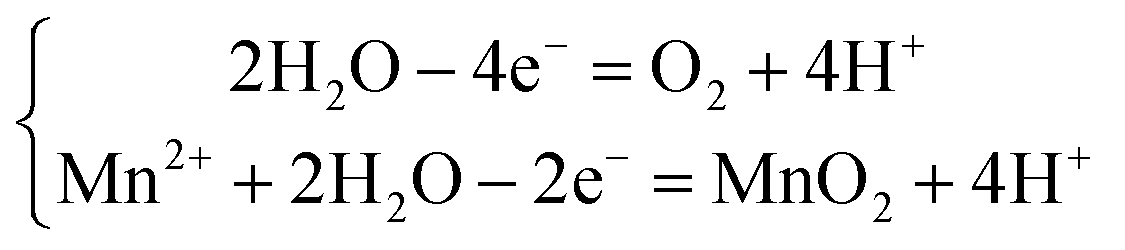 | (2) |
Fig. 4(a) illustrates processes involved in the growth of the Mn-NTs decorated with nanopores and explains the nanopore distribution along the Mn-NTs growth direction. It is not difficult to relate the formation of nanopores and thus the growth of Mn-NTs with secondary structures with the hydrogen evolution. It is conceivable that the innumerable fine hydrogen bubbles are generated simultaneously as the Mn is deposited. These fine hydrogen bubbles are intermingled with the deposited Mn clusters, creating a nanotube wall made by loosely assembled Mn clusters.33 As the top region of the Mn-NTs is always relatively in the initial state of Mn-NTs growth, this explains the observation that the top region of the Mn-NTs is always dominated by numerous nanopores of small size. As the deposition goes on, part of these initial fine hydrogen bubbles may evolve into large ones due to coalescence and/or growth, which may still adhere to the AAO wall and thus block the growth of the Mn. The other part of these initial fine hydrogen bubbles may rise into the atmosphere through the nanochannel of AAO. The vacancies left by them will be fulfilled by Mn clusters as the deposition goes on. Together, these processes transform the initial loosely assembled Mn shell into a dense wall decorated with fewer nanopores of large size. Since the bottom region of the Mn-NTs has fully experienced these processes, the nanopores are dominated by large ones in the bottom region. And, it is no surprise to find that the middle region is the transition zone between the top region and the bottom region.
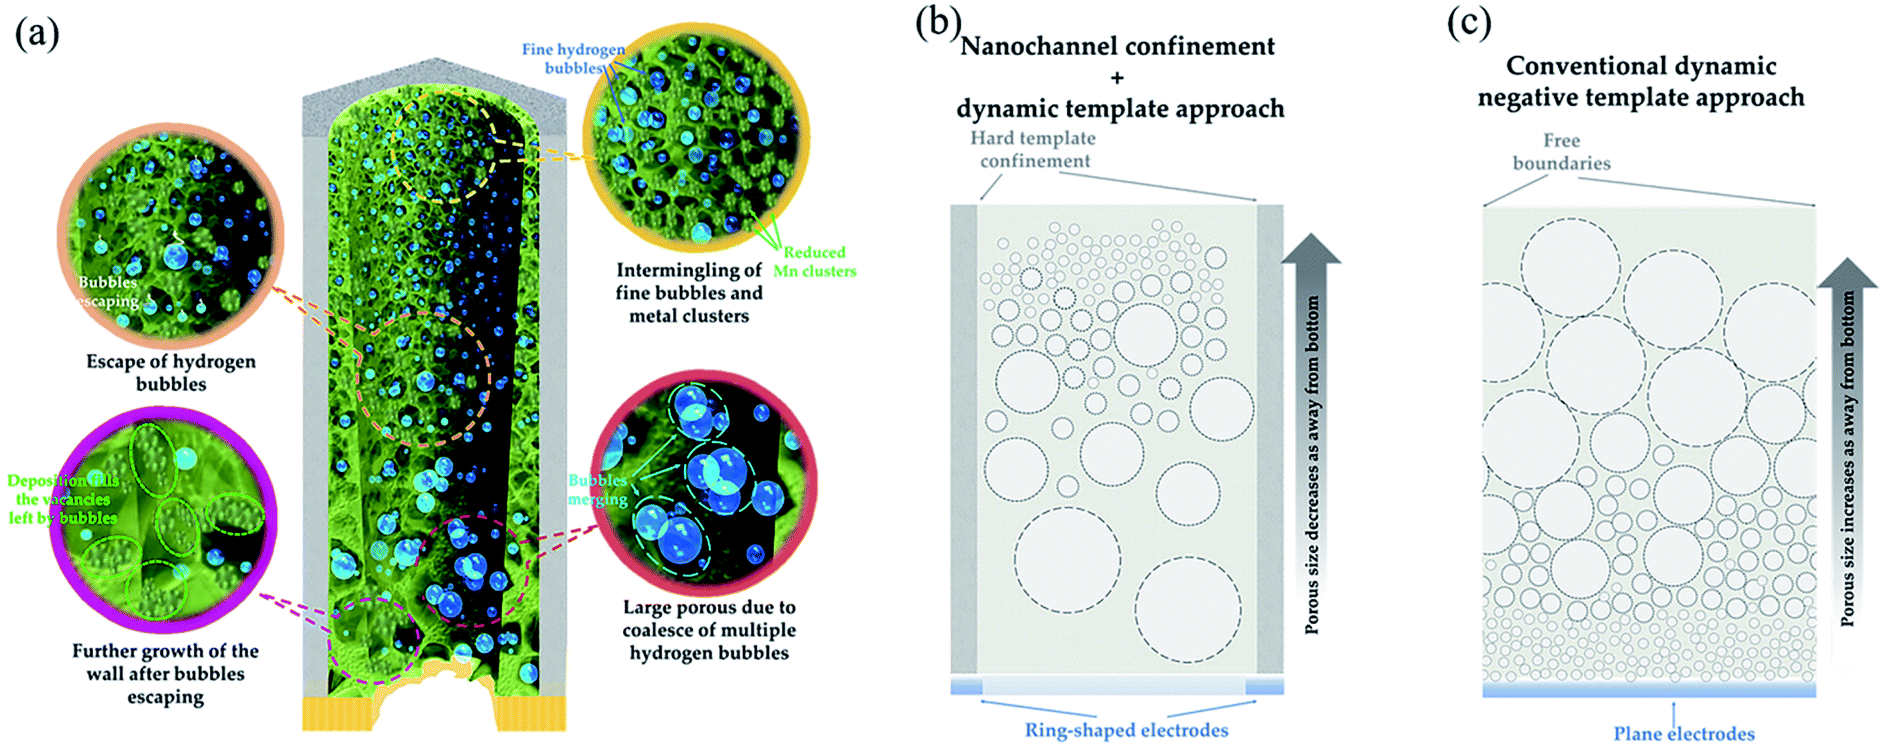 | ||
| Fig. 4 (a) Illustrates processes involved in the growth of the Mn-NTs decorated with nanopores. (b) Explains our approach of growing nanotubes by combing hard template confinement and dynamic negative template, where the nanochannel not only confines the deposition of metal but also modifies the dynamic evolution of bubbles. As a comparison (c) shows conventional dynamic negative templated growth of nanoporous foam. | ||
The hydrogen evolution has been long explored as a controllable dynamic negative template for nanoporous foam film growth.27,34–36 However, the nanopores size distribution along the growth direction for our Mn-NTs is very distinct from that observed in foam films. The nanopore size generally increases along the growth direction of foam films, while the Mn-NTs exhibit an inverted nanopores size distribution. We attribute this inversion of the nanopores size distribution to the nanoconfinement of AAO nanochannel. As shown in Fig. 4(b), the narrow nanochannel limits horizontal diffusion of hydrogen bubbles and greatly promotes adherent and coalescence of them, which increases the number of large bubbles at the bottom region. In the conventional case, on one hand, there exists additional horizontal freedom which reduces the chances of coalescence. On the other hand, the incessant hydrogen bubbles evolve into large ones mainly via merging during its rising as the hydrogen bubbles can hardly adhere to anything locally.27 As a consequence, the bubbles at the top have undergone more mergers, and the top regions are dominated by the large nanopores.
Fig. 5(a and b) shows the count-area histogram (Ai − Ni) for Mn-NTs deposited at Edep. = −2 V, and −3 V, respectively. It is noticed that the Mn-NTs obtained at different Edep. share similar nanopores size distribution. This similarity further implies that the growth mechanism of Mn-NTs at different Edep. is the same. Nevertheless, the nanopores and Mn-NTs can be modified by the Edep. As shown in Fig. 5(c), both the Nt and the total area of nanopores 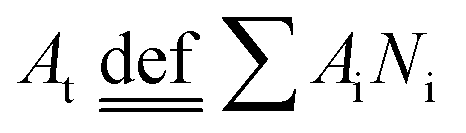 increases with increasing the Edep. negatively. Besides, it is also seen in Fig. 5(a) that the morphology transformation of the nanopores along the Mn-NTs growth direction becomes less significant when the Mn-NTs was deposited at Edep. = −2
![[thin space (1/6-em)]](https://www.rsc.org/images/entities/char_2009.gif) V: large size nanopores can be found in all three regions and the Mn shell is more smooth and exhibits fewer intermingled vacancies.
V: large size nanopores can be found in all three regions and the Mn shell is more smooth and exhibits fewer intermingled vacancies.
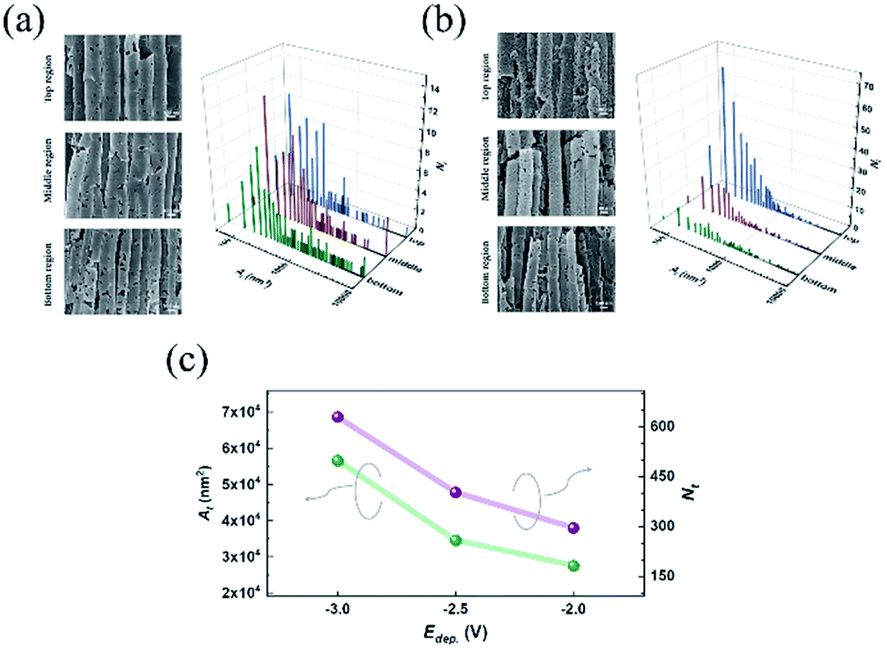 | ||
| Fig. 5 (a and b) Summarize the count-area histograms for Mn-NTs deposited under Edep. = −2 V and −3 V, respectively. Their typical SEM images are also shown correspondingly on the left side of the histograms. (c) Shows the dependence of the total area (At) and the number (Nt) of the nanopores on the deposition potential Edep.. | ||
4. Conclusions
In summary, the orderly aligned Mn-NTs were successfully prepared by electrodeposition in aqueous. By combining the advantages of conventional hard templated-growth with the dynamic negative hydrogen bubble template, the obtained Mn-NTs are found further decorated with a series of nanopores. These nanopores constitute the directed secondary structure in addition to the nanotubular structure. The morphology of these nanopores evolves along the growth direction of the Mn-NTs, which exhibits an inverted size distribution compared with that observed in nanoporous foams grown solely by the conventional dynamic template approach. It is found that the confinement of the hard template not only creates orderly aligned nanotubes but also modifies the dynamic evolution of hydrogen bubbles. The secondary structure of the Mn-NTs is further found can be controlled by varying deposition potential. The orderly aligned Mn-NTs with secondary structures, as a model material, provides a promising candidate for various energy storage applications and more importantly demonstrates a convenient approach to prepare one-dimensional nanomaterials with porous secondary structures.Conflicts of interest
There are no conflicts to declare.Acknowledgements
This research is supported by the National Natural Science Foundation of China (Grant number 11504249 and 61871451), Sichuan Provincial Funds for Distinguished Young Scientists (2017JQ0021), and the International Visiting Program for Excellent Young Scholars of SCU.Notes and references
- Q. L. Wei, F. Y. Xiong, S. S. Tan, L. Huang, E. H. Lan, B. Dunn and L. Q. Mai, Adv. Mater., 2017, 29, 39 Search PubMed.
- Y. N. Xia, P. D. Yang, Y. G. Sun, Y. Y. Wu, B. Mayers, B. Gates, Y. D. Yin, F. Kim and Y. Q. Yan, Adv. Mater., 2003, 15, 353–389 CrossRef CAS.
- Y. L. Yan, C. Zhang, J. N. Yao and Y. S. Zhao, Adv. Mater., 2013, 25, 3627–3638 CrossRef CAS.
- G. X. Zhang, X. Xiao, B. Li, P. Gu, H. G. Xue and H. Pang, J. Mater. Chem. A, 2017, 5, 8155–8186 RSC.
- R. S. Devan, R. A. Patil, J. H. Lin and Y. R. Ma, Adv. Funct. Mater., 2012, 22, 3326–3370 CrossRef CAS.
- V. Augustyn, P. Simon and B. Dunn, Energy Environ. Sci., 2014, 7, 1597–1614 RSC.
- X. Y. Lang, A. Hirata, T. Fujita and M. W. Chen, Nat. Nanotechnol., 2011, 6, 232–236 CrossRef CAS.
- S. M. Mirvakili and I. W. Hunter, Adv. Mater., 2017, 29, 1700671 CrossRef.
- H. P. Zhao, C. L. Wang, R. Vellacheri, M. Zhou, Y. Xu, Q. Fu, M. H. Wu, F. B. Grote and Y. Lei, Adv. Mater., 2014, 26, 7654–7659 CrossRef CAS.
- Z. N. Yu, L. Tetard, L. Zhai and J. Thomas, Energy Environ. Sci., 2015, 8, 702–730 RSC.
- W. Raza, F. Z. Ali, N. Raza, Y. W. Luo, K. H. Kim, J. H. Yang, S. Kumar, A. Mehmood and E. E. Kwon, Nano Energy, 2018, 52, 441–473 CrossRef CAS.
- G. P. Wang, L. Zhang and J. J. Zhang, Chem. Soc. Rev., 2012, 41, 797–828 RSC.
- C. Z. Zhu, D. Du, A. Eychmuller and Y. H. Lin, Chem. Rev., 2015, 115, 8896–8943 CrossRef CAS.
- H. C. Shin and M. L. Liu, Chemistry of Materials, 2004, 16, 5460–5464 CrossRef CAS.
- G. M. Zhou, L. Xu, G. W. Hu, L. Q. Mai and Y. Cui, Chem. Rev., 2019, 119, 11042–11109 CrossRef CAS.
- Q. Li, Z. L. Wang, G. R. Li, R. Guo, L. X. Ding and Y. X. Tong, Nano Lett., 2012, 12, 3803–3807 CrossRef CAS.
- K. Bhattacharya, D. Parasar, B. Mondal and P. Deb, Sci. Rep., 2015, 5, 9 Search PubMed.
- M. H. Lee, J. Y. Kim and H. K. Song, Chem. Commun., 2010, 46, 6795–6797 RSC.
- J. U. Kim, H. S. Han, J. Park, W. Park, J. H. Baek, J. M. Lee, H. S. Jung and I. S. Cho, J. Catal., 2018, 365, 138–144 CrossRef CAS.
- J. Huang, J. C. Wei, Y. B. Xiao, Y. Z. Xu, Y. J. Xiao, Y. Wang, L. C. Tan, K. Yuan and Y. W. Chen, ACS Nano, 2018, 12, 3030–3041 CrossRef CAS.
- N. Wang, J. Z. Liu, Y. Zhao, M. J. Hu and G. C. Shan, Nanotechnology, 2019, 30, 7 Search PubMed.
- J. Y. Ji, L. L. Zhang, H. X. Ji, Y. Li, X. Zhao, X. Bai, X. B. Fan, F. B. Zhang and R. S. Ruoff, ACS Nano, 2013, 7, 6237–6243 CrossRef CAS.
- K. Zhang, X. P. Han, Z. Hu, X. L. Zhang, Z. L. Tao and J. Chen, Chem. Soc. Rev., 2015, 44, 699–728 RSC.
- X. M. Wang, X. X. Liu, H. R. Rong, Y. D. Song, H. Wen and Q. Liu, RSC Adv., 2017, 7, 29611–29617 RSC.
- W. Guo, C. Yu, S. F. Li, Z. Wang, J. H. Yu, H. W. Huang and J. S. Qiu, Nano Energy, 2019, 57, 459–472 CrossRef CAS.
- W. F. Wei, X. W. Cui, W. X. Chen and D. G. Ivey, Chem. Soc. Rev., 2011, 40, 1697–1721 RSC.
- H. C. Shin, J. Dong and M. L. Liu, Adv. Mater., 2003, 15, 1610–1614 CrossRef CAS.
- J. M. Lu, D. Dreisinger and T. Gluck, Hydrometallurgy, 2014, 141, 105–116 CrossRef CAS.
- E. Griskonis, A. Sulcius and N. Zmuidzinaviciene, J. Appl. Electrochem., 2014, 44, 1117–1125 CrossRef CAS.
- X. R. Zhang, X. Y. Zhang, Z. H. Liu, C. Y. Tao and X. J. Quan, J. Environ. Chem. Eng.c, 2019, 7, 7 Search PubMed.
- J. M. Lu, D. Dreisinger and T. Gluck, Hydrometallurgy, 2016, 161, 45–53 CrossRef CAS.
- F. Yang, L. X. Jiang, X. Y. Yu, J. Yang, F. Y. Liu, X. J. Lv, Y. Q. Lai and J. Li, Hydrometallurgy, 2018, 179, 245–253 CrossRef CAS.
- W. P. Li and S. T. Zhang, Appl. Surf. Sci., 2011, 257, 3275–3280 CrossRef CAS.
- Y. Li, W. Z. Jia, Y. Y. Song and X. H. Xia, Chemistry of Materials, 2007, 19, 5758–5764 CrossRef CAS.
- H. C. Shin and M. L. Liu, Adv. Funct. Mater., 2005, 15, 582–586 CrossRef CAS.
- Y. Li, Y. Y. Song, C. Yang and X. H. Xia, Electrochem. Commun., 2007, 9, 981–988 CrossRef CAS.
| This journal is © The Royal Society of Chemistry 2021 |