 Open Access Article
The highly efficient removal of HCN over Cu8Mn2/CeO2 catalytic material†
Zhihao Yi ab,
Jie Sun*b,
Jigang Lib,
Yulin Yangb,
Tian Zhoub,
Shouping Weib and
Anna Zhua
aState Key Laboratory of NBC Protection for Civilian, Beijing, 102205, China
bDepartment of Chemistry Defense, Institute of NBC Defense, Beijing, 102205, China. E-mail: magnsun@tsinghua.edu.cn
First published on 26th February 2021
Abstract
In this work, porous CeO2 flower-like spheres loaded with bimetal oxides were prepared to achieve effective removal of HCN in the lower temperature region of 30–150 °C. Among all samples, the CeO2 loaded with copper and manganese oxides at the mass ratio of 8/2 (Cu8Mn2/CeO2) exhibited the highest catalytic activity: the HCN removal rate was nearly 100% at 90 °C at the conditions of 120![[thin space (1/6-em)]](https://www.rsc.org/images/entities/char_2009.gif) 000 h−1 and 5 vol% H2O, the catalytic activity of which was higher than for other reported catalysts. The introduction of MnOx could improve the dispersion of CuO particles and increase the total acid sites of the prepared samples. It was proved that the synergy between CuO and MnOx, the chemisorption oxygen, the oxygen vacancies, the Cu2+ and Mn4+ all played an important role in determining the good catalytic activity of the prepared samples. NH3-TPD analysis indicated the introduction of MnOx promoted the conversion of NH3 and N2 selectivity by increasing the acid sites of the sample. According to the C, N balance data and FT-IR results, when the temperature was below 30 °C, the removal of HCN over Cu8Mn2/CeO2 was mainly by chemisorption and the HCN breakthrough behaviors corresponded to the Yoon and Nelson's model. When temperature was above 120 °C, the HCN was totally removed by catalytic hydrolysis and catalytic oxidation.
000 h−1 and 5 vol% H2O, the catalytic activity of which was higher than for other reported catalysts. The introduction of MnOx could improve the dispersion of CuO particles and increase the total acid sites of the prepared samples. It was proved that the synergy between CuO and MnOx, the chemisorption oxygen, the oxygen vacancies, the Cu2+ and Mn4+ all played an important role in determining the good catalytic activity of the prepared samples. NH3-TPD analysis indicated the introduction of MnOx promoted the conversion of NH3 and N2 selectivity by increasing the acid sites of the sample. According to the C, N balance data and FT-IR results, when the temperature was below 30 °C, the removal of HCN over Cu8Mn2/CeO2 was mainly by chemisorption and the HCN breakthrough behaviors corresponded to the Yoon and Nelson's model. When temperature was above 120 °C, the HCN was totally removed by catalytic hydrolysis and catalytic oxidation.
1 Introduction
Hydrogen cyanide (HCN) is a kind of highly toxic and volatile compound, with a boiling point of 26 °C, which is widely used in the laboratory and chemical industry.1 HCN could inhibit the enzyme cytochrome oxidase, and interfere with aerobic respiration at cellular level, which poses a threat to human health.2 Significantly, as the precursor of nitrogen oxides such as NO, NO2 and N2O, HCN could also lead to the greenhouse effect and generation of photochemical fumes.3 In addition to laboratory synthesis, there is a fair chance to produce HCN including the processing of cyanide-containing chemicals,4 processing tail gas of calcium and yellow phosphorus,5 fossil fuels and biomass combustion,6 selective catalytic reduction of NOx as well as the well-established three-way-catalyst process.7 To relieve or reduce the negative effect on both the human body and the environment caused by HCN, it is essential to develop highly efficient dicyanide methods. Based on the above discussion, the removal of HCN has been paid more and more attention and the treatment of HCN has important prospects.Diverse strategies have been reported to remove HCN from gas which involves absorption, adsorption, combustion, catalytic hydrolysis and catalytic oxidation.8
Liu et al.9 studied the catalytic combustion of HCN over ZSM-5 catalysts loaded with Cu, Co, Fe, Mn, Ni species. Among all samples, Cu-ZSM-5 exhibited excellent HCN conversion activity (T90 = 350 °C) and high N2 yield (>95%). Nickolov et al.10 reported the adsorption characteristics of modified activate carbons (AC) toward HCN. When loaded with Cu (5.6 wt%), Zn (5.24 wt%), Ag (0.61 wt%), the AC material (VSZC) showed enhanced HCN removal ability, which was proved to be comparable with the standard ASC Whetlerite carbon. The Zn phase deposited near the external surface of the sample was consumed first to reduce the production of cyanogen. It has also been proved that the addition of negligible amount of Cr6+ (3.5 times lower than that in ASC Whetlerite carbon) could enhance the conversion of cyanogen. Hudson et al.11 synthesized an SBA-15 material modified with the BBOP and equilibrated with copper (II) nitrate. Owing to the greater accessibility of the functional groups, the doddered nature of the interconnected porous network and large mesopores, The SBA-15 material showed an improved breakthrough time for HCN (36 min) which was closed to the reference AC adsorbents. Ma et al.12 investigated the Nb/La–TiOx catalyst's activity for the hydrolysis of HCN, the conversion of HCN over which could reach 100% accompanied with more than 90% NH3 selectivity. They proposed following mechanism of HCN hydrolysis over Nb/La–TiOx catalyst: HCN was first converted to intermediated CHONH2 under the function of catalyst, subsequently, the CHONH2 was continually hydrolyzed to NH4+ and HCOOH with the participation of acid sites of the catalyst. Finally, the NH4+ was converted into NH3·H2O, and simultaneous HCOOH was decomposed to CO and H2O or CO2 and H2O. Hu13 reported the metal oxides (Fe, Cu) modified HZSM-5 catalysts synthesized by incipient wetness method showed improved performance toward HCN removal (100% conversion of HCN and 80% selectivity of N2), the high catalytic activity of which could be attributed to the highly dispersed iron and copper composites on the surface of the catalyst support, the excellent redox ability and regulated acid properties. Wang et al.14 carried out a detail investigation on coupling catalytic hydrolysis and oxidation of HCN over a serious MnOx/TiO2–Al2O3 prepared via sol–gel method. 15 wt% MnOx/TiO2–Al2O3 showed the best performance on HCN oxidation, and nearly 100% HCN conversion and 70% N2 yield were obtained at 200 °C.
From these above statements, it could be observed the catalytic hydrolysis and oxidation based on these catalysts require relatively higher temperature (>200 °C) to achieve deep purification of HCN, which might cost a lot of energy. Adsorbent materials showed excellent removal efficiency toward HCN at room temperature while the incomplete conversion of HCN and the secondary pollution caused by the desorption products limit the further application of this method. Therefore, it is necessary to develop novel catalytic materials to obtain high HCN removal rate at lower temperature range (30–150 °C).
CeO2 has been widely used in various fields including low-temperature water-gas shift reaction, fuel cells, phosphors, catalysts, cocatalysts, catalyst supports as well as hydrogen storage materials due to the high oxygen storage/release capacity (OSC) and high oxygen mobility arising from facile redox cycle between Ce4+ and Ce3+.15,16 In recent reports, CeO2 materials with different structure and morphologies has been prepared and evidenced to exhibit unique properties differing from common CeO2.17,18 The porous CeO2 flowerlike sphere has attracted lots of interest for its larger pore volume, higher surface area and marked hydrothermal stability when used as supports.19,20 Tan et al.21 conducted the oxidation of styrene on the porous CeO2 flowerlike sphere loaded with CuO, La2O3 and Fe2O3, and found the CuO/CeO2 showed the highest activity. Sun et al.22 examined the catalytic activities and hydrothermal stability of Cu/CeO2 for ethanol stream reforming. At 300 °C, the H2 selectivity could reach 74.9% while the CO was below the detection line.
In this work, the porous CeO2 flowerlike spheres modified with a series of bimetallic oxides (Cu–Ag, Cu–Mn, Cu–Zn, Cu–Ni, Cu–Co, Cu–Fe) were prepared and their catalytic activity for HCN removal were evaluated under lower temperature region (30–150 °C). The reaction kinetics and the mechanism of HCN removal over the synthesized samples were analyzed.
2 Experimental
2.1 Catalytic materials preparation
![[thin space (1/6-em)]](https://www.rsc.org/images/entities/char_2009.gif) :
:![[thin space (1/6-em)]](https://www.rsc.org/images/entities/char_2009.gif) 2. The total content of Cu and Mn oxides always accounted for 10 wt% of the CeO2 support. Then the Na2CO3 solution (0.5 mol L−1) was added at the speed of 1drop/s until the pH value of the solution reached 9. After being stirred for 4 h, the suspension and precipitate were separated by centrifugation and the precipitate was washed with deionized water and ethanol for three times respectively. Finally, the samples donated as Cu8Mn2/CeO2 were obtained after undergoing such steps: calcination, grinding, pelletizing and sieving. The total metal mass percentage was calculated by the equation (M/(M + CeO2), M = Cu, Mn), in which wt% means the mass percentage. The Cu8Ag2/CeO2, Cu8Ni2/CeO2, Cu8Co2/CeO2, Cu8Zn2/CeO2 and Cu8Fe2/CeO2 samples were also prepared by the same method by changing the nitrate solution of metal species.
2. The total content of Cu and Mn oxides always accounted for 10 wt% of the CeO2 support. Then the Na2CO3 solution (0.5 mol L−1) was added at the speed of 1drop/s until the pH value of the solution reached 9. After being stirred for 4 h, the suspension and precipitate were separated by centrifugation and the precipitate was washed with deionized water and ethanol for three times respectively. Finally, the samples donated as Cu8Mn2/CeO2 were obtained after undergoing such steps: calcination, grinding, pelletizing and sieving. The total metal mass percentage was calculated by the equation (M/(M + CeO2), M = Cu, Mn), in which wt% means the mass percentage. The Cu8Ag2/CeO2, Cu8Ni2/CeO2, Cu8Co2/CeO2, Cu8Zn2/CeO2 and Cu8Fe2/CeO2 samples were also prepared by the same method by changing the nitrate solution of metal species.2.2 Experimental setup
The catalytic activity test of the prepared samples was evaluated in a fixed-bed reactor, and the reaction scheme was shown in Fig. S1.† The prepared sample (0.25 g) was placed in a quartz tube (with an inner diameter of 5 mm) for each reaction. The mixed gases containing 400 mg m−3 HCN and 5 vol% H2O were introduced into the fixed-bed quart tubular reactor at a total flow rate of 400 mL min−1 (GHSV = 120![[thin space (1/6-em)]](https://www.rsc.org/images/entities/char_2009.gif) 000 h−1). The exhaust gas from the sample bed was first analyzed (as described below) and then absorbed and discharged.
000 h−1). The exhaust gas from the sample bed was first analyzed (as described below) and then absorbed and discharged.
2.3 Detection and analysis of reacted products
The outlet gas from the sample bed was first analyzed and then absorbed by the NaOH solution (1 mol L−1). The HCN and NH3 were determined by iso-nicotinic-acid-3-methy-1-phenyl-5-pyrazolone spectrophotometric method and sodium hypochlorite–salicylic acid spectrophotometric method respectively, the detection limits of which were 0.005 mg L−1 and 0.0025 mg L−1 respectively. The concentration of CO, CO2, NO and NO2 (mg m−3) were measured using a flue gas analyzed (DeTu, 350, German) after the gas stabilized for 80 min at the corresponding temperature. The HCN removal rate and reaction products selectivity were calculated according to the eqn (S1)–(S8).†2.4 Characterization
The related characterization information was detailed in the ESI.†3 Results and discussion
3.1 Catalytic activity of CeO2 loaded with copper and manganese oxides
In order to evaluate the catalytic activity of CeO2 and the CeO2 loaded with copper and manganese oxides, the four prepared samples including CeO2, CuO/CeO2, MnOx/CeO2 as well as Cu8Mn2/CeO2 were tested for the HCN catalytic removal and the results were shown in Fig. 1. It could be observed the HCN removal rate of all samples increased with increasing the reaction temperature from 30 °C to 150 °C. The CeO2 support showed the lowest activity toward HCN, even at 150 °C, the HCN removal rate was still below 70%. The HCN removal rate over CuO/CeO2 were higher than MnOx/CeO2 throughout the reaction temperature region, indicating the CuO phase on the CeO2 played an important role in the HCN catalytic removal. The reason why CuO exhibited good catalytic performance could be explained by the interaction between CuO and HCN which was demonstrated in following equations.23,24| 2CuO + 4HCN → 2CuCN + (CN)2 + 2H2O | (1) |
 | (2) |
 | (3) |
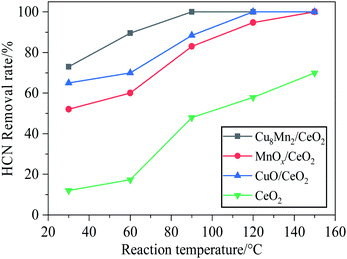 | ||
Fig. 1 The HCN removal rate over CeO2, CuO/CeO2, MnOx/CeO2 and Cu8Mn2/CeO2 samples. Reaction condition: 120![[thin space (1/6-em)]](https://www.rsc.org/images/entities/char_2009.gif) 000 h−1, 5 vol% H2O. 000 h−1, 5 vol% H2O. | ||
The highest HCN removal rate was obtained for Cu8Mn2/CeO2: it was equal to 73% at 30 °C and reached nearly 100% at 90 °C. To determine the optimal Cu/Mn mass ratio, a serious of CuxMny/CeO2 materials including Cu8Mn2/CeO2, Cu6Mn4/CeO2, Cu4Mn6/CeO2 and Cu2Mn8/CeO2 were prepared and the catalytic activity of these samples were compared with CuO/CeO2 and MnOx/CeO2. As presented in Fig. S2,† the Cu8Mn2/CeO2 still exhibited the highest activity and the optimal Cu/Mn ratio was 8![[thin space (1/6-em)]](https://www.rsc.org/images/entities/char_2009.gif) :
:![[thin space (1/6-em)]](https://www.rsc.org/images/entities/char_2009.gif) 2. The addition of a small amount of MnOx could enhanced the catalytic activity of CuO/CeO2 and the results might be attributed to the synergy between copper and manganese oxides, which was in accordance with the study of Li and Njagi et al. who studied the catalytic activity of Cu–Mn–O catalysts toward HCN and CO respectively.25,26
2. The addition of a small amount of MnOx could enhanced the catalytic activity of CuO/CeO2 and the results might be attributed to the synergy between copper and manganese oxides, which was in accordance with the study of Li and Njagi et al. who studied the catalytic activity of Cu–Mn–O catalysts toward HCN and CO respectively.25,26
| Cu2+ + Mn3+ ↔ Cu+ + Mn4+ | (4) |
3.2 Catalytic activity of CeO2 loaded with different bimetal oxides
Fig. 2 investigated the HCN catalytic removal rate over CeO2 loaded with different bimetal oxides including Cu8Fe2/CeO2, Cu8Ni2/CeO2, Cu8Co2/CeO2, Cu8Ag2/CeO2 and Cu8Zn2/CeO2 samples. All samples exhibited the same HCN removal trend as Cu8Mn2/CeO2 at the temperature region of 30–150 °C: the HCN removal rate increased as temperature improving. Cu8Ni2/CeO2 and Cu8Fe2/CeO2 showed the similar catalytic performance and their activity were both stronger than CuO/CeO2. The results indicated the introduction of iron and nickel species could generated good synergy with copper oxide species. Significantly, the addition of iron species could strengthen the redox properties of catalysts and increase the dispersion of copper species by inhabiting the particles agglomeration.27 For Cu8Co2/CeO2, it exhibited the same catalytic activity toward HCN as CuO/CeO2. Noteworthy, when cobalt and sliver oxides were introduced, the activity of two samples were lower than CuO/CeO2, this might be ascribed to the weaker synergy and lower CuO active sites on the support surface. Among all samples, the Cu8Mn2/CeO2 still showed the most remarkable catalytic performance toward HCN, implying the synergy between copper and manganese was stronger than other bimetal oxides. Table S1† showed the comparison of HCN catalytic removal activity over various catalysts, indicating the Cu8Mn2/CeO2 exhibited the lowest T100% temperature, at which HCN could be totally removed.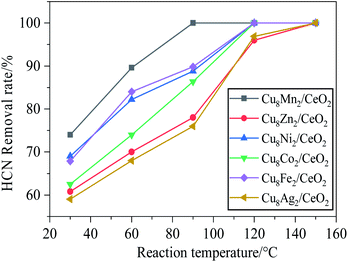 | ||
Fig. 2 The HCN removal rate over CeO2 loaded with different bimetal oxides. Reaction condition: 120![[thin space (1/6-em)]](https://www.rsc.org/images/entities/char_2009.gif) 000 h−1, 5 vol% H2O. 000 h−1, 5 vol% H2O. | ||
In order to investigate the thermal stability of Cu8Mn2/CeO2, the Cu8Mn2/CeO2 pretreated at 200 °C, 400 °C and 600 °C were tested for the HCN removal and the results shown in Fig. S3† indicated the catalytic activity of Cu8Mn2/CeO2 were not influenced when the pretreated temperature varied. Further TG-DCS analysis shown in Fig. S4† also proved the Cu8Mn2/CeO2 showed high thermal stability.
It was necessary to know whether the Cu8Mn2/CeO2 could be recycled. The regeneration of the Cu8Mn2/CeO2 were performed by the calcination of the samples at 450 °C for 4 h. Four recycling runs for the Cu8Mn2/CeO2 were carried out, the results shown in Fig. S5† indicated the Cu8Mn2/CeO2 could still achieve nearly 80% removal rate toward HCN even after 4 runs.
3.3 Analysis of HCN reaction products over Cu8Mn2/CeO2
The HCN removal rate and the reaction products over Cu8Mn2/CeO2 were investigated at the temperature region of 30–150 °C and the results were shown in Fig. 3. The products detected in the outlet gas involved CO, CO2, NH3, NO and NO2. The selectivity of CN− and N2 were calculated according to the C-balance N-balance data and the concentration of all reaction products were listed in Table S2.†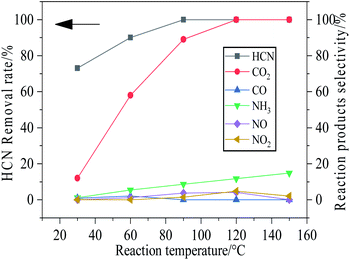 | ||
Fig. 3 The removal rate of HCN and selectivity of reacted products over Cu8Mn2/CeO2 at different temperature. Reaction condition: 120![[thin space (1/6-em)]](https://www.rsc.org/images/entities/char_2009.gif) 000 h−1, 5 vol% H2O. 000 h−1, 5 vol% H2O. | ||
At 30 °C, the selectivity of CO and CO2 were not in line with the HCN removed, which implied most HCN were converted to CN− due to the chemical interaction between CuO and MnOx phase on the CeO2 support (eqn (1)) and the HCN was mainly removed by chemisorption. The small amount of CO and NH3 might be attributed to the catalytic hydrolysis reaction of HCN (shown in eqn (5)), while the CO2 were assigned to the catalytic oxidation (shown in eqn (6)). In addition, the oxidation of CO could also generate CO2.
| HCN + H2O → NH3 + CO | (5) |
| 4HCN + 5O2 → 4CO2 + 2N2 + 2H2O | (6) |
The catalytic hydrolysis of HCN over Cu8Mn2/CeO2 showed low activity at the temperature region of 30 °C–60 °C, the NH3 yield changed little with temperature increasing. However, the high CO2 selectivity indicated the catalytic oxidation of HCN was enhanced, the CN− was oxidized to CO2 and released more active sites, which could strengthen the HCN removal rate.
The selectivity of NH3 and CO2 increased significantly from 60–150 °C as results of catalytic hydrolysis and catalytic oxidation of HCN showing high activity. The generated NO and NO2 might be attributed to the byproducts of catalytic oxidation of HCN. Compared with NH3 generated by catalytic hydrolysis, the amount of CO disappeared with temperature increasing due to the oxidization of CO to CO2. When the temperature reached 120 °C and increased further, the CO2 selectivity stayed 100%, implying the HCN was completely removed by catalytic hydrolysis and oxidation.
More significantly, the NH3 selectivity generated by catalytic hydrolysis was below than 20% at the whole reaction temperature, which were lower than the reported literature.12,13 It might be attributed to the increase of acid sites on the Cu8Mn2/CeO2 after MnOx introduced and the generated NH3 could be absorbed on the Cu8Mn2/CeO2 samples and converted into N2.
3.4 Breakthrough behaviors of HCN over Cu8Mn2/CeO2
By analyzing the reaction products of HCN, it was concluded that the HCN was mainly removed by chemisorption at 30 °C. To study the catalytic materials' adsorption performance, the breakthrough behaviour of HCN over Cu8Mn2/CeO2 was investigated and the breakthrough curves were shown in Fig. S6.†The Yoon and Nelson's equation was introduced to describe the breakthrough behaviour of HCN over Cu8Mn2/CeO2.28
 | (7) |
Fig. 4 demonstrated the experimental results of the  and t curves, the values of k and τ at different temperature were calculated and the results were listed in Table S3.† With temperature increased, the thermal motion of HCN became intense, and the number of activated molecules increased, which accelerated the saturation of activated sites on the Cu8Mn2/CeO2. HCN was absorbed on the samples' surface in the form of CN− and could not be converted further. The activated sites could not be released, as a result, the breakthrough curve became steeper and breakthrough time became shorter as temperature increased.
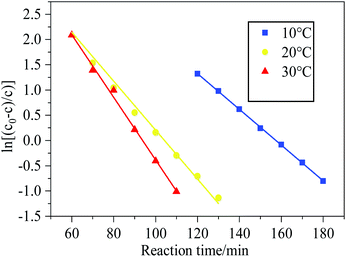 | ||
Fig. 4 Plot of  –t for Cu8Mn2/CeO2 bed at temperature region of 10–30 °C. Reaction condition: 120 –t for Cu8Mn2/CeO2 bed at temperature region of 10–30 °C. Reaction condition: 120![[thin space (1/6-em)]](https://www.rsc.org/images/entities/char_2009.gif) 000 h−1, 5 vol% H2O. 000 h−1, 5 vol% H2O. | ||
3.5 SEM and TEM analysis
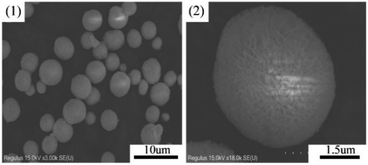
The morphological properties of samples were characterized by SEM analysis. As presented in Fig. 5, the CeO2 support exhibited flowerlike mesoporous microspheres with average diameter of 2–4 μm and dispersed evenly. There were many petal-like nanosheets on the microsphere surface and these nanosheets interweaved together to form the porous structure.29 Fig. 6 showed the morphology and size of Cu8Mn2/CeO2 materials, it could be observed the metal oxide particles were loaded dispersively on the CeO2 supports and the porous structure were covered after metal oxide species loaded. EDS analysis shown in Fig. S6† implied the Cu and Mn elements had uniform distribution on the CeO2 surface. The SEM images for Cu8Zn2/CeO2, Cu8Ni2/CeO2, Cu8Co2/CeO2, Cu8Fe2/CeO2 and Cu8Ag2/CeO2 were shown in Fig. S7.† The actual metal oxides loading of all samples were calculated according to EDS analysis shown in Fig. S8† and the results were listed in Table 1, which demonstrated the actual metal oxides loading were in accordance with theoretical value.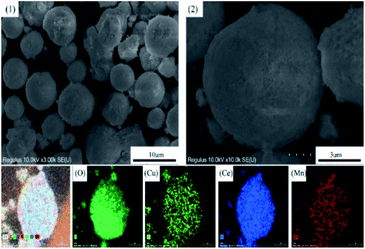 | ||
| Fig. 6 The SEM images of the Cu8Mn2/CeO2 and the corresponding elements (O, Cu, Ce, Mn) mapping. (1) and (2) Low and high magnification SEM images of Cu8Mn2/CeO2. | ||
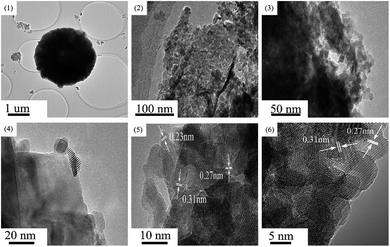
In order to analyze the microstructure and crystallinity of the Cu8Mn2/CeO2 samples, the HR-TEM characterization was carried out and the results were shown in Fig. 7. As shown in Fig. 7(1), it could be seen the Cu8Mn2/CeO2 exhibited a sphere structure with diameter of 2–3 μm, which was consistent with SEM characterization. Fig. 7(2) indicated the Cu8Mn2/CeO2 was polycrystalline structure composed of many nanocrystals at different orientations.30 The nanocrystals marked in Fig. 7(4) was assigned to CuO species loaded on CeO2 support, the crystal size of which were around 10–15 nm. Three interplanar spacings of the ordered stripes marked in Fig. 7(5) were 0.27 nm, 0.31 nm and 0.23 nm, corresponding to the (200) and (111) lattice planes of CeO2 and (111) lattice planes of CuO.31 However, there no MnOx phase observed in Fig. 7(5), this could be explained by the high dispersion of MnOx due to the low loading. Fig. 7(6) displayed the TEM image for CeO2, it could be concluded the structure of CeO2 was not changed after metal oxides loaded and still exposed (200) and (111) lattice planes.
3.6 XRD analysis
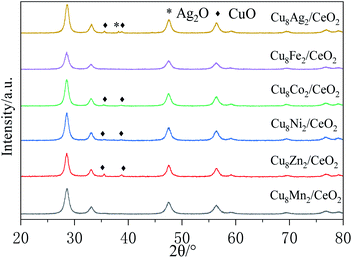
Fig. 8 showed the XRD patterns of CeO2 loaded with different bimetal oxides. The main diffraction peaks at 28.8°, 33.1°, 47.8°, 56.5°, 59.5°, 69.3°, 77.1° and 79.2° were ascribed to the cubic fluorite cerium oxide and the peaks at 35.4° and 38.7° were attributed to the CuO (JCPDS 34-0394).32 Except Cu8Ag2/CeO2 exhibited the Ag2O diffraction peak at 38.2°, no diffraction peaks derived from other metal or metal oxides (Mn, Zn. Ni, Co, Fe) were observed in the XRD patterns.33 The results implied these metal oxides were well dispersed on the CeO2 support due to theirs low loading. The crystal size of CuO loaded on CeO2 in all samples was calculated according to the Scherrer equation and the results were listed in Table 1. It could be seen the introduction of ZnO or Ag2O promoted the agglomeration of CuO on the surface of supports and increased the crystal size. For NiO or Co3O4, they showed little effect toward the crystal size of CuO. When introduced MnOx or Fe2O3, the diffraction peaks of CuO disappeared, indicating the CuO species were dispersed well as amorphous oxides or some Cu species doped into the lattice of CeO2 and formed Cu–Ce–O solid solution.31 CuO and MnOx species could strengthen the synergy between CuO and CeO2 support to restrain the growth of CuO particles. Combined with catalytic activity test results, it could be deduced the bimetal synergistic effect could improve samples' activity by strengthening the interaction between metal oxides and supports. The XRD patterns of CeO2, CuO/CeO2 and MnOx/CeO2 were shown in Fig. S9,† and the crystal size of metal oxide particles calculated were also listed in Table 2.| Samples | Surface area/(m2 g−1) | Pore volume/(cm3 g−1) | Pore size/nm |
|---|---|---|---|
| CeO2 | 104.4 | 0.12 | 4.6 |
| CuO/CeO2 | 59.1 | 0.23 | 14.3 |
| MnOx/CeO2 | 96.3 | 0.16 | 6.5 |
| Cu8Mn2/CeO2 | 40.1 | 0.22 | 24 |
3.7 H2-TPR
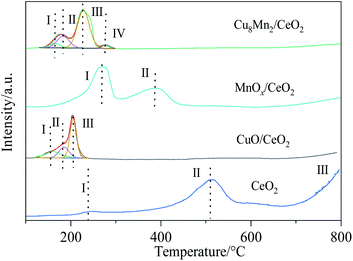
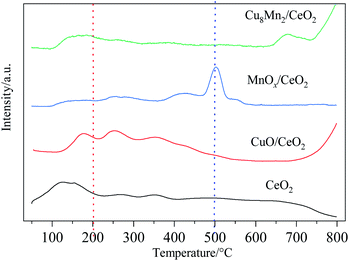
The reduction properties of CeO2, CuO/CeO2, MnOx/CeO2 and Cu8Mn2/CeO2 were investigated by H2-TPR analysis and the results were shown in Fig. 9. The reduction peaks of CeO2 have been detailed discussed in our previous work.8After peak fitting process, three reduction peaks were observed in the CuO/CeO2 spectra. The first peak at 158 °C were attributed to the reduction of finely dispersed CuO species on the CeO2 supports, the second peaks at 181 °C came from the reduction of CuO with moderate crystal size which interacted with the oxygen vacancies of CeO2 and the third peak at 212 °C was related to the reduction of a part of the surface ceria, the copper oxide incorporated into the ceria lattice and the large copper oxide phase. Compared with CeO2, the surface ceria reduction peak shifted to lower temperature, which could be assigned to the presence of hydrogen spillover process from metal Cu surface and the interaction between CuO and CeO2.34
For MnOx/CeO2, the first reduction peak at 250 °C was assigned to the reduction of MnO2 or Mn2O3 to Mn3O4, the second peak at 410 °C was related to the reduction of Mn3O4 to MnO and surface Ce4+ to Ce3+.35 The results indicated the interaction of MnOx and CeO2 were weaker than CuO and CeO2, which might help explain why CuO/CeO2 showed high catalytic activity than MnOx/CeO2. When loaded with MnOx, the Cu8Mn2/CeO2 not only exhibited the three reduction peaks corresponding to CuO/CeO2 but also showed the reduction peak of MnO2 or Mn2O3 to Mn3O4, while the reduction peak of Mn3O4 to MnO was not observed, implying the Mn4+ were more actively than Mn3+ or Mn4+. Combing with the XRD analysis, the MnOx had a high dispersion on the CeO2 support due its low content and the interaction between MnOx and CeO2 prevented the reduction of Mn3O4 to MnO. Compared with CuO/CeO2, the peak intensity of Cu8Mn2/CeO2 was improved and the H2 consumption also increased, which implied the Cu8Mn2/CeO2 showed high catalytic activity. The TPR peaks and H2 consumption of CuO/CeO2 and Cu8Mn2/CeO2 were summarized in Table S4.† In addition, the reduction peaks of Cu8Mn2/CeO2 were shifted to higher temperature region, which might be attributed to the formation of polymeride.36
3.8 NH3-TPD
In order to probe the acidity of CeO2, CuO/CeO2, MnOx/CeO2 and Cu8Mn2/CeO2 samples, the NH3-TPD analysis were carried out. As presented in Fig. 10, the NH3 desorption peaks could be divided into three parts: peaks at 100–200 °C were corresponded to the desorption of physically absorbed NH3 and NH3 absorbed on the weak Brønsted acid sites, the peaks at 200–500 °C were attributed to the desorption of NH4+ absorbed on the strong Brønsted acid sites and the peaks at above 500 °C were related to the desorption of NH3 absorbed on the weak and strong Lewis acid sites.37,38 The area of the NH3 desorption peaks directly related to the amount of acidic sites and their acidic strength, respectively. Quantitative analysis of NH3 desorption at corresponding temperature over all samples were calculated and the results were listed in Table S5.† It could be observed the total amount of acid sites of Cu8Mn2/CeO2 at lower temperature were improved and a desorption peak at above 500 °C region was observed, indicating the acidic strength of samples was enhanced when MnOx was introduced. Significantly, the NH3 desorption amount of Cu8Mn2/CeO2 was higher than CuO/CeO2 at 100–200 °C region, which implied the Cu8Mn2/CeO2 could bind more NH3 at lower temperature than CuO/CeO2. The stronger NH3 adsorption capacity of samples could enhance the absorption ability toward NH3 generated by catalytic hydrolysis and promote the conversion of NH3 to N2 which was consistent with the results of Fig. 3.3.9 BET analysis
The N2 desorption–desorption isotherms of CeO2, CuO/CeO2, MnOx/CeO2 as well as Cu8Mn2/CeO2 were displayed in Fig. 11. The adsorption–desorption isotherms of all samples showed a type IV trend with a H2-type hysteresis loop, implying the typical mesoporous structure of CeO2 was not influenced after metal oxides loaded.29 The pore size distribution of three catalytic materials were calculated and the results were shown as the insert part in Fig. 11. The textural properties including the specific surface area, pore volumes, and pore size were listed in Table 2. The specific surface area of three catalytic materials decreased while the pore volumes and pore size increased and Cu8Mn2/CeO2 showed the smallest specific surface area 40.1 m2 g−1 and largest pore size 24 nm respectively. These might be assigned to the fact that copper and manganese oxides covered the external surface of CeO2, and block the micropores structure, which was consistent with SEM analysis.13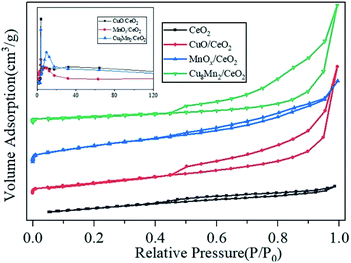 | ||
| Fig. 11 The nitrogen adsorption–desorption isotherms and pore size distributions of CeO2, CuO/CeO2, MnOx/CeO2 and Cu8Mn2/CeO2 samples. | ||
3.10 XPS analysis
By analyzing the reaction products, it could be obtained the HCN was mainly removed by catalytic hydrolysis and catalytic oxidation when the reaction temperature was higher than 90 °C. To further investigate the reaction mechanism between HCN and Cu8Mn2/CeO2, the XPS characterization was carried out to analyze the chemical state, surface atomic concentration and the dispersion of main elements of the samples before and after reaction and the results were summarized in the Table 3.| Samples | O (100%) | Cu (100%) | Ce (100%) | Mn (100%) | ||||||
|---|---|---|---|---|---|---|---|---|---|---|
| Oα | Oβ | Oγ | Cu2+ | Cu+ | Ce4+ | Ce3+ | Mn4+ | Mn3+ | Mn2+ | |
| Fresh | 54 | 35 | 11 | 31 | 44 | 73 | 27 | 21 | 54 | 0 |
| 30 °C | 47 | 31 | 22 | 25 | 52 | 68 | 32 | 18 | 33 | 19 |
| 90 °C | 65 | 26 | 9 | 19 | 58 | 65 | 35 | 14 | 48 | 11 |
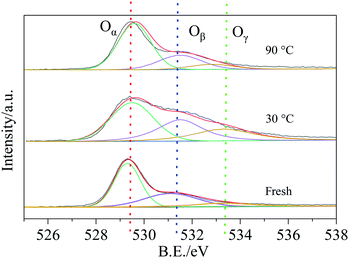
Fig. 12 showed the O 1s XPS spectra of the fresh samples and samples reacted at 30 °C and 90 °C. It could be observed an asymmetrical peak at the bonding energy range of 528–536 eV, which could be resolved into three distinct peaks: peak located at 529.5 eV (denoted as Oα) was ascribed to the lattice oxygen, peak located at 531.1 eV (denoted as Oβ) was corresponded to the surface chemisorption oxygen and the peak at 532.2 eV (denoted as Oγ) was assigned to the adsorbed water or surface OH species on the samples.39 The content of the Oα, Oβ and Oγ were calculated and listed in the Table 3. As presented in Table 3, after reacted with HCN at 30 °C, the Oβ content of Cu8Mn2/CeO2 decreased from 35% to 31% which indicated the Oβ took part in the HCN catalytic removal over the samples due to its higher mobility. The increase of Oγ content was attributed to the H2O in the reaction system absorbed on the surface of samples. With temperature increased further, the Oβ content decreased continuously and Oγ content also decreased, implying the catalytic hydrolysis activity enhanced, the Oβ and H2O absorbed worked together to contribute to the HCN catalytic removal over Cu8Mn2/CeO2.
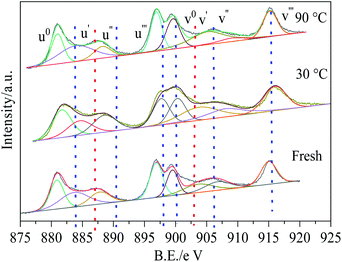
Ce 3d XPS spectra of Cu8Mn2/CeO2 were displayed in Fig. 13. After peak fitting process, it could be observed eight binding energy peaks at the bonding energy region of 875–925 eV. The binding energy peaks of u′ and v′ were assigned to the Ce3+ species while others were related to Ce4+ ions and the content of Ce3+ and Ce4+ were listed in the Table 3.40 With reaction temperature increased from 30 to 90 °C, the Ce3+ content increased from 27% to 35%, while the Ce4+ content decreased from 73% to 65%, owing to the synergy between Cu2+ and Cu3+ shown as following equation.41
| Ce4+ + Cu+ ⇌ Ce3+ + Cu2+ | (8) |
Oxygen vacancies could be generated as a function of surface Ce3+ on the samples, which could avoid the CuO particles agglomeration and improve its dispersion on CeO2 support by enhancing the synergy between CuO and CeO2.40 This could help explain why no diffraction peak of CuO was observed in the XRD patterns of Cu8Mn2/CeO2.
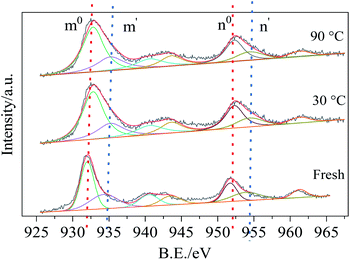
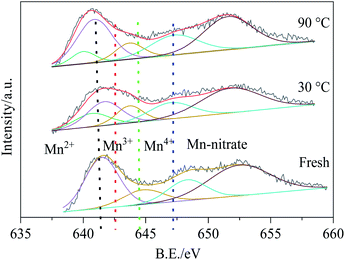
Cu 2p spectra were fitted with four energy peaks and the results were shown in Fig. 14, the bonding energy peaks m0, n0 represented Cu+ while m′, n′ peaks were related to Cu2+. After reacted with HCN, the Cu2+ decreased from 31% to 19% while Cu+ increased from 44% to 58%.42 It might be ascribed to the chemical interaction between CuO phase and HCN: HCN bonded with Cu2+ and generated CuCN due to chemisorption, and promote the reduction of Cu2+to Cu+, which implied the Cu2+ played an important role in the HCN catalytic removal over Cu8Mn2/CeO2.
Fig. 15 demonstrated the Mn 2p spectra of all samples, there were two main peaks at 642 eV and 653 eV, which were ascribed to the Mn 2p3/2 and Mn 2p1/2 respectively. The Mn 2p3/2 spectra could be decomposed into four bonding energy peaks: 640.3, 641.6, 643.2 and 646.2 eV, corresponding to Mn2+, Mn3+, Mn4+ and manganese nitrate.43 For the fresh Cu8Mn2/CeO2 samples, Mn3+ and Mn4+ peaks were observed while Mn2+ peak was not founded. When reacted with HCN at 30 °C, the Mn2+ content increased to 19% while Mn3+ and Mn4+ content all decreased, indicating the Mn3+ and Mn4+ participated in the HCN catalytic removal over Cu8Mn2/CeO2, and the reaction system referred the reduction of Mn4+ to Mn3+ and Mn3+ to Mn2+. With reaction temperature increased to 90 °C, the Mn3+ content still increased, while Mn3+ and Mn2+ content decreased, which demonstrated the HCN catalytic removal at 90 °C was mainly attributed to the reduction of Mn4+ to Mn3+. It could be deduced that Mn4+ played an important role in the investigated reactions, and the results were consistent with the H2-TPR analysis. Besides, the redox couple shown in following equation could also strengthen the samples' activity toward HCN.44
| Cu2+ + Mn3+ = Cu+ + Mn4+ | (9) |
3.11 The results of FT-IR
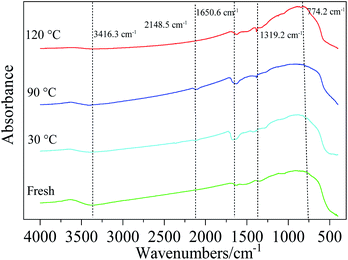
The FT-IR spectra of fresh and used Cu8Mn2/CeO2 which reacted with HCN at 30 °C, 90 °C and 120 °C were analyzed to investigate the reaction mechanism of HCN over prepared samples. As presented in Fig. 16, all samples exhibited two characteristic bonds at 3416.3 cm−1 and 1650 cm−1 corresponding to the stretching vibration of surface OH groups and the bending vibration of H2O adsorbed, which were beneficial to the HCN catalytic hydrolysis and oxidation.45 The absorption peak at 774.2 cm−1 was assigned to the Ce–O asymmetric vibrational stretch and peak at 1319.2 cm−1 might be attributed to the CO32− vibrational stretch.29 After reacted at 30 °C, a new peak appeared at 2148.5 cm−1 which was ascribed to the CN− vibrational stretch, indicating the HCN bonded with Cu2+ and generated CuCN due to chemisorption.46 When the reaction temperature increased to 90 °C, the peak at 2148.5 cm−1 could still be observed, which implied the chemisorption were still involved in the reaction system for removal of HCN. With temperature increased further, the peak corresponding to C![[double bond, length as m-dash]](https://www.rsc.org/images/entities/char_e001.gif) N vibrational stretch disappeared while other peaks were not changed, indicating the Cu8Mn2/CeO2 exhibited high stability in the reaction system, and the results were consistent with the XRD and ICP analysis shown in Fig. S10 and Table S6† respectively. The CN− absorbed might be converted into N2, NH3 and CO2 with the participation of O2, H2O and OH species. As a result, the active site on the Cu8Mn2/CeO2 was supplemented, which could capture more HCN molecular to strengthen the catalytic activity of the samples.
N vibrational stretch disappeared while other peaks were not changed, indicating the Cu8Mn2/CeO2 exhibited high stability in the reaction system, and the results were consistent with the XRD and ICP analysis shown in Fig. S10 and Table S6† respectively. The CN− absorbed might be converted into N2, NH3 and CO2 with the participation of O2, H2O and OH species. As a result, the active site on the Cu8Mn2/CeO2 was supplemented, which could capture more HCN molecular to strengthen the catalytic activity of the samples.
4 Discussion
Based activity test results, the Cu8Mn2/CeO2 was chosen as the ideal catalytic material. It was believed the CeO2 still played an important role in the HCN catalytic removal over Cu8Mn2/CeO2. Combing the SEM and TEM analysis, the CeO2 exhibited a 3D porous structure which was beneficial for gas transport.29 The flowerlike sphere structure of CeO2 could also improve the dispersion of metal species.21 Besides, the addition of MnOx could restrain the growth of CuO particles and improve their dispersion on the CeO2 by the synergistic effect according to the XRD results, which promoted the removal of HCN over Cu8Mn2/CeO2 sample. H2-TPR analysis indicated the redox ability of CeO2 was enhanced after CuO and MnOx loaded, as reported, the excellent activity of CeO2 based catalysts derived from the revisable Ce3+–Ce4+ transition in CeO2 support associated with oxygen vacancy formation and migration which might strengthen the interaction between CuO, MnOx and CeO2 support and promoted its redox ability.47The CuO phase on the CeO2 played an important role in the HCN removal process, the HCN was absorbed on the Cu8Mn2/CeO2 to generate CuCN by the reduction of Cu2+ to Cu+. The reaction products of HCN over Cu8Mn2/CeO2 at the temperature region of 30–150 °C indicated the catalytic hydrolysis and catalytic oxidation improved as temperature increasing. Combing the XPS analysis, the chemisorption oxygen, the oxygen vacancies, the Cu2+ and Mn4+ all played an important role in determining the excellent HCN removal performance of Cu8Mn2/CeO2. NH3-TPD characterization indicated the addition of MnOx could increase the acid sites of Cu8Mn2/CeO2, which could strengthen the absorption ability of NH3 and promoted its conversion.
Based the FT-IR results, the CN− absorbed on the samples disappeared when the reaction temperature was above 120 °C, this could be explained by the totally conversion of CN−. At this moment, the HCN removal was completely in the form of catalytic hydrolysis and catalytic oxidation. When the temperature was lower than 30 °C, the removal of HCN was mainly attributed to the sample's chemisorption. The HCN breakthrough behavior on the catalytic materials bed was corresponded to the Yoon and Nelson's model.
Based above analysis, the HCN reaction mechanism over Cu8Mn2/CeO2 at 30–150 °C was described as follows: HCN was first absorbed and then decomposed into CN− on the surface of Cu8Mn2/CeO2 due to the chemisorption of bimetal oxides on the CeO2. With reaction temperature increased, the CN− could be oxidized into –NCO with the participation of Oβ, Cu2+, Mn4+ and oxygen vacancies.10,12 The formed –NCO were further converted into NH3 and CO by catalytic hydrolysis. On the other hand, the generated –NCO species were oxidized to form CO2, N2 and byproducts such as NO and NO2 by catalytic oxidation. The schematical diagram of the HCN reaction mechanism over Cu8Mn2/CeO2 was shown in Fig. S11.†
5 Conclusions
The CuxMny/CeO2 catalytic material was synthesized by precipitation method to achieve deep purification of HCN at the lower temperature region of 30–150 °C. By investigating the effect of different metal oxide species and the Cu/Mn mass ratio on the sample's catalytic activity, the Cu8Mn2/CeO2 sample was chosen as the ideal catalytic material, which could obtain almost 100% removal rate toward 400 mg m−3 HCN at 90 °C. The introduction of MnOx could improve the dispersion of CuO particles and increase the total acid sites of the prepared samples. It was proved the synergy between CuO and MnOx, the chemisorption oxygen, the oxygen vacancies, the Cu2+ and Mn4+ all played an important role in determining the good catalytic activity of the prepared samples.Author contributions
Z. H. Yi: conceptualization, formal analysis, investigation, writing original draft. J. Sun: funding acquisition, formal analysis, Rresources, writing review and editing. Y. L. Yang: data curation. J. G. Li: investigation. T. Zhou: investigation. S. P. Wei: investigation. A. N. Zhu: investigation.Conflicts of interest
There are no conflicts to declare.Acknowledgements
The authors acknowledge the Scientific Research Program (Zhuangzong [2018] No. 635) foundation and the Chinese Civil Air Defense Office [2014] No. 251-61 for the financial support of the current study.References
- P. Dagaut, P. Glarborg and M. U. Alzueta, The oxidation of hydrogen cyanide and related chemistry, Prog. Energy Combust. Sci., 2008, 34, 1–46 CrossRef CAS.
- T. M. Oliver, K. P. Aleksandar and D. Nikola, Synthetic activated carbons for the removal of hydrogen cyanide from air, Chem. Eng. Process., 2005, 44, 1181–1187 CrossRef CAS.
- M. M. Baum, J. A. Moss, S. H. Pastel and G. A. Poskrebyshev, Hydrogen Cyanide Exhaust Emissions from In-Use Motor Vehicles, Environ. Sci. Technol., 2007, 41, 857–862 CrossRef CAS.
- J. P. Hämäläinen, M. J. Aho and J. L. Tummavuori, Formation of nitrogen oxides from fuel-N through HCN and NH3: a model-compound study, Fuel, 1994, 73, 1894–1898 CrossRef.
- M. Jiang, Z. H. Wang, P. Ning, S. L. Tian, X. F. Huang, Y. W. Bai, Y. Shi, X. G. Ren and W. Chen, Dust removal and purification of calcium carbide furnace off-gas, J. Taiwan Inst. Chem. Eng., 2014, 45, 901–907 CrossRef CAS.
- J. A. Miller and C. T. Bowman, Mechanism and modeling of nitrogen chemistry in combustion, Prog. Energy Combust. Sci., 1989, 15, 287–338 CrossRef CAS.
- M. Devadas, O. Kroecher, M. Elsener and A. Wokaun, Influence of NO2 on the selective catalytic reduction of NO with ammonia over Fe-ZSM5, Appl. Catal., B, 2006, 67, 187–196 CrossRef CAS.
- Z. H. Yi, J. Sun, J. G. Li, T. Zhou, S. P. Wei, H. J. Xie and Y. L. Yang, High efficient removal of HCN over porous CuO/CeO2 micro–nano spheres at lower temperature range, Chin. J. Chem. Eng., 2020 DOI:10.1016/j.cjche.2020.08.029.
- N. Liu, X. N. Yuan, B. H. Chen, Y. X. Li and R. D. Zhang, Selective catalytic combustion of hydrogen cyanide over metal modified zeolite catalysts: from experiment to theory, Catal. Today, 2017, 297, 201–210 CrossRef CAS.
- R. N. Nickolov and D. R. Mehandjiev, Comparative study on removal efficiency of impregnated carbons for hydrogen cyanide vapors in air depending on their phase composition and porous textures, J. Colloid Interface Sci., 2004, 273, 87–94 CrossRef CAS.
- M. J. Hudson, J. P. Knowles and P. J. F. Harris, The trapping and decomposition of toxic gases such as hydrogen cyanide using modified mesoporous silicates, Microporous Mesoporous Mater., 2004, 75, 121–128 CrossRef CAS.
- Y. X. Ma, F. Wang, X. Q. Wang, P. Ning, X. Jing and J. H. Cheng, The hydrolysis of hydrogen cyanide over Nb/La-TiOx catalyst, J. Taiwan Inst. Chem. Eng., 2017, 70, 141–149 CrossRef CAS.
- Y. N. Hu, J. P. Liu, J. H. Cheng, L. L. Wang, L. Tao, Q. Wang, X. Q. Wang and P. Ning, Coupling catalytic hydrolysis and oxidation of HCN over HZSM-5 modified by metal (Fe,Cu) oxides, Appl. Surf. Sci., 2017, 427, 843–850 CrossRef.
- X. Q. Wang, J. H. Cheng, X. Y. Wang, Y. Z. Shi, F. Y. Chen, X. L. Jing, F. Wang, Y. X. Ma, L. L. Wang and P. Ning, Mn based catalysts for driving high performance of HCN catalytic oxidation to N2 under micro-oxygen and low temperature conditions, Chem. Eng. J., 2018, 333, 402–413 CrossRef CAS.
- Y. S. She, Q. Zheng and L. Li, Rare earth oxide modified CuO/CeO2 catalysts for the water-gas shift reaction, Int. J. Hydrogen Energy, 2009, 34, 8929–8936 CrossRef CAS.
- E. S. Ranganathan, S. K. Bej and L. T. Thompson, Methanol steam reforming over Pd/ZnO and Pd/CeO2 catalysts, Appl. Catal., A, 2005, 289, 153–162 CrossRef CAS.
- J. Lu, H. Gao, S. Shaikhutdinov and H. J. Freund, Morphology and defect structure of the CeO2(111) films grown on Ru(0001) as studied by scanning tunneling microscopy, Surf. Sci., 2006, 600, 5004–5010 CrossRef CAS.
- N. Singhania, E. A. Anumol, N. Ravishankar and G. Madras, Influence of CeO2 morphology on the catalytic activity of CeO2–Pt hybrids for CO oxidation, Dalton Trans., 2013, 42, 15343–15354 RSC.
- J. F. Chen and H. Yi, Self-assembly of flower-like CeO2 microspheres via a template-free synthetic approach and its use as support in enhanced CO and benzene oxidation activity, Adv. Mater. Res., 2011, 310, 656–661 Search PubMed.
- H. Li, G. Lu, Y. Wang and Y. Guo, Synthesis of flower-like La or Pr-doped mesoporous ceria microspheres and their catalytic activities for methane combustion, Catal. Commun., 2010, 11, 946–950 CrossRef CAS.
- L. Tan, Q. Tao, H. Gao and J. Li, Preparation and catalytic performance of mesoporous ceria-base composites CuO/CeO2, Fe2O3/CeO2 and La2O3/CeO2, J. Porous Mater., 2016, 24, 795–803 CrossRef.
- C. W. Sun, H. Li and L. Q. Chen, Study of flowerlike CeO2 microspheres used as catalyst supports for CO oxidation reaction, J. Phys. Chem. Solids, 2007, 68, 1785–1790 CrossRef CAS.
- G. K. Prasad, J. P. Kumar and P. V. R. K. Ramacharyulu, Impregnated charcoal cloth for the treatment of air polluted with hydrogen cyanide, Environ. Prog. Sustainable Energy, 2013, 32, 715–720 CrossRef CAS.
- R. N. Nickolov and D. R. Mehandjiev, Comparative study on removal efficiency of impregnated carbons for hydrogen cyanide vapors in air depending on their phase composition and porous textures, J. Colloid Interface Sci., 2004, 273, 87–94 CrossRef CAS.
- Y. J. Li, H. Yang, Y. C. Zhang, J. Hu, J. H. Huang, P. Ning and S. L. Tian, Catalytic decomposition of HCN on copper manganese oxide at low temperatures: performance and mechanism, Chem. Eng. J., 2018, 346, 621–629 CrossRef CAS.
- E. C. Njagi, C. H. Chen, H. Genuino, H. Galindo, H. Huang and S. L. Suib, Total oxidation of CO at ambient temperature using copper manganese oxide catalysts prepared by a redox method, Appl. Catal., B, 2010, 99, 103–110 CrossRef CAS.
- L. Chmielarz, P. Kuśtrowski, R. Dziembaj and E. F. Vansant, Catalytic performance of various mesoporous silicas modified with copper or iron oxides introduced by different ways in the selective reduction of NO by ammonia, Appl. Catal., B, 2006, 62, 369–380 CrossRef CAS.
- P. W. Ye, Z. Q. Luan and K. Li, The use of a combination of activated carbon and nickel microfibers in the removal of hydrogen cyanide from air, Carbon, 2009, 47, 1799–1805 CrossRef CAS.
- C. W. Sun, J. Sun, G. L. Xiao, H. R. Zhang, X. P. Qiu, H. Li and L. Q. Chen, Mesoscale organization of nearly monodisperse flowerlike ceria microspheres, J. Phys. Chem. B, 2006, 110, 13445–13452 CrossRef CAS.
- J. F. Li, G. Z. Lu, H. F. Li, Y. Q. Wang and Y. Guo, Facile synthesis of 3D flowerlike CeO2 microspheres under mild condition with high catalytic performance for CO oxidation, J. Colloid Interface Sci., 2011, 360, 93–99 CrossRef CAS.
- B. Yang, W. Deng, L. Guo and T. Ishihara, Copper–ceria solid solution with improved catalytic activity for hydrogenation of CO2 to CH3OH, Chin. J. Catal., 2020, 41, 1348–1359 CrossRef CAS.
- A. Zhou, J. Wang and H. Wang, Effect of active oxygen on the performance of Pt/CeO2 catalysts for CO oxidation, J. Rare Earths, 2018, 36, 257–264 CrossRef CAS.
- R. Xu, X. Wang, D. S. Wang, K. B. Zhou and Y. D. Li, Surface structure effects in nanocrystal MnO2 and Ag/MnO2 catalytic oxidation of CO, J. Catal., 2006, 237, 426–430 CrossRef CAS.
- W. J. Shen, C. Liu, H. J. Guo, L. H. Yang, X. N. Wang and Z. C. Feng, Synthesis of Zero, One, and Three Dimensional CeO2 Particles and CO Oxidation over CuO/CeO2, Chin. J. Catal., 2011, 32, 1136–1141 Search PubMed.
- B. Guan, H. Lin, L. Zhu and Z. Huang, Selective Catalytic reduction of NOx with NH3 over Mn Ce substitution Ti0.9V0.1O2−δ nanocomposites catalysts prepared by self-propagating high-temperature synthesis method, J. Phys. Chem. C, 2011, 15, 12850–12863 CrossRef.
- X. Chen, S. A. C. Carabineiro and P. B. Tavares, Catalytic oxidation of ethyl acetate over La–Co and La–Cu oxides, J. Environ. Chem. Eng., 2014, 1, 344–355 CrossRef.
- L. Chmielarz, R. Dziembaj, T. Grzybek, J. Klinik, T. Łojewski, D. Olszewska and H. Papp, Pillared smectite modified with carbon and manganese as catalyst for SCR of NOx with NH3. Part I. General characterization and catalyst screening, Catal. Lett., 2000, 68, 95–100 CrossRef CAS.
- Q. Jin, Y. He, M. Miao, C. Guan, Y. Du, J. Feng and D. Li, Highly selective and stable PdNi catalyst derived from layered double hydroxides for partial hydrogenation of acetylene, Appl. Catal., A, 2015, 500, 3–11 CrossRef CAS.
- W. J. Zhu, X. Chen, J. H. Jin, X. Di, C. H. Liang and Z. M. Liu, Insight into catalytic properties of Co3O4–CeO2 binary oxides for propane total oxidation, Chin. J. Catal., 2020, 41, 679–690 CrossRef CAS.
- X. J. Yao, L. Chen, T. T. Kong, S. M. Ding, Q. Luo and F. M. Yang, Support effect of the supported ceria-based catalysts during NH3–SCR reaction, Chin. J. Catal., 2017, 38, 1423–1430 CrossRef CAS.
- R. W. Tarnuzzer, J. Colon, S. Patil and S. Seal, Vacancy engineered ceria nanostructures or protection from radiation-induced cellular damage, Nano Lett., 2005, 5, 2573–2577 CrossRef CAS.
- Q. Wang, X. Wang, L. Wang, Y. N. Hu, P. Ning, Y. X. Ma and L. M. Tan, Catalytic oxidation and hydrolysis of HCN over LaxCuy/TiO2 catalysts at low temperatures, Microporous Mesoporous Mater., 2019, 282, 260–268 CrossRef CAS.
- B. R. Strohmeier and D. M. Hercules, Surface spectroscopic characterization of manganese/aluminum oxide catalysts, J. Phys. Chem., 1984, 88, 4922–4929 CrossRef CAS.
- W. S. Kijlstra, J. C. M. L. Daamen, J. M. Graaf, E. K. Poels and A. Bliek, Inhibiting and deactivating effects of water on the selective catalytic reduction of nitric oxide with ammonia over MnOx/Al2O3, Appl. Catal., B, 1996, 7, 337–357 CrossRef CAS.
- G. D. Ramis, L. Yi, G. D. Busca, M. Turco, E. Kotur and R. J. Willey, Adsorption, activation, and oxidation of ammonia over SCR catalysts, J. Catal., 1995, 157, 523–535 CrossRef CAS.
- J. J. Zhang, Z. G. Feng, J. T. Lu and C. S. Cha, Ex situ FTIR reflection–absorption spectroscopic studies of surface films on copper electrode formed in cyanide and thiocyanate solutions, Chin. J. Inorg. Chem., 1990, 6, 319–323 CAS.
- N. V. Skorodumova, S. I. Simak, B. I. Lundqvist and B. Johansson, Quantum origin of the oxygen storage capability of ceria, Phys. Rev. Lett., 2002, 89, 166601–166604 CrossRef CAS.
Footnote |
| † Electronic supplementary information (ESI) available. See DOI: 10.1039/d0ra10177j |
| This journal is © The Royal Society of Chemistry 2021 |

