DOI:
10.1039/D0RA09976G
(Paper)
RSC Adv., 2021,
11, 1077-1085
One-step preparation of eggplant-derived hierarchical porous graphitic biochar as efficient oxygen reduction catalyst in microbial fuel cells†
Received
25th November 2020
, Accepted 18th December 2020
First published on 4th January 2021
Abstract
A one-step strategy for synthesizing eggplant-derived hierarchical porous graphitic biochar was proposed herein. Potassium trioxalatoferrate(III) trihydrate (K3[Fe(C2O4)3]·3H2O) was used to achieve synchronous carbonization and graphitization. Compared with the common two-step synthesis method, this one-step strategy is more efficient, economical, and green. The eggplant-derived biochar with K3[Fe(C2O4)3]·3H2O activation prepared at 800 °C (referred to as EPGC-800-2) exhibited a hierarchical porous structure with a large specific surface area (1137 m2 g−1) and high graphitization degree. The EPGC-800-2 catalyst possessed good electrochemical performance in neutral medium, with an onset potential of 0.766 V and half-wave potential of 0.591 V (vs. RHE), compared with the Pt/C cathode (0.740 V and 0.583 V vs. RHE, respectively). Moreover, a microbial fuel cell employing EPGC-800-2 had a maximum power density of 667 mW m−2, which is superior to Pt/C catalyst (621 mW m−2). The work provided a promising way to prepare hierarchical porous graphitic biochar as an excellent electrochemical catalyst for microbial fuel cells.
1. Introduction
Achieving sustainable development faces the double pressure from the energy shortage and environmental pollution. Therefore, developing sustainable and clean energy to meet future development demands is urgent. Microbial fuel cells (MFCs), as a green technology for simultaneous electricity generation and wastewater treatment, have been extensively researched.1,2 Among numerous MFC configurations, air-cathode MFCs have drawn attention for large-scale applications with a simple structure, high efficiency, and lack of restricted accessibility to oxygen. However, resulting from the sluggish kinetics and high overpotential of the oxygen reduction reaction (ORR), the power performance of air-cathode MFCs is limited, which hinders their application.3 Platinum-based materials have high ORR catalyst performance, while high cost and poor stability of Pt present a major challenge for commercial popularization.4,5 Hence, it is necessary to develop cheap, efficient, and stable ORR catalysts.6
Among numerous candidate materials, carbon-based materials are considered one of the most potential alternatives with their cheap, rich specific surface area (SSA), and excellent chemical stability. Hierarchical porous carbons (HPCs), as novel carbon materials, have received widespread interest as ORR catalysts in recent years. The rich porosity results in both high SSA and large pore volume, which can increase the contact area between electrode and electrolyte and expose more ORR sites. The pores of different sizes can overcome the shortcomings of porous carbons with a single channel, where the micropores can provide additional ORR sites, and the mesopores and macropores can shorten the ion diffusion distance, as well as accelerate ion transport between the electrolyte and the surface of the micropores.7,8 The high conductivity is important for achieving ORR activity carbon materials, where low-resistance channels can be achieved and ion diffusion can be facilitated. Increase the graphitization degree can achieve high conductivity of carbon materials. Catalytic graphitization with the addition of transition metals (such as Co, Fe) and their oxides is currently the most common method of preparing graphitic carbon.9 However, porous structure and high conductivity of carbon materials are incompatible in some cases.10,11 Therefore, it is significant to rationally regulate the structure of carbon materials to balance the conflict between their abundant porous structure and high graphitization degree to improve the electrochemical properties.
In recent years, researchers have made intensive attempts to simultaneously achieve high SSA and good electrical conductivity of carbon materials. Wang et al. increased graphitization degree by Ni(NO3)2 impregnation during the carbonization process at 400 °C of the whey protein-derived carbon, and then employed KOH activation at 700 °C to improve the SSA. The as-prepared materials exhibited large SSA (2536 m2 g−1) and high graphitization degree, and showed excellent, stable capacitance in supercapacitor.12 Chang et al. prepared porous graphitic carbon at 700 °C by using Co(NO3)2 as the graphitization catalyst and KOH as the activation agent.13 All these studies have proved that porous graphitic carbon materials have excellent electrochemical properties. However, some drawbacks, such as the two-step synthesis strategy, which is time-consuming, and most of the reagents, including KOH, Fe(NO3)3, and Co(NO3)2 are toxic corrosive. Therefore, it is necessary to develop remarkable ORR catalysts from low-cost resources through a green and straightforward way.
Biomass has recently received widespread attention as a perfect carbon-based materials precursor because of its commercial available, regenerability, and environmental safety. There are some excellent ORR catalysts were obtained from biomass, such as egg14, cattle bones,15 and tea.16 Eggplant, having a layered microstructure with a high hydrocarbon content, is an ideal precursor for preparing porous carbon materials via carbonization. Moreover, eggplant is nitrogen-rich and thus can afford nitrogen self-doped carbon materials.17 Some researchers have prepared eggplant-derived porous carbon with good electrochemical property in supercapacitor fields;18,19 nevertheless, there is no report on the eggplant-derived hierarchical porous graphitic carbon preparation and its application for MFCs as cathode ORR catalysts.
Here, a one-step synthesis of eggplant-derived hierarchical porous graphitic carbon (EPGC) using K3[Fe(C2O4)3]·3H2O as both the activator (K2C2O4) and graphitization catalyst (FeC2O4) was present. As an ideal chemical actinometer and good organic reaction catalyst, K3[Fe(C2O4)3]·3H2O plays an key role for wastewater treatment and photodegradation of water-soluble dyes.20 The entire synthesis process of EPGC is simple and safe. The as-prepared EPGC-800-2 exhibits a hierarchical porous structure with a large SSA (1137 m2 g−1), a high graphitization degree, and appropriate N doping. The EPGC-800-2 catalyst also shows excellent ORR activity and delivered a considerable power output in air-cathode MFCs. This strategy provides a green and simple approach of preparing porous graphitic carbon from biomass as a good ORR catalysts in MFCs.
2. Material and methods
2.1 Preparation of eggplant-derived biochar
The eggplant was first peeled and shredded to obtain fragments, washed with deionized (DI) water, and dried in an oven at 100 °C for 8 h. Thereafter, 10 g eggplant was immersed overnight in 300 mL of K3[Fe(C2O4)3] solution of different concentrations at the weight ratios ranging from 1 to 3 (K3[Fe(C2O4)3]: eggplant). The dried mixture was then transferred to a tubular furnace and pyrolyzed at 800 °C under an N2 protection for 1 h at a heating rate of 5 °C min−1. After cooling to room temperature, the products were fully immersed in a 2 M HCl solution overnight to remove Fe and other metal oxides, washed with DI water untill neutral, then dried at 70 °C for 8 h. To investigate the role of the activation temperature on the SSA and changes in the pore structure of the carbon materials, the dried eggplant with K3[Fe(C2O4)3] at a ratio of 1![[thin space (1/6-em)]](https://www.rsc.org/images/entities/char_2009.gif) :2 was pyrolyzed at 700, 800, and 900 °C. The products are denoted as EPGC-X-Y, where X is the activation temperature, Y is the weight ratio of K3[Fe(C2O4)3]/eggplant. In addition, the control samples with K2C2O4 (EPC: eggplant-derived porous carbon) or FeC2O4 (EGC: eggplant-derived graphitic carbon) as a catalyst to replace K3[Fe(C2O4)3], under the same synthesis conditions used for EPGC-800-2.
:2 was pyrolyzed at 700, 800, and 900 °C. The products are denoted as EPGC-X-Y, where X is the activation temperature, Y is the weight ratio of K3[Fe(C2O4)3]/eggplant. In addition, the control samples with K2C2O4 (EPC: eggplant-derived porous carbon) or FeC2O4 (EGC: eggplant-derived graphitic carbon) as a catalyst to replace K3[Fe(C2O4)3], under the same synthesis conditions used for EPGC-800-2.
2.2 Material characterization
The materials were characterized by scanning electron microscopy (SEM, Quattro S, Thermo Fisher Scientific, USA) with an attached energy dispersive X-ray spectrometry (EDS) system and TEM (FEI Tecnai G2 F20). Nitrogen adsorption/desorption test was performed at liquid nitrogen temperature (77 K) on a physical adsorption apparatus (ASAP2460, Micromeritics Instruments, USA).Moreover, X-ray diffraction (XRD, Bruker D8 Advance, Germany) was performed in the 2θ range 20–80° with Cu Kα radiation, while Raman spectroscopy (Renishaw Invia, UK) was conducted at an excitation wavelength of 532 nm. X-ray photoelectron spectroscopy (XPS, ESCALAB250Xi, Thermo Fisher Scientific, USA) was accomplished on an X-ray diffractometer equipped with a monochromatic Al Kα source.
2.3 Electrochemical characterization
CV and Tafel plot analyses were performed using a CHI 660E potentiostat (Shanghai Chenhua Co., China) in a three-electrode equipment. The working electrode was a 4 mm diameter glassy carbon electrode; a Ag/AgCl electrode and a 1 cm2 platinum wire served as the reference electrode and counter electrode, respectively. The RRDE analyse was performed using a CHI 760E potentiostat, and a rotating ring/disk electrode with a glassy carbon disk (5.61 mm in diameter) was the working electrode, the reference electrode and counter electrode were same with CV tests. All potentials could be converted to a reversible hydrogen electrode (RHE) according to Text S1.† The method to prepare the catalyst ink was to disperse catalyst powder (5 mg) into DI water (500 μL), ethanol (250 μL), and Nafion solution (5 wt%, 50 μL) mixture, followed by sonication for 20 min to disperse uniformly, then dripped onto the glassy carbon electrode (0.4 mg cm−2 catalyst loading) and dried at room temperature.
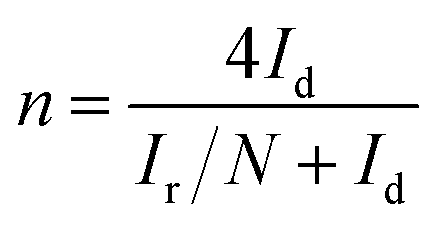
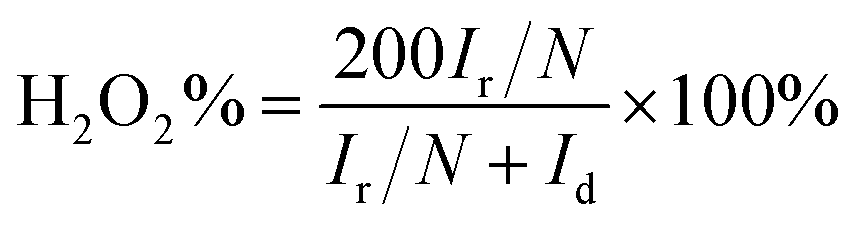
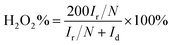
Cyclic voltammetry (CV) tests were conducted from −0.8 to 0.4 V (vs. Ag/AgCl) at 5 mV s−1 in O2/N2-saturated 50 mM phosphate-buffered saline (PBS) solution. Tafel plots were performed by sweeping the overpotential (0–100 mV) in O2-saturated PBS solution at 1 mV s−1. The rotating ring disk electrode (RRDE) tests were performed from −0.6 to 0.4 V (vs. Ag/AgCl) at 5 mV s−1 in O2-saturated PBS solution under 1600 rpm. The ring potential was set at 0.60 V. The yield of hydrogen peroxide (H2O2%) and number of transferred electrons (n) were calculated as21
| |
 | (1) |
| |
 | (2) |
where
N is the collection efficiency of the Pt ring (
N = 0.37), and
Id and
Ir are the disk and ring currents, respectively.
2.4 Microbial fuel cell operations
Single-chamber air-cathode MFC (4.0 cm in length, 3.0 cm in diameter) was assembled with Plexiglas. The details of the synthesis of the air cathodes and anodes are listed in the Text S2.† The anode and cathode were linked through a titanium wire a 4 cm separation. The external resistance was 1000 Ω. The anode was inoculated using anaerobic sludge collected from a wastewater treatment plant (Chongqing, China). The nutrient solution contained sodium acetate (1 g L−1), trace mineral (12.5 mL L−1), and vitamin (5 mL L−1) in 50 mM PBS solution;22 the specific contents of PBS, vitamin, and trace mineral solution are summarized in the ESI.† MFCs were operated under fed-batch conditions at 28 ± 1 °C, and the anode nutrient solution was replaced when the voltage was lower than 50 mV.
The voltage, polarization curves, and power density of the MFCs were obtained as in our previous study.23 The Chemical Oxygen Demand (COD) was obtained through a portable spectrophotometer in accordance with the manufacturer's procedure (DR5000, HACH Co., USA), and the coulombic efficiency (CE) was calculated refers to Logan et al. method.24
3. Results and discussion
3.1 Material characterization
The morphology of the synthesized materials was observed by SEM in Fig. 1(a)–(f), the EPGC-800-2 exhibited an abundant 3D honeycomb pores structure after the carbonization processes. This structure could increase the SSA and facilitate the electrolyte penetration. The pores of EPGC-700-2 and EPGC-800-1 were not very transparent due to the lower temperatures and small amount of activator, respectably. While the original structure of EPGC-900-2 and EPGC-800-3 indicated that too high a temperature and excess activation would destroy the pore structure. The EDS results [Fig. 1(g)–(i)] of EPGC-800-2 indicated that C, N, and O were dispersed in the materials. The TEM images [Fig. 1(j)] revealed distinguishable porous structure of EPGC-800-2 material with alternating light and dark areas, and an evident lattice fringes with a 0.34 nm distance was further found in the high-resolution TEM image [Fig. 1(k)], indicating the typical graphite (002) plane.25
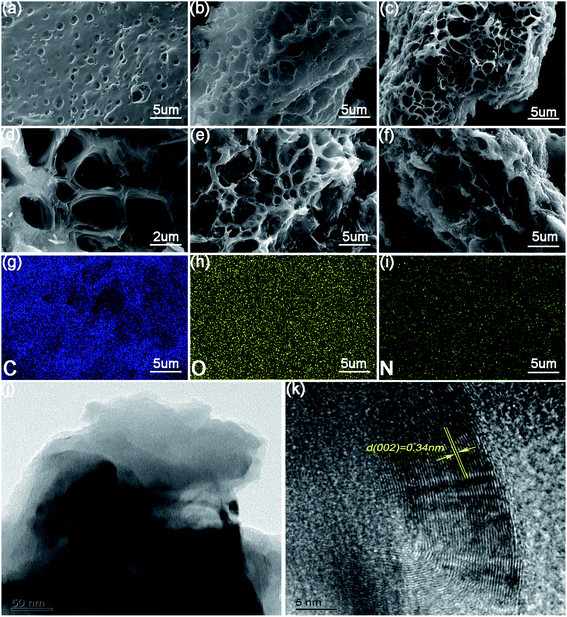 |
| | Fig. 1 SEM images of (a) EPGC-700-2, (b) EPGC-800-1, (c and d) EPGC-800-2, (e) EPGC-800-3, and (f) EPGC-900-2; element mapping images of (g) C, (h) O, (i) N, and (j and k) TEM images of EPGC-800-2. | |
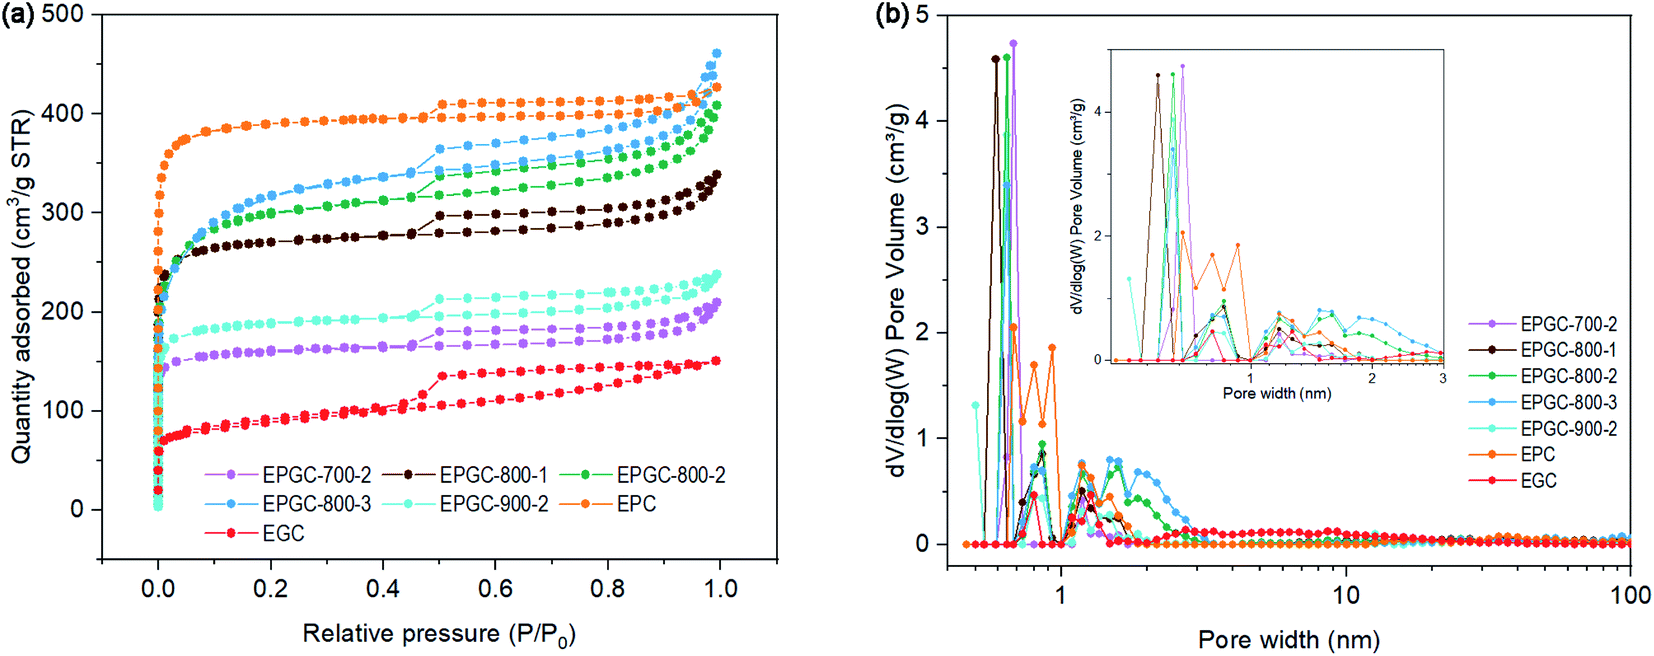
Fig. 2(a) displays N2 adsorption–desorption test results of EPGC materials. All materials exhibited apparent type I and type IV combined isotherms, and H4 type hysteresis loops were observed under moderate relative pressure, indicating those materials had a microporous and mesoporous structure. At higher relative pressures, EPGC-800-2 and EPGC-800-3 have a slight upward trend, indicating the existence of a macroporous structure.26,27 The activation mechanism is ascribed to K2CO3 derived from the continuous decomposition reaction of K3[Fe(C2O4)3]·3H2O. As shown in eqn (3)–(7), K3[Fe(C2O4)3]·3H2O decomposes into K2C2O4, FeC2O4, CO2, and H2O over 230 °C, and then K2C2O4 decomposes into K2CO3 and CO at 500 °C and above.28 For the activation mechanism, K2CO3 was first decomposed into K2O and CO2 at temperatures above 700 °C, and was fully consumed at 800 °C, K2O is reduced by carbon. Moreover, K, CO2, and CO can etched carbon atomic layers to produce abundant pores structure. Excess potassium salt can be removed by sufficient acid washing treatment, which can further form additional pores and increase SSAs of materials.29,30
| | |
2K3[Fe(C2O4)3]·3H2O → 3K2C2O4 + 2FeC2O4 + 2CO2 + 3H2O
| (3) |
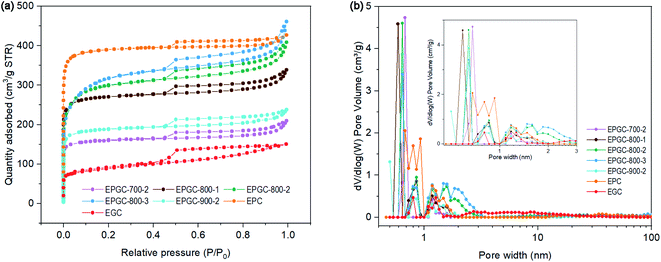 |
| | Fig. 2 (a) N2 adsorption–desorption isotherms, and (b) the pore size distribution curves of EPGC materials. | |
The SSAs and pore volumes of all EPGC materials are presented in Table 1, the SSAs and pore volumes exhibit a tendency of increasing first, then decreasing and obtaining a largest SSA at EPGC-800-2 when the activation temperature increases. The SSAs and pore volumes of materials gradually increased with increasing graphitization levels, EPGC-800-3 had a slightly bigger SSA than EPGC-800-2, owing to its excess activation degree which resulted in some microporous structures collapse. Fig. 2(b) exhibits the pore size distribution of all EPGC catalysts, where micropores were the main species in the pore size distribution plot. The ratio of micropore surface area (% Smicro) was calculated and summarized in Table 1. The % Smicro was close for all samples, irrespective of the activation temperature, whereas the activation degree had an obvious effect on the % Smicro. At the low activation degree, part of the material is not fully activated, and the material mainly contains micropores. When the degree of activation increased, the activator reacts completely with the material and forms rich pore structure. However, with a further increase in the activation degree, some of the micropores are damaged and the pores structure collapses, thereby forming more mesopores and macropores. The results are consistent with those of Zhou et al. work.31 Moreover, a very small SSA (273 m2 g−1) of MPGC without K2C2O4 addition indicates that K2C2O4 plays an important role for increasing the SSA. Hence, the large SSA and suitable pore size distribution of EPGC-800-2 are beneficial to supply sufficient ORR active sites, which is expected to lead to better ORR performance.
Table 1 Pore structure parameters for the samples
| Materials |
SBETa (m2 g−1) |
Smicrob (m2 g−1) |
Vtotalc (cm3 g−1) |
Vmicrod (cm3 g−1) |
% Smicro |
% (Smeso + Smacro) |
| Specific surface area. Micropores surface area. Total pore volume. Micropores volume. |
| EPGC-700-2 |
637 |
494 |
0.323 |
0.213 |
77.6 |
22.4 |
| EPGC-800-1 |
1080 |
949 |
0.523 |
0.361 |
87.9 |
12.1 |
| EPGC-800-2 |
1137 |
833 |
0.633 |
0.451 |
73.3 |
26.7 |
| EPGC-800-3 |
1181 |
659 |
0.710 |
0.262 |
55.8 |
44.2 |
| EPGC-900-2 |
744 |
564 |
0.367 |
0.244 |
75.8 |
24.2 |
| EPC |
1076 |
1053 |
0.660 |
0.597 |
97.8 |
2.2 |
| EGC |
273 |
173 |
0.232 |
0.097 |
63.3 |
36.7 |
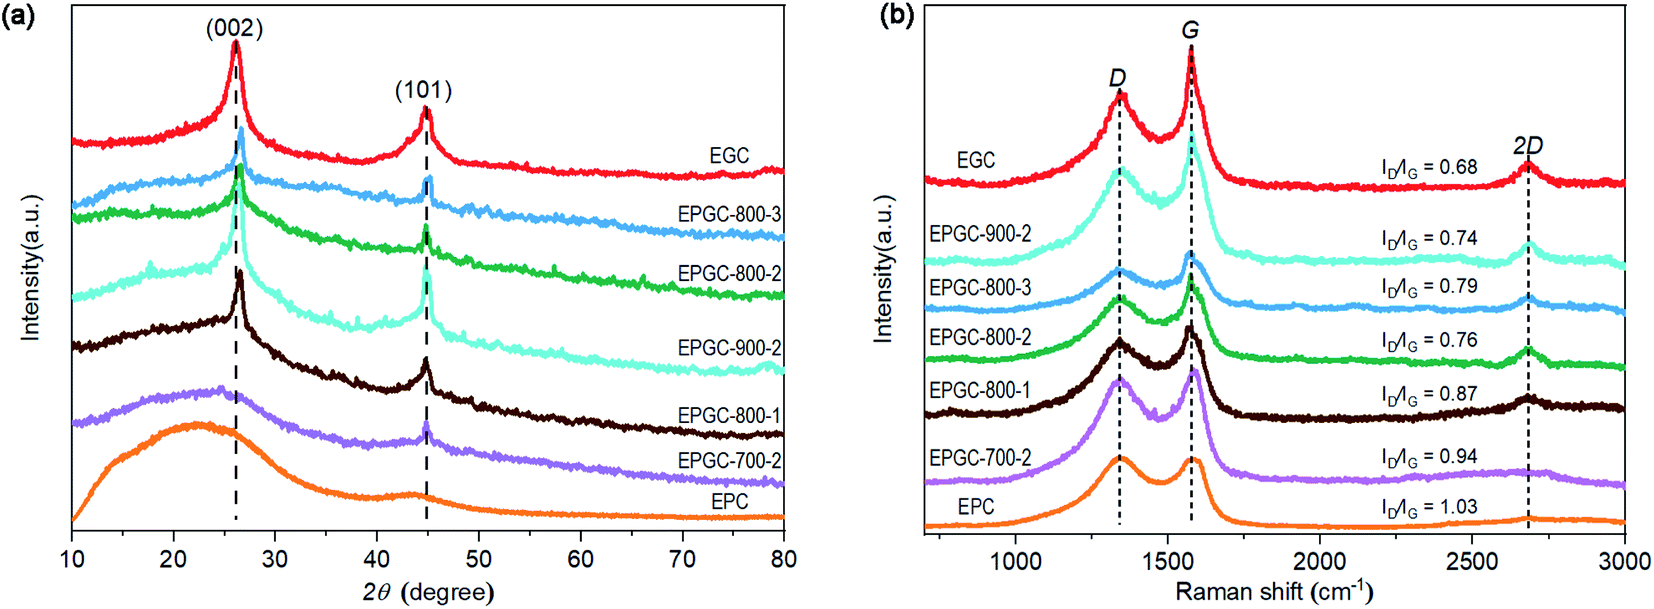
The graphitization degree of the materials was analyzed using XRD tests. In Fig. 3(a), EPGC-800-1, EPGC-800-2, EPGC-800-3, EPGC-900-2, and EGC exhibited two significant diffraction peaks at 26° and 44°, corresponding to the (002) and (101) graphitic carbon planes,32 while a broad peak was observed in EPGC-700-2 and EPC, indicating a low graphitization degree. During graphitization, as shown in eqn (8)–(10), K3[Fe(C2O4)3]·3H2O decomposed into FeC2O4, after which FeC2O4 was transformed into FeO when the temperature exceeded 200 °C. Above 710 °C, FeO was reduced to Fe, which acts as a graphitization catalyst to convert amorphous carbon into graphitic carbon.33,34
| | |
FeC2O4 → FeO + CO + CO2
| (8) |
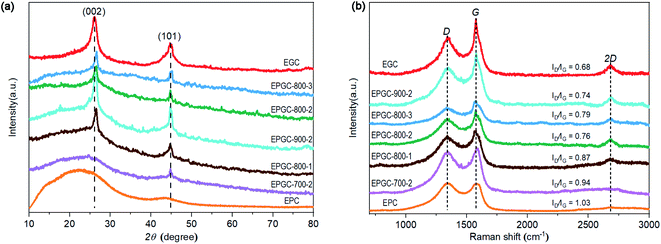 |
| | Fig. 3 (a) XRD patterns, and (b) Raman spectra of EPGC materials. | |
Raman tests were performed to further explain the degree of graphitization. In Fig. 3(b), two significant peaks at ∼1350 and ∼1580 cm−1 represent the D-band (D) and G-band (G). The D-band and G-band intensity ratio (ID/IG) reflect the graphitization degree, and a smaller value of ID/IG, a higher graphitization degree.35 The ID/IG values for EPGC-700-2, EPGC-800-1, EPGC-800-2, EPGC-800-3, EPGC-900-2, EGC and EPC were 0.94, 0.87, 0.76, 0.79, 0.74, 0.68 and 1.03, respectively. Obviously, as the activation temperature increased, the graphitization degree of the materials increased. It has been reported that when Fe is used as a graphitization catalyst to convert amorphous carbon into graphitic carbon, it only occurs at a temperature exceeding 715 °C;36 thus, EPGC-700-2 had higher ID/IG values than EPGC-800-2 and EPGC-900-2. Notably, as the catalyst loading increased, the value of ID/IG follows the order: EPGC-800-2 < EPGC-800-3 < EPGC-800-1, where EPGC-800-2 had the highest graphitization degree, indicating that the addition of optimal amount of FeC2O4 beneficially affects the graphitization degree, whereas excessive FeC2O4 addition leads to some damage to the graphitic structure, and this phenomenon was consistent with T. Liu et al. work.37 Moreover, EPC without Fe addition had the highest ID/IG value, confirming that Fe addition is important for catalyzing graphitization. In addition, an obvious 2D peak was observed at ∼2700 cm−1 for EPGC-800-1, EPGC-800-2, EPGC-800-3, EPGC-900-2, and EGC but not in the case of EPGC-700-2 and EPC, where the 2D peak is a typical characteristic peak of the graphitic structure.38 Hence, the high graphitization degree of EPGC-800-2 should enhance the conductivity and improve the ORR activity.
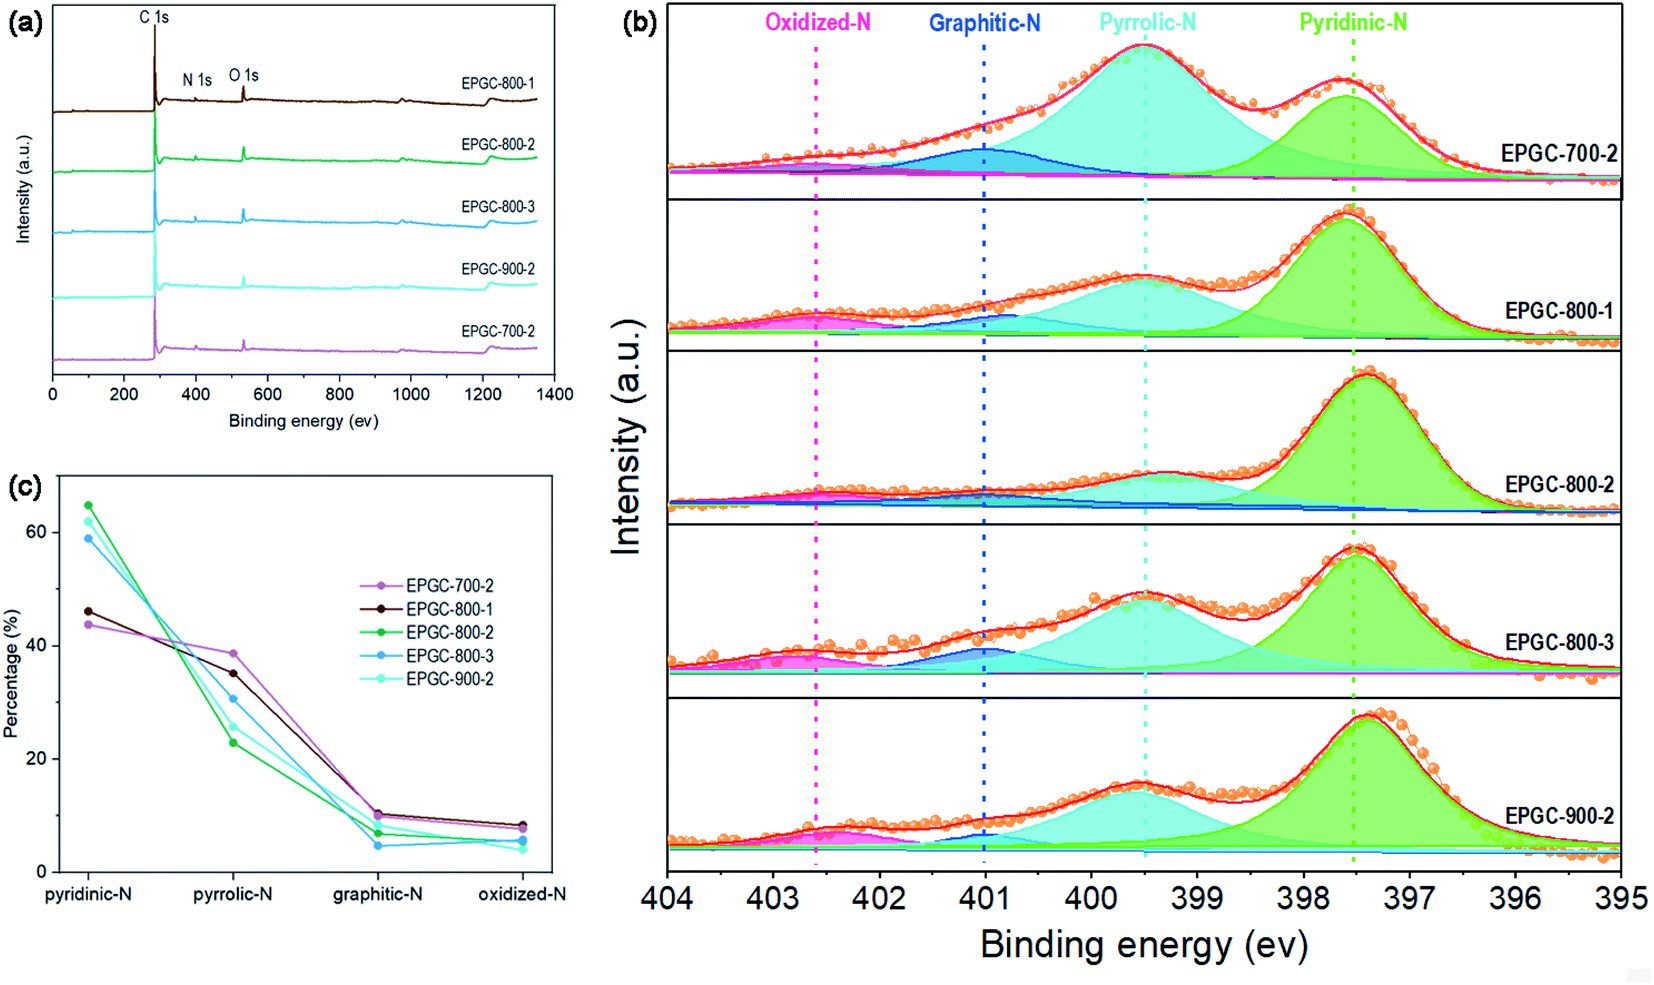
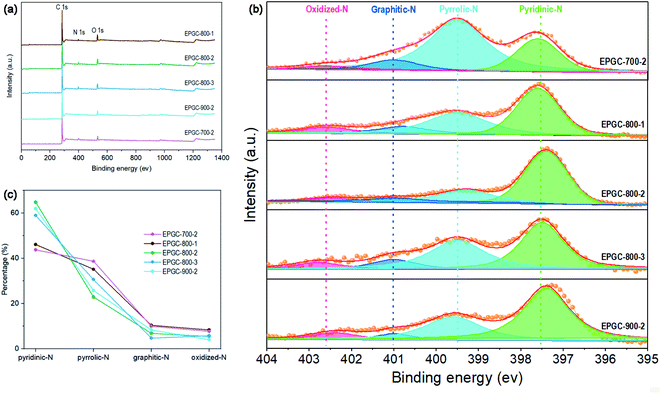
XPS was carried out to analyze the surface elemental composition of the material. Peaks of the C 1s (284.9 eV), O 1s (532.1 eV), and N 1s (400.2 eV) states were detected in the full XPS spectrum [Fig. 4(a)], without signals from other impurity elements (K or Fe). The N 1s spectrum was deconvoluted into peaks of pyridinic-N, pyrrolic-N, graphitic-N, and oxidized-N at 397.5, 399.6, 400.9, and 402.5 eV [Fig. 4(b)], respectively. Notably, pyridinic-N could weaken the O–O bond and support a more positive onset voltage, leading a better ORR activity,39 whereas pyrrolic-N has limited contribution to the electrocatalytic activity.40 As illustrated in Fig. 4(c) and Table S2,† the fractions of pyrrolic-N decreased markedly with increasing activation temperature, indicating that pyrrolic-N is unstable at high temperatures. While the percentage of pyridinic-N exhibited an upward trend with increasing activation temperature. EPGC-800-2 had the highest pyridinic-N percentage (67.40%) and lowest pyrrolic-N percentage (20.88%), indicating that had higher electrochemical performance.
 |
| | Fig. 4 (a) XPS spectra, (b) high resolution N 1s peaks, and (c) nitrogen species contents of EPGC-700-2, EPGC-800-1, EPGC-800-2, EPGC-800-3, and EPGC-900-2. | |
3.2 Electrochemical property
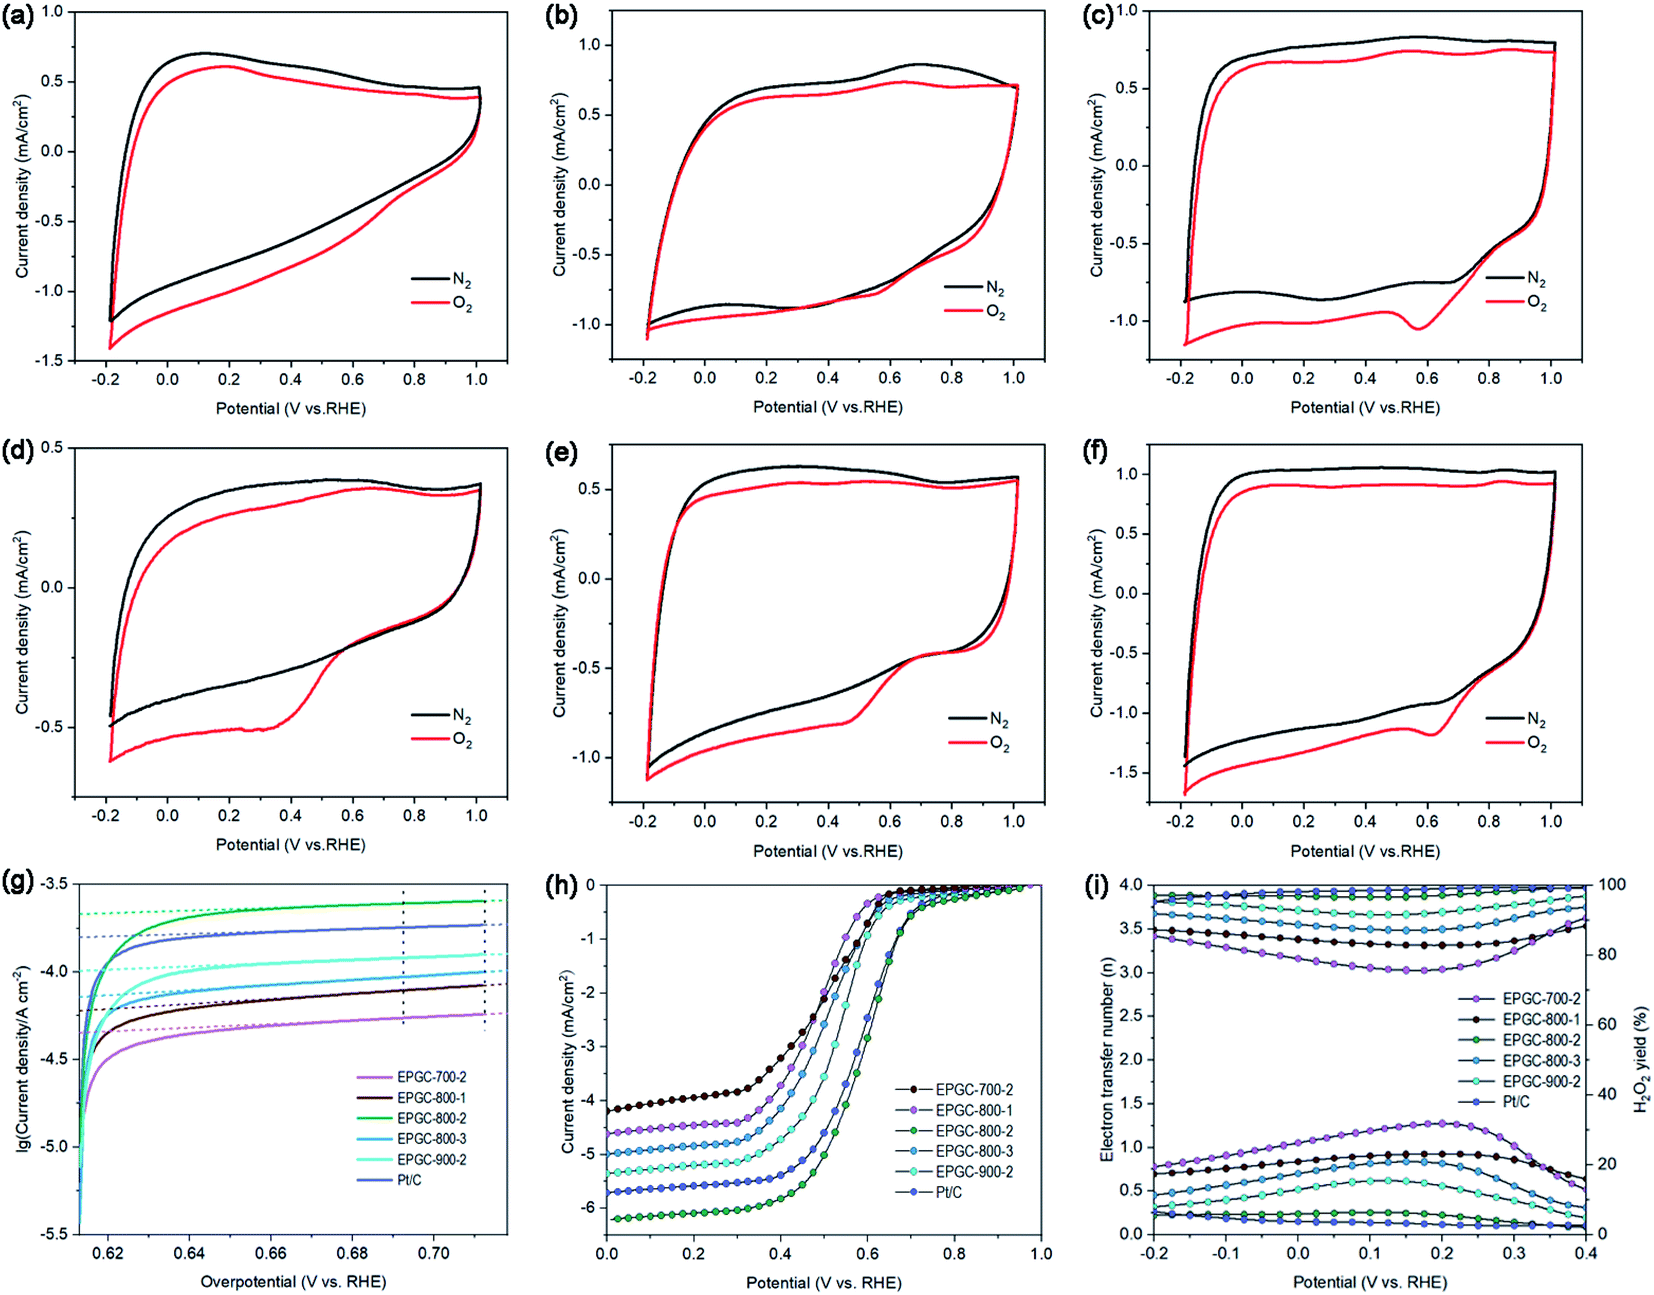
Electrochemical performance of materials was first tested with CV technology. As seen in Fig. 5(a)–(f), no reduction peak was observed in the N2-saturated solution. However, Pt/C, EPGC-800-2, EPGC-900-2, and EPGC-800-3 exhibited obvious reduction peaks in O2-saturated solution, proving a high electrochemical capability. The ORR peak potential for EPGC-800-2 was 0.58 V (vs. RHE); it was near to Pt/C (0.62 V vs. RHE), and was more positive than EPGC-900-2 (0.46 V vs. RHE) and EPGC-800-3 (0.35 V vs. RHE). In addition, the current density of EPGC-800-2 (0.25 mA cm−2) was near to Pt/C (0.27 mA cm−2), and higher than EPGC-800-3 (0.19 mA cm−2) and EPGC-900-2 (0.18 mA cm−2). EPGC-800-2, with a more positive ORR peak potential and higher current density, could decrease the overpotential towards ORR and speed up electron capture by oxygen.41
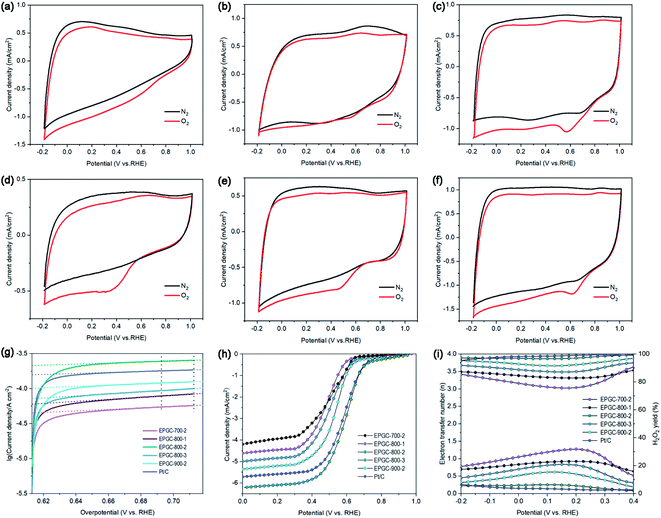 |
| | Fig. 5 (a)–(f) CV plots in N2- or O2- saturated 50 mM PBS solutions, (g) Tafel plots, (h) RRDE curves in O2-saturated 50 mM PBS with 1600 rpm, (i) n and H2O2 yield of EPGC-700-2, EPGC-800-1, EPGC-800-2, EPGC-800-3, EPGC-900-2, and Pt/C. | |
As a vital parameter to evaluate the ORR catalytic kinetics performance, the exchange current density (i0) was acquired from the Tafel curves through fitting the linear regression region of the overpotential (80–100 mV, R2 ≥ 0.99) in Fig. 5(g).42 The i0 values are listed in Table 2, where EPGC-800-2 had the highest i0 (2.14 × 10⁻⁴ A cm−2), which is approximately 27.3, 75.4, 160.9, 205.7, and 328.0% higher than Pt/C, EPGC-900-2, EPGC-800-3, EPGC-800-1, and EPGC-700-2 catalysts, respectively, indicating that EPGC-800-2 afforded a rapid charge transfer rate and high ORR catalyst activity, which was benefited from the reasonable pore structure distribution and high conductivity. The outcomes were consistent with the CV tests.
Table 2 Electrochemical properties of the catalysts
| Catalysts |
i0 × 10−4 (A cm−2) |
Eonset (V vs. RHE) |
E1/2 (V vs. RHE) |
n |
H2O2 yield (%) |
| EPGC-700-2 |
0.50 |
0.640 |
0.497 |
3.21 |
25.26 |
| EPGC-800-1 |
0.70 |
0.621 |
0.483 |
3.39 |
20.64 |
| EPGC-800-2 |
2.14 |
0.766 |
0.591 |
3.90 |
6.06 |
| EPGC-800-3 |
0.82 |
0.655 |
0.502 |
3.58 |
15.94 |
| EPGC-900-2 |
1.22 |
0.683 |
0.535 |
3.74 |
11.34 |
| Pt/C |
1.68 |
0.740 |
0.583 |
3.93 |
4.63 |
RRDE tests were performed to investigate all materials' ORR pathway and mechanism in O2-saturated PBS electrolyte. In Fig. 5(h), Pt/C, EPGC-800-1, EPGC-800-2, EPGC-800-3, EPGC-700-2, and EPGC-900-2 afforded limiting disk currents of −5.72, −4.65, −6.21, −5.03, −4.29, and −5.34 mA cm−2, respectively. The onset potential (Eonset) and half-wave potential (E1/2) are very significant parameters for evaluating ORR catalyst performance;43 the obtained values are listed in Table 2, EPGC-800-2 had more positive Eonset and E1/2, corresponding to its excellent ORR performance. The n and H2O2 yields and their average values are presented in Fig. 5(i) and Table 2, respectively. EPGC-800-2 catalyst had a higher n (3.90) and lower H2O2 yield (6.06%) than other EPGC catalysts, demonstrating a dominant four-electron pathway ORR. In addition, we also compared the ORR performance of EPGC-800-2 with other carbon-based ORR catalysts (Table S4†). From Table S4,† EPGC-800-2 achieved a good balance between the large SSA and high graphitization degree of carbon materials, as compared to the reported carbonaceous ORR catalysts, so it showed excellent ORR performance. For EPGC-800-2 catalyst, a bigger SSA with hierarchical porous structure could provide lots of ORR sites, facilitate oxygen contact as well as charge transfer, and accelerate the ORR rate.44 A higher graphitization degree could result in better electrical conductivity and lower internal resistance.45 Besides, pyridinic nitrogen is beneficial to enhance the ORR onset potentials and improve materials' electrochemical activity.46
3.3 Microbial fuel cell experiments
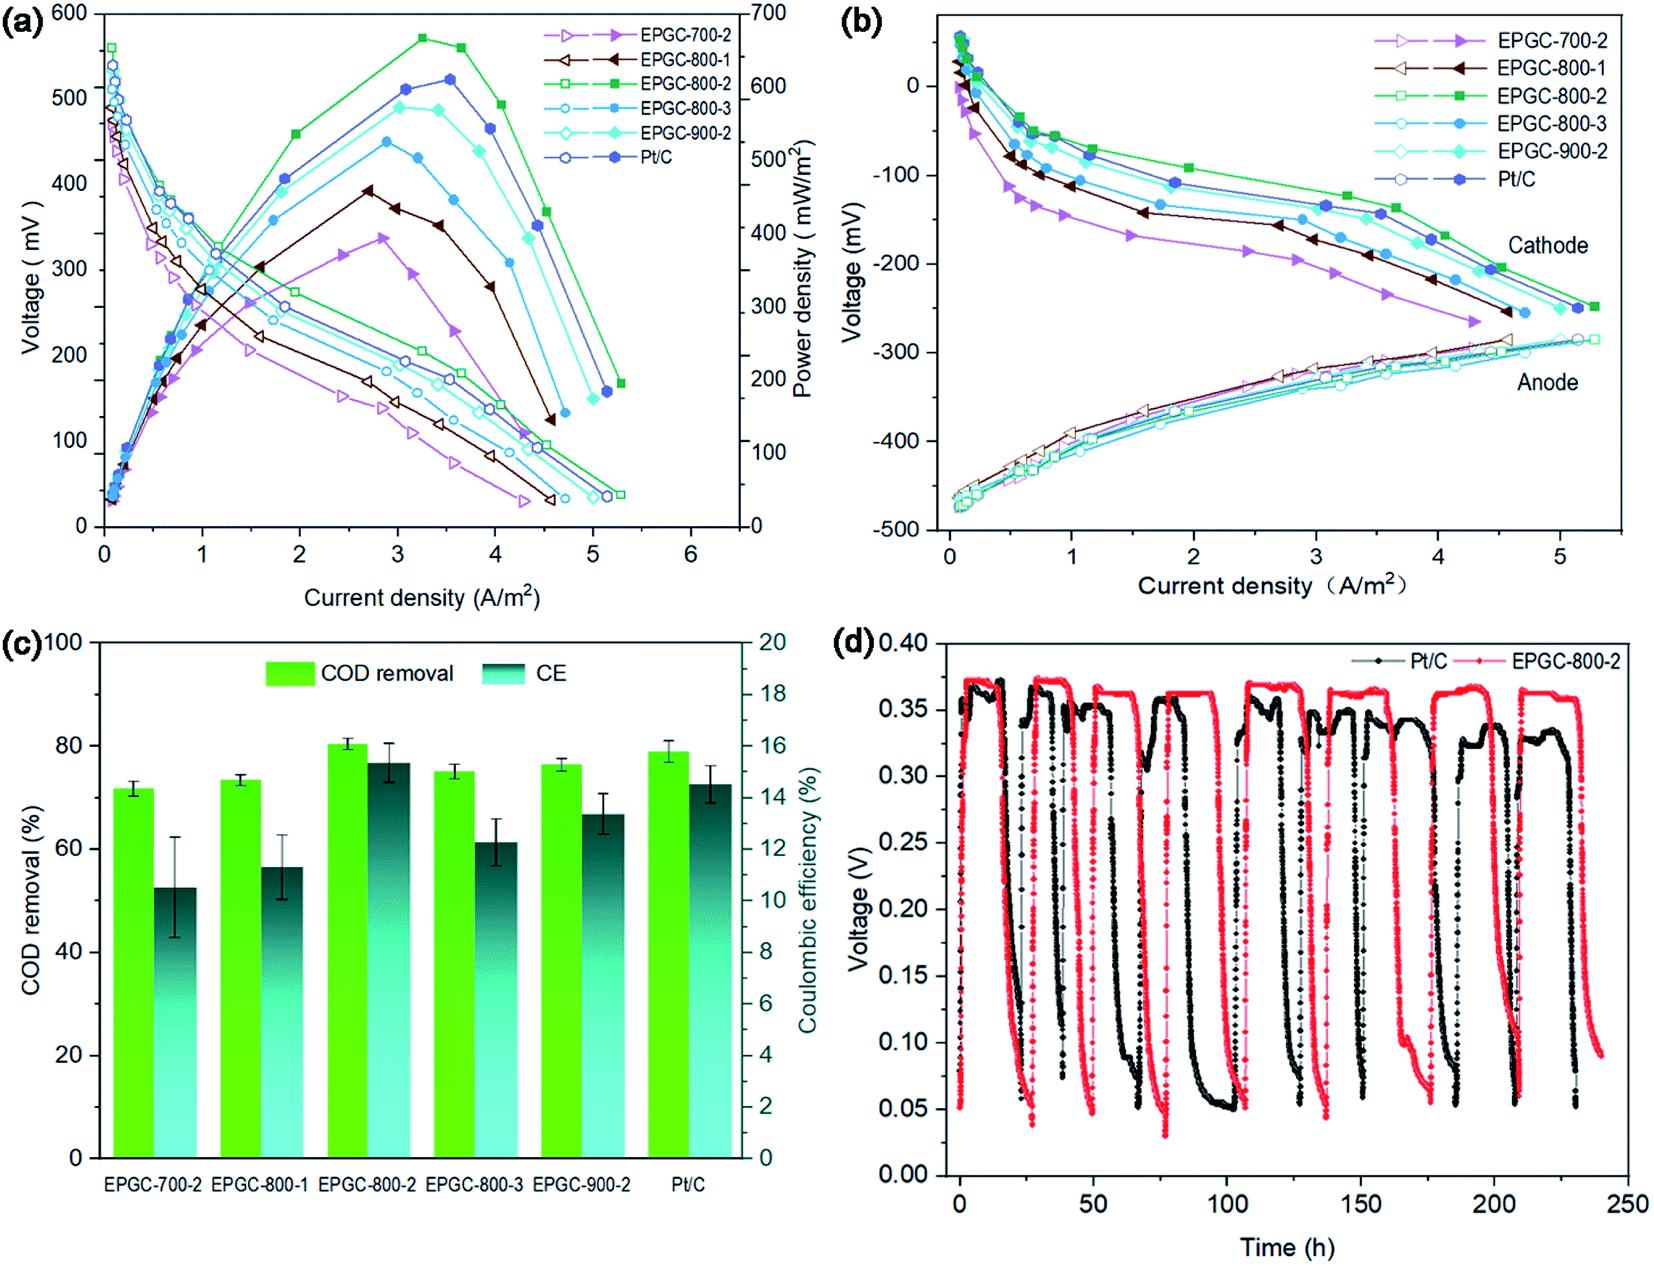
The power density and polarization curves in all MFCs are shown in Fig. 6(a). EPGC-800-2 obtained a maximum power density (MPD) of 667 mW m−2, which is 16, 27, 46, and 69% higher than EPGC-900-2 (573 mW m−2), EPGC-800-3 (526 mW m−2), EPGC-800-1 (458 mW m−2), and EPGC-700-2 (394 mW m−2), respectively, and also higher than Pt/C (621 mW m−2), confirming the better ORR performance of the EPGC-800-2 cathode. In addition, EPGC-800-2 achieved the highest open circuit potential (0.561 V) from the polarization curves, compared with Pt/C (0.548 V), EPGC-900-2 (0.524 V), EPGC-800-3 (0.512 V), EPGC-800-1 (0.494 V), and EPGC-700-2 (0.472 V). Moreover, EPGC-800-2 displayed a minimum slope from the polarization curves, indicating that the MFC with EPGC-800-2 had the lowest internal resistance and the optimal power output. Furthermore, the individual electrode polarization curves was analyzed. The anode properties of the different MFCs (Fig. 6(b)) was almost similar when the operating environment and anode materials were the same. Notably, the cathode performance and overall MFCs have the same trend, which indicated that the cathode mainly influenced the MFCs power performance.47 The most positive cathode voltage of the MFC with EPGC-800-2 was ascribed to the high graphitization and hierarchical porous structure of the catalyst.
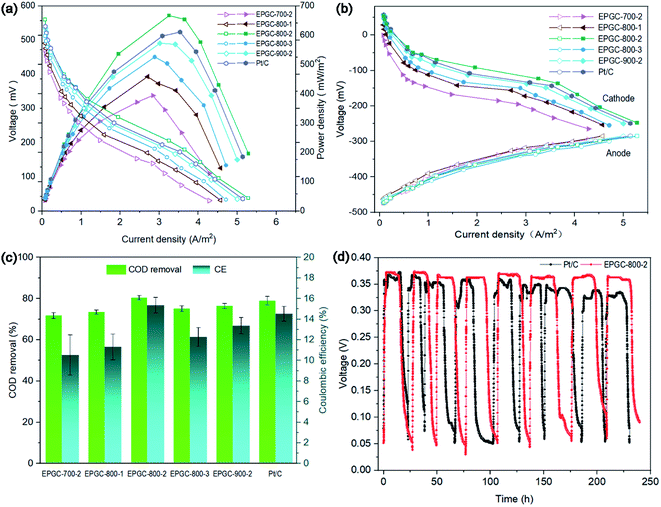 |
| | Fig. 6 (a) Power density and polarization curves, (b) cathode and anode polarization curves, (c) COD removal and CE of MFCs with different catalysts, and (d) voltage output of EPGC-800-2 cathode and Pt/C cathode in MFC for 240 h. | |
COD removal and CE in all MFCs are exhibited in Fig. 6(c). EPGC-800-2 had the highest COD removal of 80.5 ± 1.04%, which is 1.90%, 5.2%, 7.0%, 9.5% and 12.1% higher than Pt/C (79.0 ± 2.09%), EPGC-900-2 (76.5 ± 1.22%), EPGC-800-3 (75.2 ± 1.41%), EPGC-800-1 (73.5 ± 1.04%) and EPGC-700-2 (71.8 ± 1.47%). Besides, EPGC-800-2 also shows the highest CE of 15.37 ± 0.76%, which is 5.7%, 14.8%, 25.1%, 35.8% and 45.8% higher than Pt/C (14.54 ± 0.72%), EPGC-900-2 (13.39 ± 0.79%), EPGC-800-3 (12.29 ± 0.91%), EPGC-800-1 (11.32 ± 1.25%), and EPGC-700-2 (10.54 ± 1.95%), indicating that EPGC-800-2 had a stronger capability to degrade organic matter and generate a continuous and stable current in wastewater.
The stability of the cathode catalyst is critical in MFCs. The output voltage in the MFC with the EPGC-800-2 cathode became stable at ∼380 mV over 240 h of operation, indicating good stability during a repeated cycles (Fig. 6(d)). While the MFC voltage with the Pt/C cathode showed a decreasing trend over run time of 240 h, attributed to Pt poisoning and deactivation in solution.48 EPGC-800-2, which has good operational stability, is essential for air-cathode MFCs application as ORR catalyst.
4. Conclusions
In summary, K3[Fe(C2O4)3]·3H2O was chosen as the activation–graphitization bifunctional catalyst to generate eggplant-derived hierarchical porous graphitic biochar through a one-step preparation strategy. The as-prepared EPGC-800-2 catalyst presented a hierarchical porous structure with large SSA (1137 m2 g−1), high graphitization degree, and high pyridinic content, and exhibited a four-electron pathway towards ORR process with higher n (3.90) and lower H2O2 yield (6.06%). The excellent electrochemical activity of EPGC-800-2 obtained the highest MPD of 667 mW m−2 in MFCs. The work provided a green and simple strategy to prepare great ORR catalysts from abundant biomass.
Author contributions
Zhengtai Zha: conceptualization, writing – original draft, writing – review & editing. Ping Xiang: writing – review & editing, supervision. Hongyi Zhu: writing – review & editing. Bangmei Zhou: investigation. Zhulong Sun: writing – review & editing. Shun Zhou: investigation. Zhi Zhang: conceptualization, funding acquisition, writing – review & editing, supervision.
Conflicts of interest
There are no conflicts to declare.
Acknowledgements
This research was supported by the National Natural Science Foundation of China (Grant No. 51778082). The authors would like to thank Xie Han from Shiyanjia Lab (www.shiyanjia.com) for the TEM tests.
References
- W. Xue, Q. Zhou and F. Li, Electrochim. Acta, 2020, 355, 136775 CrossRef CAS.
- X. Wang, C. Yuan, C. Shao, S. Zhuang, J. Ye and B. Li, Environ. Res., 2020, 182, 109011 CrossRef CAS.
- W. Yang, J. Li, D. Ye, X. Zhu and Q. Liao, Electrochim. Acta, 2017, 224, 585–592 CrossRef CAS.
- H. Wang, R. Liu, Y. Li, X. Lü, Q. Wang, S. Zhao, K. Yuan, Z. Cui, X. Li, S. Xin, R. Zhang, M. Lei and Z. Lin, Joule, 2018, 2, 337–348 CrossRef CAS.
- X. Cui, L. Gao, S. Lei, S. Liang, J. Zhang, C. D. Sewell, W. Xue, Q. Liu, Z. Lin and Y. Yang, Adv. Funct. Mater., 2020, 2009197, 2009197 CrossRef.
- X. Cui, S. Lei, A. C. Wang, L. Gao, Q. Zhang, Y. Yang and Z. Lin, Nano Energy, 2020, 70, 104525 CrossRef CAS.
- Z. Zeng, L. Yi, J. He, Q. Hu, Y. Liao, Y. Wang, W. Luo and M. Pan, J. Mater. Sci., 2020, 55, 4780–4791 CrossRef CAS.
- L. Peng, Y. Liang, J. Huang, L. Xing, H. Hu, Y. Xiao, H. Dong, Y. Liu and M. Zheng, ACS Sustainable Chem. Eng., 2019, 7, 10393–10402 CrossRef CAS.
- M. f. Li, Y. g. Liu, G. m. Zeng, N. Liu and S. b. Liu, Chemosphere, 2019, 226, 360–380 CrossRef CAS.
- L. Sun, C. Tian, M. Li, X. Meng, L. Wang, R. Wang, J. Yin and H. Fu, J. Mater. Chem. A, 2013, 1, 6462–6470 RSC.
- S. Yang, S. Wang, X. Liu and L. Li, Carbon, 2019, 147, 540–549 CrossRef CAS.
- K. Wang, Y. Cao, X. Wang, P. R. Kharel, W. Gibbons, B. Luo, Z. Gu, Q. Fan and L. Metzger, Energy, 2016, 101, 9–15 CrossRef CAS.
- C. Chang, M. Li, H. Wang, S. Wang, X. Liu, H. Liu and L. Li, J. Mater. Chem. A, 2019, 7, 19939–19949 RSC.
- Y. Lu, N. Zhu, F. Yin, T. Yang, P. Wu, Z. Dang, M. Liu and X. Wei, Biosens. Bioelectron., 2017, 98, 350–356 CrossRef CAS.
- Y. Zan, Z. Zhang, H. Liu, M. Dou and F. Wang, J. Mater. Chem. A, 2017, 5, 24329–24334 RSC.
- D. Wu, Y. Shi, H. Jing, X. Wang, X. Song, D. Si, S. Liang and C. Hao, Int. J. Hydrogen Energy, 2018, 43, 19492–19499 CrossRef CAS.
- A. Puig, I. Perez-Munuera, J. A. Carcel, I. Hernando and J. V. Garcia-Perez, Food Bioprod. Process., 2012, 90, 624–632 CrossRef.
- B. Li, D. Geng, X. S. Lee, X. Ge, J. Chai, Z. Wang, J. Zhang, Z. Liu, T. S. A. Hor and Y. Zong, Chem. Commun., 2015, 51, 8841–8844 RSC.
- Z. Li, W. Lv, C. Zhang, B. Li, F. Kang and Q. H. Yang, Carbon, 2015, 92, 11–14 CrossRef CAS.
- Y. Dong, J. Chen, C. Li and H. Zhu, Dyes Pigm., 2007, 73, 261–268 CrossRef CAS.
- Y. Yang, T. Liu, Q. Liao, D. Ye, X. Zhu, J. Li, P. Zhang, Y. Peng, S. Chen and Y. Li, J. Mater. Chem. A, 2016, 4, 15913–15919 RSC.
- X. Wang, S. Cheng, Y. Feng, M. D. Merrill, T. Saito and B. E. Logan, Environ. Sci. Technol., 2009, 43, 6870–6874 CrossRef CAS.
- Z. Zha, Z. Zhang, P. Xiang, H. Zhu, X. Shi and S. Chen, Sci. Total Environ., 2020, 142918 CrossRef.
- B. E. Logan, B. Hamelers, R. Rozendal, U. Schröder, J. Keller, S. Freguia, P. Aelterman, W. Verstraete and K. Rabaey, Environ. Sci. Technol., 2006, 40, 5181–5192 CrossRef CAS.
- X. Kong, Y. Zhu, H. Lei, C. Wang, Y. Zhao, E. Huo, X. Lin, Q. Zhang, M. Qian, W. Mateo, R. Zou, Z. Fang and R. Ruan, Chem. Eng. J., 2020, 399, 125808 CrossRef CAS.
- H. Peng, G. Ma, K. Sun, Z. Zhang, Q. Yang and Z. Lei, Electrochim. Acta, 2016, 190, 862–871 CrossRef CAS.
- G. Gou, F. Huang, M. Jiang, J. Li and Z. Zhou, Renewable Energy, 2020, 149, 208–216 CrossRef CAS.
- N. Tanaka and K. Sato, Bull. Chem. Soc. Jpn., 1970, 43, 789–793 CrossRef CAS.
- J. Phuriragpitikhon, P. Ghimire and M. Jaroniec, J. Colloid Interface Sci., 2019, 558, 55–67 CrossRef CAS.
- M. Sevilla, A. S. M. Al-Jumialy, A. B. Fuertes and R. Mokaya, ACS Appl. Mater. Interfaces, 2018, 10, 1623–1633 CrossRef CAS.
- P. Zhou, J. Wan, X. Wang, J. Chen, Y. Gong and K. Xu, Langmuir, 2019, 35, 12914–12926 CrossRef CAS.
- F. Y. Zheng, R. Li, S. Ge, W. R. Xu and Y. Zhang, J. Power Sources, 2020, 446, 227356 CrossRef CAS.
- J. He, D. Zhang, Y. Wang, J. Zhang, B. Yang, H. Shi, K. Wang and Y. Wang, Appl. Surf. Sci., 2020, 515, 146020 CrossRef CAS.
- Y. Gong, D. Li, C. Luo, Q. Fu and C. Pan, Green Chem., 2017, 19, 4132–4140 RSC.
- H. Yuan, Y. Hou, Z. Wen, X. Guo, J. Chen and Z. He, ACS Appl. Mater. Interfaces, 2015, 7, 18672–18678 CrossRef CAS.
- J. Hoekstra, A. M. Beale, F. Soulimani, M. Versluijs-Helder, J. W. Geus and L. W. Jenneskens, J. Phys. Chem. C, 2015, 119, 10653–10661 CrossRef CAS.
- T. Liu, E. Liu, R. Ding, Z. Luo, T. Hu and Z. Li, Electrochim. Acta, 2015, 173, 50–58 CrossRef CAS.
- Z. Wang, X. Cao, J. Ping, Y. Wang, T. Lin, X. Huang, Q. Ma, F. Wang, C. He and H. Zhang, Nanoscale, 2015, 7, 9394–9398 RSC.
- K. Zhong, M. Li, Y. Yang, H. Zhang, B. Zhang, J. Tang, J. Yan, M. Su and Z. Yang, Appl. Energy, 2019, 242, 516–525 CrossRef CAS.
- X. Tian, M. Zhou, C. Tan, M. Li, L. Liang, K. Li and P. Su, Chem. Eng. J., 2018, 348, 775–785 CrossRef CAS.
- T. Cai, Y. Huang, M. Huang, Y. Xi, D. Pang and W. Zhang, Chem. Eng. J., 2019, 371, 544–553 CrossRef CAS.
- Y. Liu, Y. S. Fan and Z. M. Liu, Chem. Eng. J., 2019, 361, 416–427 CrossRef CAS.
- Z. Fan, J. Li, W. Yang, Q. Fu, K. Sun, Y. C. Song, Z. Wei, Q. Liao and X. Zhu, Chem. Eng. J., 2020, 385, 123393 CrossRef CAS.
- B. Men, Y. Sun, M. Li, C. Hu, M. Zhang, L. Wang, Y. Tang, Y. Chen, P. Wan and J. Pan, ACS Appl. Mater. Interfaces, 2016, 8, 1415–1423 CrossRef CAS.
- W. Yang, Y. Peng, Y. Zhang, J. E. Lu, J. Li and S. Chen, ACS Sustainable Chem. Eng., 2019, 7, 3917–3924 CrossRef CAS.
- X. Liu, Y. Zhou, W. Zhou, L. Li, S. Huang and S. Chen, Nanoscale, 2015, 7, 6136–6142 RSC.
- J. Wang, P. Tian, K. Li, B. Ge, D. Liu, Y. Liu, T. Yang and R. Ren, Bioresour. Technol., 2016, 222, 107–113 CrossRef CAS.
- Y. Dai, Y. Chan, B. Jiang, L. Wang, J. Zou, K. Pan and H. Fu, ACS Appl. Mater. Interfaces, 2016, 8, 6992–7002 CrossRef CAS.
Footnote |
| † Electronic supplementary information (ESI) available. See DOI: 10.1039/d0ra09976g |
|
| This journal is © The Royal Society of Chemistry 2021 |
Click here to see how this site uses Cookies. View our privacy policy here. 
 Open Access Article
 This Open Access Article is licensed under a Creative Commons Attribution-Non Commercial 3.0 Unported Licence
 *ab,
Ping Xiangab,
Hongyi Zhuab,
Bangmei Zhouab,
Zhulong Sunab and
Shun Zhouab
*ab,
Ping Xiangab,
Hongyi Zhuab,
Bangmei Zhouab,
Zhulong Sunab and
Shun Zhouab