 Open Access Article
Changes in the fluorescence intensity, degradability, and aromaticity of organic carbon in ammonium and phenanthrene-polluted aquatic ecosystems†
Zixia Qiao ,
Sihai Hu,
Yaoguo Wu*,
Ran Sun*,
Xiaoyan Liu and
Jiangwei Chan
Department of Applied Chemistry, Northwestern Polytechnical University, Xi'an 710129, China. E-mail: wuygal@nwpu.edu.cn; sunran@nwpu.edu.cn; Tel: +86-29-88488018
First published on 4th January 2021
Abstract
Mixed cultures were established by a sediment to investigate the changes in organic carbon (C) in a combined ammonium and phenanthrene biotransformation process in aquatic ecosystems. The microorganisms in the sediment demonstrated significant ammonium-N and phenanthrene biotransformation capacity with removal efficiencies of 99.96% and 99.99%, respectively. The changes in the organic C characteristics were evaluated by the fluorescence intensity, degradability (humification index (HIX) and UV absorbance at 254 nm (A254)), aromaticity (specific UV absorbance at 254 nm (SUVA254) and fluorescence index (FI)). Compared with C2 (the second control), the lower values of fluorescence intensity (after the 15th d), HIX (after the 8th d), A254 (after the 11th d), and SUVA254 (after the 8th d) and the higher FI value (after the 8th d) in ammonium and phenanthrene-fed mixed cultures (N_PHE) suggest that aromatic structures and some condensed molecules were easier to break down in N_PHE. Similar results were obtained from Fourier transformation infrared spectroscopy (FTIR) and nuclear magnetic resonance (1H NMR) spectra. Changes in organic C characteristics may be due to two key organisms Massilia and Azohydromonas. The biodiversity also suggested that the selective pressure of ammonium and phenanthrene is the decisive factor for changes in organic C characteristics. This study will shed light on theoretical insights into the interaction of N and aromatic compounds in aquatic ecosystems.
1 Introduction
In last few decades, the usage of artificial N fertilizer has doubled in order to achieve high crop yields to cater to the rapidly growing human population,1,2 thereby leading to excessive ammonium concentrations in aquatic ecosystems.3,4 Additionally, aromatic compounds are commonly found in aquatic ecosystems; they are discharged from several important processes, such as the combustion of fossil fuels and other industrial processes.5,6 Aromatic compounds in aquatic ecosystems enable long-term retention owing to their strong hydrophobicity and stable benzene ring structures.7 The combined pollution of ammonium and aromatic compounds in aquatic ecosystems is a global concern because it can pose a serious threat to aquatic life and humans.Microorganisms are a primary factor in the natural elimination of ammonium and aromatic compounds in aquatic ecosystems, and their microbial activities and community structures can be influenced by ammonium and aromatic compound contamination.8 Of these microbial consortia, ammonium-oxidizing bacteria (AOB), as the primary drivers of the nitrification process, can participate in aromatic compound degradation because they have a wide substrate specificity and can not only utilize ammonium, but can also oxidize aromatics.9,10 Substantial investigations have been conducted to explore the relationship between AOB and aromatic compound contamination.10,11 For example, Lindgren et al.12 investigated the toxicity of polycyclic aromatic hydrocarbons (PAHs) on the activity of sediment AOB and found an induced tolerance in the ammonium-oxidizing community at the site with the highest PAH concentration. Vannelli and Hooper13 reported that Nitrosomonas europaea can hydroxylate aromatic compounds with a radical or carbocation as an intermediate to form phenolic products. Therefore, the nitrification process is significantly related to the degradation and biotransformation of refractory organic matter, including aromatic compounds.14
Moreover, the degradation and transformation of aromatic compounds by heterotrophic nitrification bacteria have been intensively investigated. For example, Feng et al.15 reported that simultaneous removal of nitrogen and phenol can be achieved by heterotrophic nitrification-aerobic denitrification bacteria in a single reactor. In our previous study, ammonium was found to be biodegraded with aniline as the carbon source in heterotrophic nitrification–aerobic denitrification mixed cultures.16 In addition to regular aromatic compounds, such as aniline, benzene, and phenol,17–19 complex aromatic compounds, such as tetrabromobisphenol A and quinoline,20,21 can be biodegraded by heterotrophic nitrification bacteria under aerobic conditions.
However, the contribution of heterotrophic nitrifiers to the biotransformation of ammonium and aromatic compounds such as phenanthrene may be underestimated in aquatic ecosystems owing to the extensive existence of heterotrophic nitrifiers.22,23 Previous studies mainly focused on the ecotoxic effects of phenanthrene on heterotrophic nitrifiers,24,25 and there are no reports of the changes in the organic C characteristics in the combined biotransformation process of ammonium and phenanthrene. The combined biotransformation of ammonium and phenanthrene may enrich the functional microbial consortia, and the degradation of phenanthrene may be coupled with the heterotrophic nitrification process, which will induce changes in the organic C characteristics in view of the fluorescence intensity, degradability, and aromaticity.
Therefore, the present study aimed to (1) examine the biotransformation and degradation performance of ammonium and phenanthrene in mixed cultures; (2) demonstrate the changes in the organic C characteristics in view of the fluorescence intensity, degradability, and aromaticity; and (3) investigate the microbial community succession using high-throughput sequencing.
2 Materials and methods
2.1 Water and sediment collection
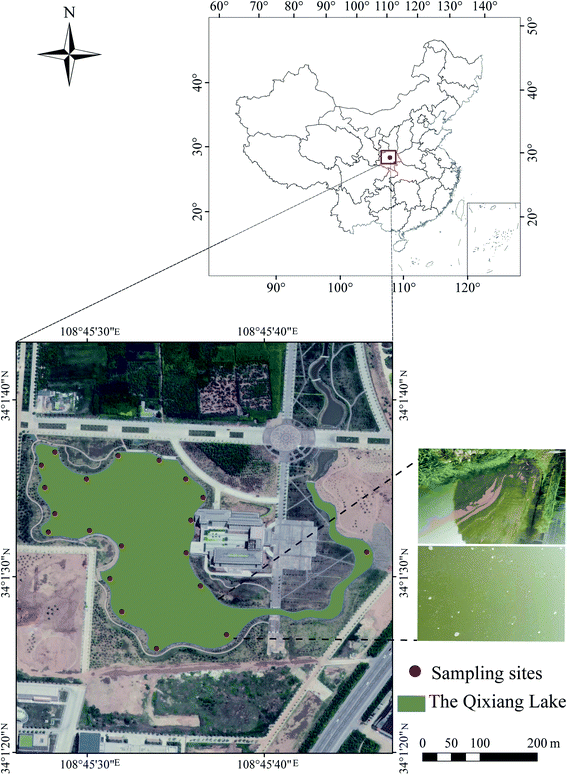
The water and sediment collection area (Fig. 1), Qixiang Lake (34°1′30′′–34°1′40′′ N, 108°45′30′′–108°45′40′′ E), is located in the campus of Northwest Polytechnical University, Shaanxi, China. Eutrophication has been a significant problem in the lake for many years, especially in summer (Fig. 1), as described in our previous study.2620 fixed sites in the lake were selected to collect water and sediment samples. Water samples were collected using a 5 L barrel. The sediment samples were collected using a grab sampler at a depth of 0–2 cm. The samples were immediately transported to the laboratory and stored at 4 °C. The physicochemical properties of the water and sediment samples were analysed within 48 h, and the results are shown in Table S1.† The sediment was air-dried and then sieved through a 2 mm sieve before further use.
2.2 Chemicals
Ammonium chloride was purchased from Tianli (Tianjin, China). Phenanthrene was purchased from the Energy Chemical Reagent Co., Ltd. (Shanghai, China). Methanol was purchased from the Kermel Chemical Reagents Development Center (Tianjin, China). All the reagents were analytical grade and were used without further purification. Deionized water was used to prepare aqueous solutions throughout the experiments.2.3 Mixed culture setup
Fig. S1† shows the mixed culture established by sediment, which was placed in a brown glass bottle with an effective volume of 1000 mL. The mixed culture was set up according to the method of Qiao et al.26 Each mixed culture contained 100 g of sediment and 800 mL of lake water with ammonium chloride as the N source and phenanthrene as the C source (Section 2.3). Each treatment was set up in triplicate and was not incubated. According to the previous study, the optimum dissolved oxygen (DO) concentration of the aerobic N and organic C biotransformation system should be higher than 2 mg L−1. Thus, in this study, a laboratory scale air-pump was applied to maintain the DO concentration between 5–7 mg L−1.2.4 Combined biotransformation of ammonium and phenanthrene
To examine the combined biotransformation capacity of the microorganisms for ammonium and phenanthrene, 20 mg L−1 of ammonium-N and 15 mg L−1 of phenanthrene were fed to three mixed cultures (N_PHE). Concretely, 800.0 mL of lake water was added to 1000 mL beakers, and 0.24 mL of phenanthrene stock solution (50 g L−1 in acetone) was added to each beaker, resulting in a theoretical initial concentration of 15 mg L−1 of phenanthrene in the beaker. To promote acetone volatilization and to avoid the cosolvent effect, all beakers were aerated by a laboratory scale air-pump for 12 h to enable effective volatilization. After that, 20 mg L−1 of ammonium-N was fed to the beakers. The mixture of phenanthrene and ammonium was then poured into bottles containing 100 g of sediment. For comparisons, control experiments were conducted. In the first control experiment, the sediment was heat-killed and the mixed cultures were abiotic (C1). In the second control experiment, there was no ammonium and phenanthrene in the mixed cultures (C2). The lake water was harvested to analyze the concentrations of phenanthrene, ammonium-N, nitrate-N, and nitrite-N during the ammonium and phenanthrene biotransformation process.2.5 Changes in organic C characteristics
The changes in the organic C characteristics during the combined ammonium and phenanthrene biotransformation process were evaluated using absorbance, fluorescence analysis, Fourier transformation infrared spectroscopy (FTIR) and nuclear magnetic resonance (NMR). The UV-vis absorbance was measured using a UV-vis spectrometer (UV1800PC, Shanghai Jinghua, China). The specific UV absorbance at 254 nm (SUVA254), which was calculated as the measured absorbance divided by the concentration of total organic carbon (TOC), increased linearly with the aromaticity of the dissolved organic C.27The fluorescence was determined by a spectrofluorometer (F280, Tianjin, China) with a 1 cm quartz cell and a 150 W ozone-free xenon arc lamp. The excitation–emission matrix (EEM) fluorescence data were obtained for 5 nm wavelength emission scans at excitation wavelength increments of 5 nm. The scan ranges of excitation and emission were 200–450 nm and 250–600 nm, respectively. The fluorescence index (FI; the ratio of the fluorescence intensity at the emission wavelength of 450 nm to that at 500 nm at an excitation wavelength of 370 nm) was used to evaluate the aromaticity of organic C.28 The humification index (HIX) was calculated as the area under the emission spectrum of 435–480 nm divided by that of 300–345 nm at the excitation of 255 nm.29 The HIX provides information about the complexity of the molecules, their aromatic structures, and the humification degree of sediment organic C.30
Water samples collected at the 30th day were freeze-dried to solid-phase samples to further characterize the organic C using FTIR and NMR spectroscopy. The FTIR and NMR spectroscopy were performed according to the methods of Hu et al.31 CAro/CAli, which indicates the aromaticity of the organic C, was calculated as the sum of the aromatic carbon peak heights divided by that of aliphatic carbon.32
2.6 Microbial community analysis
The sediment samples were collected for microbial analysis on days 0 (N0), 15 (N15), and 47 (N47) in each mixed culture (Section 2.3). Duplicate samples for each time were harvested and then stored at −80 °C before DNA extraction. The samples collected from the mixed cultures represented the initial, climax, and end stages of pollutant degradation. The six samples were sent for microbial analysis on an Illumina MiSeq platform on the basis of standard protocols at Shanghai Majorbio Bio-Pharm Technology Co., Ltd., China.162.7 Diversity indexes
Diversity indexes, including the Shannon–Weaver diversity index (H) (eqn (1)) and equitability index (EI) (eqn (2)), were assessed using the resulting database.
 | (1) |
EI = H/ln![[thin space (1/6-em)]](https://www.rsc.org/images/entities/char_2009.gif) s s
| (2) |
The other index, namely range-weighted richness (Rr), was refined to evaluate the microbial diversity dynamics. Rr, which represents the dominant species number, was equal to the dominant peaks number in the modified database. Rank abundance curves were used to simultaneously examine the richness and evenness of the microbial consortium.33 In brief, on the basis of calculating the sequencing numbers that each operational taxonomic unit (OTU) contained, researchers ranked the OTUs from large to small and plotted the relevant relationships with the corresponding abundance.34 The OTU rank was considered to be the x-axis value, and the relative abundance of OTUs was assigned to the y-axis.
2.8 Analytical methods
The pH, DO, and conductivity were analyzed in situ using a multi-parameter water quality analyzer (SX700, Shanghai, China). TOC, ammonium-N, nitrate-N, and nitrite-N concentrations were analyzed after filtration through 0.45 μm Millipore filters according to the standard methods.35 The phenanthrene concentration was measured using a high performance liquid chromatography (HPLC) system (LC-2010A, Shimadzu, Japan) with the operation parameters reported by Zhang et al.36 The FTIR and NMR spectroscopy were performed using a Nicolet iS10 Magna-IR Spectrometer (Nicolet Instruments Corporation, USA) and Bruker Advance 400 MHz spectrometer (Bruker, USA), respectively. The metal contents (Ca, Na, K, and Mg) and Cl− were determined according to our previous study.16The pH value in the sediment environment was analyzed using a sediment:water (1![[thin space (1/6-em)]](https://www.rsc.org/images/entities/char_2009.gif) :
:![[thin space (1/6-em)]](https://www.rsc.org/images/entities/char_2009.gif) 1, w/v) extract. The TOC of the sediment phase was analyzed using a TOC analyzer (N/C3000ChD, Jena, Germany). To extract mineral N from the sediment, the mixture of 5 g sediment and 25 mL 1 M KCl was shaken for 1 h before filtration through a 0.45 μm membrane filter.37 The ammonium-N, nitrate-N, and nitrite-N concentrations in the filtered extracts were then determined by the standard methods. The analysis methods for the microporosity and the specific surface area of the sediment were the N2-BET method (Tristar II 3020, Micromeritics, USA). The metal contents (CA, Na, K, and Mg) of the sediment were determined using an ion emission spectrometer (ICP-2070, Baird, American). The air-dried sediment samples were finely ground and mixed with KBr at a mass ratio of 1
1, w/v) extract. The TOC of the sediment phase was analyzed using a TOC analyzer (N/C3000ChD, Jena, Germany). To extract mineral N from the sediment, the mixture of 5 g sediment and 25 mL 1 M KCl was shaken for 1 h before filtration through a 0.45 μm membrane filter.37 The ammonium-N, nitrate-N, and nitrite-N concentrations in the filtered extracts were then determined by the standard methods. The analysis methods for the microporosity and the specific surface area of the sediment were the N2-BET method (Tristar II 3020, Micromeritics, USA). The metal contents (CA, Na, K, and Mg) of the sediment were determined using an ion emission spectrometer (ICP-2070, Baird, American). The air-dried sediment samples were finely ground and mixed with KBr at a mass ratio of 1![[thin space (1/6-em)]](https://www.rsc.org/images/entities/char_2009.gif) :
:![[thin space (1/6-em)]](https://www.rsc.org/images/entities/char_2009.gif) 100 to analyze the FTIR.
100 to analyze the FTIR.
2.9 Statistical analysis
All the data were evaluated using one-way univariate analysis of variance to select reasonable measurements. Line graphs and a column chart were created using Origin 9.0 (OriginLab, USA). The EEM spectra were analyzed with MATLAB 2016b software using the DOMFluor toolbox. PARAFAC was applied to our EEM dataset using statistical and analytical assumptions as described by Stedmon and Bro.38 A box plot and heatmap were created by R Software V3.5.0 (The R Foundation for Statistical Computing, Vienna, Austria).3 Results and discussion
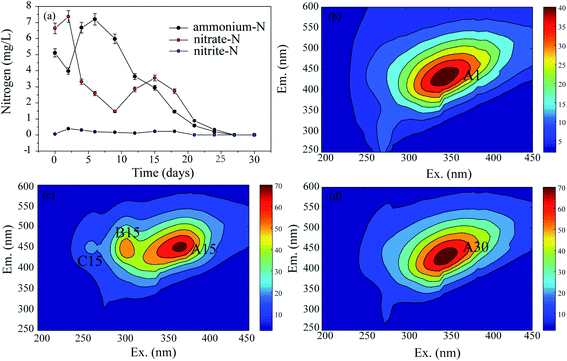
3.1 Temporal heterogeneity of the environment
To explore the changes in the N and organic C characteristics in the raw sediment over time under aerobic conditions, the mixed cultures without external N and C sources were examined. The N and organic C variation characteristics are shown in Fig. 2, where they are expressed as the residual N concentrations (Fig. 2(a)) and EEM spectra (Fig. 2(b–d)), respectively.In the present study, EEM spectra were used to analyze the fluorescence characteristics of organic C at different times in the mixed cultures. The results are exhibited in Fig. 2(b)–(d). In the 1st d (Fig. 2(b)), there was one peak corresponding to one type of substance. The peak was identified at excitation/emission wavelengths (Ex/Em) of 345/432 nm (peak A1), which have been associated with humic-like organics (fulvic acid). On the 15th d (Fig. 2(c)), there were three fluorescence peaks with the same emission wavelengths. The first peak at an Ex/Em of 369/450 nm (peak A15) corresponded to humic-like organics, the second peak at an Ex/Em of approximately 305/446 nm (peak B15) was identified as model humic acid polymers, and the third peak at an Ex/Em of 262/450 nm was associated with fulvic acid-like substances. On the 30th d, peak A30 (Ex/Em = 346/430 nm) was related to humic acid-like substances (Fig. 2(d)).
Through the monitoring of the EEM, the fluorescence characteristics of the organic C were recorded in detail. The A peaks, which corresponded to humic acid-like substances, occurred in the spectra on the 1st, 15th, and 30th d, and their intensities generally increased from 36 A.U. to 68 A.U. as the time increased from 1 d to 30 d, respectively. Therefore, it seems that humic acid-like substances are the main refractory organic C compounds which exist stably in aquatic ecosystems. This result was also confirmed by the PARAFAC examination (Fig. S2†).
3.2 Combined biotransformation performance of ammonium and phenanthrene
Because N and refractory organics, such as humic acid-like substances, were both detected in the aquatic ecosystem (Section 3.1), ammonium and phenanthrene were added to the mixed cultures to investigate the combined biotransformation performance of N and refractory organics under aerobic conditions (Fig. 3). The DO (Fig. S3†) and pH (Fig. S4†) were recorded as a function of time. Fig. 3(a) and (b) show the time courses of the ammonium-N, nitrate-N, nitrite-N, and phenanthrene concentrations when 20 mg L−1 of ammonium-N and 15 mg L−1 of phenanthrene were fed to the mixed cultures. The abiotic control experiment (C1) indicated that 44.15% of ammonium-N was lost within 2 days, which was mainly attributed to its adsorption onto the sediment (Fig. 3(a)). However, ammonium can be released from the sediment with the depletion of ammonium. It was noted that almost complete removal of ammonium-N was achieved within 26 d in N_PHE. A similar result was obtained in our previous study.46 However, Almasi et al.47 reported that the nitrogen removal efficiency of a constructed wetland system was not acceptable, which suggested the high ammonium-N removal capacity of the mixed cultures in this study. Changes in the concentrations of nitrate-N and nitrite-N throughout the process were also monitored. Nitrate-N was detected at a concentration of 1.2 mg L−1 on the 1st d owing to the release of nitrate from the sediment, and its concentration decreased remarkably within 4 d owing to aerobic denitrification.30 The accumulation of nitrate was undetectable in the following days, indicating the high aerobic denitrification capacity of the microorganisms. Nitrite was detected with a maximum concentration of 2.67 mg L−1 on the 10th d.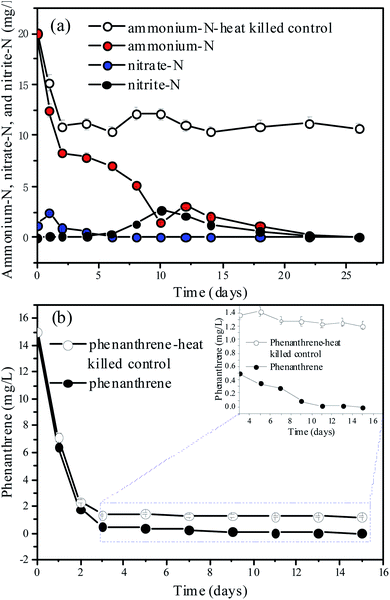 | ||
| Fig. 3 Time courses for (a) ammonium and (b) phenanthrene biodegradation by the bacteria. The values are the mean ± SD (error bars) of the three replicates. | ||
Phenanthrene concentration decreased notably, and approximately 99.98% of phenanthrene was transformed and biodegraded within 11 d in N_PHE (Fig. 3(b)). The abiotic control experiment suggested that 84.53% of phenanthrene was lost within 2 d. This observation may be explained by the adsorption of phenanthrene onto the sediment. However, phenanthrene was undetectable in the sediment on the 30th d, which may be due to the release of phenanthrene from the sediment in the pollutant biodegradation process.36 The overlapping FTIR spectra of the sediment in C2 and N_PHE also showed that there was no adsorbed phenanthrene in the sediment on the 30th d (Fig. S5†). These results suggest a high biotransformation capacity of the microorganisms for phenanthrene in N_PHE. A similar result was obtained by Jee et al.,48 who reported that complete phenanthrene disappearance was observed in the mixed sediment bioreactors operated for 7 d with the initial phenanthrene concentration of 88 mg kg−1. In another study, complete degradation of 5 mg L−1 phenanthrene occurred within 28 h by an aerobic mixed culture utilizing phenanthrene as its C source.49
3.3 Changes in organic C characteristics
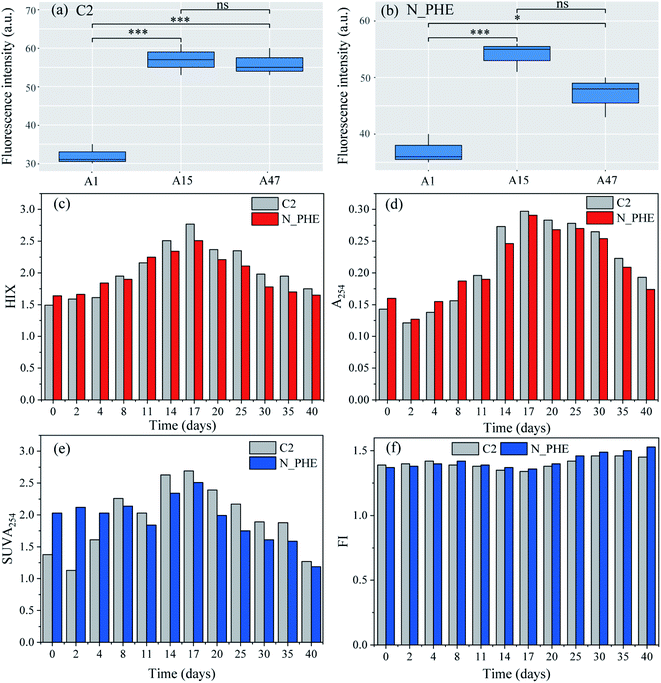
The presence of ammonium may significantly influence the biodegradation of phenanthrene.50 Therefore, the changes in organic C characteristics based on the fluorescence intensity, biodegradability and aromaticity in the combined ammonium and phenanthrene biotransformation process were evaluated in the present study. Fig. 4(a) and (b) show the fluorescence intensity of the humic acid-like peaks (A peaks) on the 1st, 15th, and 47th d in C2 and N_PHE, respectively. The intensity of the A peaks distinctly increased in C2 (P < 0.001), which indicated the release of humic acid-like substances from the sediment. The intensity showed significant changes in N_PHE. The intensity in N_PHE was higher than that in C2 on the 1st d and increased within 15 d (P < 0.001), which can be explained by the overlapping of the humic acid and phenanthrene fluorescence spectra and the adsorption of phenanthrene and its degradation products by humic acid.32 After that, the intensity decreased significantly (P < 0.05) owing to the transformation of refractory organics such as phenanthrene and humic acid-like substances, which suggests that the microorganisms were not inhibited by the high concentration of phenanthrene (15 mg L−1). Because microorganisms can benefit from organic C,51 the oxidation of phenanthrene and humic acid-like substances can also contribute to the growth of heterotrophic nitrifiers, which subsequently exert a positive influence on the degradation of humic acid-like substances.The HIX provides information about the complexity of the molecules and aromatic structures.52 As shown in Fig. 4(c), the HIX values increased stably from the 1st d to the 17th d in both the C2 and N_PHE, while they decreased notably after the 17th d. The results indicated that on the 17th d, the mixed cultures had the highest degree of condensation, conjugation (i.e., a low H/C ratio) and complexity of molecules, such as condensed aromatic rings, variously substituted aromatic rings, and/or highly unsaturated aliphatic chains.52,53 The HIX values of N_PHE were higher before the 8th d compared with those of the C2, whereas the opposite results were obtained after the 8th d; this is consistent with the results shown in Fig. 4(a) and (b). It appeared that the presence of both ammonium and phenanthrene reduced the degree of complexity, conjugation, and condensation of the molecules. The A254 values, which are an indicator of humic macromolecular organic C and aromatic substances with C![[double bond, length as m-dash]](https://www.rsc.org/images/entities/char_e001.gif) C and C
C and C![[double bond, length as m-dash]](https://www.rsc.org/images/entities/char_e001.gif) O bonds, had a similar variation trend to that of the HIX (Fig. 4(d)). This observation also supports the analysis that the combined biotransformation of ammonium and phenanthrene promotes the biodegradation of complex organic C, such as phenanthrene and humic acid-like substances.
O bonds, had a similar variation trend to that of the HIX (Fig. 4(d)). This observation also supports the analysis that the combined biotransformation of ammonium and phenanthrene promotes the biodegradation of complex organic C, such as phenanthrene and humic acid-like substances.
In order to further examine the organic C variations in N_PHE, the aromaticity was evaluated from the SUVA254 (Fig. 4(e)) and FI (Fig. 4(f)). Weishaar et al.27 reported that SUVA254 is linearly related to aromaticity, as determined by 13C-NMR for organic matter isolates obtained from a variety of aquatic environments. In addition to the SUVA254, the FI was strongly correlated with the aromaticity of organic matter and thus can be used as a surrogate for the general structural features of the C skeleton and the source.27 As shown in Fig. 4(e), SUVA254 increased within 17 d in C2 and N_PHE, whereas it decreased notably after the 17th d, thereby indicating the decreasing aromaticity and stability of organic matter at the end of the test. The SUVA254 values of N_PHE were lower than those of C2 after the 8th d, which was consistent with the results shown in Fig. 4(c) and (d). In contrast, the lower FI values indicated greater aromaticity and stability of organic C.28 It was found that the FI ranged from 1.34 to 1.45 with the lowest value on the 17th d in the C2, and from 1.36 to 1.53 with the lowest value on the 17th d in N_PHE (Fig. 4(f)).
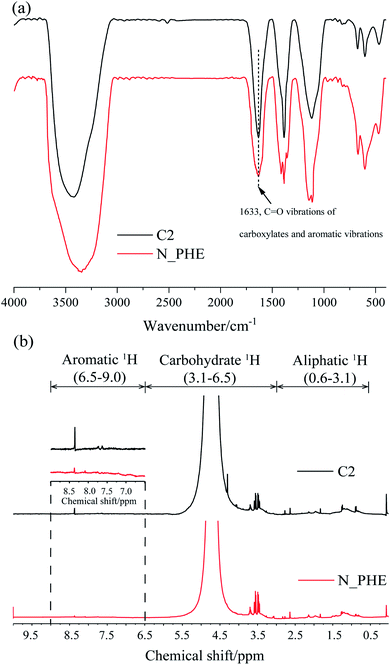
Regarding to the biodegradability (HIX and A254) and aromaticity (SUVA254 and FI), similar results were obtained from the FTIR and 1H NMR spectra of the water sample in C2 and N_PHE on the 30th day (Fig. 5). The broad band at 1633 cm−1, which can be attributed to C![[double bond, length as m-dash]](https://www.rsc.org/images/entities/char_e001.gif) O vibration of carboxylates and aromatic vibrations,54 had a lower energy in N_PHE compared with C2 (Fig. 5(a)). As possible assignments of 1H NMR spectra, the resonant absorption at 6.5–9.0 ppm originates from the hydrogen in aromatic rings,31 indicating aromatic structures in C2 and N_PHE (Fig. 5(b)). However, the peak intensity was lower in N_PHE, which was consistent with the CAro/CAli value (Table 1). These observations further suggest that part of the aromatic structure and some condensed molecules, such as unsaturated aliphatic chains, were easier to break down in N_PHE. The addition of ammonium and phenanthrene during the aerobic pollutant biotransformation process might have changed the microbial consortium and subsequently resulted in the higher biodegradability and low aromaticity in N_PHE relative to those in C2.
O vibration of carboxylates and aromatic vibrations,54 had a lower energy in N_PHE compared with C2 (Fig. 5(a)). As possible assignments of 1H NMR spectra, the resonant absorption at 6.5–9.0 ppm originates from the hydrogen in aromatic rings,31 indicating aromatic structures in C2 and N_PHE (Fig. 5(b)). However, the peak intensity was lower in N_PHE, which was consistent with the CAro/CAli value (Table 1). These observations further suggest that part of the aromatic structure and some condensed molecules, such as unsaturated aliphatic chains, were easier to break down in N_PHE. The addition of ammonium and phenanthrene during the aerobic pollutant biotransformation process might have changed the microbial consortium and subsequently resulted in the higher biodegradability and low aromaticity in N_PHE relative to those in C2.
| Aliphatic C/%, 0.6–3.1 ppm | Carbohydrate/%, 3.1–6.5 ppm | Aromatic C/%, 6.5–9.0 ppm | CAro/CAli | |
|---|---|---|---|---|
| C2 | 36.51% | 59.62% | 3.87% | 0.12 |
| N_PHE | 39.76 | 60.17% | 0.07% | 0.002 |
3.4 Microbial community structure identification
The sediment samples collected from the mixed cultures at different periods were analyzed by Illumina MiSeq sequencing to investigate the microbial community composition because the differences in the microbial consortia may contribute to the changes in organic C. The rarefaction curves of sediment samples based on the OTUs at 97% similarity (Fig. S6†) indicated that the sequencing depth for analyzing the diversity of the microbial communities was sufficient.The microbial successions during the ammonium and phenanthrene biotransformation process in the mixed cultures were presented at the genus level (Fig. 6). At the 0th day (N0), the microbial community was dominated by the genera Bacillus (17.84%), Massilia (4.69%), Flavisolibacter (4.48%), Paenarthrobacter (4.27%), and Azohydromonas (3.12%). Both ammonium and phenanthrene addition significantly changed the top five predominant phylogenetic groups. The average relative abundance of Azohydromonas increased from 3.12% to 25.20% within 15 d and then decreased to 8.73% on the 47th d. Its dominance in the mixed cultures suggests its substantial role in pollutant biotransformation. Azohydromonas is classified as a novel genus of the family Alcaligenaceae.55,56 However, some subpopulations of Alcaligenaceae can couple organic C consumption with nitrification, mainly via heterotrophic nitrification.57 The proportion of Massilia exhibited an evident increase (from 4.69% to 14.09%) within 4 d, while it decreased notably after the 4th d. Massilia sp. was reported to be a phenanthrene-degrading bacterium, and fewer aromatic molecules such as 1-hydroxy-2-naphthoic acid and phthalic acid were detected as the metabolites of phenanthrene.58 Therefore, it appears that Massilia biodegrades refractory organic C compounds, such as phenanthrene and humic acid-like substances, to other organic C compounds with low degrees of complexity, conjugation, condensation, and aromaticity, while Azohydromonas subsequently consumes these organic C compounds as well as ammonium.
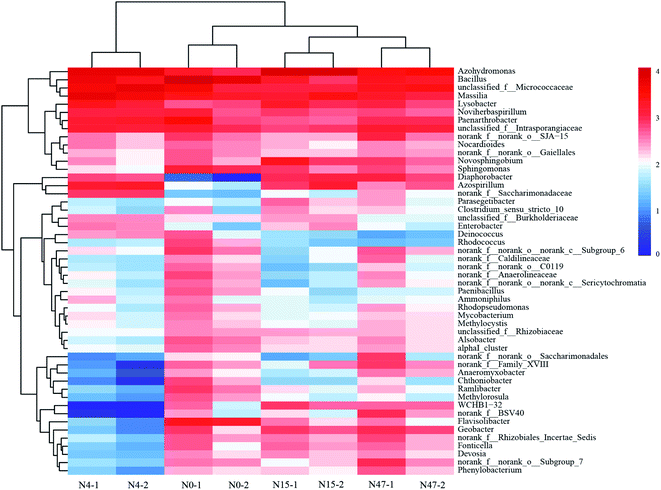 | ||
| Fig. 6 Heatmap showing the relative abundances and distributions of 16 representative rRNA sequences in the mixed cultures at different times. The genera with <0.1% relative abundance are not shown. | ||
Some other aromaticivorans-like microorganisms, such as Novosphingobium,59 Sphingomonas,60 and Diaphorobacter,61 were detected in the mixed cultures, which could contribute to the biodegradation of refractory organic C. Additionally, we detected some species responsible for heterotrophic nitrification and/or aerobic denitrification, such as Bacillus,62 Azospirillum,63 and Noviherbaspirillum.64 Therefore, it can be concluded that ammonium as a N source and phenanthrene as a C source are beneficial to the enrichment of certain functional microbial consortia, and certain heterotrophs in mixed nitrifying cultures are involved in refractory organic C biotransformation and biodegradation.
3.5 Ecological niche
The diversity indexes, which are indicators of the ecological niche of biological settings, are shown in Fig. 7(a). The results demonstrated that the microbial richness and community diversity varied remarkably throughout the phenanthrene and ammonium biotransformation process, which were presented by the H, EI, and Rr values. The H values, which incorporated the richness of the proportional species populations and the microbial community, decreased from 5.17 to 3.85 within 4 d owing to the elimination of biomass with poor viability under selective pressure.17 After phenanthrene was transformed in the mixed cultures, the H values increased notably from 3.85 to 5.30. The EI values, which represented the size of the dominant species group and demonstrated the evenness of the microbial community, had the same variation trend as that of the H values. The Rr values, which determined the number of dominant species, were the highest on the 4th d. The contradictory diversity results based on the Rr vs. H (or EI) were probably caused by the presence of phenanthrene and ammonium benefitting the enrichment of certain microbial consortia that were well suited for special purposes, such as the removal of ammonium and phenanthrene in the present study.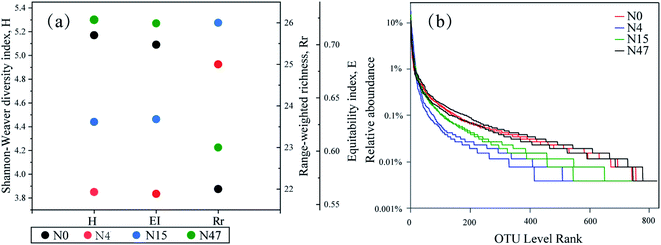 | ||
| Fig. 7 (a) Diversity indices (the mean value of two repetitions) and (b) rank–abundance curves derived from the mixed cultures. | ||
The evenness and richness of biomass can also be interpreted from ecological parameters such as rank abundance curves,33 which are presented in Fig. 7(b). On the horizontal axis, the curve width reflects the species richness, and a wider range indicates greater richness. The smoothness of the curve indicates the distribution evenness, and a flat curve indicates an even distribution. Fig. 7(b) shows that the distribution ranges of N0 and N47 were wider than those of N4 and N15, which demonstrated that the presence of ammonium and phenanthrene reduced the species richness. Our previous study16 also showed that the richness of microorganisms decreased after the addition of ammonium and aniline to the mixed cultures. The curve plot of N4 was the smallest, thereby suggesting the most even species distribution of N4. Thus, the rank abundance distribution confirmed the community diversity analysis of the H and EI values. Mixed cultures of microorganisms were not only exposed to complex water composition consisting of ammonium and phenanthrene, but were also subjected to sufficient oxygen in the pollutant biotransformation process. Therefore, the reduction in biodiversity (i.e., H and EI) of the microorganisms was mainly attributed to the presence of ammonium and phenanthrene, and the changes in the organic C characteristics could be related to the variation in the microorganisms.
4 Conclusions
Mixed cultures were established by feeding with phenanthrene and ammonium to investigate the changes in organic C based on the fluorescence intensity and the degrees of biodegradability and aromaticity. The main findings were as follows:● Significant biotransformation capacity of microorganisms for ammonium and phenanthrene was obtained.
● The combined biotransformation of ammonium and phenanthrene promoted the degradation of organic C and reduced the degrees of complexity, conjugation, condensation, and aromaticity of the molecules.
● The changes in organic C were mainly caused by two key organisms, namely Massilia and Azohydromonas.
● The selection pressure of ammonium and phenanthrene was the decisive factor for the changes in the organic C characteristics.
Conflicts of interest
There are no conflicts to declare.Acknowledgements
This work was financially supported by the National Natural Science Foundation of China (program no. 41601338 and 41502240), Natural Science Foundation of Shaanxi Province (program no. 2020JM-110 and 2018JQ4019), National College Students Innovation and Entrepreneurship Training Program (program no. S201910699176), and Fundamental Research Funds for the Central Universities (program no. 3102018zy042).References
- D. Tilman, K. G. Cassman, P. A. Matson, R. Naylor and S. Polasky, Nature, 2002, 418, 671 CrossRef CAS.
- J. N. Galloway, A. R. Townsend, J. W. Erisman, M. Bekunda, Z. Cai, J. R. Freney, L. A. Martinelli, S. P. Seitzinger and M. A. Sutton, Science, 2008, 320, 889–892 CrossRef CAS.
- Q. Zhou, S. Takenaka, S. Murakami, P. Seesuriyachan, A. Kuntiya and K. Aoki, J. Biosci. Bioeng., 2007, 103, 185–191 CrossRef CAS.
- X. Liu, Y. Wu, R. Sun, S. Hu, Z. Qiao, S. Wang and X. Mi, Environ. Res., 2020, 189, 109962 CrossRef CAS.
- Z. Qin, Z. Zhao, l. Xia, A. Adam, Y. Li, D. Chen, S. M. Mela and H. Li, Environ. Int., 2019, 131, 104940 CrossRef CAS.
- A. Almasi, M. Mahmoudi, M. Mohammadi, A. Dargahi and H. Azizabadi, Toxin Rev., 2019, 8, 1–9 Search PubMed.
- N. Bourguignon, V. Irazusta, P. Isaac, C. Estevez, D. Maizel and M. A. Ferrero, Ecotoxicol. Environ. Saf., 2019, 175, 19–28 CrossRef CAS.
- S. Zhou, C. Xia, T. Huang, C. Zhang and K. Fang, Chemosphere, 2018, 211, 1123–1136 CrossRef CAS.
- D. J. Arp, L. A. Sayavedra-Soto and N. G. Hommes, Arch. Microbiol., 2002, 178, 250–255 CrossRef CAS.
- H. H. Sun, T. Narihiro, X. Y. Ma, X. X. Zhang, H. Q. Ren and L. Ye, Sci. Total Environ., 2019, 666, 245–251 CrossRef CAS.
- S. Menendez, I. Barrena, I. Setien, C. Gonzalez-Murua and J. M. Estavillo, Soil Biol. Biochem., 2012, 53, 82–89 CrossRef CAS.
- J. F. Lindgren, I. M. Hassellov, J. R. Nyholm, A. Ostin and I. Dahllof, Mar. Pollut. Bull., 2017, 120, 333–339 CrossRef CAS.
- T. Vannelli and A. B. Hooper, Biochemistry, 1995, 34, 11743–11749 CrossRef CAS.
- Y. Q. Liu, J. H. Tay, V. Ivanov, B. Y. P. Moy, L. Yu and S. T. L. Tay, Process Biochem., 2005, 40, 3285–3289 CrossRef CAS.
- C. Feng, L. Huang, H. Yu, X. Yi and C. Wei, Water Res., 2015, 76, 160–170 CrossRef CAS.
- Z. X. Qiao, R. Sun, Y. G. Wu, S. H. Hu, X. Y. Liu and J. W. Chan, Water, Air, Soil Pollut., 2020, 231, 112 CrossRef CAS.
- Y. Jiang, L. Wei, K. Yang and H. Y. Wang, Sci. Total Environ., 2019, 646, 841–849 CrossRef CAS.
- Y. Li, X. P. Yue, G. Y. Wang and H. Y. Li, Adv. Mater. Res., 2014, 1073–1076, 870–873 Search PubMed.
- J. Lu, Q. Jin, Y. He, X. He and J. Zhao, Water, Air, Soil Pollut., 2014, 225, 2125 CrossRef.
- Y. H. Bai, Q. H. Sun, C. Zhao, D. H. Wen and X. Y. Tang, Biodegradation, 2010, 21, 335–344 CrossRef CAS.
- F. J. Li, B. Q. Jiang, P. Nastold, B. A. Kolvenbach, J. Q. Chen, L. H. Wang, H. Y. Guo, P. F. X. Corvini and R. Ji, Environ. Sci. Technol., 2015, 49, 4283–4292 CrossRef CAS.
- L. Guo, Q. Chen, F. Fang, Z. Hu, J. Wu, A. Miao, L. Xiao, X. Chen and L. Yang, Bioresour. Technol., 2013, 142, 45–51 CrossRef CAS.
- Q. Jin, J. Lu, J. Wu and Y. Luo, Estuarine, Coastal Shelf Sci., 2017, 191, 150–156 CrossRef CAS.
- B. Maliszewska-Kordybach, A. Klimkowicz-Pawlas, B. Smreczak and D. Janusauskaite, J. Environ. Qual., 2007, 36, 1635–1645 CrossRef CAS.
- L. E. Sverdrup, F. Ekelund, P. H. Krogh, T. Nielsen and K. Johnsen, Environ. Toxicol. Chem., 2002, 21, 1644–1650 CrossRef CAS.
- Z. X. Qiao, Y. G. Wu, J. Qian, S. H. Hu, J. W. Chan, X. Y. Liu, R. Sun, W. D. Wang and B. Zhou, Environ. Sci. Pollut. Res., 2020, 27, 9307–9317 CrossRef CAS.
- J. L. Weishaar, G. R. Aiken, B. A. Bergamaschi, M. S. Fram, R. Fujii and K. Mopper, Environ. Sci. Technol., 2003, 37, 4702–4708 CrossRef CAS.
- D. M. McKnight, E. W. Boyer, P. K. Westerhoff, P. T. Doran, T. Kulbe and D. T. Andersen, Limnol. Oceanogr., 2001, 46, 38–48 CrossRef CAS.
- S. Q. Sun, H. Y. Cai, S. X. Chang and J. S. Bhatti, Sci. Rep., 2015, 5, 17496 CrossRef CAS.
- S. Zhou, Y. Zhang, T. Huang, Y. Liu, K. Fang and C. Zhang, Sci. Total Environ., 2019, 651, 998–1010 CrossRef CAS.
- S. Hu, C. Lu, C. Zhang, Y. Zhang, H. Yao and Y. Wu, J. Soils Sediments, 2016, 16, 327–338 CrossRef CAS.
- S. H. Kang and B. S. Xing, Environ. Sci. Technol., 2005, 39, 134–140 CrossRef CAS.
- I. M. Grześ, Pedobiologia, 2009, 53, 65–73 CrossRef.
- S. D. Foster and P. K. Dunstan, Biometrics, 2010, 66, 186–195 CrossRef.
- APHA, Standard Methods for the Examination of Water and Wastewater, American Public Health Association, Washington, DC, USA, 22nd edn, 2012 Search PubMed.
- X. Y. Zhang, Y. G. Wu, S. H. Hu, C. Lu and H. R. Yao, Environ. Sci. Pollut. Res., 2014, 21, 8271–8283 CrossRef CAS.
- Y. S. Pei, J. Wang, Z. Y. Wang and Z. F. Yang, Procedia Environ. Sci., 2010, 2, 1988–1996 CrossRef.
- C. A. Stedmon and R. Bro, Limnol. Oceanogr.: Methods, 2008, 6, 572–579 CrossRef CAS.
- W. F. James, J. W. Barko and H. L. Eakin, Can. J. Fish. Aquat. Sci., 2004, 61, 538–546 CrossRef.
- H. Gao, F. Schreiber, G. Collins, M. M. Jensen, J. E. Kostka, G. Lavik, D. de Beer, H. Y. Zhou and M. M. M. Kuypers, ISME J., 2010, 4, 417–426 CrossRef CAS.
- O. Coban, P. Kuschk, U. Kappelmeyer, O. Spott, M. Martienssen, M. S. Jetten and K. Knoeller, Water Res., 2015, 74, 203–212 CrossRef CAS.
- W. Chen, P. Westerhoff, J. A. Leenheer and K. Booksh, Environ. Sci. Technol., 2003, 37, 5701–5710 CrossRef CAS.
- P. G. Coble, S. A. Green, N. V. Blough and R. B. Gagosian, Nature, 1990, 348, 432–435 CrossRef CAS.
- S. R. Ahmad and D. M. Reynolds, Water Res., 1999, 33, 2069–2074 CrossRef CAS.
- D. M. Reynolds and S. R. Ahmad, Water Res., 1997, 31, 2012–2018 CrossRef CAS.
- Z. X. Qiao, R. Sun, Y. G. Wu, S. H. Hu, X. Y. Liu, J. W. Chan and X. H. Mi, Environ. Res., 2020, 191, 110069 CrossRef CAS.
- A. Almasi, A. Dargahi, M. M. H. Ahagh, H. Janjani, M. Mohammadi and L. Tabandeh, J. Chem. Pharm. Sci., 2016, 9, 2924–2928 CAS.
- V. Jee, D. M. Beckles, C. H. Ward and J. B. Hughes, Water Res., 1998, 32, 1231–1239 CrossRef CAS.
- S. Y. Yuan, S. H. Wei and B. V. Chang, Chemosphere, 2000, 41, 1463–1468 CrossRef CAS.
- S. Y. Yuan, J. S. Chang, J. H. Yen and B. V. Chang, Chemosphere, 2001, 43, 273–278 CrossRef CAS.
- D. Qu, C. Wang, Y. Wang, R. Zhou and H. Ren, RSC Adv., 2015, 5, 5149–5157 RSC.
- K. Kalbitz, J. Schmerwitz, D. Schwesig and E. Matzner, Geoderma, 2003, 113, 273–291 CrossRef CAS.
- J. Akagi, A. Zsolnay and F. Bastida, Chemosphere, 2007, 69, 1040–1046 CrossRef CAS.
- B. Chavez-Vergara, A. Merino, G. Vazquez-Marrufo and F. Garcia-Oliva, Geoderma, 2014, 235, 133–145 CrossRef.
- C. H. Xe and A. Yokota, Int. J. Syst. Evol. Microbiol., 2006, 56, 497 CrossRef.
- M. Zafar, S. Kumar, S. Kumar and A. K. Dhiman, Biocatal. Agric. Biotechnol., 2012, 1, 70–79 CrossRef CAS.
- M. Shoda and Y. Ishikawa, J. Biosci. Bioeng., 2014, 117, 737–741 CrossRef CAS.
- J. Lou, H. P. Gu, H. Z. Wang, Q. L. An and J. M. Xu, J. Biotechnol., 2016, 218, 49–50 CrossRef CAS.
- X. B. Liao, C. Chen, C. H. Chang, Z. Wang, X. J. Zhang and S. G. Xie, Biotechnol. Bioprocess Eng., 2012, 17, 881–886 CrossRef CAS.
- A. J. Daugulis and C. M. McCracken, Biotechnol. Lett., 2003, 25, 1441–1444 CrossRef CAS.
- C. Muangchinda, S. Chavanich, V. Viyakarn, K. Watanabe, S. Imura, A. S. Vangnai and O. Pinyakong, Environ. Sci. Pollut. Res., 2015, 22, 4725–4735 CrossRef CAS.
- Q. L. Zhang, Y. Liu, G. M. Ai, L. L. Miao, H. Y. Zheng and Z. P. Liu, Bioresour. Technol., 2012, 108, 35–44 CrossRef CAS.
- B. S. Kundu, K. R. Dadarwal and P. Tauro, J. Biosci., 1987, 12, 51–54 CrossRef CAS.
- S. Chen, G. Qi, G. Ma and X. Zhao, Microbiol. Res., 2020, 231, 126373 CrossRef CAS.
Footnote |
| † Electronic supplementary information (ESI) available. See DOI: 10.1039/d0ra08655j |
| This journal is © The Royal Society of Chemistry 2021 |

