
 Open Access Article
 This Open Access Article is licensed under a Creative Commons Attribution-Non Commercial 3.0 Unported Licence
Reversible and irreversible membrane fouling in hollow-fiber UF membranes filtering surface water: effects of ozone/powdered activated carbon treatment†
Weiwei Huang abc,
Yuanhong Zhuc,
Lin Wangd,
Weiguang Lva,
Bingzhi Dong*b and
Wenzong Zhou*a
abc,
Yuanhong Zhuc,
Lin Wangd,
Weiguang Lva,
Bingzhi Dong*b and
Wenzong Zhou*a
aEco-Environment Protection Research Institute, Shanghai Academy of Agricultural Sciences, Shanghai 201403, China. E-mail: lovecity@outlook.com; Fax: +86-21-62208660; Tel: +86-21-62208660
bSchool of Environmental Science and Engineering, Tongji University, Shanghai 200092, China. E-mail: 463084011@qq.com
cShanghai Qingpu Modern Agriculture Park, Shanghai 201403, China
dSchool of Municipal and Environmental Engineering, Shandong Jianzhu University, Jinan 250101, China
First published on 10th March 2021
Abstract
This study investigated the reversible and irreversible membrane fouling behavior of micro polluted water by ozone/powdered activated carbon (PAC)/ultrafiltration treatment. The results indicated that PAC mainly adsorbed low-molecular weight organics and reduced the irreversible fouling resistance in ultrafiltration, while there existed a threshold PAC dosage for total and reversible fouling resistance alleviation. Ozone at low doses exerted little effect on membrane fouling alleviation, while higher doses controlled total and reversible fouling by reducing macromolecular biopolymers and humic-like substances. Combined ozone and PAC pretreatment had greater effects on both reversible and irreversible fouling reduction than individual PAC and ozone treatment, demonstrating synergistic effects in the reduction of organic content in the feed water, including macromolecular biopolymers, humic-like, low-molecular weight neutral and building blocks. Backwashing and chemical cleaning analysis revealed that biopolymers and humic-like substances were the main organics that caused hydraulic reversible fouling, whereas low-molecular organics of building blocks and neutral, as well as humic-like substances were the main components that caused hydraulic irreversible fouling. Combined ozone and PAC treatment not only improved the backwashing efficiency but also reduced the membrane fouling during backwashing, as well as reversible and irreversible fouling. The cake layer formation and standard pore blocking were the major mechanisms for ultrafiltration membrane fouling, of which standard pore blocking exerted more important effects in the membrane fouling formation and alleviation by individual and combined PAC and ozone treatment.
1. Introduction
Membrane filtration has grown in prevalence in drinking water and wastewater treatment due to its advantageous water quality and relatively low energy consumption compared with traditional water treatment.1 Nevertheless, two limitations to its wider application are membrane fouling and inefficiency regarding the removal of low-molecular weight of organic matter. As such, fouling may markedly reduce the filtration flux and increase the operation cost, as well as the membrane life.2 Natural organic matter (NOM) is one of the main critical elements leading to membrane fouling. Because NOM exists ubiquitously in natural water and consists of multiple components, such as microbial cells, proteins, polysaccharides, and humic acids,3 the membrane fouling might become more complicated and difficult to resolve.To overcome fouling issues during ultrafiltration (UF), many pretreatment methods, such as coagulation, pre-adsorption, pre-oxidation, and pre-filtration have been proposed.4,5 Powdered activated carbon (PAC) adsorption prior to membrane filtration is a promising technology for removing organic matter, which has been widely employed in water treatment. PAC can efficiently remove low-molecular weight (MW) organics.6 While the effects of PAC on membrane fouling are inconsistent. Some researchers have found that PAC adsorption of membrane foulants helps to alleviate membrane fouling; while the fraction of NOM not adsorbed by PAC may result in higher membrane fouling.7 Ozone is also one of the potential alternative pretreatments that can be used to enhance macromolecular organic rejections. Because O3 can break down macromolecular organics into small molecular organics, aromatic rings can be efficiently removed, and the hydrophobic organics are reduced.8 Previous research indicated that ozone, when applied solely as a pretreatment, is in some cases able to reduce membrane fouling;9 however, the polymeric membrane fouling might be intensified at high ozone doses.10
Combined ozone and PAC technology might better enhance the removals of contaminants and alleviate UF fouling.11,12 Researchers used combined ozone and PAC treatment to remove biocides, antimycotics, and antibiotics in a sewage treatment plant and found that conventional treatment with added full-scale ozonation was able to remove most of the studied micropollutants, except for benzotriazoles and fluconazole (<50%).13 Nevertheless, as the membrane fouling induced by NOM in natural waters was not composed of a certain specific membrane foulant or single membrane fouling mechanism but instead of multiple membrane foulants that work together, while during the operation process, the changes of organic substances might lead to dynamic changes of membrane fouling, whereas both ozone and PAC treatment might influence the membrane fouling separately and simultaneously, which might result in more complicated membrane fouling behavior, despite some efforts have been made to investigate the membrane fouling mechanism by ozone and PAC treatment,11 the dynamic changes of reversible and irreversible resistance remain need to be clearly elucidated, which might provide more accurate information for large-scale UF application as well as membrane fouling control in actual engineering.
This study therefore systematically investigated the dynamic changes in reversible and irreversible membrane fouling of raw water by ozone and PAC treatments. High-performance size-exclusion chromatography (HPSEC) combined with peak-fitting prediction14 was utilized to analysis the NOM removal, the effectiveness of organic removal was determined which was suspected to provide the further information of specific organics on reversible and irreversible membrane fouling.
2. Materials and methods
2.1 Raw water
The water used was collected from Sanhaowu Lake, on the campus of Tongji University, Shanghai, China, which was collected to represent surface water polluted by allochthonous NOM. The pH of the water sample was 8.2, the turbidity level was 43 NTU, and the dissolved organic carbon (DOC), UV254 values were approximately 2.697–3.7 mg L−1 and 0.067–0.124 cm−1, respectively.2.2 Membrane modules
A hollow-fiber UF membrane (Inge, Germany) made of modified polyethersulfone was utilized in this study. The membrane was consisted of seven capillaries with a unique porous membrane structure. The diameter of each capillary was 0.9 mm, and the pore size of the membrane was 0.02 μm. Seven tubes of modified polyethersulfone (Inge, Germany) with a length of 50 cm each were assembled into a module with a total surface area of 0.064 m2. The filtration mode was dead-end inside-out filtration. A cross-sectional diagram of the porous membrane can be found in Fig. 1.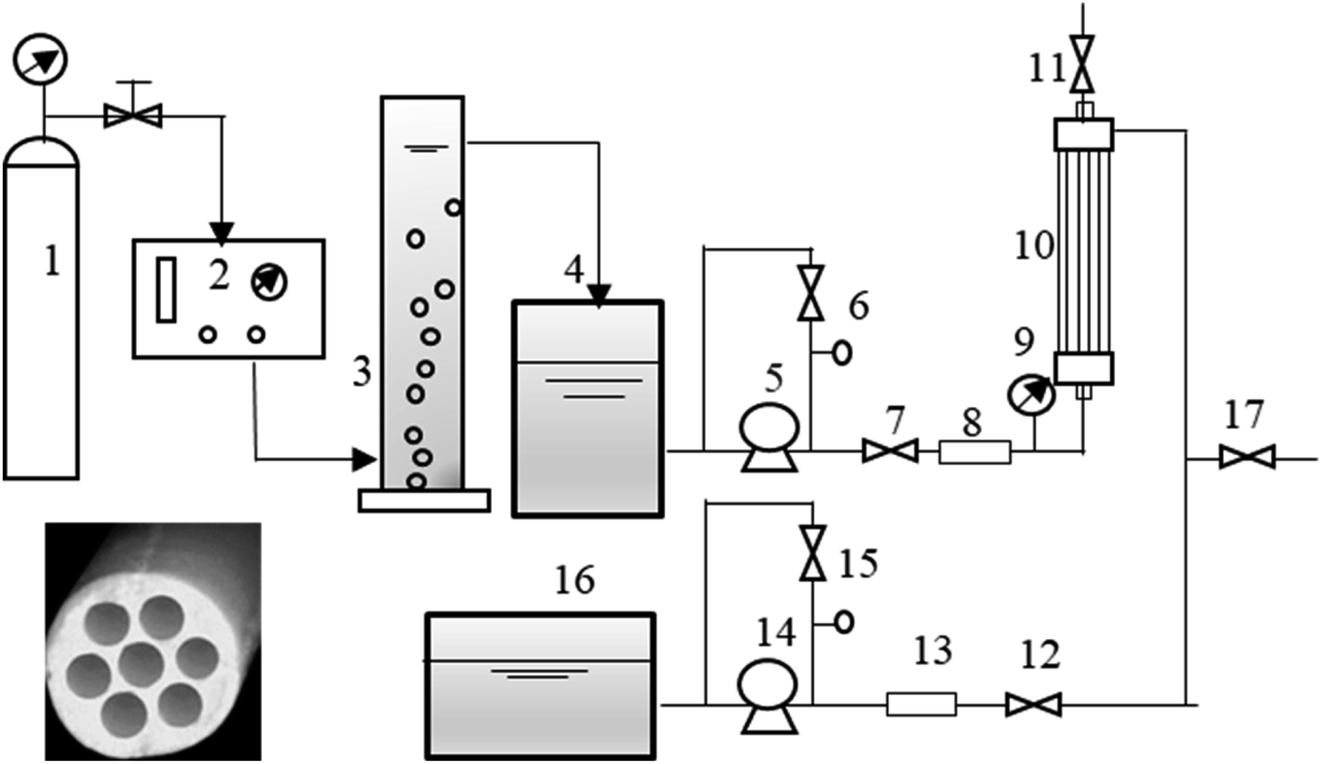 | ||
| Fig. 1 Schematic of the membrane filtration setup and a cross-sectional diagram of the porous membrane. (1) Oxygen tank (2) ozone generator (3) ozone contact column (4) PAC and feed water tank (5) centrifugal pump (6) flow control (7) valve 1 (8) flow meter (9) pressure gauge (10) hollow fiber membrane (11) valve 3 (12) valve 2 (13) flow meter (14) centrifugal pump (15) flow control (16) backwashing tank (17) valve 4. | ||
2.3 Pretreatments and UF experiment
Ozone gas was generated by passing high-purity oxygen gas through an ozone generator (COM-AD-01, ANSEROS, Germany). The ozone experiment was consistent with that in our previous research.8 Low doses of ozone (0.5 mg L−1 and 1 mg L−1) were used in this study because low ozone concentrations might have less adverse effects on the membrane than ozone of high doses.15PAC adsorption tests were performed at doses of 10 mg L−1, 20 mg L−1, and 100 mg L−1. Adsorption treatment was performed with rapid mixing for 30 min at 90 rpm, slow mixing for 20 min at 50 rpm, and supernatant filtration with a 10 μm filter. Then, the water sample was pumped into a water tank for UF treatment. The characteristics of PAC and the isothermal adsorption curve are in Fig. S1 and Table S1,† as can be seen, the DOC in water decreased with increasing of PAC dosage, whereas the declining trend of DOC decreased when PAC >30 mg L−1, which indicated that PAC 30 mg L−1 might have great effects on the concentration of equilibrium solutions.
UF experiments were carried out in a low-pressure membrane cycle-based automatic operating system with a programmable logic controller (PLC); the system was consisted of a raw water tank, a backwash tank, two centrifugal pumps (MGP-M256B220, IWAKI, Japan), two flow meters, an inlet pressure gauge (XP2i, Crystal), an outlet pressure gauge, and a hollow fiber module. A schematic illustration of the experimental setup can be found in Fig. 1. When conducting the filtration experiment, the filtration flux was set at 80 L (m2 h)−1. Each UF experiment included 3 continuous filtration cycles. Every filtration cycle included 4 steps: (1) filling with water for 80 s at 200 ml min−1 during the first operation cycle (20 s in the remaining filtration cycles), (2) filtration for 90 min at 80 ml min−1, (3) positive flushing using raw water for 60 s at 200 ml min−1, and (4) backwashing using filtered water for 80 s at 240 ml min−1. Before filtration, the membrane filtration flux of Milli-Q water under different operation pressures was determined, and the feed water was prefiltered with a 10 μm filter.
After all the filtration cycles ended, the UF membrane was subjected to chemical cleaning. The following specific cleaning processes were used: the fouled membranes were first alkaline-cleaned with 0.6 wt% NaOH for 2 h at 60 ml min−1, then acid-washed with 0.1 wt% HCl for 2 h at 60 ml min−1. Thereafter, the organic matter from the feed water, permeate, backwashing effluent, and chemical cleaning effluent was analyzed. Notably, despite the chemical cleaning were conducted after each filtration, there were slight differences among the initial transmembrane pressure (TMP0) levels; therefore, TMP/TMP0 was adopted for the convenience of comparison among various pretreatment methods. And the characteristics of water samples are consistent during every batch of UF experiment.
2.4 Membrane fouling analysis
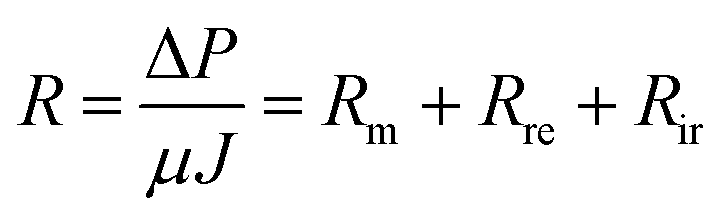
The membrane filtration resistance (Rm), reversible fouling resistance (Rre), and irreversible fouling resistance (Rir) at the end of filtration were calculated by Darcy's law:
 | (1) |
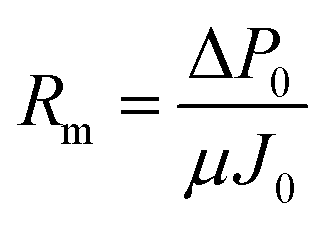
Rm was first obtained by measuring the module flux of the virgin membrane (J0) and TPM of P0 under deionized (DI) water, which can be calculated according to eqn (2).
 | (2) |
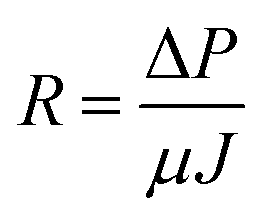
Then, the total fouling resistance (R) in each experiment was acquired by measuring the fouling membrane flux (J) and TPM of ΔP at the end of filtration of raw water.
 | (3) |
Thereafter, the fouled membrane surface was flushed and backwashed with DI water to remove the external foulants, the clean water flux (J1) and TPM of ΔPe were measured again with the flushed membrane to obtain R1,
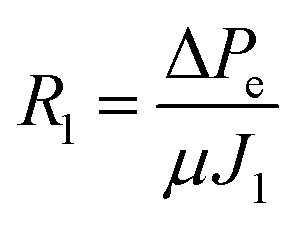 | (4) |
Rre and Rir were calculated by eqn (5) and (6), respectively.
| Rir = R1 − Rm | (5) |
| Rre = R − Rir | (6) |
2.5 Analytical methods
DOC was determined by a TOC analyzer (TOC-VCSH, Shimadzu, Japan). Ultraviolet (UV) absorbance at 254 nm (UV254) was measured by a UV spectrophotometer (Hach-5000). Aqueous ozone was measured using a spectrophotometer via the indigo method.16Protein was determined by the modified Lowry method.17 Ammonia nitrogen was determined by the salicylic acid method. A Hach ammonia nitrogen detection reagent package and cyanuric acid ammonia reagent were used for the determination.
HPSEC (Waters e2695, USA) coupled with a UV/visible detector (Waters 2489, USA)-TOC analyzer (Sievers 900 Turbo, USA) was adopted to measure the MW distribution of organic matter. The chromatogram analyses were performed using the peak-fitting technique with the PeakFit software package, Version 4.12 (Systat Software Inc., CA, USA), with 54 samples (9 treatments × 2 samples (raw water, permeate) ×3 parallel = 54 samples) analyzed.18,19
To ensure the accuracy of the experimental results, all UF experiments repeated three times, and the errors between the data and TMPs of duplicated tests were calculated and <0.05.
2.6 Modeling for membrane fouling process
Four constant flow individual fouling models including complete blocking, standard blocking, intermediate blocking, and cake filtration were developed to interpret the TMP increases of low-pressure membrane filtration in dead-end mode with constant flowrate.20 However, considering that individual fouling model might not be sufficient to elucidate the membrane fouling mechanism, five combined fouling models including cake-complete, cake-intermediate, complete-standard, intermediate-standard, and cake-standard were therefore utilized to better interpret the membrane fouling mechanisms, which were as follow21Cake-complete:
Cake-intermediate:
Complete-standard:
 | (7) |
Intermediate-standard:
 | (8) |
Cake-standard:
 | (9) |
The modeling process was conducted using Origin 9.0. Moreover, the experimental data were fitted according to these equations with the sum of squares (R2) between the experimental data and fitted values, which indicated the goodness of model fit.
3. Results and discussion
3.1 Variations in TMP and fouling resistance with PAC and ozone treatment
Fig. 2 shows the normalized TMP/TMP0 during the filtration of natural waters with individual PAC and ozone treatment and combined PAC and ozone treatment. For the control sample of natural water without any treatment, TMP/TMP0 was 2.15 after the first filtration cycle and increased to 3.21 at the end of filtration. However, when the water was treated with individual PAC pretreatment, PAC had little effects on membrane fouling alleviation at low doses, and TMP/TMP0 increased at 10 mg L−1 and 20 mg L−1 PAC but decreased at 100 mg L−1 PAC, indicating that there might exist a threshold PAC dosage for membrane fouling control when UF is conducted in constant-flux mode. This phenomenon might be explained that although PAC could absorb some organic matter as previous research suggested,22 as the organics absorbed by PAC at low doses might not the organics of membrane foulants, while those organics not adsorbed might remain cause severe membrane fouling,7,23 leading to the aggravated TMP at PAC low doses.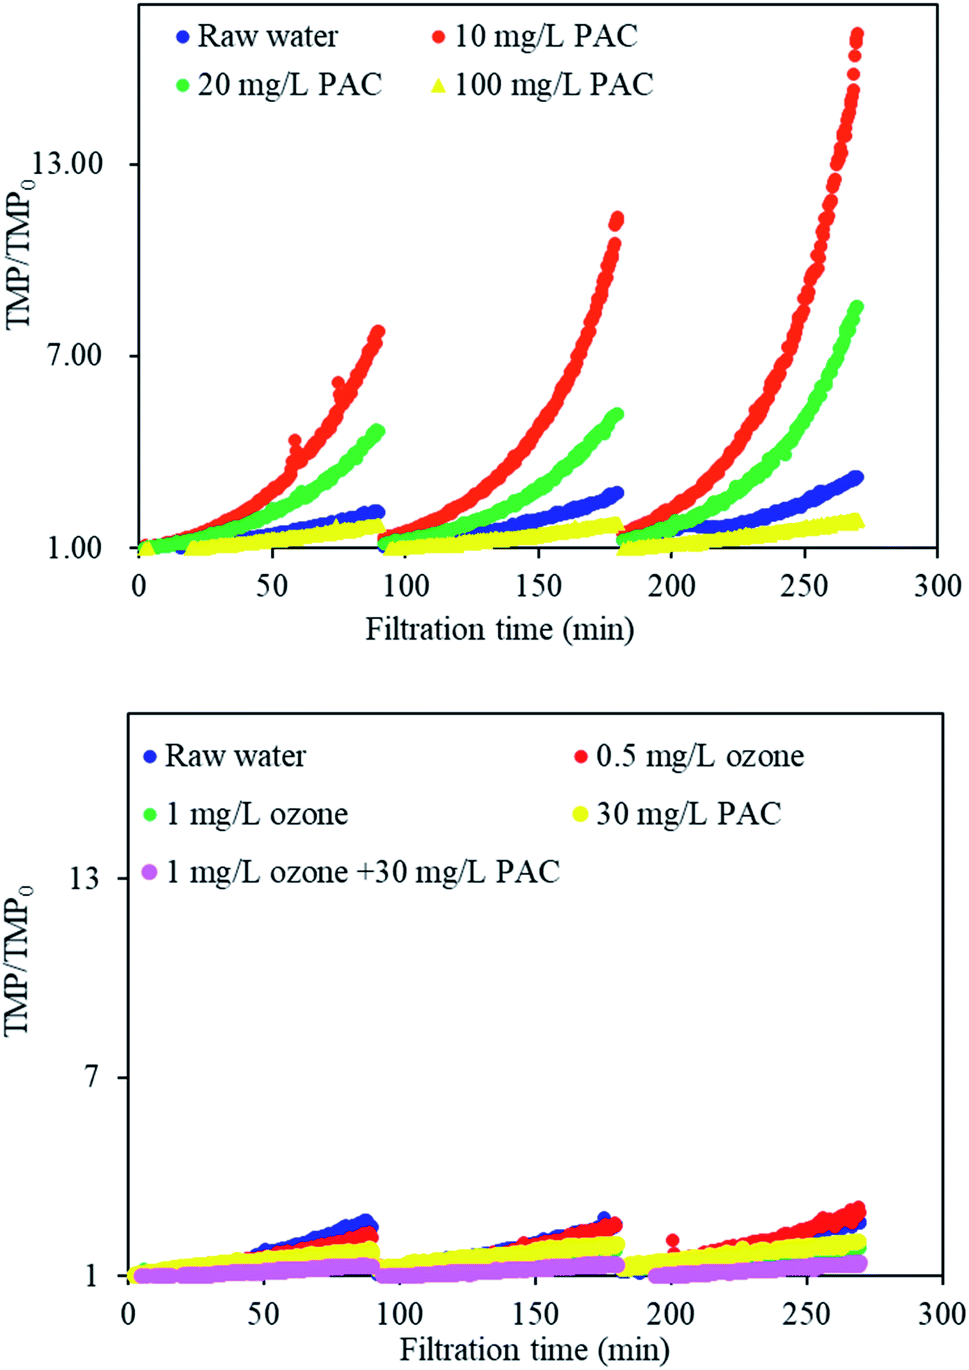 | ||
| Fig. 2 Variation in normalized TMP/TMP0 during ozone/PAC/UF processes as a function of time. | ||
The TMP/TMP0 results with ozone were slightly different from those obtained with the PAC procedure. Preozonation effectively decreased the TMP in the first filtration cycle, while at the end of filtration, TMP/TMP0 increased at a low dosage of 0.5 mg L−1 but decreased at 1 mg L−1 ozone, suggesting that low doses of ozone exerted little effects on membrane fouling alleviation, while higher doses of ozone greatly decreased the TMP. Combined with the isothermal adsorption curve and the TMP changes that PAC 30 mg L−1 might have great effects on the concentration of equilibrium solution, 30 mg L−1 PAC and 1 mg L−1 ozone were therefore used in the following combined treatment to improve the effects of PAC and ozone treatment on membrane fouling alleviation.
A comparison with the corresponding results from individual PAC or ozone treatment revealed that TMP/TMP0 was further decreased under combined ozone and PAC treatment. TMP/TMP0 was 1.33 under combined treatment, in contrast to values of 1.74 for 1 mg L−1 ozone and 2.00 for 30 mg L−1 PAC at the end of filtration. This result suggested that combined PAC and ozone treatment could better control the increases in TMP. This effect may be attributed to the fact that ozone oxidation can decrease membrane fouling, as found in many studies;21 when ozone is present, macromolecular organics can be oxidized, the small-MW organics can also be adsorbed by PAC, which might further alleviate membrane fouling.24
Fig. 3 compares the extent of membrane fouling in terms of R, Rir, and Rre under individual PAC and ozone treatment and combined treatment. Rm was relatively consistent for all the natural water; however, under individual PAC treatment, R was 1.7 × 10¹³ (m−1) for 10 mg L−1 PAC but decreased to 1.16 × 10¹³ (m−1) and 2.88 × 10¹² (m−1) for 20 mg L−1 and 100 mg L−1 PAC, respectively; R was 4.7 × 10¹² (m−1) with direct UF. The Rre changes were consistent with the R results, following the order of 10 mg L−1 PAC > 20 mg L−1 PAC > raw water > 100 mg L−1 PAC, which suggested that low doses of PAC could lead to increases in R and Rre, whereas high doses (100 mg L−1) of PAC reduced Rre. This result might because PAC at low doses might have limited effects on adsorbing macromolecular organics, while macromolecular organic-bound PAC particles might strongly attach to the membrane surface, form a close-packed PAC cake layer and block the membrane pores, causing an increase in fouling resistance.7 In contrast, more macromolecular organics might be adsorbed by PAC at increased doses as well as by the porous membrane formed by PAC,25 thus alleviating Rre. The overall Rir decreased with increasing PAC dose, suggesting that although Rir accounted for only a small proportion of R, PAC pretreatment prior to UF significantly enhanced the control of Rir. Liu et al. reported that PAC primarily adsorbed the low-MW (<1 kDa) fraction and was effective in mitigating irreversible fouling.26 This result further suggested that there might exist a threshold PAC dosage to alleviate UF fouling during constant-flux mode; when the PAC dosage is below the threshold, Rre is greater than that in direct UF, while when the PAC dosage is higher than the threshold, both R and Rre are alleviated.
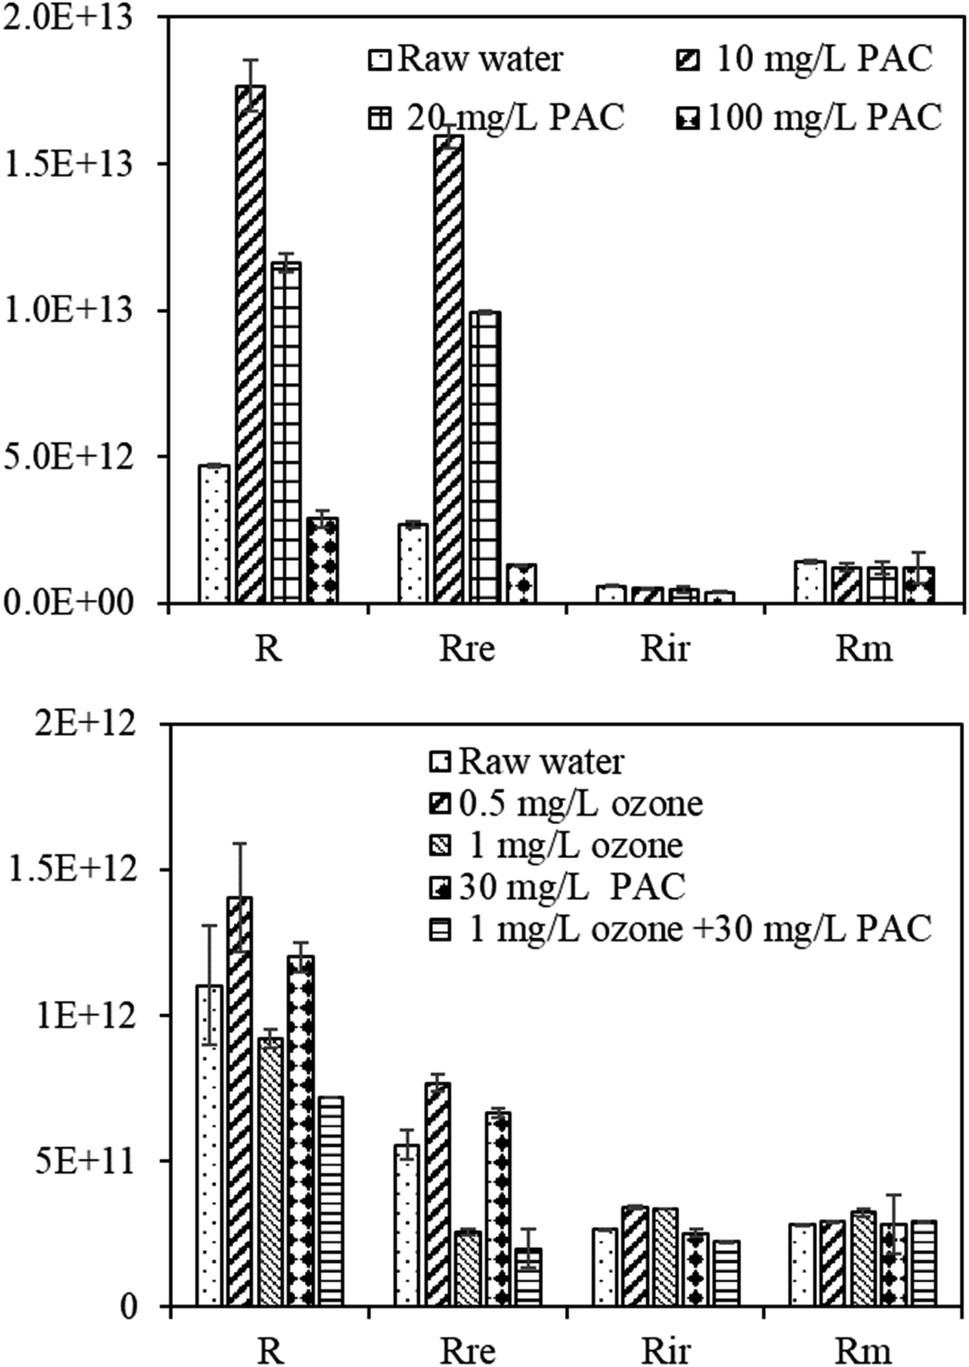 | ||
| Fig. 3 Variation in membrane fouling resistance during ozone/PAC/UF processes. | ||
For the samples subjected to individual ozone treatment, both R and Rre increased after 0.5 mg L−1 ozone treatment, while the values decreased after 1 mg L−1 ozone treatment, consistent with the TMP changes (Fig. 2). In addition, Rir increased with increasing ozone doses. This phenomenon might occur because ozone oxidation can degrade molecular chains and macromolecules into smaller fragments (see Fig. 5); these smaller fragments would improve organic adsorption in the membrane pores and decrease the affinity of macromolecular organics on the membrane surface and the formation of cake layer.27 Nevertheless, at low doses, not all the macromolecular organics could be oxidized, and Rre increased with increasing filtration cycle.
Comparison among the treatments revealed that R was reduced more by combined ozone and PAC treatment than by individual PAC or ozone treatment. R was 7.16 × 10¹¹ (m−1) under combined treatment, in contrast to 9.2 × 10¹¹ and 1.89 × 10¹² for individual treatments with 1 mg L−1 ozone and 30 mg L−1 PAC, respectively. In addition, Rre and Rir were 2.01 × 10¹¹ and 2.24 × 10¹¹, in contrast to 2.57 × 10¹¹ and 3.38 × 10¹¹ for 1 mg L−1 ozone and 6.66 × 10¹¹ and 9.43 × 10¹¹ for 30 mg L−1 PAC, respectively. This result suggested that combined ozone and PAC treatment had synergistic effects on both reversible and irreversible membrane fouling reduction, yet the effects were not simply summed or subtracted. To better analyze the dynamic membrane fouling behavior, the organic removals, water characteristics and fouled membrane were subsequently investigated.
3.2 Performance of individual and combined PAC/ozone processes on organic removal
 | ||
| Fig. 4 TOC and SUVA removal during UF treatment and PAC and ozone treatment, (a and b) TOC removal during PAC and/or ozone treatment, (c and d) SUVA removal during PAC and/or ozone treatment. | ||
When the water was pretreated with ozone, the UV removal also increased with increasing ozone doses (Fig. S2†), whereas the TOC removal was slightly increased when ozone increased from 0.5 mg L−1 (8.02%) to 1 mg L−1 (8.8%). This phenomenon likely occurred because ozone oxidation had a certain selectivity for organic removal, and those organics with a benzene ring and C![[double bond, length as m-dash]](https://www.rsc.org/images/entities/char_e001.gif) C might be preferentially removed.28 Combined ozone and PAC treatment had higher TOC removal relative to that with individual ozone treatment (Fig. 4b). The overall TOC removal was 36.65%, in contrast to 8.88% for 1 mg L−1 ozone and 39% for 30 mg L−1 PAC, which differed slightly from the TMP/TMP0 trend. This phenomenon might be explained that despite ozone could oxidize some macromolecular organics into small molecule substances, Rir might be induced due to the increases of small MW organics, whereas the Rir can be greatly alleviated by the absorption of small MW organics of PAC treatment, which further suggested that the removal of total organic matter might not have a direct relation with TMP increases but with specific organic removals.
C might be preferentially removed.28 Combined ozone and PAC treatment had higher TOC removal relative to that with individual ozone treatment (Fig. 4b). The overall TOC removal was 36.65%, in contrast to 8.88% for 1 mg L−1 ozone and 39% for 30 mg L−1 PAC, which differed slightly from the TMP/TMP0 trend. This phenomenon might be explained that despite ozone could oxidize some macromolecular organics into small molecule substances, Rir might be induced due to the increases of small MW organics, whereas the Rir can be greatly alleviated by the absorption of small MW organics of PAC treatment, which further suggested that the removal of total organic matter might not have a direct relation with TMP increases but with specific organic removals.
The SUVA removal by individual and combined PAC and/or ozone treatment is also detected (Fig. 4c and d). The SUVA value reflects the degree of aromaticity of organic matter in water. Cho et al. suggested that the SUVA value of NOM is consistent with a material with a very hydrophilic nature.29 Raw water had a high SUVA of 2.91 L (mg m)−1, which suggested an aromatic structure of organic matter. After PAC treatment, the SUVA value was reduced; however, the value increased after subsequent UF, indicating that hydrophobic organics with strong UV absorbance can be preferably removed by PAC, whereas UF membrane might mainly reject organics of weak UV absorbance.
When the water was treated with individual ozone treatment, the percent reduction in SUVA was markedly lower at 0.5 mg L−1 but increased at 1 mg L−1. Van et al. suggested that ozone oxidation could cause substantial structural changes in the NOM present in feed water, including the removal of aromatic rings,28 moreover, the amount of carboxylic groups increased, leading to an increased repulsion by the negative membrane surface and the prevention of cake/gel layer formation.27 The above results suggested that ozone at higher doses could effectively reduce hydrophobic organics in the water, which might prevent the formation of membrane cake/gel layer, whereas low ozone doses exerted little effects on aromatic structure changes. When PAC was further added to the combined ozone–UF system, the total SUVA was further decreased, which indicated that more hydrophobic organics can be removed by combined ozone and PAC treatment, thus alleviating membrane fouling. However, from the SUVA values by UF, it was found that the SUVA removals were all negative no matter during individual ozone treatment or combined ozone and PAC treatment, which again indicated the substance removed of weak UV absorbance by UF. And UF had a lower SUVA removal after combined ozone and PAC treatment than that after individual ozone treatment, which might suggest the organic load reduction of UF.
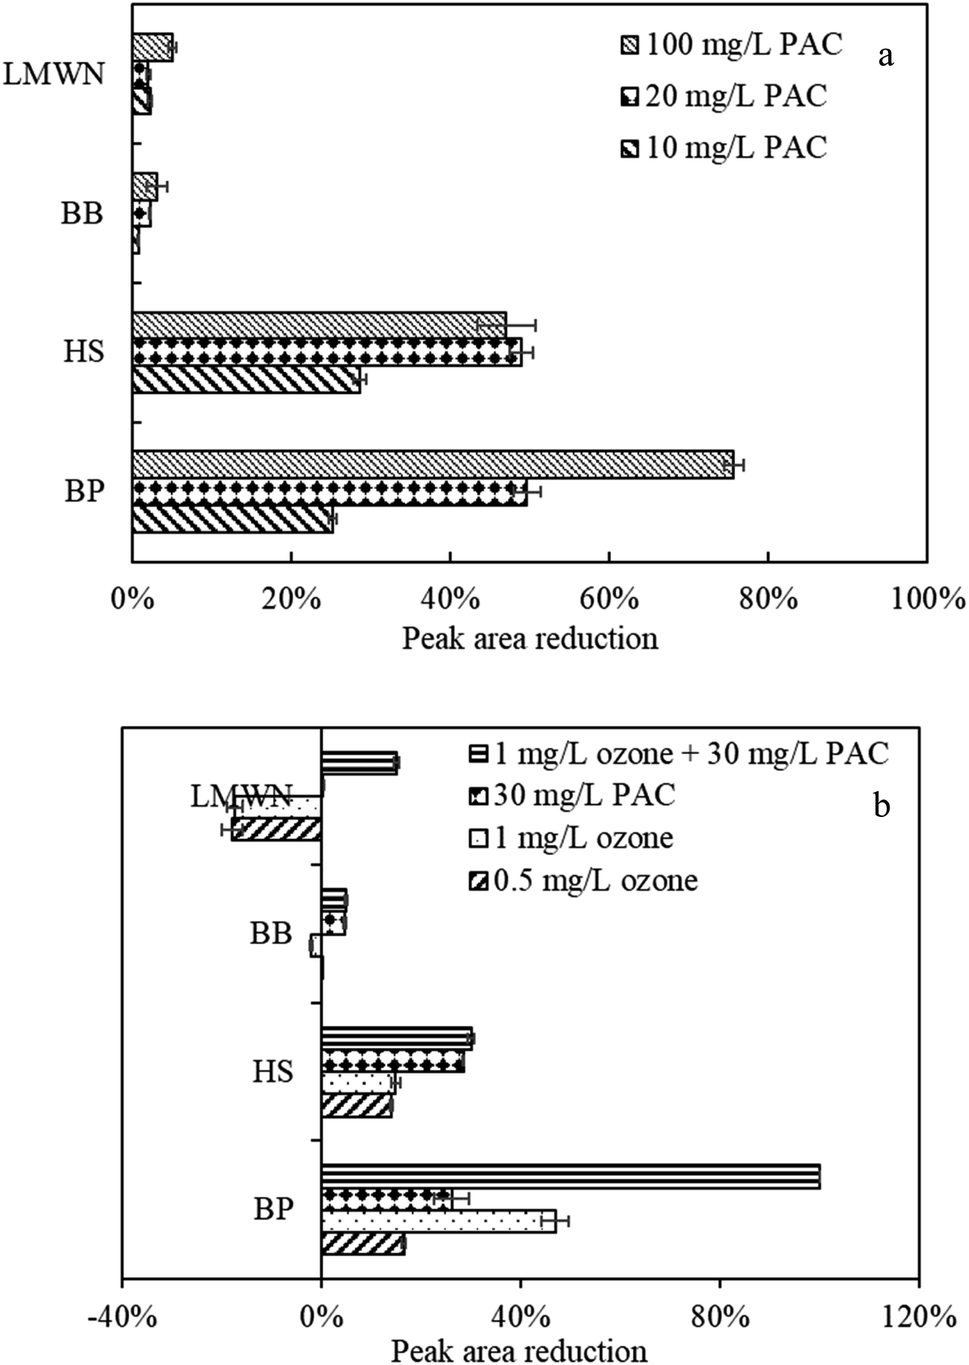 | ||
| Fig. 5 Peak area reduction of various MW components by PAC and ozone treatment via HPSEC peak-fitting, (a) by PAC treatment, (b) by ozone and PAC treatment. | ||
After UF, macromolecular BP and medium-MW HS were highly rejected, whereas the BB of low-MW acids and humics and LMWN (Table S2†) were lower rejected, suggesting that although the content of macromolecular organic matter in the raw water was not very high, after three periods of accumulation during UF, macromolecular BP and medium-MW HS remain the major organics that were responsible for the UF membrane fouling.
After PAC treatment, macromolecular BP was progressively decreased with increasing PAC doses (Fig. 5a). The percentage reduction in peak A area between the feed water and water after PAC treatment increased from 25% to 75% for 20 mg L−1 PAC to 100 mg L−1 PAC, suggesting that PAC was effective in removing some macromolecular organics. In addition to the high removal of macromolecular organics, peak B, which represents HS, was also greatly decreased with increasing PAC doses, which was consistent with Liu et al.,26 who found that PAC was much effective in the reduction of organic components of HS but not LMWN. However, the treatment effectiveness of peaks C and D were limited. This phenomenon can be explained by the fact that the carbon used in this study was mainly composed of pores 5–15 nm in width. According to an empirical equation, organics with MWs of 100 kDa and 1 kDa are approximately 10 nm and 1 nm in size; thus, HS, with size of approximately 3.5 nm, can be preferably adsorbed. However, LMWN and BB were less adsorbed, which might be ascribed to the decreased adsorption strength with declining adsorbate size.30 Bourgeous et al. indicated that macromolecular organics mainly led to reversible fouling by the formation of cake and/or gel layer,31 whereas irreversible fouling was mainly related to direct interactions between the foulants and membrane. The above results thus indicated that PAC could prevent membrane Rre and Rir to some extent by reducing macromolecular organics and HS, which was consistent with the results in Fig. 3.
When natural water was treated by individual ozone treatment (Fig. 5b), ozone oxidation also led to high degradation of BP constituents. The peak area reduction between the feed water and water after ozone treatment was 20% and 45% for 0.5 mg L−1 and 1 mg L−1 ozone, respectively. However, HPSEC analysis presented remarkable increases in the low-MW components of BB and LMWN. Prior research suggested that lower-MW components can be generated from higher-MW constituents after ozonation.32 The small-MW organics produced by oxidation might both reduce the fouling layer's hydraulic resistance and mitigate organic adsorption to the membrane,33 which might be considered as one of the explanations of the Rre changes with ozone treatment (Fig. 3).
The reduced peak area of various molecular organic fractions following combined ozone and PAC treatment indicated that not only macromolecular BP but also HS, LMWN, and BB were further removed compared with the results of individual PAC and/or ozone treatment. The reduction in peak A area (organic BP removal) between the feed water and water after combined treatment was 100%, in contrast to 45% for 1 mg L−1 ozone and 25% for 30 mg L−1 PAC, while for HS, BB, and LMWN, the removal efficiency was 38%, 5%, and 18%, in contrast to 28%, 5%, and 1% for 30 mg L−1 PAC and 20%, −2%, and −18% for 1 mg L−1 ozone, respectively. The elevated reductions in organic BP, HS, LMWN, and BB might both reduce the membrane fouling layer and mitigate organic adsorption in the membrane pores. Therefore, the altered molecular structures of organic matter, as well as PAC adsorption, are likely the dominant factors by which combined ozone and PAC treatment alleviated reversible and irreversible membrane fouling, which suggested that combined ozone and PAC treatment had complementary effects on the reduction of organic content and thus alleviated membrane Rre and Rir.
Although considerable amounts of organic matter in natural water can be eliminated by the pretreatment employed in this study, the residual contaminants remain can be rejected by UF, which results in serious membrane fouling. Single UF resulted in high rejection of macromolecular BP whether individual PAC treatment or ozone treatment was applied; however, the rejection rate was greatly reduced under combined treatment compared with those obtained under individual PAC and ozone treatment (Table S2 in the ESI†). In fact, the rejection rate was 0 after combined ozone and PAC treatment. Moreover, HS and LMWN were less rejected by UF after combined ozone and PAC treatment than after individual treatment, which again demonstrated the alleviation of both Rre and Rir.
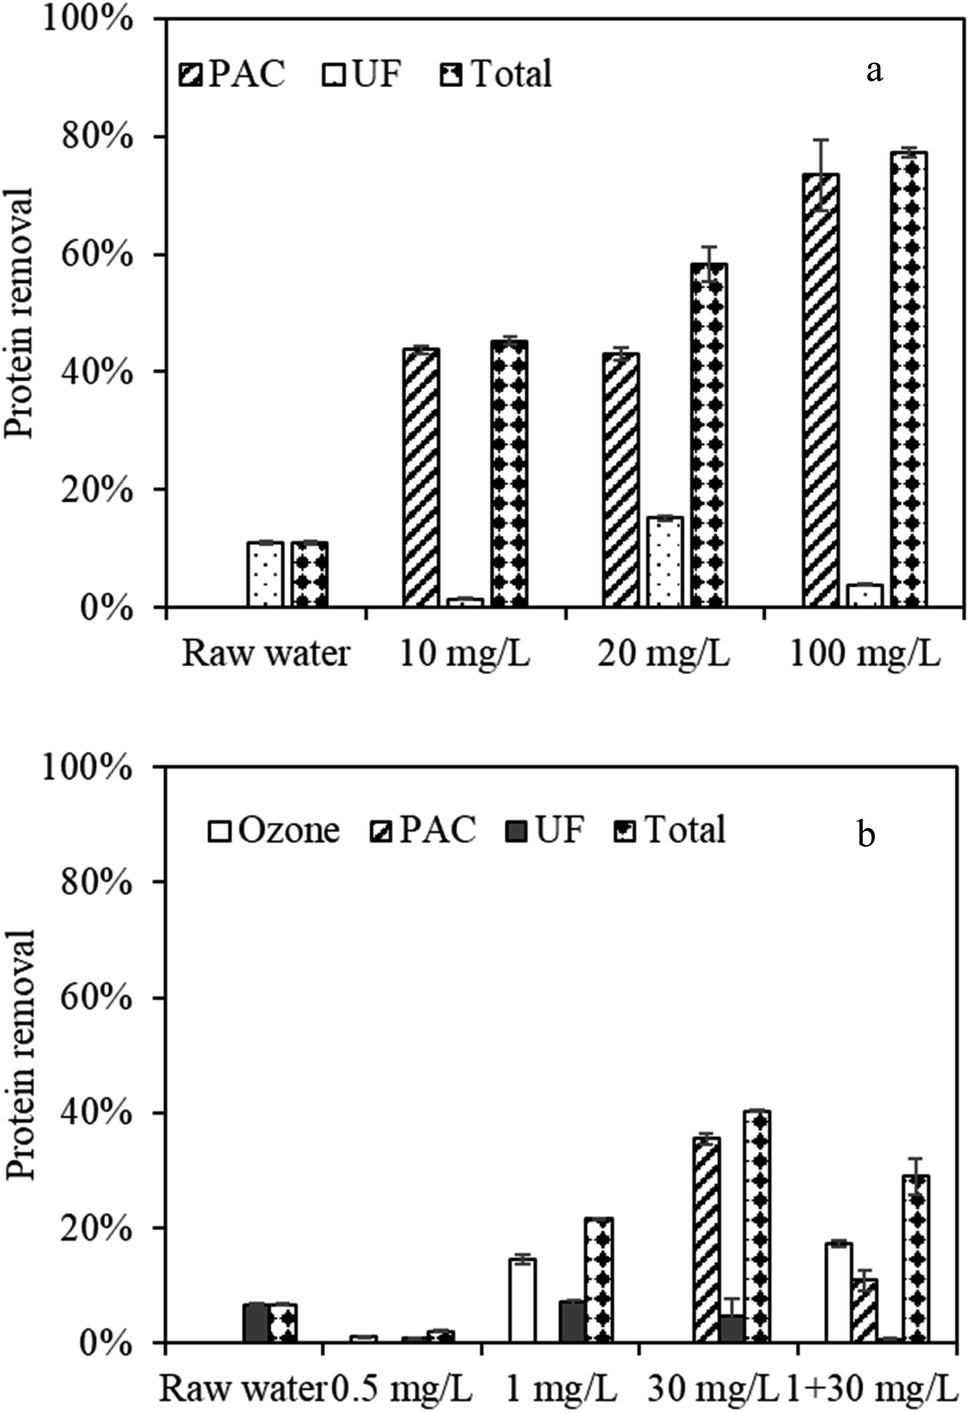 | ||
| Fig. 6 Protein removal by PAC and ozone treatment during UF, (a) by PAC treatment, (b) by PAC and ozone treatment. | ||
Ozone oxidation had minimal effects on protein removal at a low dose of 0.5 mg L−1 (1.2%); however, the removal efficiency increased (14.2%) at 1 mg L−1 (Fig. 6b). When PAC was added to the combined ozone–UF system, the protein removal efficiency was 28.94%, higher than that of 21.64% for 1 mg L−1 ozone, but lower than that of 40.32% for 30 mg L−1 PAC. This phenomenon likely occurred because when the protein was oxidized, the organics after oxidation might be easily adsorbed by PAC, weakening the adsorption effects of protein. When the water was further filtered by UF, the protein removal efficiency was lower (0.75%) than that under separated ozone (7.1%) and PAC treatment (4.76%). The decreased protein removals might also suggest an organic load reduction on the membrane surface, thus alleviated membrane fouling.
In addition to protein, ammonia nitrogen was determined. Ammonia nitrogen of high concentration was reported to have harmful effects on human health and aquatic life.35 Fig. S4† displays the ammonia nitrogen removal under separated PAC and ozone treatment and combined treatment. UF alone could not remove ammonia nitrite effectively, while PAC pretreatment presented high adsorption effects on ammonia nitrogen removal, and approximately 10% of ammonia nitrogen was removed. However, for ozone, the ammonia nitrogen removal was limited. In fact, the ammonia nitrogen content in the effluent increased after ozone treatment, and the percentage increased from 12% to 25% for 0.5 mg L−1 and 1 mg L−1 ozone, respectively. This phenomenon can be explained by the fact that when ozone was applied, some nitrogenous substances in the water might be oxidized into ammonia nitrogen, increasing the ammonia nitrogen content. After combined ozone and PAC treatment, the ammonia nitrogen removal increased to −9%, suggesting that combined PAC and ozone treatment also had synergistic effects on ammonia nitrogen removal in the feed water.
3.3 Analysis of MW distribution by physical–chemical cleaning
To better analyze the membrane fouling behavior of NOM, the efficiency of backwashing and chemical cleaning under individual and combined PAC and ozone treatment during the UF cycle was also investigated.Fig. 7 displays the variations in peak area of various MW organics after backwashing and chemical cleaning. BP had the highest peak area increases after backwashing (Fig. 7a), which suggested that although BP accounted for a small proportion of the feed water, backwashing can remove most of the macromolecular BP accumulated on the membrane surface. The BP peak area decreased with increasing PAC doses, which was consistent with the MW distribution in Fig. 5 and the TMP results in Fig. 2 that PAC could adsorb macromolecular organics with increasing PAC doses, thus alleviated Rre. In addition to the highest removal of BP, the TOC peak areas were all negative for HS, BB, and LMWN when the water was filtered directly by UF. This phenomenon might be because the backwashing velocity was 2.8 times the filtration permeate flux, thus, new membrane fouling might be caused when the water was filtered directly after UF. However, this phenomenon was greatly alleviated when the water was pretreated with PAC. From the changes of HS and LMWN, it can be seen that when PAC > 20 mg L−1, the peak areas of HS and LMWN were all positive, which again indicated that PAC treatment improved not only the organic removals in the feed water but also the backwashing efficiency of macromolecular organics as well as a certain content of low-MW organics.
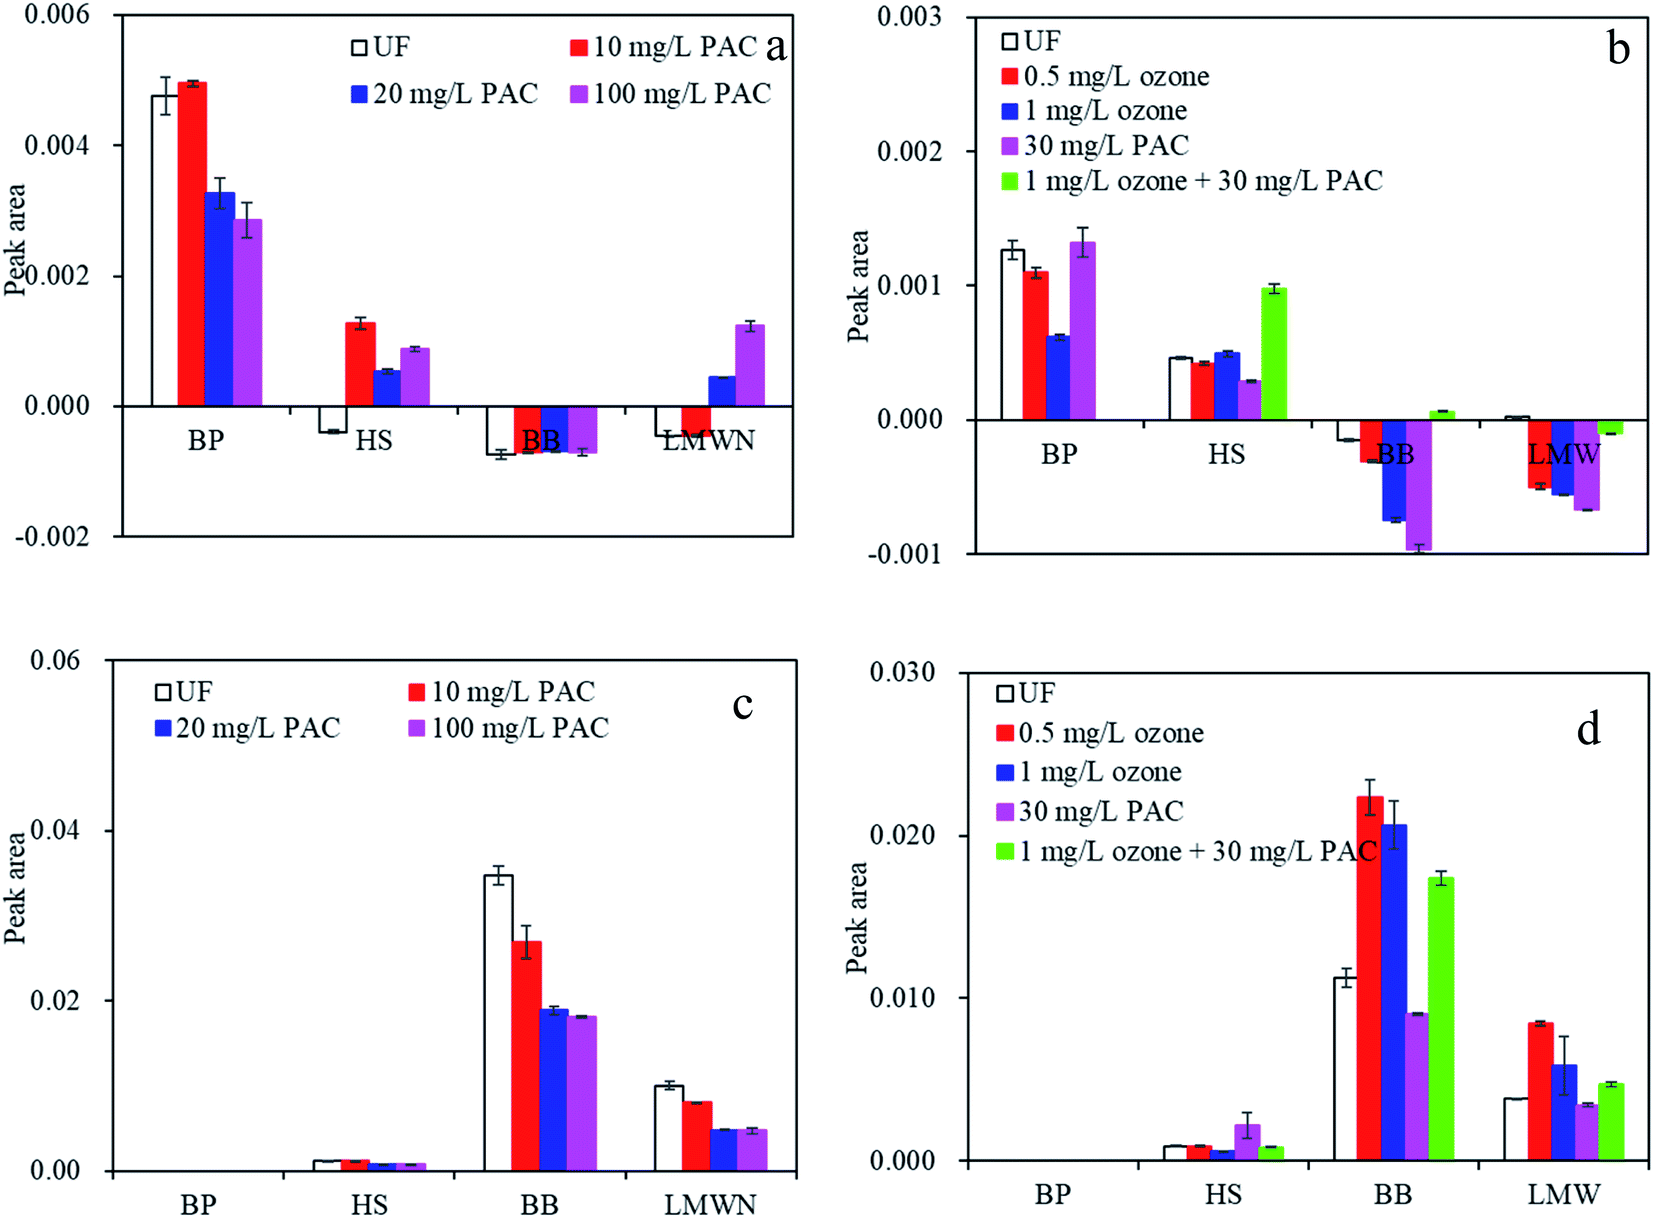 | ||
| Fig. 7 Variation in peak area of various MW components with PAC/ozone treatment after backwashing and chemical cleaning, (a and b) backwashing, (c and d) chemical cleaning. | ||
Similar to PAC pretreatment, in ozone treatment (Fig. 7b), the BP fraction had the highest peak area increases, followed by HS, while the TOC peak areas were all negative for BB and LMWN after backwashing, which suggested that whether PAC treatment or ozone treatment was used, BP organics were the main components that caused hydraulic Rre. However, the BP peak areas were reduced with increasing ozone doses and completely disappeared after combined PAC and ozone treatment, consistent with the results in Fig. 5 and Table S2:† with increasing ozone doses, more macromolecular organics could be oxidized; thus, the amount of BP organics entering the UF system was reduced. In addition, when PAC was further added in the combined ozone–PAC–UF system, the residual macromolecular content might also be adsorbed by PAC, decreasing the BP organics entering the UF system, thus alleviated Rre. Notably, the HS peak areas had the second highest increases, followed by BB and LMWN, under combined ozone and PAC treatment. Combined with the organic removal in Fig. 4b, HS can be more effectively removed by combined treatment than by individual PAC and ozone treatment; the above result thus indicated that combined PAC and ozone treatment not only could enhance the removal of HS in the feed water but also improve the backwashing efficiency. HS have long been believed to be one of the major fouling components affecting UF performance.36 Wang et al. suggested that the adsorption of HS in membrane inner pores could lead to the constriction and blocking of membrane pores.37 The adsorption of HS to the membrane could also result in membrane pore narrowing and the increased retention of larger-MW organics.38 The above results thus indicated that combined ozone and PAC treatment could control membrane Rre and Rir by removing organics in the feed water and by improving the organic removal efficiency during backwashing.
Further analysis of the MW organic fractions after ozone treatment revealed that the higher the ozone dose was, the greater the negative BB and LMWN values were, which suggested that new irreversible membrane fouling would happen whether by direct UF or ozone treatment; and the higher the ozone dose was, the more serious new membrane fouling would be brought during backwashing. However, combined PAC and ozone treatment could greatly alleviate this situation, based on the changes in the peak areas of BB and LMWN, which further suggested that combined PAC and ozone treatment could improve the removal of organics in the feed water as well as the backwashing efficiency and reduce the membrane fouling brought by backwashing.
Analysis of the MW distribution in the chemical cleaning effluent (Fig. 7c and d) demonstrated that regardless of the PAC treatment or ozone treatment, BB had the highest peak areas, followed by LMWN and HS, while the BP peak areas were 0, suggesting that low-MW organics of BB and LMWN, as well as HS, were the main components that caused irreversible membrane fouling. In addition, the TOC peak areas of BB and LMWN decreased with increasing PAC and ozone doses, while combined PAC and ozone treatment had the lowest TOC content of BB and LMWN (Fig. 7d), suggesting that combined PAC and ozone treatment was effective in removing BB and LMWN. When the water was pretreated by combined ozone and PAC treatment, the irreversible membrane fouling was the least, which further verified that combined ozone and PAC treatment prior to feed water could greatly alleviate Rir.
3.4 Modeling of filtration process
In order to obtain a profound understanding of fouling alleviation mechanism by combined PAC and ozone treatment, five combined fouling models were adopted to fit the experimental data. Table 1 shows the sum of squares (R2) between the experimental data and fitted values, the TMP (P/P0) vs. time with the combined cake-standard fouling model at the last filtration cycle was also depicted (Fig. 8), it can be seen from Table 1 and Fig. 8 that combined cake-standard model fitted the experimental data excellently no matter for the raw water or by the individual and/or combined PAC and ozone treatment, suggesting that the NOM-related membrane fouling of raw water was more likely attributed to the formation of cake layer and standard pore blocking. From Fig. 8, it can be seen the individual and/or combined PAC and ozone treatment might alleviate UF membrane fouling which may ascribe to the alleviation of cake layer and standard pore blocking. Moreover, it was found that with increasing with the filtration time, the R2 varied. The R2 were 0.98283, 0.97225, 0.98308, 0.98255, and 0.98375 for combined cake-completed, cake-intermediate, complete-standard, intermediate-standard, and cake-standard model, respectively, at the first filtration cycle of raw water, while they were 0.85305, 0.69443, 0.9266, 0.93612, and 0.96996 for the second filtration cycle, and 0.65636, 0.48529, 0.92549, 0.93903, and 0.988848, for the third filtration cycle, respectively, suggesting that with increasing with filtration time, the membrane fouling caused by the formation of cake layer and standard pore blocking increased, however, the membrane fouling induced by the other four combined models might decline. Similar phenomenon was also observed for the R2 changes during individual/combined PAC and ozone treatment (except for that of ozone 1 m L−1), suggesting that the mitigation of NOM-related membrane fouling due to cake layer and standard pore blocking was also increased with increasing with filtration time under individual/combined PAC and ozone treatment, however, combined complete-standard pore blocking and intermediate-standard pore blocking might exert some effects in the alleviation of membrane fouling during ozone 1 mg L−1 treatment by the increased R2 at the end of filtration cycle (Table 1).| R2 | Cake-complete | Cake-intermediate | Complete-standard | Intermediate-standard | Cake-standard | |
|---|---|---|---|---|---|---|
| Raw water | 1st cycle | 0.98283 | 0.97225 | 0.98308 | 0.98255 | 0.98375 |
| 2nd cycle | 0.85305 | 0.69443 | 0.9266 | 0.93612 | 0.96996 | |
| 3rd cycle | 0.65636 | 0.48529 | 0.92549 | 0.93903 | 0.98848 | |
| Ozone 0.5 (mg L−1) | 1st cycle | 0.97118 | −0.00763 | −0.00763 | −19.035 | −0.00763 |
| 2nd cycle | 0.84302 | 0.67986 | 0.95211 | 0.96055 | 0.98499 | |
| 3rd cycle | 0.71076 | 0.51289 | 0.93449 | 0.94537 | 0.9732 | |
| Ozone 1 (mg L−1) | 1st cycle | 0.94603 | −0.00763 | −0.00763 | −55.5542 | −0.00761 |
| 2nd cycle | 0.75117 | 0.65779 | 0.95341 | 0.95726 | 0.97963 | |
| 3rd cycle | 0.58772 | 0.49168 | 0.96475 | 0.96722 | 0.98282 | |
| PAC 30 (mg L−1) | 1st cycle | 0.9405 | −0.90124 | 0.9432 | 0.94567 | 0.96572 |
| 2nd cycle | 0.9371 | 0.8687 | 0.9388 | 0.94007 | 0.94694 | |
| 3rd cycle | 0.80482 | 0.66697 | 0.9179 | 0.92322 | 0.94226 | |
| Combined 1 + 30 (mg L−1) | 1st cycle | 0.80482 | 0.66697 | 0.9179 | 0.92322 | 0.94226 |
| 2nd cycle | 0.52551 | 0.48739 | 0.90785 | 0.88974 | 0.94917 | |
| 3rd cycle | 0.3015 | 0.27755 | 0.92479 | 0.84651 | 0.96899 | |
 | ||
| Fig. 8 TMP (P/P0) vs. time with the combined cake-standard fouling model at the third filtration cycle, symbols represent the experimental data and solid lines represent the model fit using the combined cake-standard fouling model. | ||
When comparing the magnitude of R2 of combined cake-standard model, it was found that the R2 was 0.9732 for ozone 0.5 mg L−1, comparing with 0.98282, 0.94226, and 0.96899 for ozone 1 mg L−1, PAC 30 mg L−1, and combined ozone 1 mg L−1 + PAC 30 mg L−1, respectively, at the third filtration cycle. The respective contribution of cake model and standard model to the combined cake-standard model was also evaluated,39 and from the calculated fitted parameters of cake model and standard model to the combined cake-standard model, it was found that the ratio KcJ0/Ks were −1.712 for raw water comparing with −1.4623, −1.082, and −1.6356 of ozone 1 mg L−1, PAC 30 mg L−1, and combined ozone 1 mg L−1 + PAC 30 mg L−1, respectively, at the last filtration cycle, suggesting that standard pore blocking might exert more important effects on the NOM-related membrane fouling as well as the membrane fouling control.
The fitting parameters Kc and Ks for the combined cake-standard model under various ozone and PAC pretreatment can also be found in Fig. S5.† The Kc increased under various individual and/or combined treatment, while the Ks decreased, which further implied that the NOM-related membrane fouling mitigation by individual and/or combined ozone and PAC treatment might mainly be ascribed to the alleviation of standard pore blocking.
3.5 Discussion of membrane fouling mitigation by combined ozone and PAC treatment
Prior research has suggested that there are two membrane fouling mitigation mechanisms associated with the preozonation of feed water: reduced organic loading and structural changes in organic matter.28 In this study, macromolecular organics (such as polysaccharides, protein-like organics) were the major organics that were rejected by UF, while HS were meanwhile rejected, which suggested that macromolecular organic BP and HS were the main organics that caused membrane fouling during constant-flux UF. Combined with the modeling results and the Rre, Rir changes in Fig. 2, 8, and Table 1, it could be speculated that macro molecular organics might quickly accumulated and dominated in membrane pores after attaching and/or plugging the membrane pores,40 followed by the formation of cake/gel layer on the membrane surface during a long-time accumulation, thereafter, more macro and medium molecular substances might be rejected on the membrane surfaces and/or in the membrane pores by the already formed fouling layers with increasing with filtration cycle. When the physical cleaning was conducting, as the interaction between the membrane and foulants was insignificant,40 macro molecular organics deposited within the membrane pores and/or on the membrane surface might be significantly rinsed (Fig. 7), as such, the total resistance was greatly recovered (Fig. 2).When ozone was applied, macromolecular organics were progressively reduced, while small-MW organics were increased. These macro molecular organics might significantly contribute to the standard pore blocking with these organics easily attaching and/or plugging membrane pores and then formed the cake/gel layer. By ozonation, these macro molecular organics were break down into small molecular organics, which led to the reversible fouling resistance reduced at higher ozone doses, meanwhile, the small MW organics generated might be easily permeate through the membrane pores and/or attaching to the membrane pores,21 leading to the Rir increased.
When PAC was further added, not only macromolecular BP but also medium-MW HS organics, as well as LMWN and BB, were further reduced by combined ozone and PAC treatment than by individual PAC or ozone treatment. This reduction in organics alleviated both the reversible and irreversible resistance of the membrane. In addition, more hydrophobic organics were removed, according to the analysis of SUVA values (Fig. 4c and d). Hydrophobic organics have been reported to have a greater tendency to adhere to the membranes and have a strong influence on the cake layer.8,21 The reduction in hydrophobic organics in the feed water after combined ozone and PAC treatment might further mitigate the standard pore blocking and cake layer formation (Table 1). Moreover, when physical cleaning was performed, new membrane fouling was caused under both direct UF and ozone treatment; however, combined ozone and PAC treatment could greatly alleviate this situation, first by the enhanced removal of organic matter during backwashing and second by the reduction of organic matter during chemical cleaning.
Based on the results, the behavior of combined PAC and ozone treatment on membrane fouling mitigation during UF of micro polluted water can be illustrated as follows in Fig. 9:
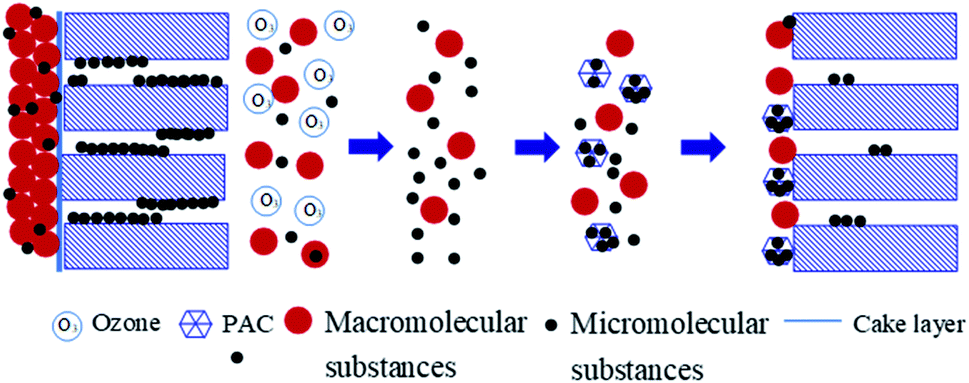 | ||
| Fig. 9 Mechanism of membrane fouling by combined ozone–PAC pretreatment. | ||
4. Conclusion
This paper investigated the reversible and irreversible membrane fouling changes of raw water by ozone/PAC treatment, and the following conclusions can be drawn:(1) Macromolecular BP and medium-MW HS were the major organics that caused membrane fouling during UF. PAC–UF could improve the removal efficiency of organic compounds, especially HS. Suitable amounts of PAC during UF not only enhanced the irreversible resistance in UF but also the reversible resistance, and there existed a threshold PAC dosage for membrane fouling alleviation in terms of both R and Rre. PAC reduced Rir mainly because PAC not only reduced the organic matter in the influent water but also improved the backwashing efficiency.
(2) Ozone mainly removed macromolecular BP and HS in water, while the content of BB and LMWN increased. Ozone at low doses exerted little effects on membrane fouling alleviation in this study, while higher doses decreased R and Rre.
(3) Combined ozone and PAC pretreatment had enhanced effects on both Rre and Rir reduction, which demonstrated synergistic effects in the reduction of organic content in the feed water, including macromolecular BP, LMWN, and BB.
(4) BP was the mainly organics that caused Rre, whereas low-MW organics of BB and LMWN, as well as HS, were the main components that caused irreversible membrane fouling. New irreversible membrane fouling caused by BB and LMWN was induced by backwashing under both direct UF and individual ozone treatment, and the higher the ozone dose was, the more serious new membrane fouling occurred. Combined ozone and PAC treatment not only improved the backwashing efficiency but also reduced the new membrane fouling and Rir.
(5) Cake layer formation and standard pore blocking were the major mechanism for NOM-UF fouling and alleviation by individual and/or combined PAC and ozone treatment, of which standard pore blocking exerted more important effects in the formation and alleviation of membrane fouling.
Abbreviations
| NOM | Natural organic matter |
| UF | Ultrafiltration |
| PAC | Powdered activated carbon |
| Rir | Irreversible fouling resistance |
| Rre | Reversible fouling resistance |
| BP | Biopolymers |
| HS | Humic-like substances |
| LMWN | Low-molecular-weight neutral substances |
| BB | Building blocks |
| HPSEC | High-performance size-exclusion chromatography |
Author contributions
Weiwei Huang, Bingzhi Dong done all the experiments and wrote the main manuscript text, Yuanhong Zhu, Lin Wang contributed to analytic tools, Weiguang Lv, Wenzong Zhou reviewed the whole manuscript.Conflicts of interest
All authors declare that the research was not involved human participants and/or animals, there is no conflict of interest exits in the submission and publication of this manuscript, all of us consent for publication, and all data and materials are available, besides, all funding, authors' contributions, acknowledgements were included in the manuscript.Acknowledgements
The funding provided by the National Natural Science Foundation of China (51708352), the Shanghai Rising-Star Program (18QB1403000) and the SAAS Program for Excellent Research Team is gratefully acknowledged.References
- S. A. Aani, C. J. Wright and N. Hilal, Desalination, 2018, 432, 115–127 CrossRef.
- W. Z. Yu, N. Graham and T. Liu, Water Res., 2019, 149, 394–405 CrossRef CAS PubMed.
- E. K. Lee, V. Chen and A. G. Fane, Desalination, 2008, 218, 257–270 CrossRef CAS.
- N. M. Peleato, R. L. Legge and R. C. Andrews, Water Res., 2017, 126, 1–11 CrossRef CAS PubMed.
- J. Liu, Z. H. Zhang, Q. H. Chen and X. H. Zhang, J. Membr. Sci., 2018, 567, 216–227 CrossRef CAS.
- A. B. Şengül, G. Ersan and N. Tüfekçi, J. Hazard. Mater., 2018, 343, 29–35 CrossRef PubMed.
- C. W. Li and Y. S. Chen, Desalination, 2004, 170, 59–67 CrossRef CAS.
- W. W. Huang, W. G. Lv, W. Z. Zhou, M. L. Hu and B. Z. Dong, Sci. Total Environ., 2019, 676, 53–61 CrossRef CAS PubMed.
- S. H. You, D. H. Tseng and W. C. Hsu, Desalination, 2007, 202, 224–230 CrossRef CAS.
- S. Byun, J. S. Taurozzi, A. L. Alpatova and F. L. Wang, Sep. Purif. Technol., 2011, 81, 270–278 CrossRef CAS.
- K. J. Wei, Z. Wang, C. P. Ouyang, X. X. Cao, P. Liang, X. Huang and X. Y. Zhang, Water Res., 2020, 173, 115536 CrossRef CAS PubMed.
- R. Guillossou, J. L. Roux, S. Brosillon, R. Mailler, E. Vulliet, C. Morlay, F. Nauleau, V. Rocher and J. Gaspéri, Chemosphere, 2020, 245, 125530 CrossRef CAS PubMed.
- M. Östman, B. Björlenius, J. Fick and M. Tysklind, Sci. Total Environ., 2019, 649, 1117–1123 CrossRef PubMed.
- C. H. Lai, Y. C. Chou and H. H. Yeh, J. Membr. Sci., 2015, 474, 207–214 CrossRef CAS.
- W. Z. Yu, N. J. D. Graham and G. D. Fowler, Water Res., 2016, 95, 1–10 CrossRef CAS PubMed.
- H. Bader and J. Hoigné, Water Res., 2013, 15, 44–456 Search PubMed.
- B. Frølund, T. Griebe and P. H. Nielsen, Appl. Microbiol. Biotechnol., 1995, 43, 755–761 CrossRef.
- L. A. Xing, R. Fabris, C. W. K. Chow, J. van Leeuwen, M. Drikas and D. S. Wang, J. Membr. Sci., 2012, 24, 1174–1180 CAS.
- S. A. Huber, A. Balz, M. Abert and W. Pronk, Water Res., 2011, 45, 879–885 CrossRef CAS PubMed.
- J. A. Suarez and J. M. Veza, Desalination, 2000, 127, 47–58 CrossRef CAS.
- D. Q. Wei, Y. Tao, Z. H. Zhang and X. H. Zhang, Chem. Eng. J., 2016, 294, 157–166 CrossRef CAS.
- X. J. Gai and H. S. Kim, Desalination, 2008, 225, 288–300 CrossRef CAS.
- M. M. Zhang, C. Li, M. M. Benjamin and Y. J. Chang, Environ. Sci. Technol., 2003, 37, 1663–1669 CrossRef CAS PubMed.
- Z. Q. Liu, W. F. Hu, W. H. Yang, J. Ma and B. P. Zhang, China Water Wastewater, 2010, 26, 6–10 CAS.
- X. X. Cheng, P. J. Li, W. W. Zhou, D. J. Wu, C. W. Luo, W. C. Liu, Z. X. Ren and H. Liang, Chemosphere, 2019, 221, 812–823 CrossRef CAS PubMed.
- J. X. Liu, Z. H. Wan, B. Z. Dong and D. S. Zhao, Colloids Surf., A, 2016, 511, 320–328 CrossRef CAS.
- M. Sartor, B. Schlichter, H. Gatjal and V. Mavrov, Desalination, 2008, 222, 528–540 CrossRef CAS.
- S. Van Geluwe, L. Braeken and B. Van der Bruggen, Water Res., 2011, 45, 3551–3570 CrossRef CAS PubMed.
- J. Cho, G. Amy and J. Pellegrino, Water Res., 1999, 33, 2517–2526 CrossRef CAS.
- L. Li, P. A. Quinlivan and D. R. Knappe, Carbon, 2002, 40, 2085–2100 CrossRef CAS.
- K. N. Bourgeous, J. L. Darby and G. Techobanoglous, Water Res., 2001, 35, 77–90 CrossRef CAS PubMed.
- S. T. Nguyen and F. A. Roddick, J. Membr. Sci., 2010, 363, 271–277 CrossRef CAS.
- J. Kim, W. Q. Shan, S. Davies, M. J. Baumann, S. J. Masten and V. V. Tarabara, Environ. Sci. Technol., 2009, 43, 5488–5494 CrossRef CAS PubMed.
- Z. P. Wang, Y. Wan, P. C. Xie, A. J. Zhou, J. Q. Ding, J. W. Wang, L. Zhang, S. L. Wang and T. C. Zhang, Chemosphere, 2019, 214, 136–147 CrossRef CAS PubMed.
- B. Zhu, Y. X. Hu, S. Kennedy, N. Milne, G. Morris, W. Q. Jin, S. Gray and M. Duke, J. Membr. Sci., 2011, 378, 61–72 CrossRef CAS.
- Y. Hao, A. Moriya, T. Maruyama, Y. Ohmukai and H. Matsuyama, J. Membr. Sci., 2011, 376, 247–253 CrossRef CAS.
- H. Wang, F. S. Qu, A. Ding, H. Liang, R. B. Jia, K. Li, L. M. Bai, H. Q. Chang and G. B. Li, Chem. Eng. J., 2016, 283, 1374–1383 CrossRef CAS.
- D. Jermann, W. Pronk, S. Meylan and M. Boller, Water Res., 2007, 41, 1713–1722 CrossRef CAS PubMed.
- G. Bolton, D. LaCasse and R. Kuriyel, J. Membr. Sci., 2006, 277, 75–84 CrossRef CAS.
- X. Zhang, L. Fan and F. A. Roddick, J. Membr. Sci., 2013, 447, 362–368 CrossRef CAS.
Footnote |
| † Electronic supplementary information (ESI) available. See DOI: 10.1039/d0ra09820e |
| This journal is © The Royal Society of Chemistry 2021 |