 Open Access Article
Tunable and sustainable photocatalytic activity of photochromic Y-WO3 under visible light irradiation†
Qiansheng Lia,
Hui Zhanga,
Yunhui Yana,
Zhijun Yanga,
Yingling Wang*a,
Guoguang Liu bc and
Tianjun Ni
 *ab
*ab
aSchool of Basic Medical Science, Xinxiang Medical University, Xinxiang 453003, China. E-mail: wang2002yl@126.com; tjni@xxmu.edu.cn
bSchool of Environment, Henan Normal University, Xinxiang 453007, China
cFaculty of Environmental Science and Engineering, Guangdong University of Technology, Guangzhou 510006, China
First published on 4th January 2021
Abstract
Although photochromic and photocatalytic performance are the most significant features of WO3, the effects of photochromism on photocatalytic activities have not been investigated further. Herein, a novel gear-shaped WO3, with high coloration efficiency, fast reversibility, and remarkable photocatalytic performance was successfully prepared via a facile hydrothermal method. The influence of photochromic effects on its photocatalytic properties was evaluated under visible light irradiation. The results showed that the yellow WO3 sample exhibited higher photocatalytic efficiencies toward tetracycline hydrochloride (TCH), oxytetracycline (OTC), rhodamine B (RhB), and ciprofloxacin (CIP) (94.3%, 87.9%, 76%, and 68.6%, respectively, in 60 min). Further research found that the redox conversion between W6+ and W5+ played a key role in separating e−/h+ pairs. Importantly, the rapid and reversible conversion between W6+ and W5+ could be realized through light radiation or H2O2 treatment. Therefore, the gear-shaped WO3 possessed tunable and sustainable photocatalytic properties and maintained a high level of activity after recycling ten times under visible light irradiation. This work provides new insights into practical WO3 applications for environmental remediation based on photochromic regulation.
1. Introduction
Photochromism can be defined as the reversible transformation accompanying electron-transfer or redox reactions between different existing states, which have different optical properties such as absorption, luminescence and refractive index under specific light irradiation.1,2 Photochromic materials can be divided into organic and inorganic materials.3–5 Compared to organic photochromic materials, inorganic semiconductor materials possess good structure stability and low cost.4 Among the numerous semiconductor materials like WO3, MnO3, TiO2, ZnO, etc., WO3 has been widely used as a photochromic material due to its good stability, non-toxicity, low cost, good memory, high coloration efficiency, excellent reversibility and fatigue resistance.6–8 Besides, the optical absorption of WO3 (2.2–3.0 eV) in the visible light region makes it possible to be applied in photocatalysis.9,10 However, low solar modulation, a slow self-bleaching rate (>24 h), low solar light utilization, and coloration only under ultraviolet rays have limited the application of WO3 in the photochromic and photocatalytic domains.11To resolve these issues, several methods, including coupling with inorganic semiconductor materials or organic compounds, doping with noble metals and the introduction of oxygen vacancies have been investigated.12–22 However, these traditional methods involving the selection of doping elements, composite proportions, and exacting conditions, increase design difficulties and costs. At present, it remains a challenge to develop a single WO3 component with efficient, controllable, and reusable photochromic and photocatalytic properties via a simple method.
In terms of designing the single-component material, the hydrothermal methods are facile, controllable and efficient for the large-scale synthesis of semiconductor materials, in which hydrothermal temperature, pH values and structure regulators have significant effects on the particle size, crystal structure and morphology. It has been also found that structural modification could influence the photocatalytic and photochromic activities of WO3 by providing special tunnels and large surface areas for electron-transfer and light-harvesting.4,23,24
The nature of photochromic WO3 may be attributed to the transition of different valence states in tungsten.4 Consequently, there must be some intimate correlation between the photochromic effect and photocatalytic activity. The valence state of tungsten changes from W6+ to W5+ during the photochromic process when photoinduced electrons (e−) are consumed to some extent, and the remaining holes (h+) form additional ROSs.25 Besides, the conversion between the oxidative state of W6+ and the reductive state of W5+ is a redox process, which is conducive to the oxidation of organic pollutants. Therefore, an effective strategy toward achieving efficient and sustainable photodegradation might be through the rapid and reversible conversion between W6+ and W5+. However, to the best of our knowledge, the influences of the photochromic effect for WO3 on photocatalytic activity has not been further investigated as yet.
Herein, we adopted a facile one-step hydrothermal method for the synthesis of gear-shaped WO3. Its rapid and reversible photochromic properties made it a rechargeable material, which played a critical role in the determination of photocatalytic activity and recyclability. A yellow (Y-WO3) and blue (B-WO3) samples were both used as photocatalysts to degrade pollutants including RhB, TCH, CIP, and OTC under visible light irradiation. Through characterization and comparison, the physical–chemical properties of the two samples were systematically investigated. This work focused principally on the influences of the photochromic effects of WO3 on photocatalytic applications for environmental remediation.
2. Experimental
2.1. Materials
All the chemicals used in the experiments were analytical reagents (AR). Sodium tungstate dihydrate (Na2WO4·2H2O) was purchased from Macklin. Concentrated hydrochloric acid (HCl, 36%) and hydrogen peroxide (30%) were purchased from the Zhengzhou Paini Chemicals Reagent Factory.2.2. Synthesis of the samples
Y-WO3 was synthesized via a similar but improved hydrothermal method.26 Firstly, 40 mM Na2WO4·2H2O (80 mL) was prepared in deionized water and then added dropwise concentrated hydrochloric acid into pH = 2.1. Then, the precursor solution was transferred into a 100 mL Teflon-lined autoclave for hydrothermal treatment at 180 °C, 14 h. After cooled down to room temperature, the obtained products were washed several times with water and ethanol. Finally, the precipitate was further treated by immersing it in a 0.2 M H2O2 solution in dark at 100 °C for 0.5 h. B-WO3 was prepared by exposing Y-WO3 to the visible light for 1 h.2.3. Characterizations
The morphology of as-synthesized samples was determined by the scanning electron microscopy (SEM, FEI, Quanta FEG 450) and transmission electron microscopy (TEM, FEI, Tecnai G220S-Twin). The lattice fringe and crystal structure were investigated on a high-resolution electron microscopy (HRTEM, FEI, Tecnai G220S-Twin) and an X-ray diffractometer (XRD, Bruker, D8 Advance), respectively. X-ray photoelectron spectroscopy (XPS, Thermo Scientific, EscaLab 250Xi spectrometer) was utilized to analyze valence states of elements. The optical properties were characterized via a Shimadzu UV2600 UV-vis spectrophotometer over 200–1400 nm. The Fourier transforms infrared spectrometer (FT-IR) spectra were performed on a Shimadzu IRTracer-100 FT-IR spectrometer. The photoluminescence (PL) spectra were obtained by a PL spectrometer (FLS1000, Edinburgh Instruments). The photoelectrochemical (PEC) properties were tested by an electrochemical workstation (Princeton, VersaSTAT 3).2.4. Photodegradation experiments
A 500 W gold halide lamp furnished with 420 nm cut-off filters acted as the visible light source. In each experiment, the Y-WO3 or B-WO3 (50 mg) was dispersed in 50 mL RhB (10 mg L−1), CIP (20 mg L−1), OTC (20 mg L−1) or TCH (20 mg L−1) solutions, respectively, with the pH values of 4, which was placed in the dark with a 30 min stirring to obtain the good adsorption–desorption equilibrium. The photoreaction conditions were maintained at room temperature (20 ± 1 °C) under visible light irradiation. The photodegradation activities on contaminants were analyzed by the UV-2600 spectrophotometer.3. Results and discussion
3.1. Morphology analysis
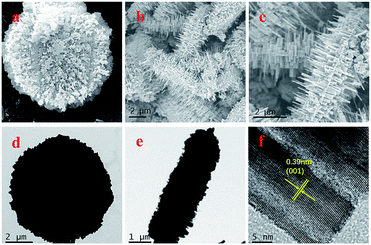
To further investigate the morphology and crystalline structure of the as-synthesized samples, SEM, TEM, and HRTEM measurements were conducted. As shown in Fig. 1 and S1,† The SEM and TEM images of the two samples both exhibited a typical 3D gear-like structure composed of numerous nanorods, which endowed it with a large surface area. The HRTEM (Fig. 1f) images show clear lattice fringes with an interplanar spacing of 0.39 nm, which could be indexed to the (001) crystal plane of WO3.263.2. Structure and elements analysis
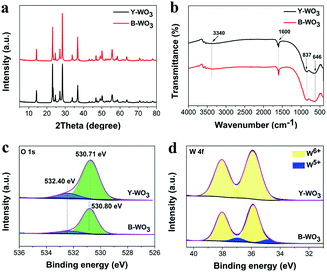
From the XRD patterns of Y-WO3 and B-WO3 (Fig. 2a), one can see that the XRD patterns of these two samples were remarkably similar and corresponded to a hexagonal phase (JCPDS no. 33-1387).27 This demonstrated that the stable phase structures of the as-synthesized samples did not change following exposure to visible light. The typical peaks at 14.0°, 22.5°, 28.1°, 36.4°, and 55.3° were ascribed to the (100), (001), (200), (201), and (221) planes. While the diffraction peak intensity of B-WO3 at 22.5° decreased due to the decline of crystallinity, as shown in Fig. 1f and S1d,† the lattice fringes of Y-WO3 (001) are clearer than that of B-WO3, which might be attributed to appearance of oxygen vacancies in B-WO3.The chemical bonds of the as-synthesized samples were investigated by FT-IR spectra. As shown in Fig. 2b, the bands appearing at 1600 cm−1 and 3340 cm−1 in Y-WO3 were ascribed to O–H bending vibration and stretching vibration of the surface adsorbed water, respectively, besides, the bands below 1000 cm−1 can be attributed to the stretching vibration of O–W–O.28 After visible light irradiation, there was no evident change in B-WO3, indicating that no other chemical groups were generated on the surface of the two samples.
The typical survey XPS spectra of the as-synthesized samples (Fig. S2†) confirmed the co-existence of W and O. In the O 1 s XPS spectra (Fig. 2c), both samples exhibited two peaks at ∼530.8 eV and 532.4 eV corresponding to the binding energies of W–O and –OH groups, respectively. Compared to Y-WO3, the ratio of –OH/W–O in B-WO3 decreased from 0.16 to 0.13, and the W–O peaks showed a slight shift, which was attributed to a reaction during the photochromism process: WO3 + xe− + xH+ →HxWO3.11 As for the W 4f peaks of Y-WO3 (Fig. 2d), the strong peaks at 38.06 eV/W 4f5/2 and 35.90 eV/W 4f7/2 confirmed the existent of W6+.29 Further, the W 4f peaks of B-WO3 were fitted to W6+ at 38.01 eV/35.87 eV and W5+ at 36.70 eV/34.85 eV.11,30 The W 4f peaks of B-WO3 shifted to lower binding energies and W5+ appeared, suggesting that W6+ might be transformed to W5+ under visible light irradiation.31,32
3.3. Photochromic performance
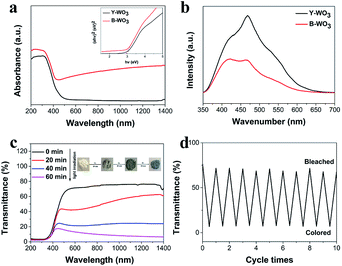
As shown in Fig. 3a, the two samples possessed a similar band gap of ∼2.9 eV and revealed an intrinsic absorption edge at ∼480 nm. For the optical absorption beyond the band edge, the B-WO3 exhibited a broader optical absorption in the visible and NIR regions due to localized surface plasmon resonance (LSPR) absorption that was dependent on the oxygen vacancies, which was in keeping with the appearance of W5+ in the XPS.11,33 As shown in Fig. 3b, the PL spectra of as-synthesized samples showed emission peaks at about 470 nm under the excitation at 325 nm. Y-WO3 performed decreased PL intensity after visible light irradiation, indicating that the electron-transfer interactions existed in the coloration process under visible light irradiation and the conversion from the W6+ to W5+ could accelerate the separation of e−/h+ pairs.16To further analyze the photochromic properties of as-synthesized samples, the photochromic test was carried out (Fig. 3c). The as-synthesized samples also demonstrated a remarkable modulation efficiency of 69%, with the color changing from yellow to blue under visible light irradiation for 1 h. Meanwhile, the B-WO3 could be converted back to Y-WO3 by H2O2 treatment. For its stability (Fig. 3d), the Y-WO3 was colored and bleached ten times and there was no obvious change in the coloration efficacy and reversibility, indicating that the as-synthesized samples were stable and reusable.
3.4. Photocatalytic performance
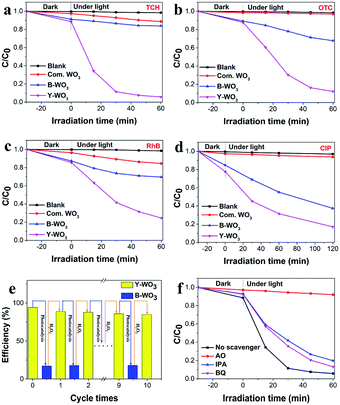
The photocatalytic performance of the as-synthesized samples was evaluated via degrading RhB, CIP, OTC and TCH under visible light irradiation. As illustrated in Fig. 4a, b, c and d, under visible light exposure, the photocatalytic degradation rates of TCH, OTC, RhB, and CIP in the presence of Y-WO3 were 94.3%, 87.9%, 76%, and 68.6%, respectively, in 60 min. While the B-WO3 presented lower photocatalytic degradation efficiencies of 17.1%, 32.1%, 34%, and 44.8%, respectively, in 60 min. In addition, we found that Y-WO3 performed significantly higher photocatalytic activity than that of the commercial WO3 (11.3%, 4.1%, 15.5% and 5.7%, respectively, in 60 min). This could have been because a portion of the W6+ was converted to W5+ during the photochromism process and W6+ possessed high oxidative properties for the oxidation of organic contaminants. Besides, the reductive conversion process accompanied by the consumption of photogenerated electrons facilitated the separation of holes.25 Therefore, achieving the rapid and reversible conversion from B-WO3 to Y-WO3 was an effective strategy to realize sustainable photocatalytic degradation activity. In the process of photocatalytic, Y-WO3 would convert to B-WO3 with the decreased photocatalytic activity, while B-WO3 could be back to Y-WO3 by H2O2 treatment with the recovered photocatalytic efficiency. Stability and reusability tests for Y-WO3 were conducted under visible light irradiation. As illustrated in Fig. 4e, after recycling 10 times, there was no significant change in the photocatalytic degradation of TCH, which indicated that the as-synthesized samples were stable and reusable.3.5. Photocatalytic mechanism
The DMPO electron spin resonance (ESR) measurements were applied to the further demonstration of ROSs under visible light irradiation. As shown in Fig. 5a, DMPO-˙OH could be confirmed in both samples due to the signal intensity of the four characteristic peaks with a ratio of 1![[thin space (1/6-em)]](https://www.rsc.org/images/entities/char_2009.gif) :
:![[thin space (1/6-em)]](https://www.rsc.org/images/entities/char_2009.gif) 2
2![[thin space (1/6-em)]](https://www.rsc.org/images/entities/char_2009.gif) :
:![[thin space (1/6-em)]](https://www.rsc.org/images/entities/char_2009.gif) 2
2![[thin space (1/6-em)]](https://www.rsc.org/images/entities/char_2009.gif) :
:![[thin space (1/6-em)]](https://www.rsc.org/images/entities/char_2009.gif) 1.34 The characteristic peaks for DMPO-˙O2− could be observed in both samples (Fig. 5b). In contrast, the signal intensity of DMPO-˙OH and DMPO-˙O2− for B-WO3 was at the same level as Y-WO3, suggesting that both samples could generate almost the same amount of ˙OH and ˙O2− radicals under visible light irradiation. Furthermore, the DMPO-˙OH signal intensity for both samples performed much stronger than DMPO-˙O2−, implying that ˙OH might be the primary reactive species in the process of photocatalytic. However, Y-WO3 performed significantly higher photocatalytic activity than B-WO3, which indicated the presence of other active species.
1.34 The characteristic peaks for DMPO-˙O2− could be observed in both samples (Fig. 5b). In contrast, the signal intensity of DMPO-˙OH and DMPO-˙O2− for B-WO3 was at the same level as Y-WO3, suggesting that both samples could generate almost the same amount of ˙OH and ˙O2− radicals under visible light irradiation. Furthermore, the DMPO-˙OH signal intensity for both samples performed much stronger than DMPO-˙O2−, implying that ˙OH might be the primary reactive species in the process of photocatalytic. However, Y-WO3 performed significantly higher photocatalytic activity than B-WO3, which indicated the presence of other active species.
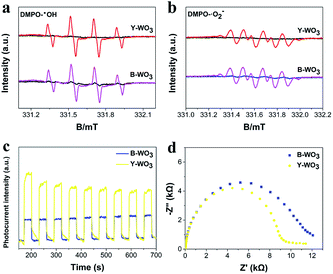 | ||
| Fig. 5 The DMPO electron spin resonance (ESR) spectra of as-synthesized samples (a and b); PEC properties (c and d). | ||
To further verify the key reactive species in the photocatalytic system, various scavengers including IPA (600 mg L−1) for ˙OH, BQ (80 mg L−1) for ˙O2− and AO (700 mg L−1) for h+ were utilized under visible light irradiation.35 As shown in Fig. 4f, after the addition of AO, IPA and BQ, respectively, the degradation efficiencies of TCH were reduced from 94.3% to 8.1%, 80.3% and 87.2%, indicating that h+ was the primary reactive species in the process of photocatalytic. ˙OH and ˙O2− radicals also contributed to the photodegradation, which was corresponding to the results of ESR measurements.
PEC tests including the photocurrent response (PCR) and electrochemical impedance spectroscopy (EIS) were investigated to evaluate the properties of photoinduced charge carriers. As shown in Fig. 5c and d, the Y-WO3 exhibited significantly higher photocurrent intensity and a smaller semicircle radius than B-WO3, which indicated a higher rate of interfacial charge transfer in the Y-WO3.34
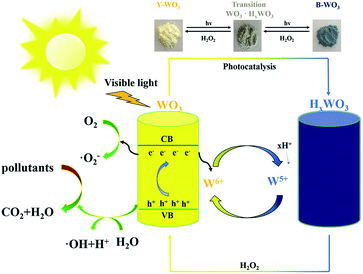
Based on the above results, a potential photocatalytic mechanism for the as-synthesized samples was proposed (Fig. 6). Under visible light irradiation, the Y-WO3 is excited and the photoinduced electrons transfer from the valence band (VB) to the conduction band (CB). On one hand, a portion of the photoinduced electrons can convert O2 to ˙O2− for the degradation of pollutants. Conversely, the insertion of photogenerated electrons and hydrogen ions at the tungsten sites of WO3 causes the reduction from W6+ to W5+ and the formation of HxWO3 with the color conversion from yellow to blue.25 This leaves the h+ in VB for the direct oxidation of pollutants or indirect oxidation of H2O to ˙OH, while the reductive W5+ can be reversibly converted back to W6+ by an H2O2 treatment; thus, forming a rechargeable cycle between Y-WO3 and B-WO3. The rapid and reversible conversion between the W6+ and W5+ redox sites not only significantly promoted the separation of e−/h+ pairs, but also played an important role in rapid and sustainable photodegradation.
4. Conclusions
In summary, a novel gear-shaped WO3 with rapidly reversible photochromism and excellent photocatalytic performance was successfully synthesized via a one-step hydrothermal process. The relationship between the photocatalytic activity and photochromic state was investigated in detail for the first time. Compared to the B-WO3, the Y-WO3 with more W6+ content exhibited significantly higher photocatalytic activity for the degradation of TCH, OTC, RhB, and CIP under visible light irradiation. The characterization results demonstrated that the redox conversion between the W6+ and W5+ during the photochromism process played a key role in enabling highly efficient and sustainable photodegradation. This work provided a new strategy in the environmental remediation via achieving the rapid and reversible conversion between W6+ and W5+, which was based on the photochromic effects.Conflicts of interest
The authors declare no conflict of interest.Acknowledgements
This work was supported by the Natural Science Foundation of Henan (No. 182300410118), Research Project of Science and Technology in Henan Province (No. 172102310586).References
- W. Qi, H. Li and L. Wu, J. Phys. Chem. B, 2008, 112, 8257–8263, DOI:10.1021/jp801188e.
- T. Kunyapat, Y. Xia and Y. Zhu, Prog. Mater. Sci., 2017, 88, 281–324, DOI:10.1016/j.pmatsci.2017.04.003.
- L. Wu, Q. Zhao, H. Huang and R. J. Lim, Surf. Coat. Technol., 2017, 320, 601–607, DOI:10.1016/j.surfcoat.2016.10.074.
- S. Wang, W. Fan, Z. Liu, A. Yu and X. Jiang, J. Mater. Chem. C, 2018, 6, 191–212, 10.1039/c7tc04189f.
- W. Chen, H. Shen, X. Zhu, Z. Xing and S. Zhang, Ceram. Int., 2015, 41, 12638–12643, DOI:10.1016/j.ceramint.2015.06.093.
- S. Wang, W. Fan, Z. Liu, A. Yu and X. Jiang, J. Mater. Chem. C, 2018, 6, 191–212, 10.1039/c7tc04189f.
- Z. Jiao, J. Wang, L. Ke, X. Liu, H. V. Demir, M. F. Yang and X. W. Sun, Electrochim. Acta, 2012, 63, 153–160, DOI:10.1016/j.electacta.2011.12.069.
- C. G. Granqvist, Sol. Energy Mater. Sol. Cells, 2000, 60, 201–262, DOI:10.1016/s0927-0248(99)00088-4.
- H. Song, Y. Li, Z. Lou, M. Xiao, L. Hu, Z. Ye and L. Zhu, Appl. Catal., B, 2015, 166–167, 112–120, DOI:10.1016/j.apcatb.2014.11.020.
- G. Ma, Z. Chen, Z. Chen, M. Jin, Q. Meng, M. Yuan, X. Wang, J. M. Liu and G. Zhou, Mater. Today Energy, 2017, 3, 45–52, DOI:10.1016/j.mtener.2017.02.003.
- N. Li, X. Cao, Y. Li, T. Chang, S. Long, Y. Zhou, G. Sun, L. Ge and P. Jin, Chem. Commun., 2018, 54, 5241–5244, 10.1039/c8cc02211a.
- S. Chen, Y. Xiao, W. Xie, Y. Wang, Z. Hu, W. Zhang and H. Zhao, Nanomaterials, 2018, 8, 553, DOI:10.3390/nano8070553.
- W. Chen, H. Shen, X. Zhu, H. Yao and W. Wang, Ceram. Int., 2015, 41, 14008–14012, DOI:10.1016/j.ceramint.2015.07.013.
- H. M. F. Ahmed and N. S. Begum, Bull. Mater. Sci., 2013, 36, 45–49, DOI:10.1007/s12034-013-0422-y.
- T. He, Y. Ma, Y. Cao, W. Yang and J. Yao, Phys. Chem. Chem. Phys., 2002, 4, 1637–1639, 10.1039/b108531j.
- J. Z. Liao, H. L. Zhang, S. S. Wang, J. P. Yong, X. Y. Wu, R. Yu and C. Z. Lu, Inorg. Chem., 2015, 54, 4345–4350, DOI:10.1021/acs.inorgchem.5b00041.
- S. Ghosh, M. Saha, S. Paul and S. K. De, Nanoscale, 2015, 7, 18284–18298, 10.1039/c5nr05185a.
- Y. Liu, Y. Li, W. Li, S. Han and C. Liu, Appl. Surf. Sci., 2012, 258, 5038–5045, DOI:10.1016/j.apsusc.2012.01.080.
- M. B. Tahir, M. Sagir and K. Shahzad, J. Hazard. Mater., 2019, 363, 205–213, DOI:10.1016/j.jhazmat.2018.09.055.
- J. Kim, C. W. Lee and W. Choi, Environ. Sci. Technol., 2010, 44(17), 6849–6854, DOI:10.1021/es101981r.
- S. Yamazaki, H. Ishida, D. Shimizu and K. Adachi, ACS Appl. Mater. Interfaces, 2015, 7, 26326–26332, DOI:10.1021/acsami.5b09310.
- Z. Ling, K. Liu, Q. Zou, Q. Li, K. Q. Zhang, Z. Cui, W. Yuan and Y. Liu, RSC Adv., 2018, 8, 28581–28587, 10.1039/c8ra05170d.
- S. Songara, V. Gupta, M. Kumar Patra, J. Singh, L. Saini, G. Siddaramana Gowd, S. Raj Vadera and N. Kumar, J. Phys. Chem. Solids, 2012, 73, 851–857, DOI:10.1016/j.jpcs.2012.02.020.
- R. Huang, Y. Shen, L. Zhao and M. Yan, Adv. Powder Technol., 2012, 23, 211–214, DOI:10.1016/j.apt.2011.02.009.
- A. L. Popov, N. M. Zholobak, O. I. Balko, O. B. Balko, A. B. Shcherbakov, N. R. Popova, O. S. Ivanova, A. E. Baranchikov and V. K. Ivanov, J. Photochem. Photobiol., B, 2018, 178, 395–403, DOI:10.1016/j.jphotobiol.2017.11.021.
- T. Ni, Q. Li, Y. Yan, F. Wang, X. Cui, Z. Yang, Y. Wang, Z. Yang, K. Chang and G. Liu, Catalysts, 2020, 10, 416, DOI:10.3390/catal10040416.
- D. Nagy, T. Firkala, E. Drotár, Á. Szegedi, K. László and I. M. Szilágyi, RSC Adv., 2016, 6, 95369–95377, 10.1039/c6ra18899k.
- A. A. Ismail, M. Faisal and A. Al-Haddad, J. Environ. Sci., 2018, 66, 328–337, DOI:10.1016/j.jes.2017.05.001.
- G. Xi, S. Ouyang, P. Li, J. Ye, Q. Ma, N. Su, H. Bai and C. Wang, Angew. Chem., Int. Ed., 2012, 51, 2395–2399, DOI:10.1002/anie.201107681.
- F. Bussolotti, L. Lozzi, M. Passacantando, S. La Rosa, S. Santucci and L. Ottaviano, Surf. Sci., 2003, 538, 113–123, DOI:10.1016/s0039-6028(03)00696-4.
- T. He, Y. Ma, Y. Cao, X. Hu, H. Liu, G. Zhang, W. Yang and J. Yao, J. Phys. Chem. B, 2002, 106, 12670–12676, DOI:10.1021/jp026031t.
- T. He and J. N. Yao, Res. Chem. Intermed., 2004, 30, 459–488, DOI:10.1163/1568567041280890.
- J. Yan, T. Wang, G. Wu, W. Dai, N. Guan, L. Li and J. Gong, Adv. Mater., 2015, 27, 1580–1586, DOI:10.1002/adma.201404792.
- T. Xiao, Z. Tang, Y. Yang, L. Tang, Y. Zhou and Z. Zou, Appl. Catal., B, 2018, 220, 417–428, DOI:10.1016/j.apcatb.2017.08.070.
- Z. Cai, X. Hao, X. Sun, P. Du, W. Liu and J. Fu, Water Res., 2019, 162, 369–382, DOI:10.1016/j.watres.2019.06.017.
Footnote |
| † Electronic supplementary information (ESI) available: SEM and TEM images of B-WO3; SEM (a); TEM (b and c); HRTEM (d), full XPS spectra of the as-synthesized samples, photodegradation activities of RhB under different pH values, the adsorption–desorption equilibrium of TCH in dark with the inserts for the color of Y-WO3. See DOI: 10.1039/d0ra09714d |
| This journal is © The Royal Society of Chemistry 2021 |

