 Open Access Article
Creative Commons Attribution 3.0 Unported Licence
N2-foam-assisted CO2 huff-n-puff process for enhanced oil recovery in a heterogeneous edge-water reservoir: experiments and pilot tests
Hongda Hao *a,
Jirui Houa,
Fenglan Zhaoa,
Handong Huanga and
Huaizhu Liub
aChina University of Petroleum, Beijing, 102249, China. E-mail: haohongda90@126.com; Tel: +86 17601007653
bDrilling & Production Technology Research Institute, Jidong Oilfield Company, CNPC, Tangshan, Hebei 063000, China
First published on 4th January 2021
Abstract
The CO2 huff-n-puff process is an effective method to enhance oil recovery; however, its utilization is limited in heterogenous edge-water reservoirs due to the severe water channeling. Accordingly, herein, a stable N2 foam is proposed to assist CO2 huff-n-puff process for enhanced oil recovery. Sodium dodecyl sulfate (SDS) and polyacrylamide (HPAM) were used as the surfactant and stabilizer, respectively, and 0.3 wt% of SDS + 0.3 wt% of HPAM were screened in the laboratory to generate a foam with good foamability and long foam stability. Subsequently, dynamic foam tests using 1D sand packs were conducted at 65 °C and 15 MPa, and a gas/liquid ratio (GLR) of 1![[thin space (1/6-em)]](https://www.rsc.org/images/entities/char_2009.gif) :
:![[thin space (1/6-em)]](https://www.rsc.org/images/entities/char_2009.gif) 1 was optimized to form a strong barrier in high permeable porous media to treat water and gas channeling. 3D heterogeneous models were established in the laboratory, and N2-foam-assisted CO2 huff-n-puff experiments were conducted after edge-water driving. The results showed that an oil recovery of 13.69% was obtained with four cycles of N2-foam-assisted CO2 injection, which is twice that obtained by the CO2 huff-n-puff process. The stable N2 foam could temporarily delay the water and gas channeling, and subsequently, CO2 fully extracted the remaining oil in the low permeable zones around the production well. Pilot tests were conducted in 8 horizontal wells, and a total oil production of 1784 tons with a net price value (NPV) of $240
1 was optimized to form a strong barrier in high permeable porous media to treat water and gas channeling. 3D heterogeneous models were established in the laboratory, and N2-foam-assisted CO2 huff-n-puff experiments were conducted after edge-water driving. The results showed that an oil recovery of 13.69% was obtained with four cycles of N2-foam-assisted CO2 injection, which is twice that obtained by the CO2 huff-n-puff process. The stable N2 foam could temporarily delay the water and gas channeling, and subsequently, CO2 fully extracted the remaining oil in the low permeable zones around the production well. Pilot tests were conducted in 8 horizontal wells, and a total oil production of 1784 tons with a net price value (NPV) of $240![[thin space (1/6-em)]](https://www.rsc.org/images/entities/char_2009.gif) 416.26 was obtained using the N2-foam-assisted CO2 huff-n-puff process, which is a profitable method for enhanced oil recovery in heterogenous reservoirs with edge water.
416.26 was obtained using the N2-foam-assisted CO2 huff-n-puff process, which is a profitable method for enhanced oil recovery in heterogenous reservoirs with edge water.
1. Introduction
Edge-water-driving reservoirs are widely distributed in China, which account for important proportions of geological reserves of crude oil.1–4 The existence of edge water has both advantages and disadvantages for the development of oilfields. On one hand, edge water can provide energy for oil production and maintain the formation pressure. On the other hand, the invasion of edge water can cause a quick increase in the water cut and a low oil recovery efficiency.5,6 North Gaoqian Block, located in the north of Bohai Bay, China, is a heavy oil reservoir with a sufficient edge-water aquifer. The permeability of this reservoir is in the range from 118 × 10−3 μm2 to 12![[thin space (1/6-em)]](https://www.rsc.org/images/entities/char_2009.gif) 392 × 10−3 μm2, which indicates that serious heterogeneity exists in this reservoir. The reservoir began to be developed using horizontal wells in 2004, and more than 12 × 104 tons of crude oil was obtained annually using edge-water driving. However, due to the serious edge-water channeling, the water cut increased sharply to more than 90% within 5 years, and the oil recovery was less than 15% up to 2010. Therefore, appropriate techniques need to be conducted to enhance the oil recovery (EOR) in this heterogeneous reservoir.
392 × 10−3 μm2, which indicates that serious heterogeneity exists in this reservoir. The reservoir began to be developed using horizontal wells in 2004, and more than 12 × 104 tons of crude oil was obtained annually using edge-water driving. However, due to the serious edge-water channeling, the water cut increased sharply to more than 90% within 5 years, and the oil recovery was less than 15% up to 2010. Therefore, appropriate techniques need to be conducted to enhance the oil recovery (EOR) in this heterogeneous reservoir.
CO2-EOR is a promising technique to enhance heavy oil recovery, which has been successfully used in many countries.7–12 As one of the CO2-EOR methods, the CO2 huff-n-puff process is usually conducted in a single well, and three stages are included in this process as follows: (1) injection stage: CO2 is injected into the formation through an operation well. (2) Soaking stage: the well is shut-in for a period to allow CO2 to be dissolved with the formation oil. (3) Production stage: the operation well is then reopened for production. The CO2 huff-n-puff process can be immiscible, near-miscible and miscible, which depends on the minimum miscibility pressure (MMP) between CO2 and oil. When the pressure is less than the MMP, the oil recovered by CO2 is mainly through oil swelling, viscosity reduction, light components of oil extraction, and relative permeability of water and gas reduction.13–17 When the pressure approaches or exceeds the MMP, the interfacial tension (IFT) between CO2 and oil can be sharply reduced to form a near-miscible or miscible CO2 huff-n-puff process, which will drastically enhance the oil recovery.18,19
The CO2 huff-n-puff process has been applied in North Gaoqian Block, China since 2010, and more than 16 × 104 tons of crude oil was recovered by CO2 until the end of 2017. However, problems were also found during the operation process. For example, the oil recovery gradually decreased after multicycles of gas injection, and the water cuts of single wells were usually above 99% after cycling due to edge-water channeling. Heterogeneity not only provides channels for edge water, it also severely affects the displacement efficiency of CO2. Due to the serious heterogeneity, CO2 mostly flows along high permeable layers or channels, leaving plenty of crude oil in the low permeable layers. Thus, treatments need to be done to deal with water and gas channeling during the CO2 huff-n-puff process.
The used of foam was proposed as an EOR method to reduce water and gas permeability in the 1960s.20,21 As a colloidal system, foam is usually made of a discontinuous gas dispersed in a continuous liquid phase, where gas bubbles are separated by thin liquid films called lamellae.22–24 Since gas is wrapped in bubbles in the liquid phase, the apparent viscosity is several orders of magnitude greater than either gas or liquid, which then effectively inhibits viscous fingering and enhances the oil recovery.25,26 When foam is injected into heterogenous reservoirs, it will first enter the high permeable zones with higher porosity and better connectivity. As the foam transports through the formations, high flow resistance will be caused in high permeable zones due to the Jamin effect. Consequently, the successive displacing agent will be impelled to displace the oil in the low permeable zones.27–29 Recently, laboratory experiments have shown that foam can even be used to plug severe water or gas channels such as fractures, and the oil recovery enhanced by foam injection can reach 25–30%.30–32
Although significant EOR factors can be obtained using foams, most of the foam injections are operated during the flooding process, and only a few studies have been conducted in the foam-assisted huff-n-puff process. When assisting the CO2 huff-n-puff process, the foam should have special properties as follows. (1) The surfactant must be pH tolerant to ensure good foamability due to the CO2 environment. As a type of anionic surfactant, sodium dodecyl sulfate (SDS) is broadly used in sandstone reservoirs, which has advantages of foaming, thermal stability and low cost.33–35 (2) A stabilizer needs to be added to generate a more stable foam for water and gas plugging. Adding a polyacrylamide (HPAM) additive can effectively increase the apparent viscosity and enhance the stability of foam.36 (3) Excellent pressure maintenance should be achieved with the minimal usage of foam in the huff-n-puff process. N2 is a type of non-condensate gas, which can effectively build-up the formation pressure. Furthermore, many researchers have found that N2 foam is usually stronger and more stable compared to CO2 foam.37–39 Thus, herein, stable N2 foam was used to assist the CO2 huff-n-puff process for EOR.
To generate a stable N2 foam to assist the CO2 huff-n-puff process, SDS and HPAM were selected as the surfactant and stabilizer, respectively, and their concentrations were firstly optimized in the laboratory via the evaluation of foamability and foam stability. Then, dynamic foam tests using 1D sand-packs were conducted to evaluate the plugging mechanisms for water and gas channeling. 3D heterogeneous models were established in the laboratory, and N2-foam assisted CO2 huff-n-puff experiments were conducted to study the EOR effects with the assistance of N2-foam plugging. Finally, pilot tests were also introduced, and a simplified economic analysis was performed to evaluate the economic benefits resulting from the N2-foam-assisted CO2 huff-n-puff process.
2. Experiments
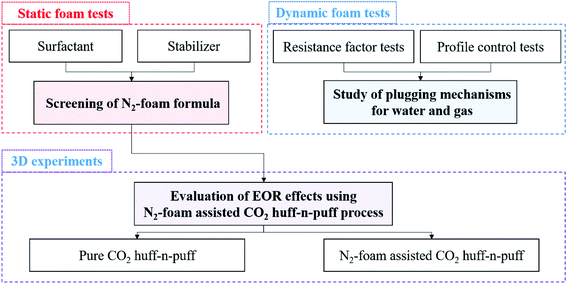
Three main experiments were designed to study the mechanisms and EOR effects using the N2-foam-assisted CO2 huff-n-puff process. Static foam tests were performed to screen the concentration of surfactant and stabilizer, dynamic foam tests were performed to study the plugging mechanisms for water and gas channeling, and 3D experiments were performed to evaluate the EOR effects of the N2-foam-assisted CO2 huff-n-puff process. A flow chart for the experiments conducted herein is shown in Fig. 1.2.1. Materials
Sodium dodecyl sulfate (SDS, active concentration of 99%) was used as the surfactant and polyacrylamide (HPAM, molecular weight of 20 million Daltons) was used as the stabilizer. Both the surfactant and polymer were obtained from Beijing Hengju Chemical Group, Co. LTD., China. Nitrogen (N2, purity >99.99 mol%) was used for the generation of foam, and carbon dioxide (CO2, purity >99.999 mol%) was used for the huff-n-puff process, which were both provided by Beijing Jinggao Gases Co. LTD., China. The formation oil and water were collected from the reservoir block. The density of the formation oil was 0.89 g cm−3, its viscosity was 58.21 mPa s and the gas/oil ratio was 42.42 m3/m3 under the formation conditions (65 °C, 15 MPa). The compositions of the formation oil are presented in Table 1. The salinity of the formation water was 1937 mg L−1.| Component | Mol% | Component | Mol% |
|---|---|---|---|
| CO2 | 0.000 | nC4 | 0.256 |
| N2 | 1.800 | iC5 | 0.026 |
| C1 | 20.310 | nC5 | 0.033 |
| C2 | 6.648 | C6 | 0.066 |
| C3 | 1.152 | C7+ | 69.325 |
| iC4 | 0.384 | Total | 100 |
2.2 N2-foam evaluation experiments
![[thin space (1/6-em)]](https://www.rsc.org/images/entities/char_2009.gif) 000 rpm to generate foam, and then the foam was poured into a graduated cylinder to measure the foam volume (VF) and half-life time (t1/2). The foam volume (VF) was used to reflect the foamability of the chemical agent, while the half-life time (t1/2) was used to reflect the foam stability (measured as the time used for half-volume dewatering). Then, a foam composite index (FCI) was used to evaluate the foam performance comprehensively,44,45 which was calculated as FCI = 0.75VF × t1/2. A suitable formula of foaming agent was screened according to the foam volume (VF), half-life time (t1/2), and FCI index, and then utilized in the following experiments and pilot tests.
000 rpm to generate foam, and then the foam was poured into a graduated cylinder to measure the foam volume (VF) and half-life time (t1/2). The foam volume (VF) was used to reflect the foamability of the chemical agent, while the half-life time (t1/2) was used to reflect the foam stability (measured as the time used for half-volume dewatering). Then, a foam composite index (FCI) was used to evaluate the foam performance comprehensively,44,45 which was calculated as FCI = 0.75VF × t1/2. A suitable formula of foaming agent was screened according to the foam volume (VF), half-life time (t1/2), and FCI index, and then utilized in the following experiments and pilot tests.| No. | Experiment | Apparent volume/mL | Pore volume/mL | Porosity/% | Permeability/×10−3 μm2 |
|---|---|---|---|---|---|
| 1 | RF vs. GLR | 147.54 | 55.5 | 37.59 | 3431 |
| 147.31 | 52.2 | 35.43 | 3118 | ||
| 146.83 | 50.5 | 34.37 | 2775 | ||
| 147.07 | 54.6 | 37.12 | 3276 | ||
| 147.42 | 55.4 | 37.61 | 3303 | ||
| 2 | RF vs. permeability | 146.97 | 41.8 | 28.41 | 469 |
| 147.16 | 45.1 | 30.65 | 1231 | ||
| 146.83 | 50.5 | 34.37 | 2775 | ||
| 147.22 | 52.8 | 35.88 | 5314 | ||
| 147.39 | 55.1 | 37.39 | 8253 |
| No. | Sand pack | Apparent volume/mL | Pore volume/mL | Porosity/% | Permeability/×10−3 μm2 |
|---|---|---|---|---|---|
| 1 | Low permeability | 147.13 | 40.4 | 27.44 | 535 |
| 2 | High permeability | 147.25 | 52.5 | 35.66 | 3431 |
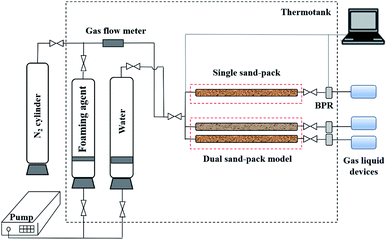
A schematic diagram of the dynamic foam tests is shown in Fig. 2. The equipment mainly consisted of four parts, including an injection system, a displacement system, a production system and a data acquisition system. For the injection system, the formation water and foaming agents were stored in containers, which were driven by an injection pump. N2 was provided by a nitrogen cylinder, and was controlled using a gas flow meter. For the displacement system, the single sand pack or dual sand pack model was placed in a thermotank to simulate the formation conditions. Back pressure regulation (BPR) was used in the production system to maintain the pressure as formation pressure, and the produced water and gas were collected by a gas–liquid device. The injection pressure, production pressure and differential pressure drop were recorded by the data acquisition system.
The resistance factors (RFs) of different gas/liquid ratios (GLRs) were firstly measured using the single sand packs. The RF can be used as an index to evaluate the plugging ability of N2 foam,46–48 which is defined as RF = (Δpfoam/Δpwater)at same rate, where Δpfoam is the differential pressure drop for foam injection, kPa, and Δpwater is the differential pressure drop for water injection, kPa. The experimental procedures are detailed as follows. (1) Preparation: a single sand pack with a permeability of 3000 × 10−3 μm2 was used in this section. After the sand pack was saturated with formation water, the porosity of the sand pack was calculated as the ratio of pore volume (PV, equal to saturated water volume) to apparent volume. (2) Water injection: the temperature of the thermotank was set as 65 °C, and the pressure of the BPR was set as 15 MPa. Formation water was injected into the sand pack at a constant rate of 0.5 mL min−1, and then terminated when the differential pressure drop of water (Δpwater) was steady. (3) Foam injection: N2 and the foaming agent were alternately injected into the sand pack with a flow rate of 0.5 mL min−1. The GLR value varied as 1![[thin space (1/6-em)]](https://www.rsc.org/images/entities/char_2009.gif) :
:![[thin space (1/6-em)]](https://www.rsc.org/images/entities/char_2009.gif) 2, 1.5
2, 1.5![[thin space (1/6-em)]](https://www.rsc.org/images/entities/char_2009.gif) :
:![[thin space (1/6-em)]](https://www.rsc.org/images/entities/char_2009.gif) 1, 1
1, 1![[thin space (1/6-em)]](https://www.rsc.org/images/entities/char_2009.gif) :
:![[thin space (1/6-em)]](https://www.rsc.org/images/entities/char_2009.gif) 1, 1
1, 1![[thin space (1/6-em)]](https://www.rsc.org/images/entities/char_2009.gif) :
:![[thin space (1/6-em)]](https://www.rsc.org/images/entities/char_2009.gif) 1.5 and 1
1.5 and 1![[thin space (1/6-em)]](https://www.rsc.org/images/entities/char_2009.gif) :
:![[thin space (1/6-em)]](https://www.rsc.org/images/entities/char_2009.gif) 2, and was terminated when the pressure drop of the foam (Δpfoam) was steady. The RF value was then calculated according to the pressure drop, and a suitable GLR was determined for the subsequent experiments.
2, and was terminated when the pressure drop of the foam (Δpfoam) was steady. The RF value was then calculated according to the pressure drop, and a suitable GLR was determined for the subsequent experiments.
The RF value of the N2 foam in different permeable sand packs was then measured with the optimal GLR value. Sand packs with a permeability of 500 × 10−3 μm2, 1000 × 10−3 μm2, 3000 × 10−3 μm2, 5000 × 10−3 μm2 and 8000 × 10−3 μm2 were used in this section. The experimental procedures for preparation, water injection and foam injection were the same as mentioned above. Also, the plugging ability of N2 foam for different permeable porous media was evaluated by comparing the RF values obtained in the different permeable sand packs.
A profile control experiment using N2 foam was also conducted in a dual sand pack model. After the experimental preparation, 0.50 PV of water was injected into the model, followed by 0.05 PV of N2 foam, then successive water was injected into the model until the N2 foam was totally displaced from the model. The injection rate of water and foam was set as 0.5 mL min−1, and the liquid production rates of high (Qh) and low (Ql) permeable sand packs were recorded separately throughout the experimental process. The profile control ability of N2 foam can be evaluated by comparing the changes in Qh and Ql.
2.3 3D experiments for N2-foam-assisted CO2 huff-n-puff
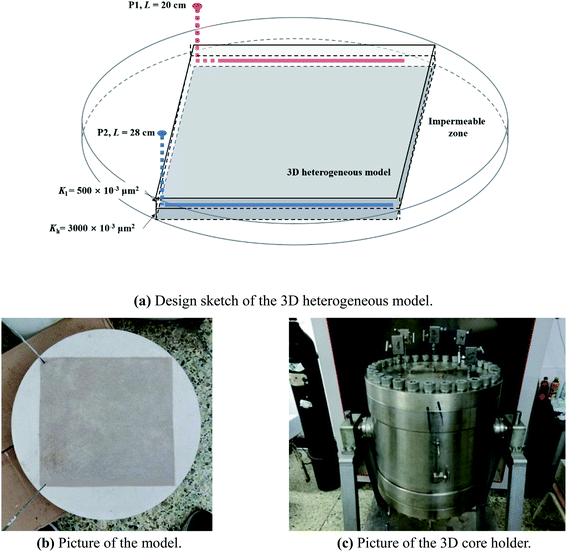
The N2-foam-assisted CO2 huff-n-puff experiment was conducted in a 3D physical model in the laboratory. The model was heterogeneous with two layers, where the permeability of the upper layer (Kl) was 500 × 10−3 μm2, the permeability of the sublayer (Kh) was 3000 × 10−3 μm2, and the permeability contrast was 6. The model size was 30 × 30 × 4.5 cm3, as shown in Fig. 3, and the other parameters of the 3D model are listed in Table 4. Well P2 was designed for edge-water injection with a length of 28 cm, and well P1 was designed as a producer with a length of 20 cm. Four impermeable zones were fabricated beside the four sides of the model in order to fit the 3D core holder, and no fluids could exchange between the permeable zone and impermeable zones (as shown in Fig. 3(a) and (b)). The 3D core holder (as shown in Fig. 3(c)) was specially utilized for the high temperature and high pressure experiments with an operation temperature in the range of 0–100 °C and operation pressure in the range of 0–30 MPa.| No. | Experimental scheme | Apparent volume/mL | Pore volume/mL | Porosity/% | Permeability/×10−3 μm2 | Initial oil saturation/% |
|---|---|---|---|---|---|---|
| 1 | CO2 huff-n-puff | 4059 | 1110 | 27.34 | 500/3000 | 65.47 |
| 2 | N2-foam assist CO2 huff-n-puff | 4041 | 1030 | 25.49 | 63.26 |
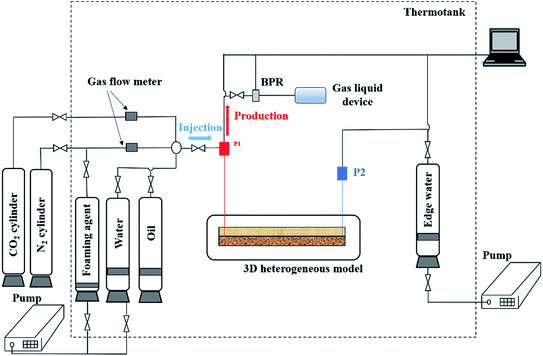
Fig. 4 shows a flow chart of the N2-foam-assisted CO2 huff-n-puff experiment. Similar to the sand pack equipment, the injection system, displacement system, production system and data acquisition system were also included in the 3D experimental apparatus. For the injection system, the formation water, formation oil and foaming agents were stored in containers, and N2 and CO2 were provided by nitrogen and CO2 cylinders. For the displacement system, the 3D model was placed in a thermotank to simulate the reservoir conditions. For the production system, a BPR was used to maintain the formation pressure, and the produced water, oil and gas were collected by a gas–liquid device. The injection pressure, production pressure and differential pressure drop were also recorded by the data acquisition system. Moreover, an edge-water injection system was specially designed to simulate the edge-water injection, which was driven by another injection pump.
To evaluate the EOR effects of the N2-foam-assisted CO2 huff-n-puff process, a comparative experiment of the CO2 huff-n-puff process was also conducted without the assistance of N2-foam. Scenario 1 was utilized for the CO2 huff-n-puff experiment, and the experimental procedure is detailed as follows. (1) Preparation: the 3D model was held by the core holder and saturated with formation water and oil. The porosity, initial water and oil saturation were then calculated according to the injection volume of water and oil. Then, the model was placed in the thermotank with a temperature of 65 °C, and the BPR pressure of P1 was set as 15 MPa. (2) Edge-water driving: edge water was injected through P2 at an injection rate of 0.5 mL min−1, and P1 was opened for production simultaneously. After the water cut of P1 reached 98%, P1 and P2 were shut, and the edge-water driving process was terminated. (3) CO2 huff-n-puff: P2 remained shut, and P1 was opened for CO2 injection. When the injection volume of CO2 reached 900 mL (under standard conditions), P1 was shut, and the gas injection stage was terminated. After 12 h of soaking time, P2 was reopened to continue edge-water injection, and P1 was reopened for production. When the water cut of P1 reached 98% again, P1 and P2 were shut, and one cycle of CO2 huff-n-puff was finished. Three more cycles were conducted on the model, and then the experiment was finished. The production of oil, water and gas, and the pressure were recorded during the experimental process.
The N2-foam-assisted CO2 huff-n-puff experiment was conducted after edge-water driving in Scenario 2. The experimental procedures for the preparation and edge-water driving are the same as Scenario 1, while the procedure for the N2-foam-assisted CO2 huff-n-puff process is detailed as follows. (1) N2-foam injection: a slug of N2 foam was pre-injected into the model before CO2 injection. N2 and the foaming agents were alternately injected through P1 at an injection rate of 0.5 mL min−1. Considering the poor compressive properties of the foaming agents, P2 was changed into an production well, and remained open during the injection stage. After 10 mL of N2 and 10 mL of foaming agent were injected, P1 and P2 were shut. (2) CO2 huff-n-puff: P2 remained shut, and P1 was opened for CO2 injection. When the injection volume of CO2 reached 800 mL, P1 was shut, and the CO2 injection stage was terminated. After 12 h of soaking time, P2 was reopened to continue edge-water injection, and P1 was reopened for production. When the water cut of P1 reached 98% again, P1 and P2 were shut, and one cycle of N2-foam-assisted CO2 huff-n-puff process was finished. Three more cycles were conducted on the 3D model, and then the experiment was completed. The production of oil, water and gas, and the pressure were recorded during the experimental process.
3. Results and discussion
3.1 Static and dynamic performance of N2 foam
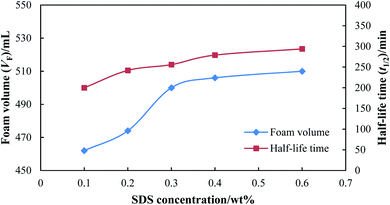
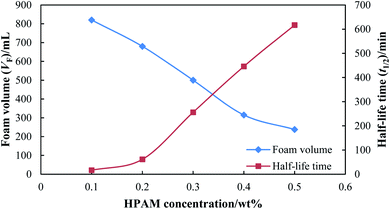
The surfactant is an essential ingredient to generate foam, and thus its concentration was firstly screened at ambient temperature and atmospheric pressure. Then, 0.3 wt% of stabilizer (HPAM) was added to the foaming agent, and the static foam performance of SDS with different concentrations was evaluated, as shown in Fig. 5. The foam volume increased rapidly when the SDS concentration increased from 0.1 wt% to 0.3 wt%, which indicates that a high concentration of surfactant is beneficial for foamability. When the foam volume increased slightly when the SDS concentration was higher than 0.3 wt%, the foam volume remained at a high value, and excessive surfactant had little influence on the foamability. The half-life time also increased with an increase in the concentration of SDS, and a more stable foam was generated with a higher concentration of surfactant.Fig. 6 shows the static foam performance with different HPAM concentrations, where the concentration of SDS was kept constant at 0.3 wt%. Compared with the influence of SDS concentration, HPAM concentration had a greater influence on the foam performance. The half-life time increased significantly from 16.5 min to 617 min when the HPAM concentration increased from 0.1 wt% to 0.5 wt%, which indicates that a more stable foam can be formed with a higher concentration of stabilizer. However, the foam volume decreased sharply from 820 mL to 238 mL when the HPAM concentration increased from 0.1 wt% to 0.5 wt%. A higher HPAM concentration has a negative effect on foamability, and thus a suitable concentration of stabilizer should be screened considering both foamability and foam stability.
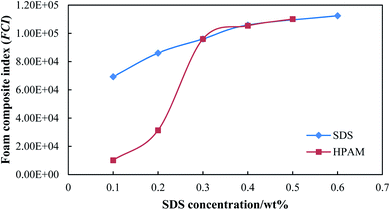
Fig. 7 shows the foam composite index (FCI) for different foaming agents. The FCI of SDS increased with an increase in the concentration of SDS, and remained at a much higher value compared with that of HPAM (HPAM concentration <0.3 wt%). Since the FCI of SDS is mainly dominated by foam volume, a concentration of SDS equal to or higher than 0.3 wt% is suitable for foamability. Thus, 0.3 wt% of SDS was used in the following experiments and pilot tests considering cost saving. The FCI of HPAM increased rapidly when the HPAM concentration increased from 0.1 wt% to 0.3 wt%, where the foam showed excellent foamability but a poor stability. Although the FCI of HPAM remained at a higher value when the HPAM concentration was higher than 0.3 wt%, the foam showed an excellent stability but a poor foamability. Thus, the concentration of stabilizer was set as 0.3 wt% with comprehensive consideration of foamability and stability.
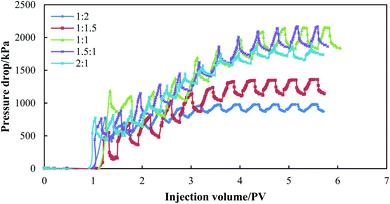
The dynamic foam performance was then evaluated using the foaming agent consisting of 0.3 wt% SDS and 0.3 wt% HPAM. The foaming agent and N2 were alternately injected into single sand packs under the formation conditions (65 °C and 15 MPa), and the pressure drop for the different gas/liquid ratios (GLRs) is shown in Fig. 8. Specifically, 0.10 PV of water was pre-injected before N2 foam injection, and the pressure drop of water was about 6 kPa. The pressure drop increased gradually with an increase in the N2-foam injection volume, and fluctuated by alternating the gas/liquid. Since N2 and the foaming agent were alternately injected into the sand packs, a barrier was firstly built by the viscous foaming agent. When the following slug of N2 was injected, a small portion of gas phase was trapped by the barrier, which then delayed the expansion of the gas phase. With the alternating of N2 slug and liquid slug, an increasing amount of gas was trapped in the porous media, which then caused an increase in the pressure drop. However, the trapping effect was also influenced by the GLR ratio. The equilibrium pressure drop was used to compare the pressure buildup by N2 foams with different GLRs, which is an average value of the gas and liquid pressure drop. The N2 foam with a GLR value of 1![[thin space (1/6-em)]](https://www.rsc.org/images/entities/char_2009.gif) :
:![[thin space (1/6-em)]](https://www.rsc.org/images/entities/char_2009.gif) 2 or 1
2 or 1![[thin space (1/6-em)]](https://www.rsc.org/images/entities/char_2009.gif) :
:![[thin space (1/6-em)]](https://www.rsc.org/images/entities/char_2009.gif) 1.5 achieved the lowest pressure drop of less than 1400 kPa, where N2 saturation as too low to form a stable barrier, and the pressure buildup was mainly due to the flow of polymer and surfactant in the porous media. When the GLR value was equal to or more than 1
1.5 achieved the lowest pressure drop of less than 1400 kPa, where N2 saturation as too low to form a stable barrier, and the pressure buildup was mainly due to the flow of polymer and surfactant in the porous media. When the GLR value was equal to or more than 1![[thin space (1/6-em)]](https://www.rsc.org/images/entities/char_2009.gif) :
:![[thin space (1/6-em)]](https://www.rsc.org/images/entities/char_2009.gif) 1, N2 and the foaming agent could be mixed sufficiently to form a strong barrier for water and gas channeling, which then caused a pressure of up to more than 2100 kPa. When the GLR value reached 2
1, N2 and the foaming agent could be mixed sufficiently to form a strong barrier for water and gas channeling, which then caused a pressure of up to more than 2100 kPa. When the GLR value reached 2![[thin space (1/6-em)]](https://www.rsc.org/images/entities/char_2009.gif) :
:![[thin space (1/6-em)]](https://www.rsc.org/images/entities/char_2009.gif) 1, although a similar pressure gradient could also be built in the initial injection period, gas channeling occurred through the sand pack due to excessive N2 injection, leading to a slight decrease in the equilibrium pressure drop. Table 5 lists the resistance factor (RF) of the N2 foams with different GLR values. When the GLR value was equal to or more than 1
1, although a similar pressure gradient could also be built in the initial injection period, gas channeling occurred through the sand pack due to excessive N2 injection, leading to a slight decrease in the equilibrium pressure drop. Table 5 lists the resistance factor (RF) of the N2 foams with different GLR values. When the GLR value was equal to or more than 1![[thin space (1/6-em)]](https://www.rsc.org/images/entities/char_2009.gif) :
:![[thin space (1/6-em)]](https://www.rsc.org/images/entities/char_2009.gif) 1, the RF value was calculated to be greater than 300. Since the N2 foam with a GLR of 1
1, the RF value was calculated to be greater than 300. Since the N2 foam with a GLR of 1![[thin space (1/6-em)]](https://www.rsc.org/images/entities/char_2009.gif) :
:![[thin space (1/6-em)]](https://www.rsc.org/images/entities/char_2009.gif) 1 achieved the highest RF value of 341.98, the GLR value was set as 1
1 achieved the highest RF value of 341.98, the GLR value was set as 1![[thin space (1/6-em)]](https://www.rsc.org/images/entities/char_2009.gif) :
:![[thin space (1/6-em)]](https://www.rsc.org/images/entities/char_2009.gif) 1 for the following experiments.
1 for the following experiments.
| No. | Permeability/×10−3 μm2 | GLR | RF |
|---|---|---|---|
| 1 | 3000 (±500) | 1![[thin space (1/6-em)]](https://www.rsc.org/images/entities/char_2009.gif) : :![[thin space (1/6-em)]](https://www.rsc.org/images/entities/char_2009.gif) 2 2 |
159.82 |
| 2 | 1![[thin space (1/6-em)]](https://www.rsc.org/images/entities/char_2009.gif) : :![[thin space (1/6-em)]](https://www.rsc.org/images/entities/char_2009.gif) 1.5 1.5 |
212.77 | |
| 3 | 1![[thin space (1/6-em)]](https://www.rsc.org/images/entities/char_2009.gif) : :![[thin space (1/6-em)]](https://www.rsc.org/images/entities/char_2009.gif) 1 1 |
341.98 | |
| 4 | 1.5![[thin space (1/6-em)]](https://www.rsc.org/images/entities/char_2009.gif) : :![[thin space (1/6-em)]](https://www.rsc.org/images/entities/char_2009.gif) 1 1 |
340.31 | |
| 5 | 2![[thin space (1/6-em)]](https://www.rsc.org/images/entities/char_2009.gif) : :![[thin space (1/6-em)]](https://www.rsc.org/images/entities/char_2009.gif) 1 1 |
301.46 | |
| 6 | 469 | 1![[thin space (1/6-em)]](https://www.rsc.org/images/entities/char_2009.gif) : :![[thin space (1/6-em)]](https://www.rsc.org/images/entities/char_2009.gif) 1 1 |
59.73 |
| 7 | 1231 | 114.10 | |
| 8 | 2775 | 341.98 | |
| 9 | 5314 | 494.38 | |
| 10 | 8253 | 571.67 |
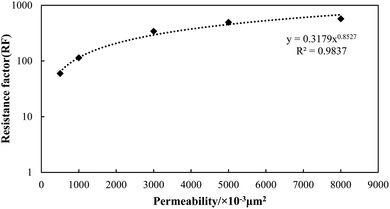
The RF values of the N2 foams in the different permeable sand packs were also measured, and the results are shown in Fig. 9. It can be seen that the RF value exhibits an exponential increase with the change in permeability. When the permeability increased from 500 × 10−3 μm2 to 8000 × 10−3 μm2, the RF value increased dramatically from 59.73 to 571.67. This observation is consistent with the result reported by Jian et al.49 Since the shearing force decreases with an increase in the pore throat size, the gas saturation trapped in the foaming agent can be fully maintained in higher permeable porous media. N2 foam tends to form a stronger barrier in the higher permeable zone, which is beneficial for water and gas plugging in heterogeneous reservoirs.
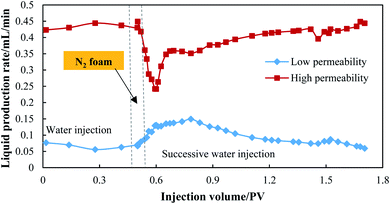
A profile control experiment using N2 foam was also conducted using a dual sand pack, and the result is shown in Fig. 10. During the water injection process, the liquid production rate of the high permeable sand pack was 0.43 mL min−1, which accounts for 86.75% of the total production rate. The water mainly flowed along the high permeable sand pack, leading to a low sweep efficiency in the low permeable sand pack. After 0.05 PV of N2-foam plugging, the liquid production rate of the high permeable sand pack could be reduced to 0.24 mL min−1, which is almost half the rate before foam plugging. After the high permeable sand pack was effectively plugged by foam, the water and gas were then diverted to flow in the low permeable sand pack, and the production rate of the low permeable sand pack doubled from 0.07 mL min−1 to 0.13 mL min−1. Furthermore, this profile improvement lasted for 1.15 PV of successive water injection until the N2 foam was totally displaced from the sand packs, which indicates that the barrier formed by N2 foam has a long validity for water and gas plugging. The high strength, ability of fluid diversion and long validity for profile control with minimal usage (0.05 PV) make the use of the foam possible to treat water/gas channeling and assist the CO2 huff-n-puff process.
3.2 EOR effects of N2-foam-assisted CO2 huff-n-puff
To study the EOR effect of N2-foam-assisted CO2 huff-n-puff in a heterogenous edge-water reservoir, 3D experiments were conducted in the laboratory, and the results are presented in Table 6. A pure CO2 huff-n-puff process was conducted after edge-water driving in Scenario 1 for comparison. During the edge-water driving process, water firstly breakthrough with an injection volume of just 0.01 PV. Then, the water cut increased sharply to 90% after 0.4 PV of edge-water injection. When the water cut of P1 reached 98%, the oil recovery of edge-water driving was 27.32% and 29.40% for these two models, respectively. Due to the heterogeneity, the injected edge water mostly flowed through the high permeable layer, and the oil recovery was mostly attributed to the oil displaced from the high permeable layer. After the channeling of the edge water, plenty of oil remained in the low permeable layer. For the near-wellbore area of well P1, the oil in the low permeable zone could even be unswept by the edge water.| No. | Period | Cycle no. | N2 foam (GLR = 1![[thin space (1/6-em)]](https://www.rsc.org/images/entities/char_2009.gif) : :![[thin space (1/6-em)]](https://www.rsc.org/images/entities/char_2009.gif) 1)/mL 1)/mL |
CO2 volume (surface)/mL | Oil volume/mL | Oil recovery factor/% |
|---|---|---|---|---|---|---|
| 1 | Edge-water driving | — | — | — | 198.5 | 27.32 |
| CO2 huff-n-puff | 1 | — | 900 | 14.8 | 2.03 | |
| 2 | — | 900 | 12.8 | 1.76 | ||
| 3 | — | 900 | 11.4 | 1.57 | ||
| 4 | — | 900 | 10.2 | 1.40 | ||
| 2 | Edge-water driving | — | — | — | 191.6 | 29.40 |
| N2-foam assisted CO2 huff-n-puff | 1 | 20 | 800 | 33.6 | 5.15 | |
| 2 | 20 | 800 | 21.6 | 3.31 | ||
| 3 | 20 | 800 | 18.2 | 2.79 | ||
| 4 | 20 | 800 | 15.9 | 2.44 |
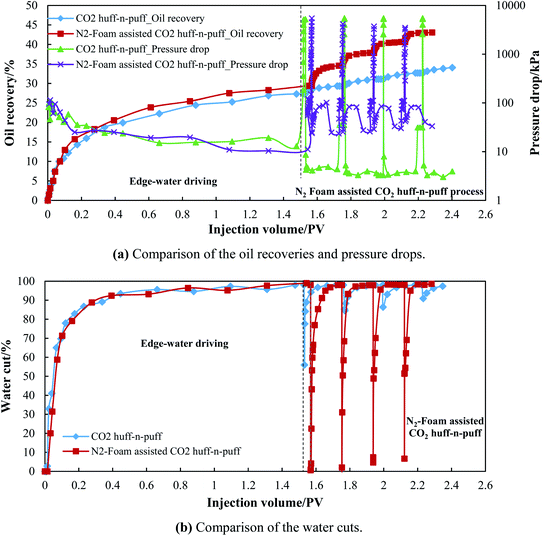
For Scenario 1, four cycles of CO2 huff-n-puff processes were conducted with an injection volume of 900 mL CO2 (under standard conditions) for each cycle. The pressure drop increased from 12.97 kPa to more than 5 MPa after the CO2-injection stage; however, it decreased sharply to less than 5 kPa when P1 was reopened for production (as seen in Fig. 11(a)). The water cut dropped sharply from 98% to 60–90% in the initial stage of production, and then increased rapidly to more than 95% (as seen in Fig. 11(b)). The changes in water cut correspond to the changes in pressure drop. CO2 is expected to extract the oil remaining in the low permeable layer, and it indeed contacted with the oil after a sufficient soaking period. However, since oil and CO2 were produced from P1 quickly in the initial production stage, the edge water flowed back again through the high permeable layer. After water and gas channeling occurred, a portion of CO2 was still trapped in the model, which indicates that the CO2-EOR effect is severely affected by the serious channeling of water and gas. The oil recovery of CO2 injection was just 2.03%, 1.76%, 1.57%, and 1.40% for each cycle, and plugging treatments needed to be conducted to deal with the channeling along the high permeable layer.
For the N2-foam-assisted CO2 huff-n-puff process, 20 mL of foam was pre-injected into the model, followed by 800 mL of CO2, and the oil recovery was 5.15%, 3.31%, 2.79% and 2.44% for each cycle. The oil recovery enhanced by the N2-foam-assisted CO2 huff-n-puff was almost two times that by pure CO2 huff-n-puff. Fig. 11(a) and (b) show a comparison of the pressure drops and the water cuts for Scenario 1 and Scenario 2, respectively. Although a similar pressure drop was achieved after N2-foam-assisted CO2 injection, the pressure drop and the water cut showed a big difference during the production stage. It can be observed that the production stage can be further subdivided into three periods as follows.
(1) An oil and gas production period achieved by N2-foam plugging and CO2 extraction, which is short but very important to the oil increment. During this period, the pressure drop decreased rapidly from 3–5 MPa to less than 35 kPa, and the water cut dropped sharply to nearly zero. Since N2 foam was mostly injected into the high permeable layer, a strong barrier was temporarily built for the channeling of edge water. Then, the injected CO2 could sufficiently contact with the oil remaining in the low permeable zone near the P1 area, where the oil was almost unswept by the edge water. When P1 was reopened for production, this portion of oil was effectively extracted by the produced CO2, and almost no water was produced during this period.
(2) An oil, liquid and gas production period with N2 foam produced from P1 successively. During this period, the pressure drop increased again from less than 35 kPa to more than 80 kPa, and the water cut increased gradually to 95%. Since the barrier in the high permeable layer is broken due to the successive production of N2 and foaming agents, the edge water breakthroughs from P1 again. Oil, liquid and gas are produced simultaneously, and the oil recovery is slightly enhanced during this period.
(3) Edge-water channeling period after N2 foam is displaced from the model. During this period, the pressure drop decreased from more than 80 kPa to less than 35 kPa, and the water cut remained at a high level of 95–98%. Since the barrier was totally destroyed, the edge water channeled again through the high permeable layer, and a low amount of oil was produced during this period. Although a large portion of N2 foam was displaced from the model, a small portion of foaming agent could still remain in the high permeable layer. Consequently, the pressure drop during this period was higher than the pressure drop of the edge-water driving period.
The 3D experiments indicate that N2 foam can be used to assist the CO2 huff-n-puff process. The stable N2 foam can form a strong barrier to temporarily delay water and gas channeling, and subsequently CO2 can fully extract the crude oil remaining in the low permeable zone near the P1 area. The oil recovery enhanced by N2-foam-assisted CO2 huff-n-puff was almost twice that by pure CO2 huff-n-puff.
3.3 Pilot tests of N2-foam-assisted CO2 huff-n-puff
Several pilot tests of N2-foam-assisted CO2 huff-n-puff were conducted in North Gaoqian Block, Jidong Oil Field, China since 2015. Table 7 lists the results for 8 horizontal wells located in this block. After the edge-water driving and CO2 huff-n-puff process, about 400 tons of N2 foam and 200![[thin space (1/6-em)]](https://www.rsc.org/images/entities/char_2009.gif) 000 m3 of CO2 were injected for each well. After an average soaking time of 30 days, the wells were reopened for production. An average oil production of 223 tons was obtained from a single well with an average valid period of 156 days. With the total injection volumes of 3288 tons N2 foam and 1
000 m3 of CO2 were injected for each well. After an average soaking time of 30 days, the wells were reopened for production. An average oil production of 223 tons was obtained from a single well with an average valid period of 156 days. With the total injection volumes of 3288 tons N2 foam and 1![[thin space (1/6-em)]](https://www.rsc.org/images/entities/char_2009.gif) 590
590![[thin space (1/6-em)]](https://www.rsc.org/images/entities/char_2009.gif) 000 m3 CO2, the total oil production of 1784 tons was recovered from the heterogenous reservoir.
000 m3 CO2, the total oil production of 1784 tons was recovered from the heterogenous reservoir.
| No. | Well no. | Foaming agent/ton | CO2 volume/m3 (SC) | Soaking time/day | Oil production increment/ton | Valid period/day | Net present value (NPV)/$ |
|---|---|---|---|---|---|---|---|
| 1 | G104-5P76 | 320 | 200![[thin space (1/6-em)]](https://www.rsc.org/images/entities/char_2009.gif) 000 000 |
30 | 176 | 127 | 15![[thin space (1/6-em)]](https://www.rsc.org/images/entities/char_2009.gif) 442.74 442.74 |
| 2 | G104-5P77 | 400 | 200![[thin space (1/6-em)]](https://www.rsc.org/images/entities/char_2009.gif) 000 000 |
27 | 249 | 176 | 35![[thin space (1/6-em)]](https://www.rsc.org/images/entities/char_2009.gif) 868.85 868.85 |
| 3 | G104-5P78CP1 | 544 | 200![[thin space (1/6-em)]](https://www.rsc.org/images/entities/char_2009.gif) 000 000 |
32 | 232 | 164 | 24![[thin space (1/6-em)]](https://www.rsc.org/images/entities/char_2009.gif) 460.74 460.74 |
| 4 | G104-5P85 | 404 | 200![[thin space (1/6-em)]](https://www.rsc.org/images/entities/char_2009.gif) 000 000 |
26 | 240 | 138 | 33![[thin space (1/6-em)]](https://www.rsc.org/images/entities/char_2009.gif) 272.99 272.99 |
| 5 | G104-5P97 | 400 | 200![[thin space (1/6-em)]](https://www.rsc.org/images/entities/char_2009.gif) 000 000 |
29 | 283 | 184 | 46![[thin space (1/6-em)]](https://www.rsc.org/images/entities/char_2009.gif) 446.13 446.13 |
| 6 | G104-5P101 | 300 | 160![[thin space (1/6-em)]](https://www.rsc.org/images/entities/char_2009.gif) 000 000 |
40 | 210 | 123 | 33![[thin space (1/6-em)]](https://www.rsc.org/images/entities/char_2009.gif) 522.20 522.20 |
| 7 | G104-5P106CP1 | 540 | 250![[thin space (1/6-em)]](https://www.rsc.org/images/entities/char_2009.gif) 000 000 |
25 | 225 | 163 | 14![[thin space (1/6-em)]](https://www.rsc.org/images/entities/char_2009.gif) 816.73 816.73 |
| 8 | G104-5P116 | 380 | 180![[thin space (1/6-em)]](https://www.rsc.org/images/entities/char_2009.gif) 000 000 |
30 | 169 | 171 | 13![[thin space (1/6-em)]](https://www.rsc.org/images/entities/char_2009.gif) 328.44 328.44 |
| Average | 411 | 198![[thin space (1/6-em)]](https://www.rsc.org/images/entities/char_2009.gif) 750 750 |
30 | 223 | 156 | 27![[thin space (1/6-em)]](https://www.rsc.org/images/entities/char_2009.gif) 049.73 049.73 |
|
| Total | 3288 | 1![[thin space (1/6-em)]](https://www.rsc.org/images/entities/char_2009.gif) 590 590![[thin space (1/6-em)]](https://www.rsc.org/images/entities/char_2009.gif) 000 000 |
— | 1784 | — | 240![[thin space (1/6-em)]](https://www.rsc.org/images/entities/char_2009.gif) 416.26 416.26 |
|
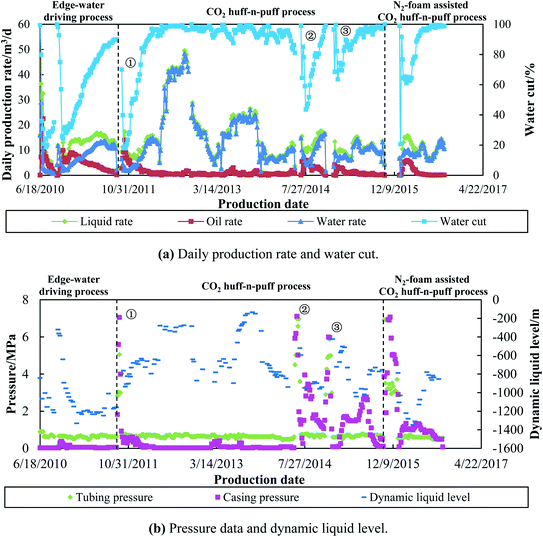
Taking well G104-5P78C1 as a case study, this horizontal well is located near the edge-water aquifer, and was developed by natural energy on June 18, 2010. Although an oil production rate (daily) of 9.89 m3 per day was obtained in the initial period, it decreased rapidly to 1.21 m3 per day after one year of development. The water cut increased sharply to 90.11% due to the severe edge-water channeling, as shown in Fig. 12(a). Then, three cycles of CO2 huff-n-puff processes were conducted in this well for enhanced oil recovery. Specifically, 150![[thin space (1/6-em)]](https://www.rsc.org/images/entities/char_2009.gif) 000 m3 of CO2 was injected into the formation for each cycle, and a total oil production of 862 tons was obtained after three cycles of CO2 injection. Since CO2 was injected when the water cut reached 90.11%, a portion of oil was unswept by the edge water, and still remained in both the high and low permeable zones. The CO2 huff-n-puff process could effectively reduce the water cut and enhance the oil recovery in the 1st cycle. However, the EOR effects using CO2 injection were weakened in the 2nd and 3rd cycles, and operations need to be done to treat the heterogeneity of the reservoir.
000 m3 of CO2 was injected into the formation for each cycle, and a total oil production of 862 tons was obtained after three cycles of CO2 injection. Since CO2 was injected when the water cut reached 90.11%, a portion of oil was unswept by the edge water, and still remained in both the high and low permeable zones. The CO2 huff-n-puff process could effectively reduce the water cut and enhance the oil recovery in the 1st cycle. However, the EOR effects using CO2 injection were weakened in the 2nd and 3rd cycles, and operations need to be done to treat the heterogeneity of the reservoir.
Then, 544 m3 of N2 foam and 200![[thin space (1/6-em)]](https://www.rsc.org/images/entities/char_2009.gif) 000 m3 of CO2 were injected into this well on Oct 14, 2015. After 32 days of soaking time, the well was reopened for production. The water cut dropped sharply from 100% to 20.47%, and the daily oil rate increased to 5.43 m3 per day in the initial production stage. The oil rate remained at 4–5 m3 per day, and the water cut remained between 60–65% for more than a month, which indicates that the high permeable zones were temporarily plugged by the N2 foam. After production for 164 days, 232 tons of crude oil was recovered using the N2-foam-assisted CO2 huff-n-puff process.
000 m3 of CO2 were injected into this well on Oct 14, 2015. After 32 days of soaking time, the well was reopened for production. The water cut dropped sharply from 100% to 20.47%, and the daily oil rate increased to 5.43 m3 per day in the initial production stage. The oil rate remained at 4–5 m3 per day, and the water cut remained between 60–65% for more than a month, which indicates that the high permeable zones were temporarily plugged by the N2 foam. After production for 164 days, 232 tons of crude oil was recovered using the N2-foam-assisted CO2 huff-n-puff process.
Fig. 12(b) shows the pressure data and dynamic liquid level for well G104-5P78C1. The tubing and casing pressure remained at less than 1 MPa during the edge-water driving period. During the 1st cycle of CO2 injection, the tubing and casing pressure increased to 5 MPa and 7 MPa, respectively, and then dropped rapidly to less than 1 MPa again. For the 2nd and 3rd cycles of CO2 injection, the casing pressure increased to more than 6 MPa, and then slowly dropped to 1 MPa. This indicates that the formation energy was supplied by the injected gas, and the oil was displaced from the well by dissolved CO2 continuously. After N2 foam and CO2 were injected, the casing pressure increased to 7.06 MPa, and then dropped to 1 MPa when the well was reopened for production. The casing pressure remained at 1–1.5 MPa for more than 150 days, which also indicates that temporary plugging of water and gas channeling occurred by the N2-foam injection. The dynamic liquid level (DLL) is an index that can be used to reflect the channeling phenomenon. A higher DLL value means a more serious channeling. The DLL value was about −1200 m during the edge-water driving period, and then increased gradually to −800 m after three cycles of the CO2 huff-n-puff process. This high value of DLL was induced by the serious channeling along the high permeable zones. However, after the high permeable zones were plugged by N2-foam, the DLL value returned to the initial liquid level of −1200 m. The oil was enhanced, and the water cut was reduced correspondingly.
The production performance of well G104-5P78C1 is highly consistent with the performance observed in the 3D experiments. For the CO2 huff-n-puff experiments conducted in Scenario 1, it can be observed that with an increase in gas cycling, the oil recovery enhanced by CO2 injection decreased from 2.03% (1st cycle) to 1.40% (4th cycle), and the lowest water cut achieved by CO2 injection also increased gradually from 55.97% (1st cycle) to 90.96% (4th cycle). Similar observations were also found during the CO2 huff-n-puff processes performed in well G104-5P78C1. The oil production obtained by CO2 injections was 433 tons, 252 tons and 176 tons for the 1st, 2nd and 3rd cycles, and the lowest water cut was 18.02%, 43.60% and 63.66%, respectively. It can be predicted that if a 4th cycle of pure CO2 huff-n-puff is conducted, the oil production would be less than 176 tons, and the lowest water cut would be higher than 63.66%. However, when a cycle of N2-foam assisted CO2 injection was performed after pure CO2 huff-n-puff, the oil increment was 232 tons, which is even higher than that obtained in the 3rd cycle of pure CO2 injection. The water cut of the N2-foam-assisted CO2 injection also dropped to as low as 20.67%, and then remained between 60–65% for more than a month. This dramatic oil increment and water control are consistent with the experimental results obtained in Scenario 2, which means that N2-foam-assisted CO2 huff-n-puff is an effective method for enhanced oil recovery in heterogeneous reservoirs. With the assistance of N2-foam injection, the water and gas channeling can be temporarily delayed, and the oil remaining in the low permeable zones can be fully extracted by CO2 huff-n-puff process.
A simplified economic analysis of the N2-foam-assisted CO2 huff-n-puff process was performed by considering the income of the produced oil and the costs of the injected water, gas and foaming agent. Bouquet et al. proposed an economic evaluation of the EOR process using foam and CO2, where operation expenditures (OPEX) are mainly calculated, and capital expenditures (CAPEX) are not considered.50 The economics was quantified with the cash flow (CF), which is the difference between income and cost per month:
| CF(n) = πo(Von − Von−1) − [πw(Vwn − Vwn−1) + πg(Vgn − Vgn−1) + πf(Mfn − Mfn−1)] | (1) |
Then, the net present value (NPV) was calculated as the discounted sum of the cash flow, which can be calculated as follows:
 | (2) |
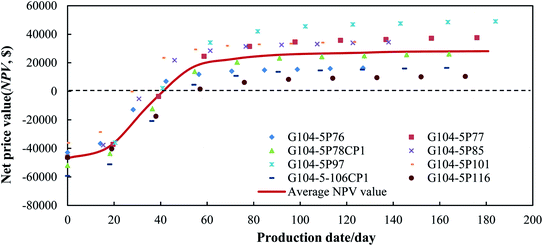
The calculated net present value (NPV) is listed in Table 7 and Fig. 13. After the operation of the N2-foam-assisted CO2 huff-n-puff process, the total NPV value was 240![[thin space (1/6-em)]](https://www.rsc.org/images/entities/char_2009.gif) 416.26$ for 8 horizontal wells. Fig. 12 shows the changes in the NPV values with the production dates. Since all the N2, foaming agent and CO2 were injected before oil production, a one-time investment occurred with the costs of the water, gas and foaming agent. The initial NPV value ranged from −36
416.26$ for 8 horizontal wells. Fig. 12 shows the changes in the NPV values with the production dates. Since all the N2, foaming agent and CO2 were injected before oil production, a one-time investment occurred with the costs of the water, gas and foaming agent. The initial NPV value ranged from −36![[thin space (1/6-em)]](https://www.rsc.org/images/entities/char_2009.gif) 102.74$ to −59
102.74$ to −59![[thin space (1/6-em)]](https://www.rsc.org/images/entities/char_2009.gif) 284.94$ with an average value of −46
284.94$ with an average value of −46![[thin space (1/6-em)]](https://www.rsc.org/images/entities/char_2009.gif) 901.15$. The NPV value increased gradually with the oil production, and then reached a breakeven point (BEP) at around 45 days of oil production, where the incomes just covered the costs. The average oil increment at the BEP point was 150 m3 for a single well, then the produced oil brought net profits in the following production dates. At the end of the cycling process, the NPV value ranged from 10
901.15$. The NPV value increased gradually with the oil production, and then reached a breakeven point (BEP) at around 45 days of oil production, where the incomes just covered the costs. The average oil increment at the BEP point was 150 m3 for a single well, then the produced oil brought net profits in the following production dates. At the end of the cycling process, the NPV value ranged from 10![[thin space (1/6-em)]](https://www.rsc.org/images/entities/char_2009.gif) 475.52$ to 49
475.52$ to 49![[thin space (1/6-em)]](https://www.rsc.org/images/entities/char_2009.gif) 565.54$. The average NPV value for a single well was 28
565.54$. The average NPV value for a single well was 28![[thin space (1/6-em)]](https://www.rsc.org/images/entities/char_2009.gif) 145.51$ after cycling, which indicates that the N2-foam-assisted CO2 huff-n-puff process is a profitable technique for enhanced oil recovery in heterogeneous reservoirs with edge water.
145.51$ after cycling, which indicates that the N2-foam-assisted CO2 huff-n-puff process is a profitable technique for enhanced oil recovery in heterogeneous reservoirs with edge water.
4. Conclusions
A stable N2 foam with 0.3 wt% of sodium dodecyl sulfate (SDS) and 0.3 wt% of polyacrylamide (HPAM) as the surfactant and stabilizer, respectively, was screened in the laboratory. The dynamic foam tests showed that an alternation in the N2 and foaming agent with a gas/liquid ratio (GLR) value of 1![[thin space (1/6-em)]](https://www.rsc.org/images/entities/char_2009.gif) :
:![[thin space (1/6-em)]](https://www.rsc.org/images/entities/char_2009.gif) 1 can form a strong barrier for water and gas channeling in porous media. A resistance factor (RF) of 341.98 was obtained in the high permeable layer, and a profile improvement with water and gas diversion was observed using N2-foam plugging. The 3D experimental results showed that the oil recovery enhanced by N2-foam-assisted CO2 huff-n-puff was twice that by CO2 huff-n-puff. With a temporarily delay of water and gas channeling achieved by the N2-foam, the oil remaining in the low permeable zones near the production well could be fully extracted by CO2 injection. Pilot tests were conducted in 8 horizontal wells, and a total oil production of 1784 tons with a total net price value (NPV) of 240
1 can form a strong barrier for water and gas channeling in porous media. A resistance factor (RF) of 341.98 was obtained in the high permeable layer, and a profile improvement with water and gas diversion was observed using N2-foam plugging. The 3D experimental results showed that the oil recovery enhanced by N2-foam-assisted CO2 huff-n-puff was twice that by CO2 huff-n-puff. With a temporarily delay of water and gas channeling achieved by the N2-foam, the oil remaining in the low permeable zones near the production well could be fully extracted by CO2 injection. Pilot tests were conducted in 8 horizontal wells, and a total oil production of 1784 tons with a total net price value (NPV) of 240![[thin space (1/6-em)]](https://www.rsc.org/images/entities/char_2009.gif) 416.26$ was obtained using the N2-foam-assisted CO2 huff-n-puff process.
416.26$ was obtained using the N2-foam-assisted CO2 huff-n-puff process.
Conflicts of interest
There are no conflicts to declare.Acknowledgements
The project is supported by China National Major Technology Project (2017ZX05009-004). The authors want to acknowledge all the involved colleagues of China University of Petroleum (Beijing), and Drilling & Production Technology Research Institute, PetroChina Jidong Oilfield Company.References
- H. Zhou, X. Chang, J. Hao and J. Zheng, Development technique and practice of horizontal wells for complex fault-block reservoirs in Jidong Oilfield, SPE International Oil & Gas Conference and Exhibition in China, Beijing, China, 2006 Search PubMed.
- J. Wang, T. Wang, Y. Yu, Z. Chen, Z. Niu and C. Yang, Nitrogen foam anti-edge water-incursion technique for steam huff-puff wells of heavy oil reservoir with edge water, SPE Heavy Oil Conference-Canada, Calgary, Alberta, Canada, 2014 Search PubMed.
- S. Xu, Q. Feng, F. Guo, A. Yan, S. Liu, Y. Tao and X. Chen, Efficient development method for high-viscosity, complex fault-block reservoir, SPE Trinidad and Tobago Section Energy Resources Conference, Port of Spain, Trinidad and Tobago, 2016 Search PubMed.
- Q. Yu, Z. Mu, P. Liu, X. Hu and Y. Li, A new evaluation method for determining reservoir parameters for the development of edge-water-driven oil reservoirs, J. Pet. Sci. Eng., 2018, 175, 255–265 CrossRef.
- Q. Feng, S. Li, Y. Su and X. Han, Analyzing edge water drive laws of offshore heavy oil reservoir with physical experiment and numerical simulation, SPE Energy Resources Conference, Port of Spain, Trinidad and Tobago, 2014 Search PubMed.
- R. Cui, Q. Feng, Z. Li, F. Guo, A. Yan, S. Liu, Y. Tao and X. Chen, Improved oil recovery for the complex fault-block and multilayered reservoir with edge water, SPE Trinidad and Tobago Section Energy Resources Conference, Port of Spain, Trinidad and Tobago, 2016 Search PubMed.
- R. Mendelevitch, The role of CO2-EOR for the development of a CCTS infrastructure in the North Sea Region: a techno-economic model and applications, Int. J. Greenhouse Gas Control, 2014, 20, 132–159 CrossRef CAS.
- Y. Holubnyak, W. Watney, J. Rush, M. Fazelalavi and D. Wreath, Pilot scale CO2 EOR in Mississippian Carbonate Reservoir at Wellington Field in South-central Kansas, Energy Procedia, 2017, 114, 6989–6996 CrossRef CAS.
- E. Lindeberg, A. Grimstad, P. Bergmo, D. Wessel-Berg, M. Torsæter and T. Holt, Large scale tertiary CO2 EOR in mature water flooded Norwegian Oil Field, Energy Procedia, 2017, 114, 7096–7106 CrossRef CAS.
- A. Mathisen and R. Skagestad, Utilization of CO2 from emitters in Poland for CO2-EOR, Energy Procedia, 2017, 114, 6721–6739 CrossRef CAS.
- P. Hosseininoosheri, S. Hosseini, V. Nuñez-López and L. Lake, Impact of field development strategies on CO2 trapping mechanisms in a CO2-EOR field: a case study in the Permian basin (SACROC unit), Int. J. Greenhouse Gas Control, 2018, 72, 92–104 CrossRef CAS.
- R. Thorne, K. Sundseth, E. Bouman, L. Czarnowska and E. Pacyna, Technical and environmental viability of a European CO2 EOR system, Int. J. Greenhouse Gas Control, 2020, 92, 102857 CrossRef CAS.
- S. Seyyedsar, S. Farzaneh and M. Sohrabi, Experimental investigation of tertiary CO2 injection for enhanced heavy oil recovery, J. Nat. Gas Sci. Eng., 2016, 34, 1205–1214 CrossRef CAS.
- S. Seyyedsar and M. Sohrabi, Visualization observation of formation of a new oil phase during immiscible dense CO2 injection in porous media, J. Mol. Liq., 2017, 241, 199–210 CrossRef CAS.
- A. Ahadi and F. Torrabi, Effect of light hydrocarbon solvents on the performance of CO2-based cyclic solvent injection (CSI) in heavy oil systems, J. Pet. Sci. Eng., 2018, 163, 526–537 CrossRef CAS.
- A. Lobanov, K. Shhekoldin, I. Struchkov, M. Zvonkov, M. Hlan, E. Pustova, V. Kovalenko and A. Zolotukhin, Swelling/extraction test of Russian reservoir heavy oil by liquid carbon dioxide, Pet. Explor. Dev., 2018, 45(5), 918–926 CrossRef.
- X. Zhou, Q. Yuan, Z. Rui, H. Wang, J. Feng, L. Zhang and F. Zeng, Feasibility study of CO2 huff‘n’puff process to enhance heavy oil recovery via long core experiments, Appl. Energy, 2019, 236, 526–539 CrossRef CAS.
- F. Torabi, A. Firouz, A. Kavousi and K. Asghari, Comparative evaluation of immiscible, near miscible and miscible CO2 huff-n-puff to enhance oil recovery from a single matrix-fracture system (experimental and simulation studies), Fuel, 2012, 93, 443–453 CrossRef CAS.
- A. Abedini and F. Torabi, Oil recovery performance of immiscible and miscible CO2 huff-and-puff processes, Energy Fuels, 2014, 28(2), 774–784 CrossRef CAS.
- G. Bernard and W. Holm, Effect of foam on permeability of porous media to gas, SPE J., 1964, 4(3), 267–274 Search PubMed.
- G. Bernard and W. Jacobs, Effect of foam on trapped gas saturation and on permeability of porous media to water, SPE J., 1965, 5(4), 295–300 CAS.
- G. Hirasaki and J. Lawson, Mechanisms of foam flow in porous media: apparent viscosity in smooth capillaries, SPE J., 1985, 25(2), 176–190 Search PubMed.
- P. Gauglitz, F. Friedmann, S. Kam and W. Rossen, Foam generation in homogeneous porous media, Chem. Eng. Sci., 2002, 57, 4037–4052 CrossRef CAS.
- A. Kovscek, G. Tang and C. Radke, Verification of roof snap off as a foam-generation mechanism in porous media at steady state, Colloids Surf., A, 2007, 302(1–3), 251–260 CrossRef CAS.
- J. Kim, Y. Dong and W. Rossen, Steady-state flow behavior of CO2 foam, SPE J., 2005, 10(4), 405–415 CrossRef CAS.
- R. Farajzadeh, A. Andrianov and P. Zitha, Investigation of immiscible and miscible foam for enhancing oil recovery, Ind. Eng. Chem. Res., 2009, 49(4), 1910–1919 CrossRef.
- Q. Sun, Z. Li, J. Wang, S. Li, L. Jiang and C. Zhang, Properties of multi-phase foam and its flow behavior in porous media, RSC Adv., 2015, 5, 67676–67689 RSC.
- S. Shi, Y. Wang, Z. Li, M. Ding and W. Chen, Experimental study on stability and improving sweep efficiency with microfoam in heterogeneous porous media, J. Dispersion Sci. Technol., 2016, 37, 1152–1159 CrossRef.
- L. Sun, P. Wei, W. Pu, B. Wang, Y. Wu and T. Tan, The oil recovery enhancement by nitrogen foam in high-temperature and high-salinity environments, J. Pet. Sci. Eng., 2016, 147, 485–494 CrossRef CAS.
- A. Haugen, N. Mani, S. Svenningsen, B. Brattekas, A. Graue, G. Ersland and M. Ferno, Miscible and immiscible foam injection for mobility control and EOR in fractured oil-wet carbonate rocks, Transp. Porous Media, 2014, 104, 109–131 CrossRef CAS.
- M. Fernø, Ø. Eide, M. Steinsbø, S. Langlo and A. Graue, Mobility control during CO2 EOR in fractured carbonate using foam: laboratory evaluation and numerical simulations, J. Pet. Sci. Eng., 2015, 135, 442–451 CrossRef.
- T. Lu, Z. Li and Y. Zhou, Flow behavior and displacement mechanisms of nanoparticle stabilized foam flooding for enhanced heavy oil recovery, Energies, 2017, 10, 560 CrossRef.
- M. Puerto, G. Hirasaki, C. Miller and J. Barnes, Surfactant systems for EOR in high-temperature, high-salinity environments, SPE J., 2012, 17(1), 11–19 CrossRef CAS.
- A. Das, N. Nguyen, R. Farajzadeh, J. Southwick and Q. Nguyen, Laboratory study of injection strategy for low-tension-gas flooding in high salinity, tight carbonate reservoirs, SPE EOR Conference at Oil and Gas West Asia, Muscat, Oman, 2018 Search PubMed.
- L. Sun, B. Bai, B. Wei, W. Pu, P. Wei, D. Li and C. Zhang, Recent advances of surfactant-stabilizer N2/CO2 foams in enhanced oil recovery, Fuel, 2019, 241, 83–93 CrossRef CAS.
- P. Liu, L. Shi, P. Liu, L. Li and D. Hua, Experimental study of high-temperature CO2 foam flooding after hot-water injection in developing heavy oil reservoirs, J. Pet. Sci. Eng., 2020, 184, 106597 CrossRef.
- M. Aarra, A. Skauge, J. Solbakken and P. Ormehaug, Properties of N2- and CO2-foams as a function of pressure, J. Pet. Sci. Eng., 2014, 116, 72–80 CrossRef CAS.
- M. Lv, S. Wang, Z. Zhai, X. Luo and Z. Jing, Comparative investigation of the static and dynamic properties of CO2 foam and N2 foam, Can. J. Chem. Eng., 2016, 94, 1313–1321 CrossRef CAS.
- P. Wei, W. Pu, L. Sun, Y. Pu, S. Wang and Z. Fang, Oil recovery enhancement in low permeable and severe heterogenous oil reservoirs via gas and foam flooding, J. Pet. Sci. Eng., 2018, 163, 340–348 CrossRef CAS.
- A. Vikingstad, A. Skauge, H. Harald and M. Aarra, Foam-oil interactions analyzed by static foam tests, Colloids Surf., A, 2005, 260(1–3), 189–198 CrossRef CAS.
- D. Wang, Q. Hou, Y. Luo, Y. Zhu and H. Fan, Blocking ability and flow characteristics of nitrogen foam stabilized with clay particles in porous media, J. Dispersion Sci. Technol., 2015, 36(2), 170–176 CrossRef CAS.
- Z. Wang, G. Ren, J. Yang, Z. Xu and D. Sun, CO2-responsive aqueous foams stabilized by pseudogemini surfactants, J. Colloid Interface Sci., 2019, 5536, 381–388 CrossRef.
- A. Skague, J. Solbakken, P. Ormehaug and M. Aarra, Foam generation, propagation and stability in porous medium, Transp. Porous Media, 2020, 131, 5–21 CrossRef.
- X. Duan, J. Hou, T. Cheng, S. Li and Y. Ma, Evaluation of oil-tolerant foam for enhanced oil recovery: laboratory study of a system of oil-tolerant foaming agents, J. Pet. Sci. Eng., 2014, 122, 428–438 CrossRef CAS.
- P. Zhang, S. Ren, Y. Shan, L. Zhang, Y. Liu, L. Huang and S. Pei, Enhanced stability and high temperature-tolerance of CO2 foam based on a long-chain viscoelastic surfactant for CO2 foam flooding, RSC Adv., 2019, 9(15), 8672–8683 RSC.
- S. Chou, Conditions for generating foam in porous media, SPE Annual Technical Conference and Exhibition, Dallas, Texas, USA, 1991 Search PubMed.
- Z. Pang, H. Liu and L. Zhu, A laboratory study of enhancing heavy oil recovery with steam flooding by adding nitrogen foams, J. Pet. Sci. Eng., 2015, 128, 184–193 CrossRef CAS.
- C. Boeije, M. Bennetzen and W. Rossen, A methodology for screening surfactants for foam enhanced oil recovery in an oil-wet reservoir, SPE Reservoir Eval. Eng., 2017, 20(4), 795–808 CrossRef CAS.
- G. Jian, L. Zhang, C. Da, M. Puerto, K. Johnston, S. Biswal and G. Hirasaki, Evaluating the transport behavior of CO2 foam in the presence of crude oil under high-temperature and high-salinity conditions for carbonate reservoirs, Energy Fuels, 2019, 33, 6038–6047 CrossRef CAS.
- S. Bouquet, F. Douarche, F. Roggero and B. Bourbiaux, Foam processes in naturally fractured carbonated oil-wet reservoirs: technical and economic analysis and optimization, J. Pet. Sci. Eng., 2020, 190, 107111 CrossRef CAS.
| This journal is © The Royal Society of Chemistry 2021 |

