
 Open Access Article
 This Open Access Article is licensed under a Creative Commons Attribution-Non Commercial 3.0 Unported Licence
Influences of a standardized food matrix and gastrointestinal fluids on the physicochemical properties of titanium dioxide nanoparticles
Yan Li *,
Kun Jiang,
Hui Cao,
Min Yuan and
Fei Xu*
*,
Kun Jiang,
Hui Cao,
Min Yuan and
Fei Xu*
School of Medical Instrument and Food Engineering, Shanghai Engineering Research Center for Food Rapid Detection, University of Shanghai for Science and Technology, Shanghai 200093, China. E-mail: usst_liyan@163.com; xufei8135@126.com
First published on 19th March 2021
Abstract
The fast-growing applications of engineered titanium dioxide nanoparticles (e-TiO2-NPs) in the food and pharmaceutical industry in production, packaging, sensors, nutrient delivery systems, and food additives enhance the possibility of oral exposure. Physicochemical transformations may occur when e-TiO2-NPs are incorporated into a food matrix and pass through the human gastrointestinal tract (GIT), which may redefine the toxic effects of the e-TiO2-NPs. In this study, a standardized food model (SFM) and simulated gastrointestinal fluids have been used to study the fate of e-TiO2-NPs following a three-step digestion model in vitro, and a case study was carried out to assess the toxicity of the digested e-TiO2-NPs using an in vitro cellular model. In the absence and presence of the SFM, the transformations of the tristimulus color coordinates, size, agglomeration state, surface charge and solubility of the e-TiO2-NPs in the salivary, gastric and intestinal digestion fluids were compared with those before digestion. The results demonstrate that the presence of the SFM impacted the physicochemical properties of the e-TiO2-NPs significantly. The SFM stabilized the e-TiO2-NP suspensions and acted as a dispersant during each digestive phase. The e-TiO2-NPs showed differentiated transformations of their physicochemical properties after each step of the digestive process. The pH shifts and variable concentrations of enzymes and salts in gastrointestinal fluids induced the transformations of the physicochemical properties of the e-TiO2-NPs. The transformed e-TiO2-NPs could release titanium ion in the gastrointestinal tract. Also, the cell viability induced by e-TiO2-NPs was found to be strongly affected by the presence of the SFM and simulated human GIT fluids. It can be concluded that the physicochemical transformations of the e-TiO2-NPs that were found when they were incorporated into an SFM and passed through the GIT consequently strongly affected the biological effects of the e-TiO2-NPs, which highlights that the toxicity assessment of ingested NPs should use appropriate standardized food models and take realistic physiological conditions into account.
Introduction
Presently, nanoscale structure materials exhibiting unique physicochemical properties are increasingly being incorporated into commercial food and pharmaceutical products for the purposes of improving the properties of the products, including visual presentation, product quality, food shelf life, safety, and nutritional absorption.1–6 Addition of nanoparticles (NPs) to food and pharmaceutical products enhances the possibility of oral exposure. After being ingested, NPs will pass through the human gastrointestinal tract (GIT) before being absorbed and entering the circulatory system (e.g., mouth, esophagus, stomach, small intestine, and large intestine).7 The properties of the NPs can be influenced after passing through the GIT, which may redefine the toxic effects of the NPs.8 Therefore, concerns over the potential human health effects of oral exposure to NPs should be carefully assessed further9 to examine not only the characteristics of the material itself, but also the interaction between the material and the real environment medium.Extensive studies have shown that the unique physicochemical properties of NPs may cause adverse health effects both in vitro and in vivo. For instance,10 ZnO NPs could cause slight toxicity to the liver and kidneys in IBD mice. Ag NPs were found to be toxic to different cells depending on their size, morphology, surface chemical, exposure dose and time.11 A 14 day study was carried out by oral gavage administration of Al2O3 and CuO NPs to mature female Wistar albino rats with a dose series of 0, 0.5, 5, and 50 mg per kg b.w. per day; the results showed that Al2O3 and CuO NPs could pass through the intestinal gut wall, enter the bloodstream, accumulate in the liver, and cause some significant alterations in the activities of antioxidant enzymes, which suggests that the antioxidant system of rats suffered after NP administration. In recent studies, transformations of the properties and biological effects of NPs resulting from their interactions with the food matrix and simulated human gastrointestinal fluids have received focus, including NPs with specific food components (protein, sugar, lipids, phytochemicals, mineral), NPs with whole foods (skim milk, coffee mix, sports drink, bread, meat), and NPs with complex food matrices. For instance,12 albumin reduced the hydrodynamic radii and PDI values of titanium dioxide nanoparticles (TiO2 NPs) and increased the colloidal stability of TiO2 NPs as a consequence, while glucose and arsenic(III) resulted in agglomerates.12,13 The UV-Vis absorbance of zinc oxide nanoparticles (ZnO NPs) was increased by the presence of palmitate.14 The stronger dispersion stability of ZnO NPs dispersed in skim milk was compared to those in individual components of skim milk (i.e., casein, lactose, and calcium).15 The hydrodynamic radii and zeta potential values of ZnO NPs decreased in the presence of sugar mixture solutions.16 However, the dissolution of ZnO NPs was not influenced by albumin, glucose honey, or sugar mixture solutions.12,16 In an in vivo study, the oral absorption of silica nanoparticles (SiO2 NPs) by rats was enhanced by the presence of albumin and glucose, probably due to the interactions between the food components and the NPs.17 The solubility of SiO2 NPs dispersed in in vitro simulated gastric fluid and orally administered to rats was not influenced by the presence of albumin or glucose. Gold nanoparticles (Au NPs) aggregated and presented negligible changes in fasted or fed simulated intestinal fluid by DLS and UV-Vis spectrometry analysis.18 Different levels of aggregation and dissolution of silver nanoparticles (Ag NPs) digested in fed and fasted fluids and three GIT fluids were measured by UV-Vis spectroscopy, DLS, TEM, and inductively coupled plasma mass spectrometry (ICP-MS).19 However, high stability of the engineered silver sulfide nanoparticles (e-Ag2S-NPs) was observed after each phase of in vitro digestion.20 As such, knowledge of the processes that influence the fate of NPs with food components/matrices or the GIT digesta is important to better assess the toxicity of NPs following oral exposure.
Engineered titanium dioxide nanoparticles (e-TiO2-NPs) with photocatalytic activity and ultraviolet absorption activity at specific wavelengths are being used increasingly in the food and pharmaceutical industry (i.e., production, packaging, sensors, nutrient delivery systems and food additives).21 As food additives, e-TiO2-NPs are widely present in various food products, including gum, candies, puddings, cheeses, sauces, skimmed milk, ice cream, pastries, dressings and certain powdered foods, with the goal of improving the white color, brightness, and flavor of food products.22,23 This may increase the possibility of exposure to e-TiO2-NPs via human oral routes. Inevitably, humans may be co-exposed to e-TiO2-NPs and food ingredients or matrices. In this study, a standardized food model (SFM) as a food matrix and simulated gastrointestinal fluids have been used to study the fate of e-TiO2-NPs following a three-step digestion model in vitro with the aim to study the physicochemical transformations and toxicity of e-TiO2-NPs when incorporated into a food matrix and passed through the GIT.24 The SFM was established to conform to the dietary habits of Chinese residents based on the compositions and proportions of Chinese dietary reference intakes and Chinese dietary guidelines from the averages for men and women aged 18 years or older to better imitate the intake of e-TiO2-NPs in real life.25 The compositions of the SFM included daily recommended intakes of protein, fat, carbohydrates, dietary fiber, and minerals. To indicate the impact of the food matrix and gastrointestinal effects on the physicochemical properties of the e-TiO2-NPs, the transformations of the tristimulus color coordinates, hydrodynamic size, agglomeration state, UV-Vis spectra, zeta potential, and solubility of the e-TiO2-NPs present in each step suspension were measured using colorimetry, UV-Vis spectroscopy, DLS, TEM-EDX and ICP-AES. Then, a nanotoxicology case study was carried out to assess the toxicity of the digested e-TiO2-NPs using an in vitro cellular model of human colon epithelial Caco-2 cells (ATCC; SCSP-5027). A detailed schematic of the methodology of the study is summarized in Fig. 1.
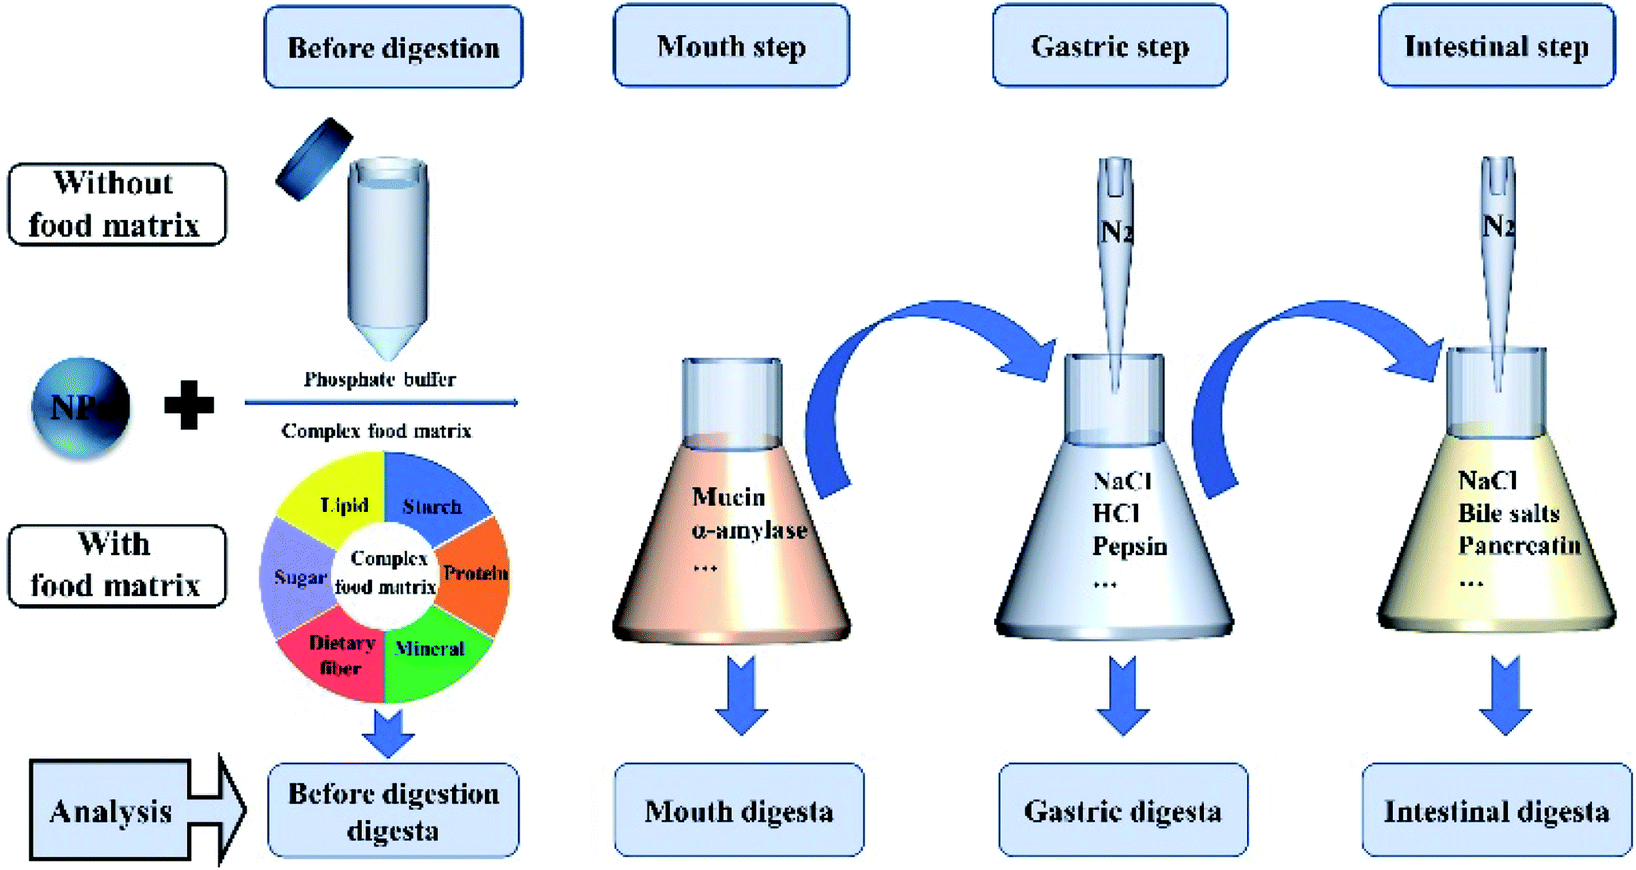 | ||
| Fig. 1 Schematic overview of the in vitro studies of the NPs. | ||
Materials and methods
Materials
Sodium caseinate, corn oil, pectin, sucrose, sodium chloride, and e-TiO2-NPs (25 nm) were purchased from Macklin Biochemical Co. (Shanghai, China). Na2HPO4 and NaH2PO4 were purchased from Sigma-Aldrich (Shanghai, China). Modified starch was obtained from a local food supplier.Preparation of the complex food matrix (SFM)
The nutrient formula of the SFM was established in this study according to the method described by Yan Li et al.,24 and the preparation of the complex food matrix was carried out using procedures described previously.26–29 Sodium caseinate (1% w/w) was dissolved in phosphate buffer solution (10 mM, pH 7.0) with constant stirring until complete dissolution at room temperature. Insoluble powder particles in sodium caseinate solution were removed by sterile filtering before further use (the protein concentration was not considerably changed). Corn oil (3.21% w/w) was then dispersed in sodium caseinate solution with continuous shaking for 10 min. The mixture was homogenized using a high-speed mixer at 16![[thin space (1/6-em)]](https://www.rsc.org/images/entities/char_2009.gif) 000 rpm for 2 min (IKA Instruments, Germany) to prepare a coarse emulsion. A fine emulsion was then prepared by homogenizing the coarse emulsion using a high-pressure homogenizer (APV Instruments, Germany) at an operational pressure of 12000 psi for 3 passes. The SFM was prepared by sequentially and slowly dispersing additional sodium caseinate and other dietary components into the fine emulsion with continual stirring to ensure complete dissolution (fat = 3.21% w/w, protein = 2.89% w/w, pectin = 1.32% w/w, starch = 13.8% w/w, sucrose = 1.44% w/w, sodium chloride = 0.37% w/w).
000 rpm for 2 min (IKA Instruments, Germany) to prepare a coarse emulsion. A fine emulsion was then prepared by homogenizing the coarse emulsion using a high-pressure homogenizer (APV Instruments, Germany) at an operational pressure of 12000 psi for 3 passes. The SFM was prepared by sequentially and slowly dispersing additional sodium caseinate and other dietary components into the fine emulsion with continual stirring to ensure complete dissolution (fat = 3.21% w/w, protein = 2.89% w/w, pectin = 1.32% w/w, starch = 13.8% w/w, sucrose = 1.44% w/w, sodium chloride = 0.37% w/w).
Suspension of e-TiO2-NPs
Engineered TiO2-NPs were suspended in 10 mM phosphate buffer (without food matrix) and the SFM (with food matrix) at 0.5% w/w, 1% w/w and 1.5% w/w, respectively.30 The e-TiO2-NPs were vortexed (30 s) and then sonicated for 10 s before mixing according to the method described previously.In vitro digestion model
Engineered TiO2-NPs suspensions without or with the presence of the food matrix were exposed to a simulated three-step GIT model, including the mouth, gastric and intestine phase, which was adopted from some previous studies with slight modifications as described below.26,31–34Characterization of the engineered TiO2-NPs suspensions
000g for 40 min. Then, the resultant mouth, stomach, and small intestine digesta fluids were first centrifuged at 1500g for 5 min to remove the insoluble particles and then centrifuged at 10000g for 40 min to collect the e-TiO2-NPs pellets, followed by TEM imaging. In the presence of the food matrix, briefly, the e-TiO2-NPs suspension before digestion and the digesta fluids from each phase of the simulated human GIT were first centrifuged three times at 2000g for 1 min to remove the insoluble particles. Then, the e-TiO2-NPs pellets collected from centrifugation at 10000g for 1 h were visualized by TEM imaging.000 × g) for 1 h as described for the ICP-AES analysis.Cell culture
Human colon epithelial Caco-2 cells (ATCC; SCSP-5027) were grown in Dulbecco's modified Eagle's medium/high glucose medium (Hyclone, Shanghai, China) supplemented with 10% heat-inactivated fetal bovine serum (Gibco, Shanghai, China), 1% penicillin–streptomycin solution (Hyclone, Shanghai, China) and non-essential amino acids (1/100 dilution of 100× solution, Gibco, Shanghai, China). The seeding density was 1.5 × 10⁴ per well on 96-well plates, and the cells were grown for 24 h before exposure.Cell viability analysis
The resulting digesta from the intestinal phase were mixed with serum-free DMEM media in a ratio of 1:9, added to the Caco-2 cells, and then incubated for 24 h. A Pierce MTS cytotoxicity assay kit (BestBio, Shanghai, China) was used to measure the cell viability at the wavelength of 490 nm, and then the cytotoxicity percentage was calculated.
Data analysis
All results are presented as the mean ± standard deviation (SD) of the triplicates for each prepared sample, and they were analyzed using SPSS software (IBM SPSS Statistics 25, Armonk, NY, USA). One-way analysis of variance (ANOVA) followed by Dunnett's multiple comparison tests were used for the statistical analysis of results. Different letters in the table also indicated significant difference (P < 0.05).Results
Changes of optical properties
The optical properties of the e-TiO2-NPs suspensions (1% w/w) before digestion and after each step (mouth, stomach and small intestine) of the digestive process were determined using an instrumental colorimeter, as shown in Fig. 2. The optical properties of e-TiO2-NPs without the presence of the food matrix were measured as L*, a*, b* = 22.88 ± 0.07, −0.52 ± 0.04, −0.08 ± 0.01, which were obviously changed by the presence of the food matrix to L*, a*, b* = 23.65 ± 0.02, −0.62 ± 0.04, 3.13 ± 0.03, respectively (P < 0.01).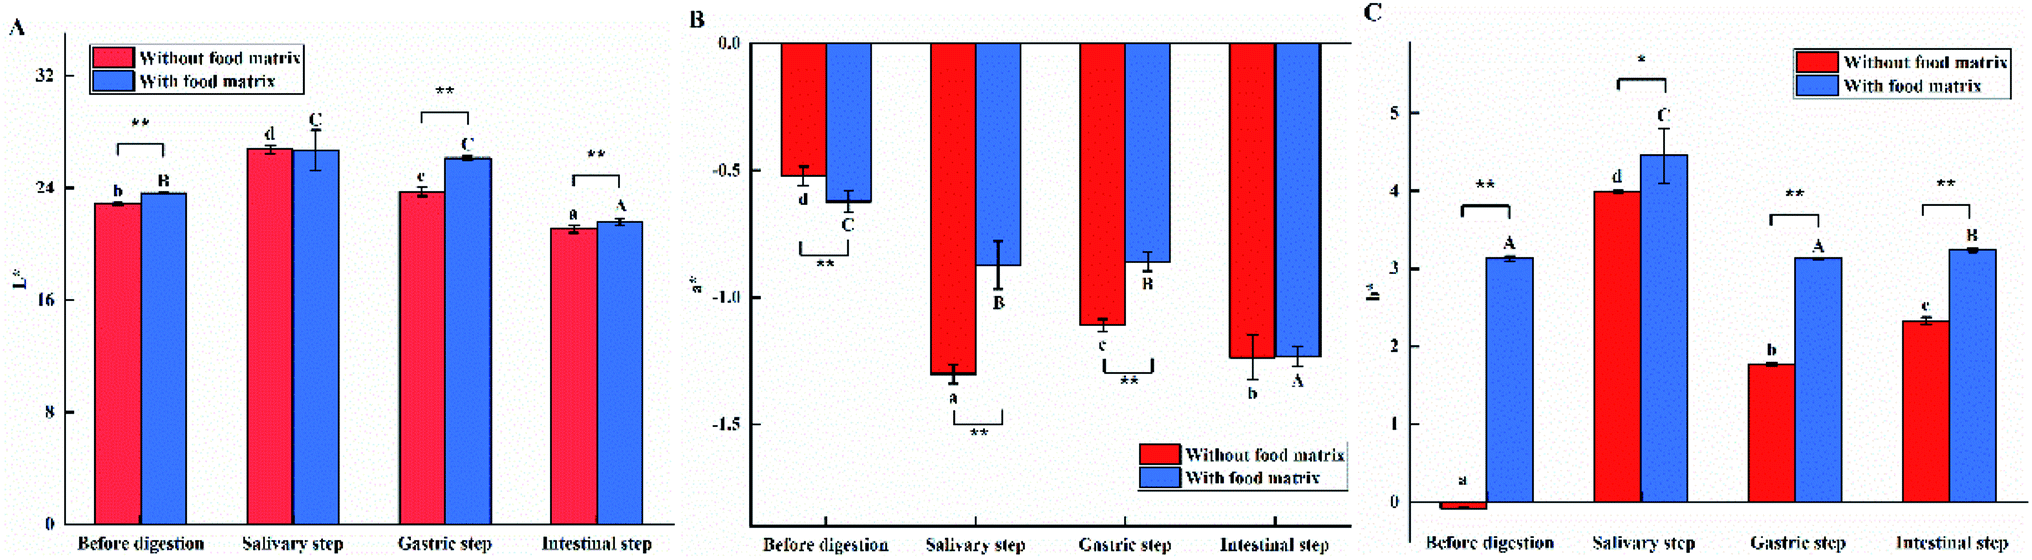 | ||
| Fig. 2 The tristimulus color coordinates (L*, a*, b*) of e-TiO2-NPs suspensions (1% w/w) without or with the presence of the food matrix during each phase of in vitro digestion. The lower-case (a–d) and capital (A–C) letters indicate significant differences between the digestive step in the absence and presence of the food matrix (P < 0.05). * indicates significant differences between the absence and presence of the food matrix for each phase of digestion (*P < 0.05 and **P < 0.01). | ||
Compared to the results obtained before digestion, there was an apparent increase of lightness, green, and yellow of the e-TiO2-NPs suspensions without (L*, a*, b* = 26.77 ± 0.29, −1.30 ± 0.04, 3.40 ± 0.02) and with (L*, a*, b* = 26.71 ± 1.44, −0.87 ± 0.09, 4.45 ± 0.35) the presence of the food matrix. Additionally, the lightness and green of te e-TiO2-NPs suspensions were lower when the food matrix was present during this phase. In contrast, the yellow of the e-TiO2-NPs suspensions was significantly increased in the presence of the food matrix (P < 0.05).
Without (L*, a*, b* = 23.73 ± 0.31, −1.11 ± 0.02, 1.77 ± 0.02) or with (L*, a*, b* = 26.13 ± 0.13, −0.86 ± 0.04, 3.13 ± 0.01) the presence of the food matrix, the color, lightness, green and yellow of the e-TiO2-NPs suspension were higher in the gastric phase than before digestion. Moreover, the colors of the e-TiO2-NPs suspensions in lightness and yellow were more remarkable in the presence of the food matrix than in its absence during this phase (P < 0.01).
The e-TiO2-NPs suspension without or with the presence of the food matrix showed a low level of lightness color (L* = 21.08 ± 0.26 and 21.59 ± 0.22) and a higher level of green or yellow color (a*, b* = −1.24 ± 0.09, 2.33 ± 0.05 and −1.23 ± 0.04, 3.24 ± 0.03) than that before digestion. In addition, significant increases of color in lightness and yellow were found in the presence of the food matrix during the intestinal phase (P < 0.01). A similar tendency was observed at different e-TiO2-NPs concentrations (0.5%, 1%, and 1.5 w/w), as shown in Table 1.
| Food matrix | Digestion step | L* | a* | b* | ||||||
|---|---|---|---|---|---|---|---|---|---|---|
| 0.5% | 1% | 1.5% | 0.5% | 1% | 1.5% | 0.5% | 1% | 1.5% | ||
| a The lower-case (a–d) and capital (A–D) letters indicate significant differences between digestive step in the absence and presence of the food matrix (P < 0.05). * indicates significant differences between the absence and presence of food matrix for each phase of digestion (*P < 0.05 and **P < 0.01). | ||||||||||
| Without | Before digestion | 22.14 ± 0.04c | 22.88 ± 0.07b | 23.65 ± 0.00a | −0.52 ± 0.04d | −0.52 ± 0.04d | −0.47 ± 0.04c | 0.06 ± 0.02a | −0.08 ± 0.01a | 0.45 ± 0.02a |
| Salivary step | 21.97 ± 0.36c | 26.77 ± 0.29d | 30.48 ± 0.33b | −0.99 ± 0.06b | −1.30 ± 0.04a | −1.29 ± 0.03a | 4.06 ± 0.06d | 3.99 ± 0.02d | 4.34 ± 0.13d | |
| Gastric step | 21.43 ± 0.20b | 23.73 ± 0.31c | 36.21 ± 0.31d | −0.88 ± 0.05c | −1.11 ± 0.02c | −1.00 ± 0.04b | 2.35 ± 0.03b | 1.77 ± 0.02b | 1.85 ± 0.02b | |
| Intestinal step | 20.30 ± 0.02a | 21.08 ± 0.26a | 30.96 ± 0.14c | −1.06 ± 0.07a | −1.24 ± 0.09b | −1.29 ± 0.03a | 2.99 ± 0.08c | 2.33 ± 0.05c | 2.52 ± 0.01c | |
| With | Before digestion | 22.96 ± 0.70*C | 23.65 ± 0.02**B | 27.81 ± 0.14**C | −0.65 ± 0.08**C | −0.62 ± 0.04**C | −0.63 ± 0.02**D | 2.81 ± 0.05**A | 3.13 ± 0.03**A | 2.24 ± 0.01**A |
| Salivary step | 23.50 ± 0.04**C | 26.71 ± 1.44C | 29.33 ± 0.05**D | −0.85 ± 0.05**B | −0.87 ± 0.09**B | −0.89 ± 0.04**B | 4.46 ± 0.05**D | 4.45 ± 0.35*C | 4.53 ± 0.02**D | |
| Gastric step | 21.75 ± 0.65B | 26.13 ± 0.13**C | 24.60 ± 0.07**A | −0.70 ± 0.02**C | −0.86 ± 0.04**B | −0.76 ± 0.02**C | 3.13 ± 0.06**B | 3.13 ± 0.01**A | 2.87 ± 0.03**B | |
| Intestinal step | 20.52 ± 0.13**A | 21.59 ± 0.22**A | 25.85 ± 0.13**B | −0.96 ± 0.04*A | −1.23 ± 0.04A | −1.07 ± 0.04**A | 3.87 ± 0.03**C | 3.24 ± 0.03**B | 3.30 ± 0.04**C | |
Changes of hydrodynamic size and PDI
The hydrodynamic sizes and PDIs of the e-TiO2-NPs suspensions (1% w/w) before digestion and after each step (mouth, stomach and small intestine) of the digestive process were determined by dynamic light scattering (DLS) analysis, as shown in Fig. 3.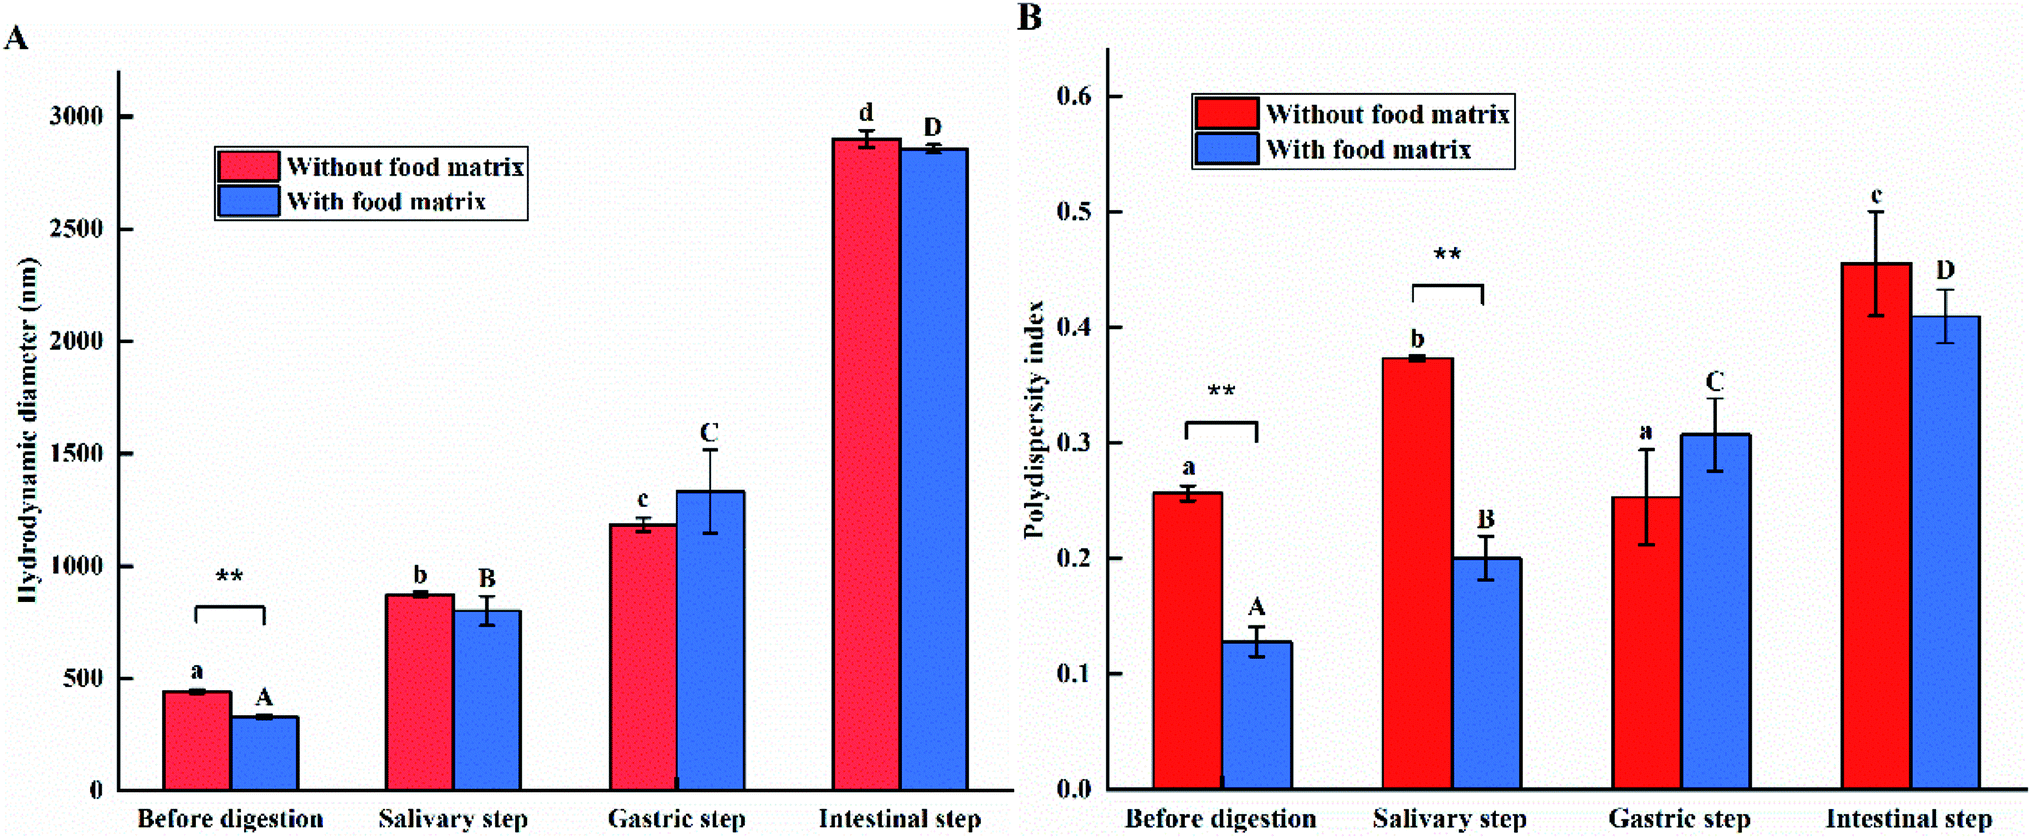 | ||
| Fig. 3 The hydrodynamic diameters (A) and PDIs (B) of e-TiO2-NPs suspensions (1% w/w) without or with the presence of the food matrix during each phase of in vitro digestion. The lower-case (a–d) and capital (A–D) letters indicate significant differences between the digestion step in the absence and presence of the food matrix (P < 0.05). * indicates significant differences between the absence and presence of the food matrix for each phase of digestion (*P < 0.05 and **P < 0.01). | ||
The hydrodynamic diameters of the e-TiO2-NPs dispersed in 10 mM phosphate buffer (442.38 ± 8.72 nm) and the food matrix (328.20 ± 10.96 nm) showed significant differences (P < 0.01). The PDI of the e-TiO2-NPs was measured to be 0.256 ± 0.006, which decreased to 0.128 ± 0.013 in the presence of the food matrix (P < 0.01).
Significant increases of the hydrodynamic size and PDI of the e-TiO2-NPs without or with the food matrix were found after simulating salivary digestion, ranging from 442.38 ± 8.72 to 873.74 ± 11.89 nm, 0.256 ± 0.006 to 0.373 ± 0.002 nm, 328.20 ± 10.96 to 799.75 ± 64.99 nm and 0.128 ± 0.013 to 0.200 ± 0.019 nm, respectively. Additionally, the presence of the food matrix decreased the hydrodynamic size and PDI of the e-TiO2-NPs during the salivary step.
Compared to the results obtained before digestion, the hydrodynamic diameters of the e-TiO2-NPs increased to 1183.42 ± 30.71 nm in the absence of the food matrix and increased to 1330.62 ± 186.115 nm in the presence of the food matrix after simulating gastric digestion. In the absence of the food matrix, the PDI of the e-TiO2-NPs (0.253 ± 0.041) was slightly decreased by the presence of gastric fluids compared to the PDI before digestion. However, in the presence of the food matrix, the e-TiO2-NPs PDI increased significantly, varying from 0.128 ± 0.013 before digestion to 0.307 ± 0.031. In addition, there was an increase of the hydrodynamic size and PDI of the e-TiO2-NPs when the food matrix was present during the gastric phase.
The hydrodynamic size or PDI of the e-TiO2-NPs in the absence and presence of the food matrix was further raised to 2899.95 ± 38.49 nm or 0.455 ± 0.045 and 2856.43 ± 18.22 nm or 0.409 ± 0.023, respectively, during the intestinal phase. Moreover, the presence of the food matrix decreased the hydrodynamic size and PDI of the e-TiO2-NPs during the intestinal step.
A similar tendency was observed at different concentrations of e-TiO2-NPs (0.5%, 1%, and 1.5 w/w), as shown in Fig. 4 and Table 2.
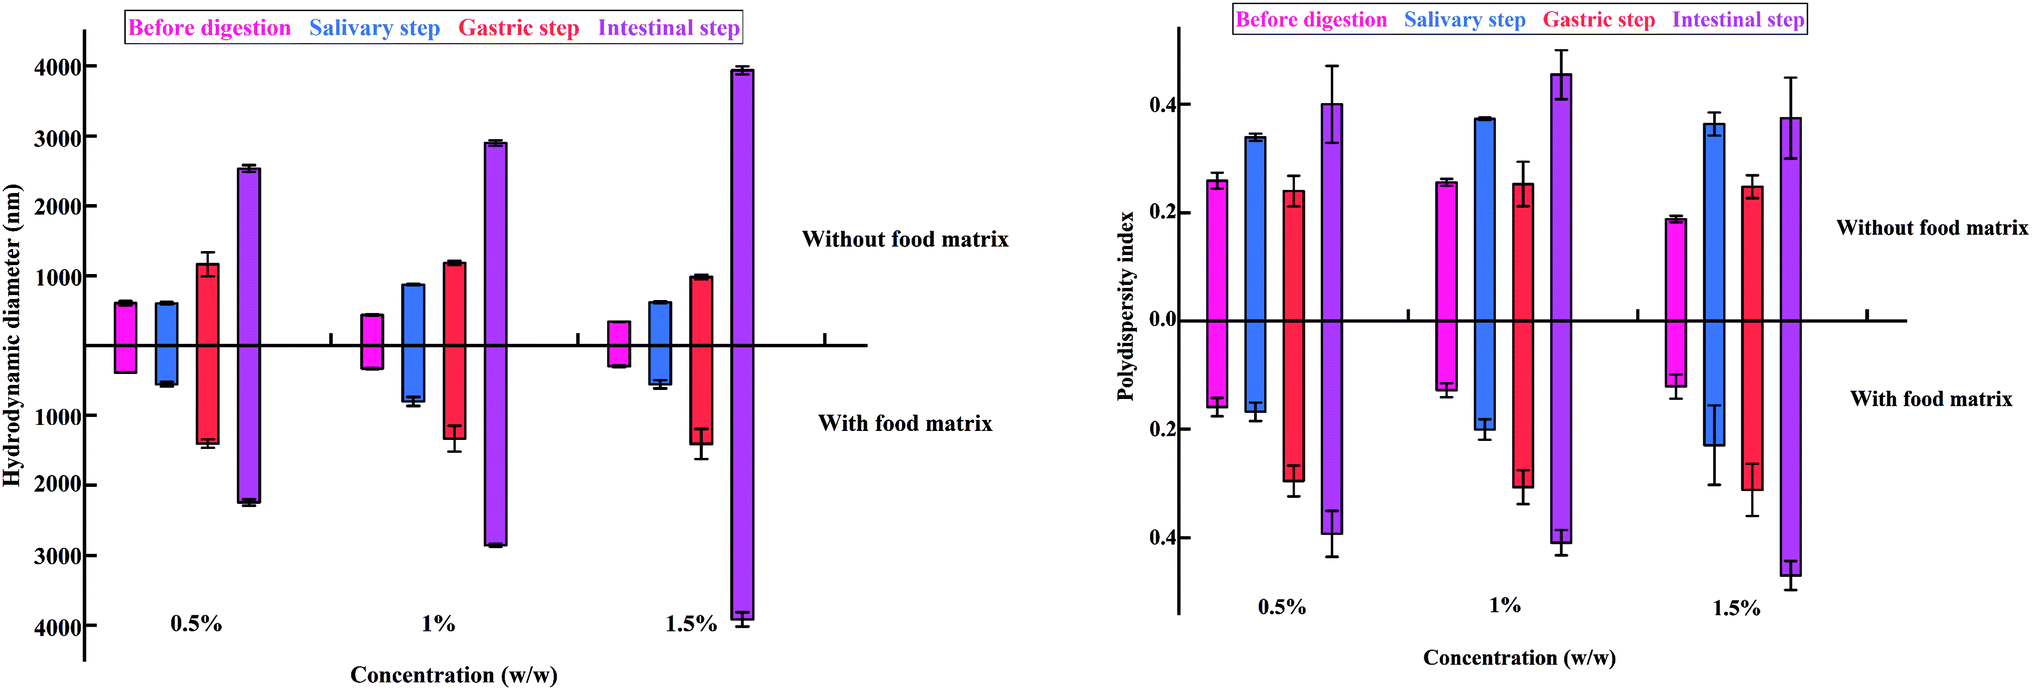 | ||
| Fig. 4 The hydrodynamic diameters (left) and PDIs (right) of e-TiO2-NPs suspensions (0.5%, 1%, and 1.5% w/w) without or with the presence of food matrix during each digestion phase in vitro. The lower-case (a–d) and capital (A–D) letters indicate significant differences between the digestive steps in the absence and presence of the food matrix (P < 0.05). * indicates significant differences between the absence and presence of the food matrix for each phase of digestion (*P < 0.05 and **P < 0.01). | ||
| Food matrix | Digestion step | Hydrodynamic size (nm) | PDI | ||||
|---|---|---|---|---|---|---|---|
| 0.5% | 1% | 1.5% | 0.5% | 1% | 1.5% | ||
| a The lower-case (a–d) and capital (A–D) letters indicate significant differences between digestive step in the absence and presence of the food matrix (P < 0.05). * indicates significant differences between the absence and presence of food matrix for each phase of digestion (*P < 0.05 and **P < 0.01). | |||||||
| Without | Before digestion | 610.41 ± 32.11a | 442.38 ± 8.72a | 344.82 ± 0.92a | 0.26 ± 0.01ab | 0.26 ± 0.01a | 0.19 ± 0.01a |
| Salivary step | 609.35 ± 16.89a | 873.74 ± 11.89b | 622.51 ± 13.18b | 0.34 ± 0.01bc | 0.37 ± 0.00b | 0.36 ± 0.02b | |
| Gastric step | 1164.40 ± 172.43b | 1183.42 ± 30.71c | 983.05 ± 35.80c | 0.24 ± 0.03a | 0.25 ± 0.04a | 0.25 ± 0.02a | |
| Intestinal step | 2534.06 ± 47.55c | 2899.95 ± 38.49d | 3941.63 ± 56.64d | 0.40 ± 0.07c | 0.46 ± 0.05c | 0.37 ± 0.17b | |
| With | Before digestion | 381.53 ± 5.81**A | 328.20 ± 10.96**A | 295.75 ± 13.688**A | 0.16 ± 0.02**A | 0.13 ± 0.01**A | 0.12 ± 0.02**A |
| Salivary step | 554.71 ± 33.85B | 799.75 ± 64.99B | 554.75 ± 59.61B | 0.17 ± 0.02**A | 0.20 ± 0.02**B | 0.23 ± 0.07*B | |
| Gastric step | 1402.19 ± 61.53C | 1330.62 ± 186.12C | 1405.62 ± 215.57C | 0.30 ± 0.03B | 0.31 ± 0.03C | 0.31 ± 0.05B | |
| Intestinal step | 2245.30 ± 46.06**D | 2856.43 ± 18.22D | 3917.38 ± 102.69D | 0.39 ± 0.04C | 0.41 ± 0.02D | 0.47 ± 0.03C | |
Changes in the agglomeration state
The size, shape, and agglomeration state of e-TiO2-NPs (1% w/w) before digestion and after each step of the digestive process were characterized by TEM imaging and are shown in Fig. 5. In the presence of the food matrix before digestion and during the salivary or intestinal step, greater dispersion and smaller agglomeration of the e-TiO2-NPs were observed compared to those in the absence of the food matrix, which is contrary to the results during the gastric step. Contrary to before digestion, agglomeration of the e-TiO2-NPs after each phase of simulated human GIT was observed, either in the absence or presence of the food matrix. Major alterations in the e-TiO2-NPs occurred during the gastric and intestinal phase in both the absence and presence of the food matrix. In the absence of the food matrix, there was a significant increase in the particle size from before digestion to the intestinal phase. A similar tendency was observed in the presence of the food matrix. EDX was used as a semiqualitative method to reveal the elemental composition of the specimens. Ti element was observed in the specimens in great amount, which showed that transformed e-TiO2-NPs could release titanium ion in the gastrointestinal tract (without food matrix: 1.22 ± 0.03 to 0.18 ± 0.05 mg kg−1; with food matrix: 0.42 ± 0.01 to 0.44 ± 0.00 mg kg−1) (Fig. 6).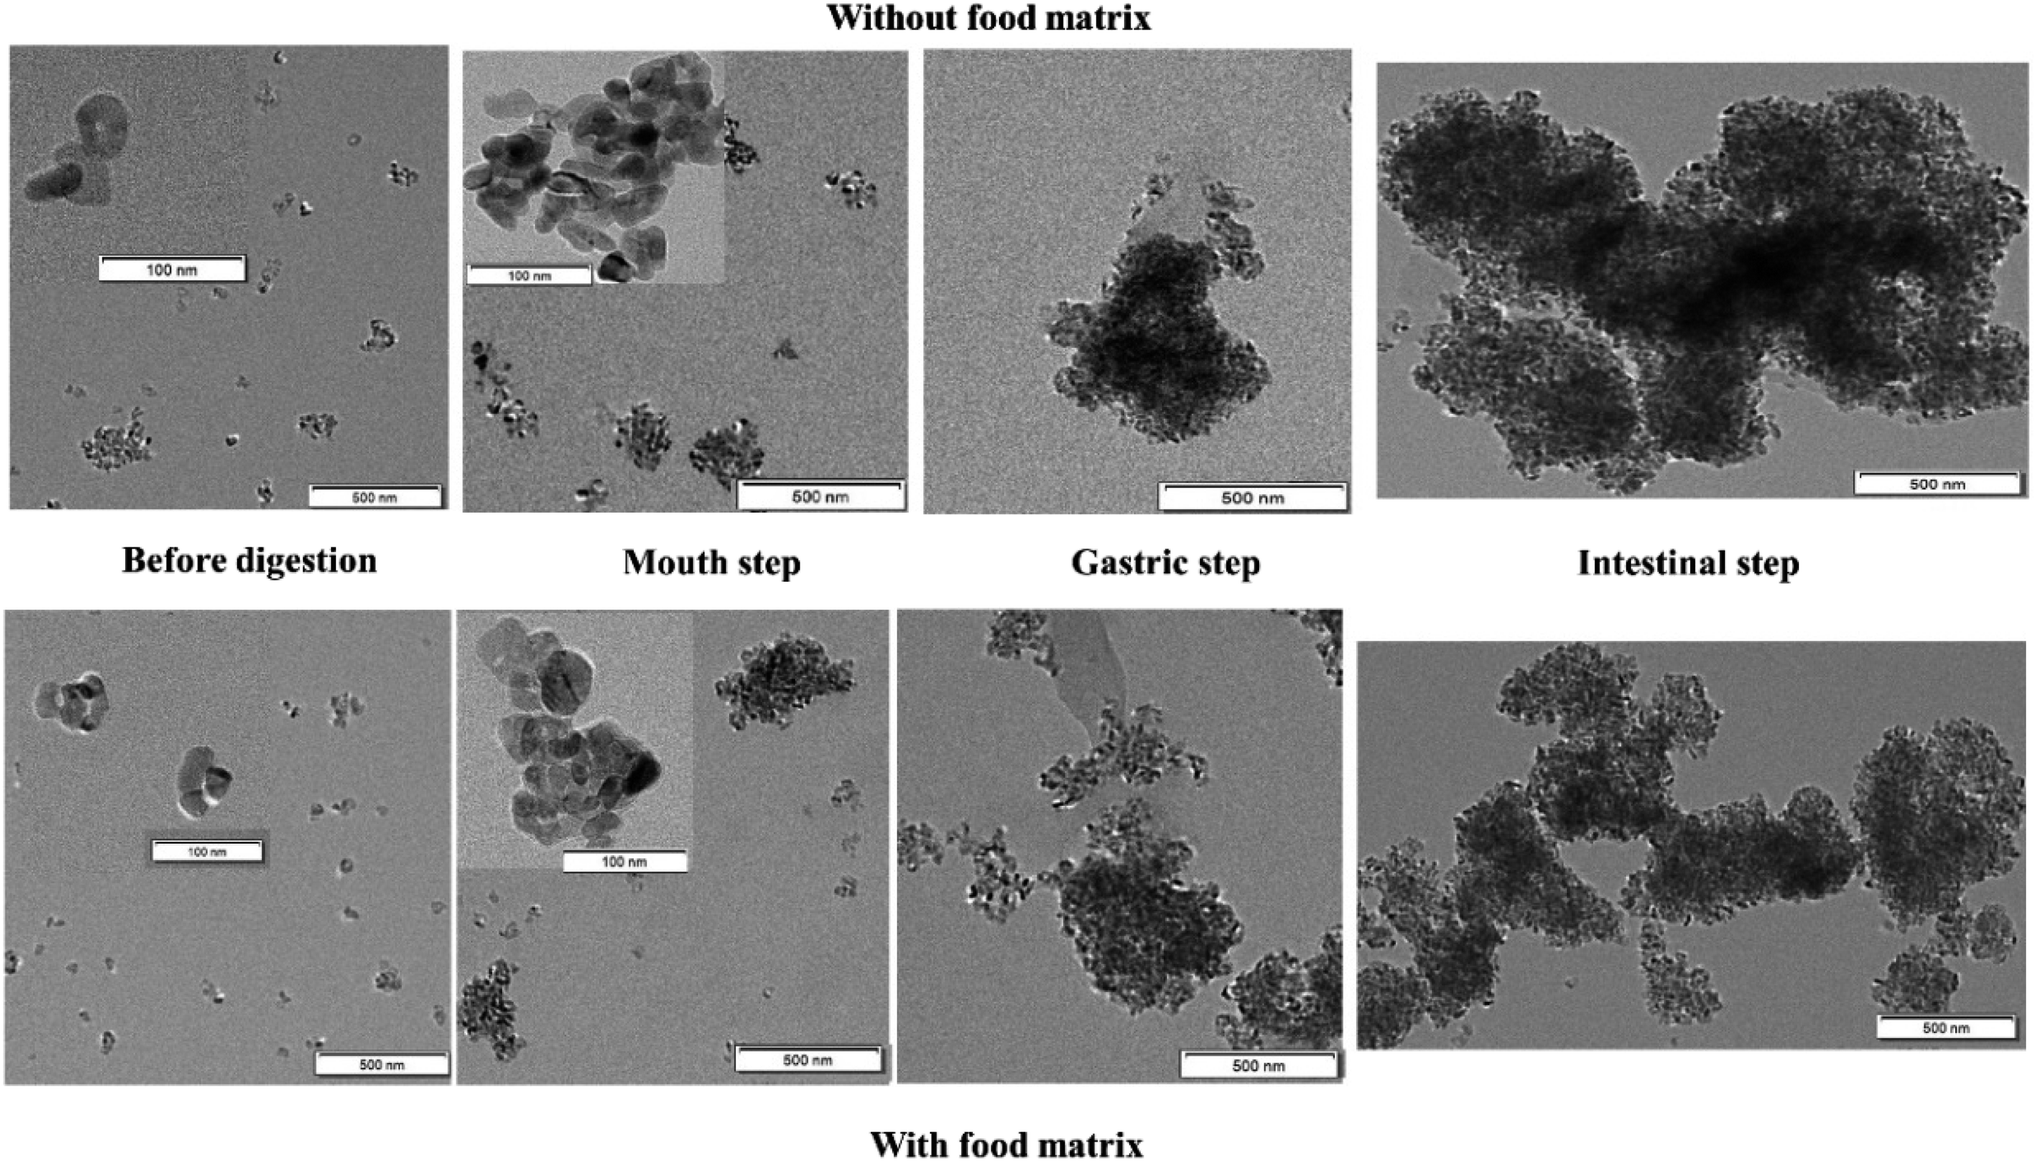 | ||
| Fig. 5 The agglomeration state of e-TiO2-NPs suspensions (1% w/w) without or with the presence of the food matrix during each phase of in vitro digestion. Note: the sizes, shapes, and agglomeration states of the e-TiO2-NPs (1% w/w) before digestion and after each step of the digestive process were characterized by TEM imaging. | ||
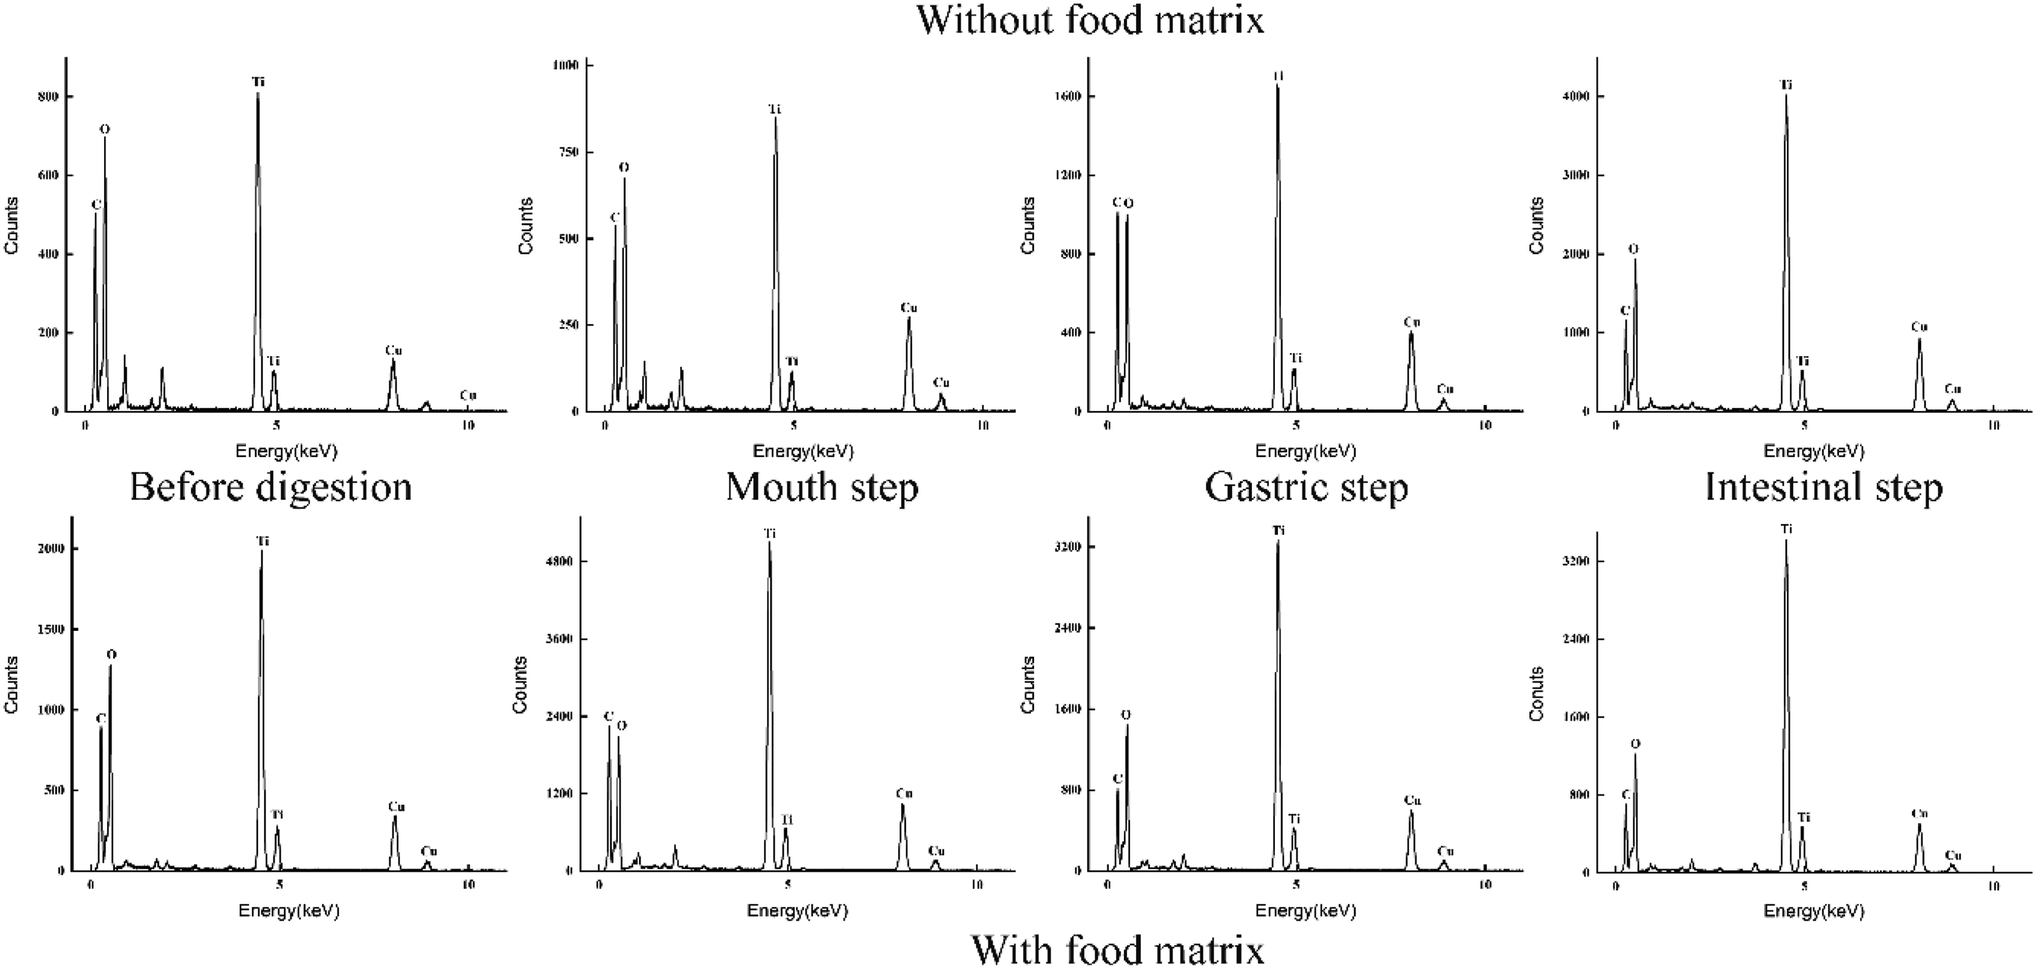 | ||
| Fig. 6 The elemental compositions of the e-TiO2-NPs suspensions (1% w/w) without or with the presence of the food matrix during each digestive phase. Note: a similar tendency was observed in the presence of the food matrix. The EDX technique was used as a semi-qualitative method to reveal the elemental compositions of the specimens. The results show that the presence of Ti element was observed in the specimens in great amounts. | ||
Changes in the zeta potential
The zeta potentials of the e-TiO2-NPs (1% w/w) suspensions are shown in Fig. 7. Before simulating the passage of the e-TiO2-NPs suspension through the GIT, both e-TiO2-NPs suspensions without or with the presence of the complex food matrix were negatively charged, and the zeta potentials greatly increased in the presence of the food matrix (−25.63 ± 1.36) compared to in its absence (−41.86 ± 1.54).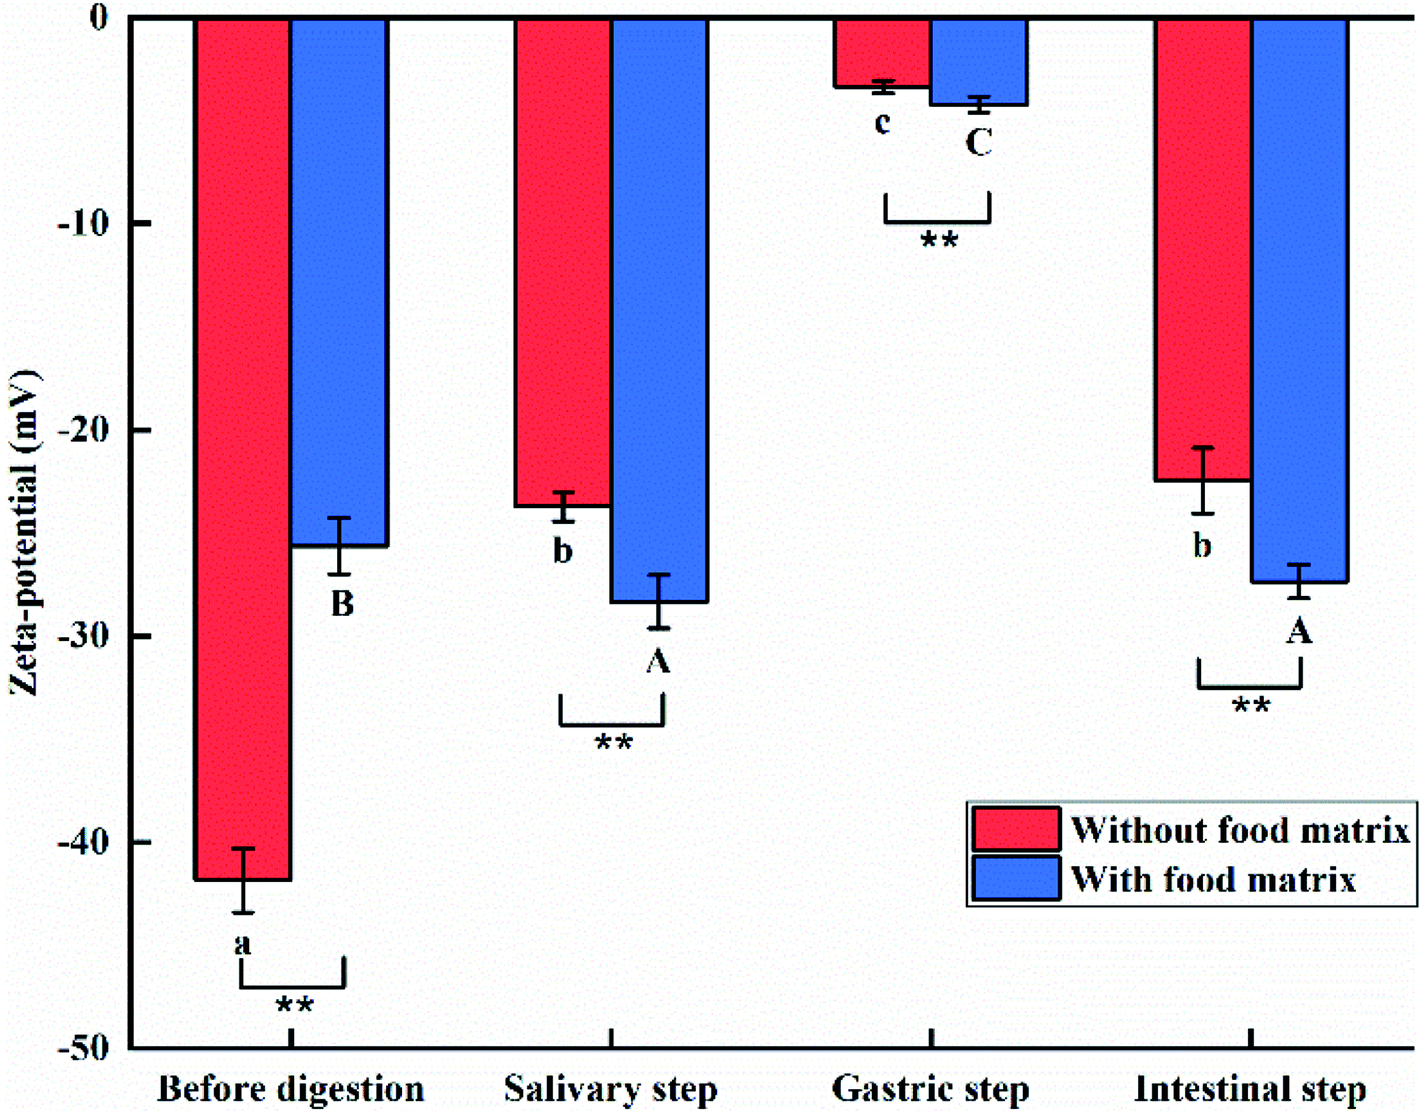 | ||
| Fig. 7 The zeta-potential of the e-TiO2-NPs suspensions (1% w/w) without or with the presence of the food matrix during each phase of in vitro digestion. Note: the lower-case (a–c) and capital (A–C) letters indicate significant differences between the digestive step in the absence and presence of the food matrix (P < 0.05). * indicates significant differences between the absence and presence of the food matrix for each phase of digestion (*P < 0.05 and **P < 0.01). | ||
The zeta potentials of the e-TiO2-NPs without (−23.70 ± 0.71) or with (−28.35 ± 1.29) the presence of the food matrix after the salivary step significantly increased and decreased, respectively. Meanwhile, a significant difference in the zeta potentials of the e-TiO2-NPs was found without and with the presence of the food matrix (P < 0.01).
Compared to the results obtained before digestion, the strongest increases in the zeta potentials of e-TiO2-NPs without (−3.38 ± 0.31) or with (−4.22 ± 0.38) the presence of the food matrix were found after the gastric step. Meanwhile, a significant difference was found between the zeta potentials of the e-TiO2-NPs without and with the presence of the food matrix (P < 0.01).
A similar result was observed during the salivary and intestinal phases. In the absence of the food matrix, the zeta potential of the e-TiO2-NPs was calculated as −22.45 ± 1.59 mV during the intestinal step, which markedly decreased to −27.37 ± 0.83 mV in the presence of the food matrix (P < 0.01).
A similar transformation of the zeta potential of the e-TiO2-NPs at different concentrations (0.5%, 1%, and 1.5% w/w) was found, while slight differences were also observed Fig. 8 and Table 3.
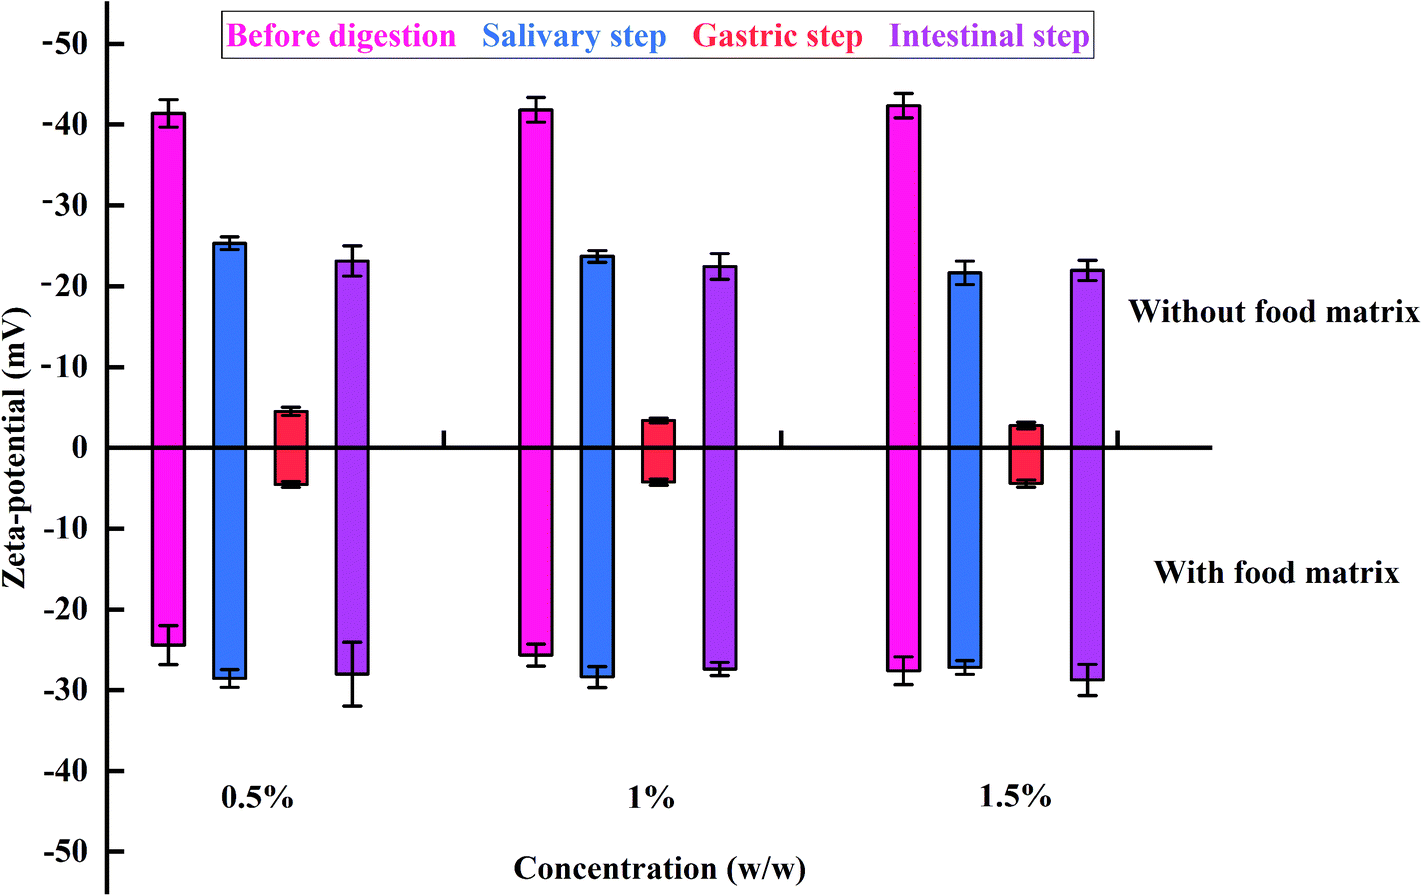 | ||
| Fig. 8 The zeta potentials of e-TiO2-NPs suspensions (0.5%, 1%, and 1.5% w/w) without or with the presence of the food matrix during each phase of in vitro digestion. | ||
| Food matrix | Digestion step | Zeat-potential (mV) | ||
|---|---|---|---|---|
| 0.5% | 1% | 1.5% | ||
| a The lower-case (a–d) and capital (A–C) letters indicate significant differences between digestive step in the absence and presence of the food matrix (P < 0.05). * indicates significant differences between the absence and presence of food matrix for each phase of digestion (*P < 0.05 and **P < 0.01). | ||||
| Without | Before digestion | −41.41 ± 1.72a | −41.86 ± 1.54a | −42.36 ± 1.52a |
| Salivary step | −25.33 ± 0.79b | −23.70 ± 0.71b | −21.68 ± 1.47b | |
| Gastric step | −4.52 ± 0.52d | −3.38 ± 0.31c | −2.78 ± 0.40c | |
| Intestinal step | −23.13 ± 1.87c | −22.45 ± 1.59b | −21.98 ± 1.26b | |
| With | Before digestion | −24.40 ± 2.41**B | −25.63 ± 1.36**B | −27.58 ± 1.72**A |
| Salivary step | −28.53 ± 1.09**A | −28.35 ± 1.29**A | −27.17 ± 0.86**A | |
| Gastric step | −4.52 ± 0.37C | −4.22 ± 0.38**C | −4.39 ± 0.45**B | |
| Intestinal step | −28.00 ± 3.96**A | −27.37 ± 0.83**A | −28.72 ± 1.93**A | |
Changes in the UV-Vis absorption peaks
The surface plasmon resonance (SPR) peaks of the e-TiO2-NPs (1% w/w) with background corrections were monitored by UV-Vis spectroscopy, as shown in Fig. 9. The SPR peak of the e-TiO2-NPs dispersed in phosphate buffer showed a significant blueshift after the addition of e-TiO2-NPs to the food matrix (from 339 to 332 nm). The e-TiO2-NPs suspensions incubated in simulated salivary fluid exhibited a redshift of the SPR peaks from 339 to 340 nm without the food matrix and from 332 to 337 nm with the food matrix. A blueshift of the SPR peaks due to the presence of the food matrix was observed during this phase as well as before digestion. There was a further successive redshift of the SPR peaks of the e-TiO2-NPs in the salivary (from 339 to 512 nm in the absence of the food matrix and from 332 to 563 nm in the presence of the food matrix) and gastric (from 339 to 602 nm in the absence of the food matrix and from 332 to 619 nm in the presence of the food matrix) phases. Additionally, there was a redshift of the e-TiO2-NPs SPR peaks when the food matrix was present during these phases (P < 0.01). A similar tendency was observed for different e-TiO2-NPs concentrations (0.5%, 1%, and 1.5% w/w), as shown in Fig. 10 and Table 4.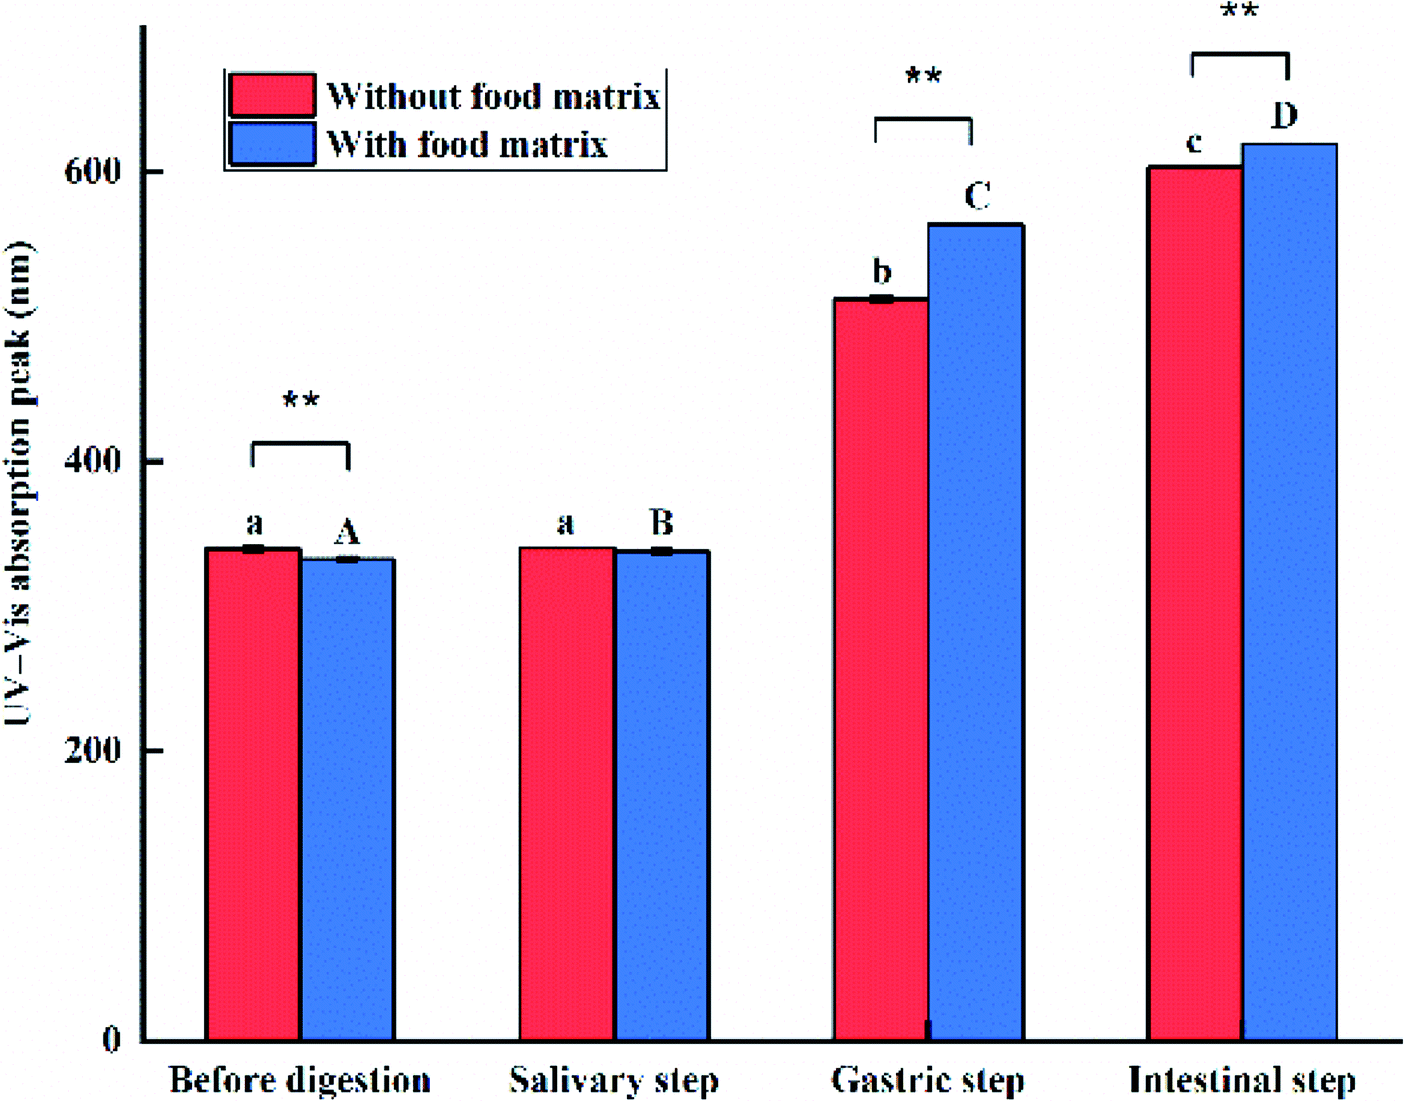 | ||
| Fig. 9 The SPR peaks of e-TiO2-NPs suspensions (1% w/w) without or with the presence of the food matrix during each phase of in vitro digestion. The lower-case (a–c) and capital (A–C) letters indicate significant differences between the digestive step in the absence and presence of the food matrix (P < 0.05). * indicates significant differences between the absence and presence of the food matrix for each phase of digestion (*P < 0.05 and **P < 0.01). | ||
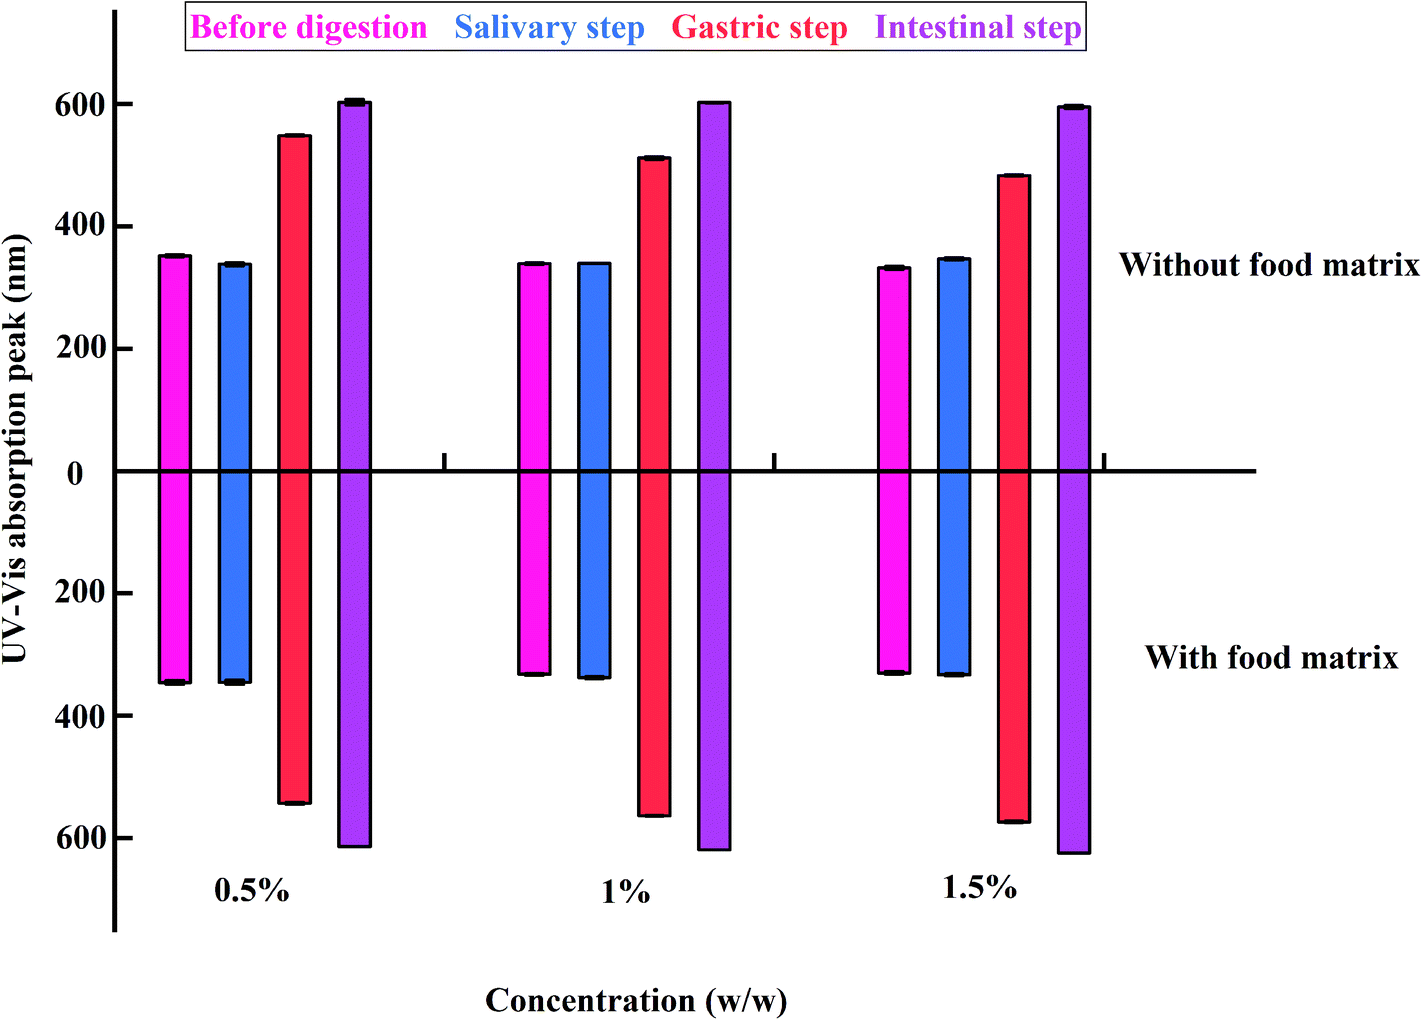 | ||
| Fig. 10 The SPR peaks of e-TiO2-NPs suspensions (0.5%, 1%, and 1.5% w/w) without or with the presence of the food matrix during each phase of in vitro digestion. | ||
| Food matrix | Digestion step | UV-Vis absorption peak | ||
|---|---|---|---|---|
| 0.5% | 1% | 1.5% | ||
| a The lower-case (a–d) and capital (A–D) letters indicate significant differences between digestive step in the absence and presence of the food matrix (P < 0.05). * indicates significant differences between the absence and presence of food matrix for each phase of digestion (*P < 0.05 and **P < 0.01). | ||||
| Without | Before digestion | 352 ± 1.63b | 339 ± 1.49a | 332 ± 2.43a |
| Salivary step | 338 ± 2.43a | 340 ± 0.00a | 347 ± 2.04b | |
| Gastric step | 548 ± 1.15c | 512 ± 2b | 483 ± 1.15c | |
| Intestinal step | 602 ± 4.62d | 602 ± 0.58c | 595 ± 2.31d | |
| With | Before digestion | 345 ± 3.14**A | 332 ± 1.37**A | 330 ± 2.31A |
| Salivary step | 345 ± 3.40*A | 337 ± 1.79B | 333 ± 1.53**A | |
| Gastric step | 543 ± 1.73**B | 563 ± 0.58**C | 573 ± 1.15**B | |
| Intestinal step | 614 ± 0.00*C | 619 ± 0.00**D | 624 ± 0.00**C | |
Changes of solubility
The Ti ion concentrations from the dissolution of the e-TiO2-NPs (1% w/w) were determined by ICP-AES, and the results are shown in Fig. 11.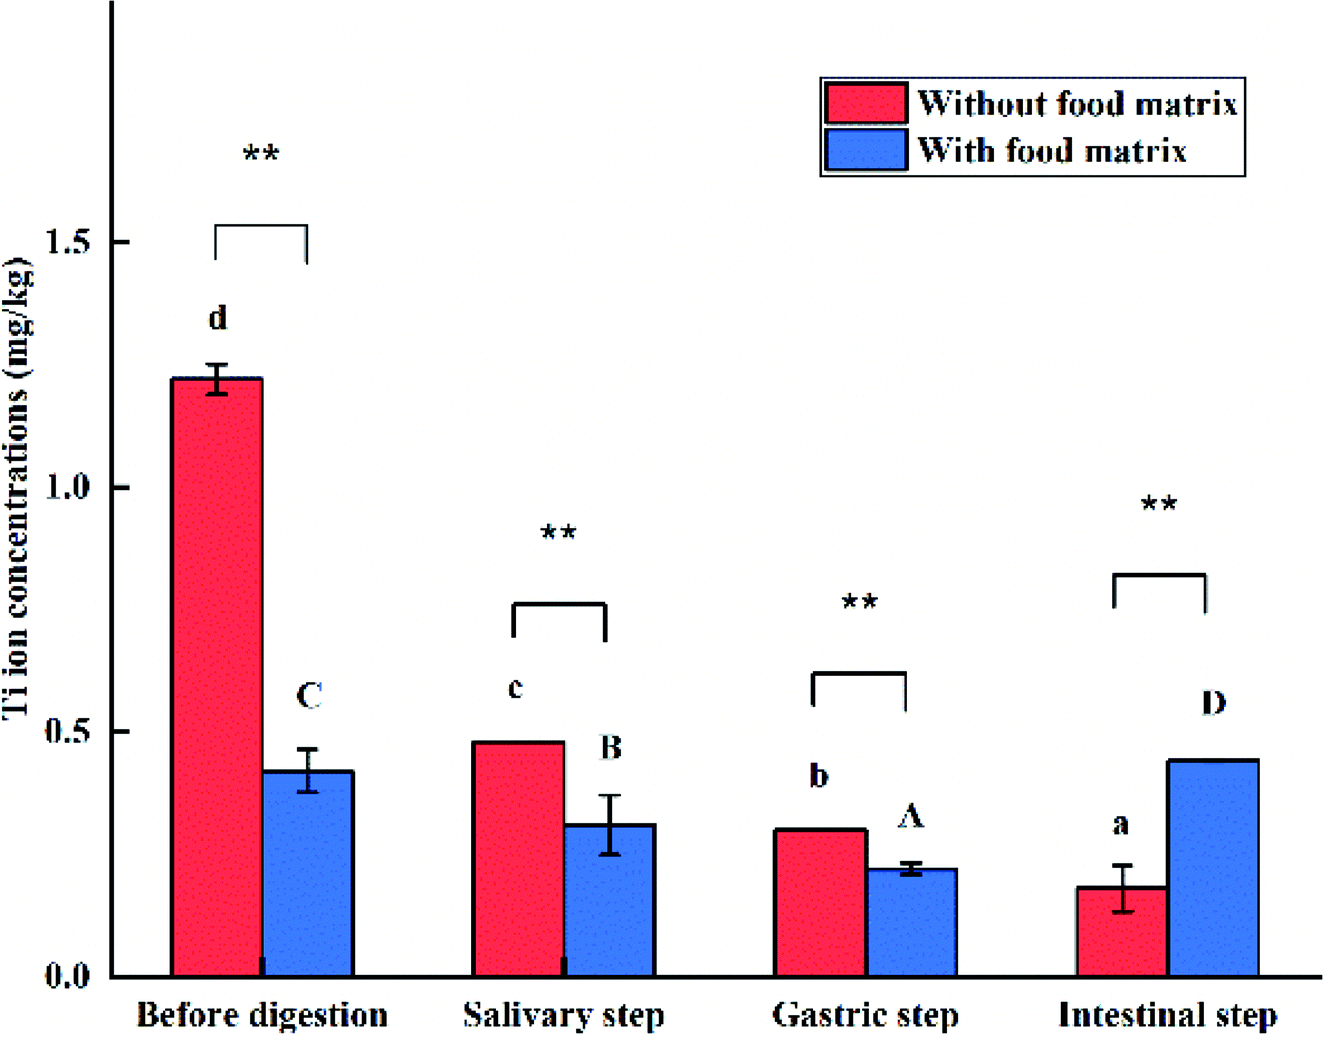 | ||
| Fig. 11 The solubility of e-TiO2-NPs suspensions (1% w/w) without or with the presence of the food matrix during each phase of in vitro digestion. Note: the lower-case (a–d) and capital (A–D) letters indicate significant differences between the digestive steps in the absence and presence of the food matrix (P < 0.05). * indicates significant differences between the absence and presence of the food matrix for each phase of digestion (*P < 0.05 and **P < 0.01). | ||
The Ti ions released from the dissolution of e-TiO2-NPs were measured as 1.22 ± 0.03 mg kg−1, which significantly decreased to 0.42 ± 0.01 mg kg−1 in the presence of the food matrix (P < 0.01).
The solubility of e-TiO2-NPs without or with the presence of the food matrix respectively decreased to 0.48 ± 0.00 and 0.31 ± 0.06 after simulating salivary digestion, which were significantly different from each other (P < 0.01).
The solubility of the e-TiO2-NPs was lower in the gastric phase than before digestion, either in the absence (0.30 ± 0.00) or presence (0.22 ± 0.01) of the food matrix. Moreover, the presence of the food matrix significantly decreased the dissolution of e-TiO2-NPs during this phase (P < 0.01).
Compared to the results obtained before digestion, the largest decrease of the amount of Ti ion released from the e-TiO2-NPs in the simulated intestinal phase was observed when the food matrix was absent (0.18 ± 0.05). An opposite result was observed when the food matrix was present (0.44 ± 0.00) during this phase. Apparently, the presence of the food matrix increased the amount of Ti ions released in the simulated intestinal phase (P < 0.01).
Cell viability analysis
A nanotoxicology case study was carried out to assess the toxicity of the digested e-TiO2-NPs using an in vitro cellular model and Pierce MTS cytotoxicity assay kit to measure cell viability. Higher cell viability of the e-TiO2-NPs digesta in the presence of the food matrix was observed. Meanwhile, the cell viability of the e-TiO2-NPs digesta in the presence of the food matrix was higher than that in its absence for the same dose of e-TiO2-NPs. The cell viabilities of the e-TiO2-NPs suspensions (0.5, 1% and 1.5% w/w) are shown in Fig. 12.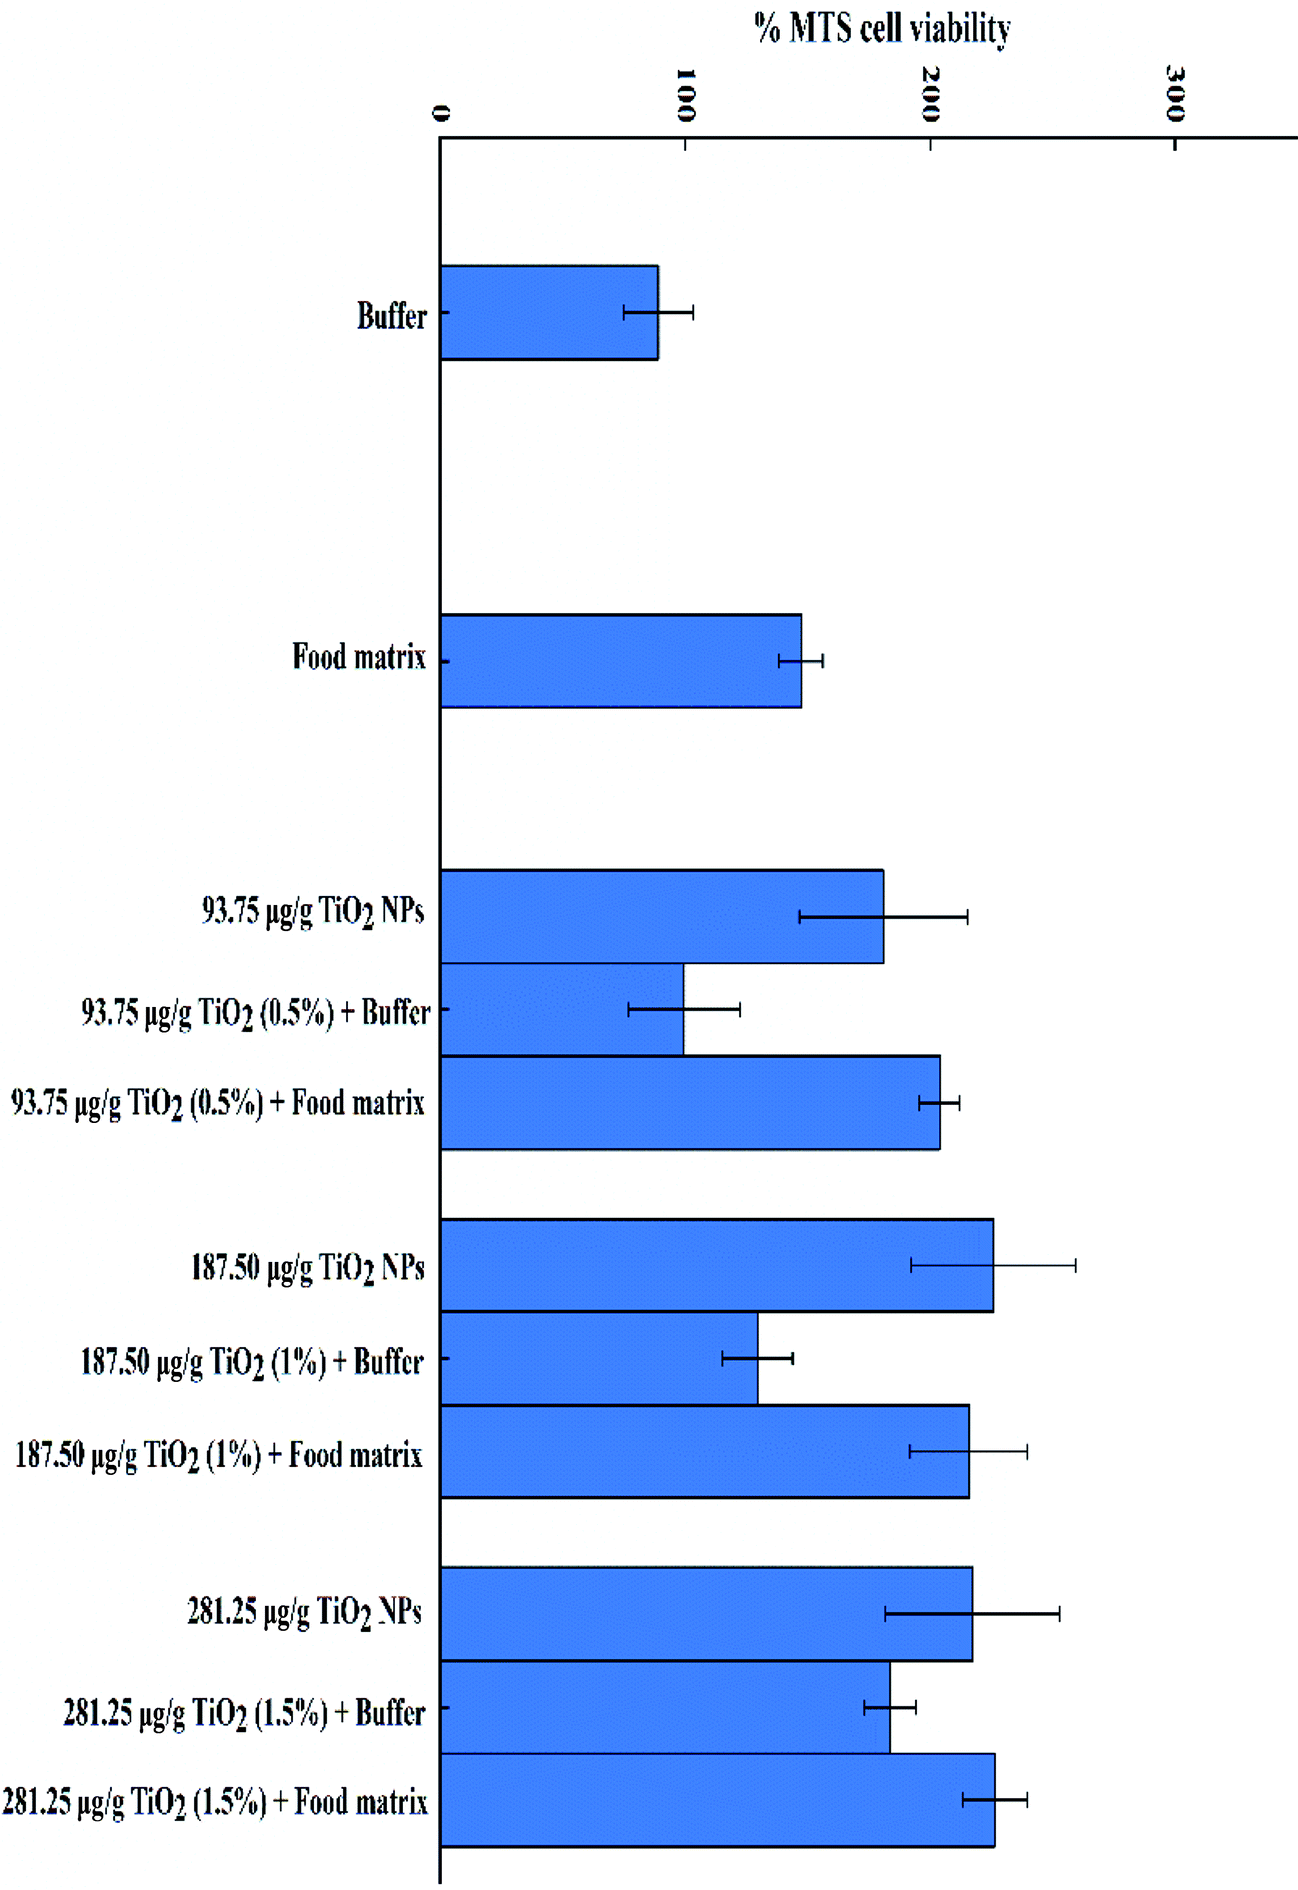 | ||
| Fig. 12 The cell viabilities of e-TiO2-NPs digesta (0.5%, 1% and 1.5% w/w) without (buffer) or with the presence of the food matrix during each phase of in vitro digestion. | ||
Discussion
The present study investigated the influence of a complex food matrix (SFM) and the gastrointestinal tract on physicochemical aspects of e-TiO2-NPs, simulating the real complex, multi-component food digestive system. A variety of analytical techniques, such as colorimetry, UV-Vis spectroscopy, DLS, TEM-EDX and ICP-AES, were used to provide valuable information, including the shapes, sizes, agglomeration states, charges and solubility of the e-TiO2-NPs in the complex food matrix (SFM) and gastrointestinal tract milieu.The optical characterization of the e-TiO2-NPs revealed that the tristimulus colors before digestion and after each step of the digestive process were differently affected in the presence of the food matrix. The results revealed both apparent and different increases of the colors green and yellow in the e-TiO2-NPs suspensions without or with the presence of the food matrix when the e-TiO2-NPs suspensions were passed through each phase of a three-stage simulated digestion process compared to those before digestion. However, the lightness (L*) of the e-TiO2-NPs suspensions without or with the presence of the food matrix appreciably increased during the salivary or gastric step, and the decrease was appreciable during the intestinal step (excepting 1.5 w/w). In addition, the presence of the food matrix could considerably increase the lightness and yellow of the e-TiO2-NPs suspensions, which depend on the concentration and immediate environment of the e-TiO2-NPs.
The DLS data showed that the hydrodynamic sizes of the e-TiO2-NPs were differently agglomerated and aggregated in the absence and presence of the food matrix and then were variously affected during each step of in vitro digestion. The hydrodynamic size of the e-TiO2-NPs increased significantly and gradually as the in vitro digestion steps increased when they were dispersed in phosphate buffer and the food matrix, respectively. Aggregation of the NPs mainly occurred in the GIT. The drop in pH, salt concentration, presence of digestive enzymes during in vitro digestion, hydrophobic interactions, ionic strength and bridging or depletion flocculation could have induced the agglomeration.7,18,35 Moreover, the hydrodynamic size of the e-TiO2-NPs was greater before digestion and after each step of the digestive process, except for the gastric step, in the absence of the food matrix compared to in its presence; this indicates that the complex food matrix (SFM) may contribute to NPs dispersion, which was probably due to the role of multiple food components. For example, the complex protein matrices (skim milk), rather than only one component (i.e., casein, lactose, and calcium), may contribute to the dispersion of the ZnO NPs by repulsive electrostatic forces in the presence of minor minerals and individual amino acids in the complex food matrix.15,36 Another study showed that minor nutrients in honey contribute to agglomeration of NPs.16 Moreover, saccharides and proteins (i.e., acacia honey, fructose, glucose, lactose or albumin), as NP dispersants, contribute to NP dispersion; this is associated with the type and concentration of NPs or the food matrix type and the physicochemical parameters of the surrounding medium used for assessment.12,16,37 Meanwhile, food components or matrices (protein, starch, fat and minerals) are thickening or gelling agents that may change the rheological properties of the gastrointestinal fluid and then change the properties of the nanoparticles in the GIT.38,39 For the PDI, the study results showed that there was both an apparent increase of the PDI of the e-TiO2-NPs without or with the presence of the food matrix when the e-TiO2-NPs suspensions were passed through a three-stage simulated digestion process. In contrast, in the absence of the food matrix, reduced PDI of the e-TiO2-NPs after the gastric step was found compared to before digestion. In addition, the presence of the food matrix decreased the PDI of the e-TiO2-NPs except for in the gastric step.
The size, shape, and agglomeration state of e-TiO2-NPs were clearly demonstrated by TEM-EDX after adding e-TiO2-NPs to phosphate buffer or the food matrix (SFM) and then respectively digesting e-TiO2-NPs in the absence and presence of food matrix in the three GIT fluids to mimic the passage through the human mouth, stomach and small intestine. Higher dispersion before digestion and smaller agglomeration at the salivary and intestinal step were observed in the e-TiO2-NPs dispersed in the food matrix (SFM) relative to in its absence, which suggests that the complex food matrix acts as a dispersant. Meanwhile, the agglomeration state of e-TiO2-NPs during the three GIT fluids showed a similar increased tendency when dispersed in phosphate buffer and the food matrix. The results indicate that the size, shape, and agglomeration state of the e-TiO2-NPs can be affected in the simulated human GIT, which is consistent with the DLS results. Previous studies have reported the aggregation of NPs in the presence of food matrices, and the simulated human GIT and food components may stabilize the NP suspensions.40 Pepsin in gastric fluids could promote the aggregation of Ag NPs by adsorbing on the surface of the nanoparticles.41
The zeta-potential of the e-TiO2-NPs was also found to be strongly affected by the presence of the food matrix (SFM) and the simulated human GIT fluids. The zeta-potentials of the e-TiO2-NPs suspensions were all negative. The gastric step was more effective to reduce the negative zeta-potential of the e-TiO2-NPs in the absence or presence of the food matrix. Moreover, the negative zeta-potential of the e-TiO2-NPs before digestion and after each step of digestive process was found to be strongly affected by the presence of the food matrix (SFM). There was an apparent increase of the negative zeta-potential of the e-TiO2-NPs obtained from each step of the digestive process. In contrast, the decrease of the negative zeta-potential of the e-TiO2-NPs before digestion was obvious in the presence of the food matrix (SFM).
The UV-Vis measurements showed that the SPR peak of e-TiO2-NPs could be affected by the presence of the food matrix and simulated GIT, which is associated with the DLS and TEM-EDX results. Meanwhile, alterations of the SPR peak of the NPs are very likely to reflect changes in the NP surface properties because the SPR peak depends on the surface plasmon resonant frequency.19,42 Both before digestion and after the salivary step, e-TiO2-NPs without the presence of the food matrix showed various degrees of redshift of the SPR peak compared with those in its presence, suggesting greater dispersion of e-TiO2-NPs in the presence of the food matrix, which is contrary to the results obtained in the gastric and intestinal phases. Additionally, continuous redshifts of the SPR peaks of the e-TiO2-NPs with or without the presence of the food matrix after each step of in vitro digestion were found compared to the e-TiO2-NPs suspension before digestion, which suggests that the e-TiO2-NPs incessantly aggregated during these phases, especially the gastric and intestinal phases. Moreover, the formation of biomolecular corona and the increase of the ionic strength may be reasons for the redshift of the SPR peaks of the NPs.19,43
The solubility of the e-TiO2-NPs was also found to be strongly affected by the presence of the food matrix (SFM) and the simulated human GIT fluids. The amount of Ti ion decreased along the successive phases of the simulated human GIT (i.e., mouth > stomach > intestine) in the absence and presence of the food matrix (SFM). Interestingly, in the presence of the food matrix (SFM), moderately high solubility was found during the intestinal step compared with the results obtained before digestion. Meanwhile, the presence of the food matrix (SFM) decreased the dissolution of the e-TiO2-NPs differently, excepting the intestinal step. However, the results from this study showed that less than 0.1% of the e-TiO2-NPs suspensions were dissolved in all cases, in line with previous studies.12 Previous studies showed that the dissolution of NPs in the presence of food components or under physiological conditions can affect their bioavailability or biological fate, as in the cases of ZnO, TiO2 and Ag NPs.8,12,44,45 Therefore, we need to further study the potential toxicity and underlying mechanisms using the food matrix, especially the standardized food model (SFM), and the passage of NPs through the gastrointestinal tract.
A nanotoxicology case study was carried out, and the results showed that the cell viability of the e-TiO2-NPs was also strongly affected by the presence of the food matrix (SFM) and the simulated human GIT fluids. The presence of the food matrix and the simulated human GIT fluids may increase the cell viability of e-TiO2-NPs, which highlights the importance of food matrix effects and GIT effects on the toxicological assessment of nanoparticles.
Conclusion
In this study, a standardized food model (SFM) and simulated gastrointestinal fluids have been used to study the fate of e-TiO2-NPs following a three-step digestion model in vitro. The results evidenced that in the absence and presence of the food matrix (SFM), different levels of transformations of the tristimulus color coordinates, size, agglomeration state, surface charge and solubility of the e-TiO2-NPs during salivary, gastric and intestinal digestion fluids compared to the results obtained before digestion are closely related to the pH shifts and variable concentrations of enzymes and salts. In short, the presence of a food matrix (a standardized food model) significantly impacted the physicochemical properties of the e-TiO2-NPs. Moreover, the e-TiO2-NPs showed differentiated transformations of their physicochemical properties after each step of the digestive process. The pH shifts and variable concentrations of enzymes and salts in gastrointestinal fluids induced the transformations of the physicochemical properties of the e-TiO2-NPs. The food matrix stabilized the e-TiO2-NPs suspensions and acted as dispersants during each digestive phase. Transformed e-TiO2-NPs could release titanium ion in the gastrointestinal tract. The cell viability induced by the e-TiO2-NPs was also found to be strongly affected by the presence of the SFM and the simulated human GIT fluids. It can be concluded that physicochemical transformations of e-TiO2-NPs occurred when they were incorporated into the SFM and passed through the GIT, which consequently strongly affected the biological effects of the e-TiO2-NPs; this highlights that in the toxicity assessment of ingested NPs, an appropriate standardized food model should be used and realistic physiological conditions should be taken into account.Conflicts of interest
There are no conflicts to declare.References
- N. A. Al-Tayyar, A. M. Youssef and R. R. Al-Hindi, Edible coatings and antimicrobial nanoemulsions for enhancing shelf life and reducing foodborne pathogens of fruits and vegetables: a review, Sustainable Mater. Technol., 2020, 26, e00215 CrossRef CAS.
- A. M. Youssef, S. M. El-Sayed, H. S. El-Sayed, H. H. Salama, F. M. Assem and M. H. Abd El-Salam, Novel bionanocomposite materials used for packaging skimmed milk acid coagulated cheese (Karish), Int. J. Biol. Macromol., 2018, 115, 1002–1011 CrossRef CAS PubMed.
- A. M. Youssef, F. M. Assem, H. S. El-Sayed, S. M. El-Sayed, M. Elaaser and M. H. Abd El-Salam, Synthesis and evaluation of eco-friendly carboxymethyl cellulose/polyvinyl alcohol/CuO bionanocomposites and their use in coating processed cheese, RSC Adv., 2020, 10, 37857–37870 RSC.
- N. A. Al-Tayyar, A. M. Youssef and R. R. Al-Hindi, Antimicrobial packaging efficiency of ZnO-SiO2 nanocomposites infused into PVA/CS film for enhancing the shelf life of food products, Food Packag. Shelf Life, 2020, 25, 100523 CrossRef.
- D. J. McClements and H. Xiao, Is nano safe in foods? Establishing the factors impacting the gastrointestinal fate and toxicity of organic and inorganic food-grade nanoparticles, NPJ Sci. Food, 2017, 1, 6 CrossRef PubMed.
- C. Ma, J. C. White, J. Zhao, Q. Zhao and B. s. Xing, Uptake of Engineered Nanoparticles by Food Crops Characterization Mechanisms and Implications, Annu. Rev. Food Sci. Technol., 2018, 129–153 CrossRef CAS PubMed.
- D. J. McClements, H. Xiao and P. Demokritou, Physicochemical and colloidal aspects of food matrix effects on gastrointestinal fate of ingested inorganic nanoparticles, Adv. Colloid Interface Sci., 2017, 246, 165–180 CrossRef CAS PubMed.
- C. Zhang, Y. Li, L. Liu, Y. Gong, Y. Xie and Y. Cao, Chemical Structures of Polyphenols That Critically Influence the Toxicity of ZnO Nanoparticles, J. Agric. Food Chem., 2018, 66, 1714–1722 CrossRef CAS PubMed.
- L. J. Du, K. Xiang and J. H. Liu, et al., Intestinal injury alters tissue distribution and toxicity of ZnO nanoparticles in mice, Toxicol. Lett., 2018, 295, 74–85 CrossRef CAS PubMed.
- E. G. Canli, H. B. Ila and M. Canli, Response of the antioxidant enzymes of rats following oral administration of metal-oxide nanoparticles (Al2O3, CuO, TiO2), Environ. Sci. Pollut. Res., 2019, 26, 938–945 CrossRef CAS PubMed.
- X. Wang, T. Li and X. Su, et al., Genotoxic effects of silver nanoparticles with/without coating in human liver HepG2 cells and in mice, J. Appl. Toxicol., 2019, 39, 908–918 CrossRef CAS PubMed.
- M. R. Jo, J. Yu and H. J. Kim, et al., Titanium Dioxide Nanoparticle-Biomolecule Interactions Influence Oral Absorption, Nanomaterials, 2016, 6, 225 CrossRef PubMed.
- X. Wang, Y. Liu and J. Wang, et al., Amplification of arsenic genotoxicity by TiO2 nanoparticles in mammalian cells: new insights from physicochemical interactions and mitochondria, Nanotoxicology, 2017, 11, 978–995 CrossRef CAS PubMed.
- Y. Gong, L. Liu, J. Li and Y. Cao, The presence of palmitate affected the colloidal stability of ZnO NPs but not the toxicity to Caco-2 cells, J. Nanopart. Res., 2017, 19, 335 CrossRef.
- S. H. Bae, J. Yu, T. G. Lee and S. J. Choi, Protein food matrix(-)ZnO nanoparticle interactions affect protein conformation, but may not be biological responses, Int. J. Mol. Sci., 2018, 19, 3926 CrossRef PubMed.
- M. R. Go, J. Yu, S. H. Bae, H. J. Kim and S. J. Choi, Effects of Interactions between ZnO Nanoparticles and Saccharides on Biological Responses, Int. J. Mol. Sci., 2018, 19, 486 CrossRef PubMed.
- J. A. Lee, M. K. Kim and J. H. Song, et al., Biokinetics of food additive silica nanoparticles and their interactions with food components, Colloids Surf., B, 2017, 150, 384–392 CrossRef CAS PubMed.
- X. Jiang, X. Zhang and P. Gray, et al., Influences of simulated gastrointestinal environment on physicochemical properties of gold nanoparticles and their implications on intestinal epithelial permeability, J. Environ. Sci. Health, Part C: Environ. Carcinog. Ecotoxicol. Rev., 2019, 37, 116–131 CrossRef CAS PubMed.
- W. Wu, R. Zhang, D. J. McClements, B. Chefetz, T. Polubesova and B. Xing, Transformation and Speciation Analysis of Silver Nanoparticles of Dietary Supplement in Simulated Human Gastrointestinal Tract, Environ. Sci. Technol., 2018, 52, 8792–8800 CrossRef CAS PubMed.
- A. U. Khan, Z. Xu and X. Qian, et al., Transformations of Ag2S nanoparticles in simulated human gastrointestinal tract: impacts of the degree and origin of sulfidation, J. Hazard. Mater., 2021, 401, 123406 CrossRef CAS PubMed.
- D. J. McClements, G. DeLoid, G. Pyrgiotakis, J. A. Shatkin, H. Xiao and P. Demokritou, The role of the food matrix and gastrointestinal tract in the assessment of biological properties of ingested engineered nanomaterials (iENMs): state of the science and knowledge gaps, NanoImpact, 2016, 3–4, 47–57 CrossRef PubMed.
- W. Dudefoi, K. Moniz, E. Allen-Vercoe, M. H. Ropers and V. K. Walker, Impact of food grade and nano-TiO2 particles on a human intestinal community, Food Chem. Toxicol., 2017, 106, 242–249 CrossRef CAS PubMed.
- Z. Chen, Y. Wang and L. Zhuo, et al., Effect of titanium dioxide nanoparticles on the cardiovascular system after oral administration, Toxicol. Lett., 2015, 239, 123–130 CrossRef CAS PubMed.
- Y. Li, K. Jiang, H. Cao, M. Yuan, T. Ye and F. Xu, Establishment of a standardized dietary model for nanoparticles oral exposure studies, Food Sci. Nutr., 2021, 9, 1441–1451 CrossRef CAS PubMed.
- Chinese dietary reference intakes and Chinese dietary guidelines, 2017, at available online: http://www.nhc.gov.cn/, accessed on 5 July 2020 Search PubMed.
- Z. Zhang, R. Zhang and H. Xiao, et al., Development of a standardized food model for studying the impact of food matrix effects on the gastrointestinal fate and toxicity of ingested nanomaterials, NanoImpact, 2019, 13, 13–25 CrossRef PubMed.
- Y. T. Hu, Y. Ting, J. Y. Hu and S. C. Hsieh, Techniques and methods to study functional characteristics of emulsion systems, J. Food Drug Anal., 2017, 25, 16–26 CrossRef CAS PubMed.
- C. C. Loi, G. T. Eyres and E. J. Birch, Effect of milk protein composition on physicochemical properties, creaming stability and volatile profile of a protein-stabilised oil-in-water emulsion, Food Res. Int., 2019, 120, 83–91 CrossRef CAS PubMed.
- L. Perugini, G. Cinelli, M. Cofelice, A. Ceglie, F. Lopez and F. Cuomo, Effect of the coexistence of sodium caseinate and Tween 20 as stabilizers of food emulsions at acidic pH, Colloids Surf., B, 2018, 168, 163–168 CrossRef CAS PubMed.
- G. M. DeLoid, Y. Wang and K. Kapronezai, et al., An integrated methodology for assessing the impact of food matrix and gastrointestinal effects on the biokinetics and cellular toxicity of ingested engineered nanomaterials, Part. Fibre Toxicol., 2017, 14, 40 CrossRef PubMed.
- R. Zhang, Z. Zhang, H. Zhang, E. A. Decker and D. J. McClements, Influence of lipid type on gastrointestinal fate of oil-in-water emulsions: in vitro digestion study, Food Res. Int., 2015, 75, 71–78 CrossRef CAS PubMed.
- R. Zhang, Z. Zhang, H. Zhang, E. A. Decker and D. J. McClements, Influence of emulsifier type on gastrointestinal fate of oil-in-water emulsions containing anionic dietary fiber (pectin), Food Hydrocolloids, 2015, 45, 175–185 CrossRef CAS.
- C. H. Versantvoort, A. G. Oomen, E. Van de Kamp, C. J. Rompelberg and A. J. Sips, Applicability of an in vitro digestion model in assessing the bioaccessibility of mycotoxins from food, Food Chem. Toxicol., 2005, 43, 31–40 CrossRef CAS PubMed.
- T. J. Wooster, L. Day and M. Xu, et al., Impact of different biopolymer networks on the digestion of gastric structured emulsions, Food Hydrocolloids, 2014, 36, 102–114 CrossRef CAS.
- J. Li, J. Cai and H. Jia, et al., Formation of iron oxide/Pd hybrid nanostructures with enhanced peroxidase-like activity and catalytic reduction of 4-nitrophenol, J. Environ. Sci. Health, Part C: Environ. Carcinog. Ecotoxicol. Rev., 2017, 35, 159–172 CrossRef CAS PubMed.
- G.-Y. Seo, J. H. Lee and J. H. Kim, et al., Effects of emulsifying agents on the safety of titanium dioxide and zinc oxide nanoparticles in sunscreens, J. Dispersion Sci. Technol., 2018, 39, 1544–1549 CrossRef CAS.
- T. Maldiney, A. Bessiere and J. Seguin, et al., The in vivo activation of persistent nanophosphors for optical imaging of vascularization, tumours and grafted cells, Nat. Mater., 2014, 13, 418–426 CrossRef CAS PubMed.
- J. Borreani, E. Llorca, V. Larrea and I. Hernando, Adding neutral or anionic hydrocolloids to dairy proteins under in vitro gastric digestion conditions, Food Hydrocolloids, 2016, 57, 169–177 CrossRef CAS.
- H. Fabek, S. Messerschmidt, V. Brulport and H. D. Goff, The effect of in vitro digestive processes on the viscosity of dietary fibres and their influence on glucose diffusion, Food Hydrocolloids, 2014, 35, 718–726 CrossRef CAS.
- L. Laloux, D. Kastrati, S. Cambier, A. C. Gutleb and Y. J. Schneider, The Food Matrix and the Gastrointestinal Fluids Alter the Features of Silver Nanoparticles, Small, 2020, 16, e1907687 CrossRef PubMed.
- A. P. Ault, D. I. Stark and J. L. Axson, et al., Protein Corona-Induced Modification of Silver Nanoparticle Aggregation in Simulated Gastric Fluid, Environ. Sci.: Nano, 2016, 3(6), 1510–1520 RSC.
- K. M. Mayer and J. H. Hafner, Localized surface plasmon resonance sensors, Chem. Rev., 2011, 111, 3828–3857 CrossRef CAS PubMed.
- T. Miclaus, C. Beer and J. Chevallier, et al., Dynamic protein coronas revealed as a modulator of silver nanoparticle sulphidation in vitro, Nat. Commun., 2016, 7, 11770 CrossRef CAS PubMed.
- X. Fang, L. Jiang, Y. Gong, J. Li, L. Liu and Y. Cao, The presence of oleate stabilized ZnO nanoparticles (NPs) and reduced the toxicity of aged NPs to Caco-2 and HepG2 cells, Chem.-Biol. Interact., 2017, 278, 40–47 CrossRef CAS PubMed.
- R. R. Miranda, A. G. Bezerra Jr and C. A. Oliveira Ribeiro, et al., Toxicological interactions of silver nanoparticles and non-essential metals in human hepatocarcinoma cell line, Toxicol. In Vitro, 2017, 40, 134–143 CrossRef CAS PubMed.
| This journal is © The Royal Society of Chemistry 2021 |