 Open Access Article
Improving the dynamics of a Nd–Mg–Ni-based alloy by combining Ni element and mechanical milling
Yin Zhanga,
Hui Yongb,
Xia Lia,
Zeming Yuan *a,
Zhonggang Hana,
Dianchene Fenga and
Hao Suna
aKey Laboratory of Integrated Exploitation of Baiyun Obo Multi-Metal Resources, Inner Mongolia University of Science and Technology, Baotou 014010, China
bCollege of Materials Science & Engineering, Taiyuan University of Science and Technology, Taiyuan 030024, China. E-mail: zmyuan153@163.com
First published on 19th January 2021
Abstract
To improve the reversible kinetics and electrochemical performance of a Nd–Mg–Ni-based alloy, NdMg11Ni + x wt% Ni (x = 100 or 200) samples were prepared through combining the addition of Ni element and ball-milling technology. Meanwhile, the effects of the addition of Ni element and the duration of milling on the NdMg11Ni samples were researched. The results indicate that the addition of Ni element has a beneficial effect on the dynamics of the samples. Meanwhile, the milling duration also has a beneficial effect on the high-rate discharging capabilities, the gaseous hydrogenation rate, and the dehydrogenation dynamics. When the ball-milling time is increased from 5 h to 60 h, the value of Rd20 (the ratio of the dehydrogenation capabilities within 20 min to the saturated hydrogenation capabilities) is raised from 62.20% to 71.59% for the x = 200 sample, and from 58.03% to 64.81% for the x = 100 sample; this is believed to be due to a decline in the activation energy resulting from an increase in the Ni content and ball-milling time. In addition, the Ea value of NdMg11Ni + 200 wt% Ni with a ball-milling time of 60 h is 55.7 kJ mol−1.
Introduction
Vehicle exhaust is a very important factor determining the formation of smog and haze, according to the results of a survey by the Chinese Ministry of Environmental Protection. Therefore, it is of great concern from an environment viewpoint. In addition, problems relating to fossil energy also appear increasingly serious due to the increasing advancement of the automobile industry. In fact, the efficiency of an internal combustion engine is only twenty-five percent of its total energy consumption.1 For this reason, researchers have been working to find new sources of energy to replace fossil fuels, thereby fundamentally solving the problem of energy depletion and environmental pollution. Hydrogen energy sources are considered the most promising candidates, because they have many advantages, such as high energy densities, environmentally friendly characteristics, and abundant potential sources.2,3 Thus, the development of hydrogen storage technology is very important, especially for hydrogen-powered cars and power cells.4 Metal hydrides are deemed to be the most promising and capable materials to act as hydrogen storage carriers for real-life applications due to their series of advantages,5–7 such as excellent thermodynamics and kinetics at moderate temperatures. However, their low hydrogen storage capacities can barely meet the requirements for hydrogen storage materials for use in vehicles set by the US DOE.8,9 Taking into account the driving mileages of hydrogen-powered cars, Mg-based compounds are deemed to be the most promising choice due to their high capacities. In particular, RE–Mg-based IMCs have been widely considered because of their hydrogen storage capacities of 3.2–6.2 wt% (ref. 10) and their electrochemical capacities, exceeding 900 mA h g−1.11 Still, there are limits to their practical application in hydrogen-powered cars and power cells, such as low electrochemical discharging capabilities, slow de-/hydriding dynamics, and high dehydrogenation temperatures. Hence, improving the performance of Mg-based hydrogen storage alloys in the future is still a conundrum.In recent years, two major approaches have been implemented to enhance the performances of Mg-based alloys: (1) adding catalytic elements, such as RE (rare-earth) elements12 and TMs (transition metals);13 and (2) creating amorphous and nanocrystalline microstructures,14,15 including via hydriding combustion synthesis (HCS),16 rapid solidification (RS),17 and ball-milling (BM) methods.18 Generally, Ni is the most effective of the transition-metal group of catalytic elements on hydrogen storage performance, especially electrochemical performance. The excellent results are based on the fact that TM elements act as unique catalysts that are helpful at reducing the energy barriers of hydrogen atom recombination and hydrogen molecule decomposition.19,20
In particular, the ball-milling technique is the most frequently used method to enhance gaseous hydrogen de/absorption performance21 and electrochemical performance22 of Mg-based materials. The beneficial influence is mainly attributed to the refined particles and formed crystal defects, which play key roles in diffusivity and nucleation during the processes of hydrogenation and dehydrogenation.23 Yartys et al.24 stated that the LaMg11Ni alloy possess the fastest hydrogenation dynamics and the maximum hydrogenation capabilities when the alloy is solidified at the highest cooling rate. Yong et al.25 stated that the Mg90Ce5Sm5 compound has good hydrogenation and dehydrogenation dynamics due to the addition of different RE elements. Wang et al.26 studied the electrochemical performance of milled MmMg12 + x wt% Ni alloys, and the conclusions showed that the addition of Ni resulted in an increase in the discharge capacity. In addition, it is worth mentioning here that the influence of ball-milling technology on the hydrogenation and dehydrogenation dynamics of RE–Mg–Ni-based alloys has been studied by our research group.27–29 In conclusion, the influence of the milling speed and duration are the same on RE–Mg–Ni-based hydrogen storage alloys: increasing the time and speed can produce more amorphous or smaller nanocrystals, hence enhancing the hydrogen storage performance.
It is generally known that Ni has a strong catalytic effect on Mg-based alloys, which could accelerate the formation of amorphous structures and enhance the hydrogen storage performances. Hence, in this paper, we use a new method, combining the addition of a Ni element and ball-milling technology. Nanocrystalline NdMg11Ni + x wt% Ni (x = 100 or 200) samples were synthesized, and the effects of the Ni content and milling duration on the hydrogenation and dehydrogenation dynamics were studied.
Experimental
The NdMg11Ni alloy was synthesized based on a stoichiometric ratio by a method given in a previous study.25 After that, the obtained as-cast sample was mechanical grounded into powder with a diameter of less than 200 mesh. The sample powder was mixed with Ni powder at determined proportions. The alloy powder was mixed with carbonyl nickel powder at weight ratios of 1![[thin space (1/6-em)]](https://www.rsc.org/images/entities/char_2009.gif) :
:![[thin space (1/6-em)]](https://www.rsc.org/images/entities/char_2009.gif) 1 and 1
1 and 1![[thin space (1/6-em)]](https://www.rsc.org/images/entities/char_2009.gif) :
:![[thin space (1/6-em)]](https://www.rsc.org/images/entities/char_2009.gif) 2, respectively. Then, the mixed powder samples were mechanically milled in a planetary-type mill and were handled in a glove box under an argon atmosphere to prevent the powder from oxidation during ball milling. A Cr–Ni stainless-steel ball and powder at a weight ratio of 35
2, respectively. Then, the mixed powder samples were mechanically milled in a planetary-type mill and were handled in a glove box under an argon atmosphere to prevent the powder from oxidation during ball milling. A Cr–Ni stainless-steel ball and powder at a weight ratio of 35![[thin space (1/6-em)]](https://www.rsc.org/images/entities/char_2009.gif) :
:![[thin space (1/6-em)]](https://www.rsc.org/images/entities/char_2009.gif) 1 were put into Cr–Ni stainless-steel vials together. The milling speed was 135 rpm and the duration times were 5, 10, 20, 40, and 60 h, respectively.
1 were put into Cr–Ni stainless-steel vials together. The milling speed was 135 rpm and the duration times were 5, 10, 20, 40, and 60 h, respectively.
The phase compositions were analysed via X-ray diffraction (Dmax-2400) at a rate of 10° min−1. The morphologies and crystalline states were surveyed via HRTEM and SAED analysis. The electrochemical kinetics were measured at 30 °C using a tri-electrode open cell, consisting of a working electrode (a metal-hydride electrode), a sintered Ni(OH)2/NiOOH counter electrode, and a Hg/HgO reference electrode, which were immersed in 6 M KOH electrolyte. The voltage between the negative and reference electrodes was defined as the discharge voltage. In each cycle, the alloy electrode was first charged at a constant current density and, after resting for 15 min, it was discharged at the same current density to a cut-off voltage of −0.500 V.
The activated electrodes were charged at a current of 60 mA g−1; then, the electrode was discharged to a discharge depth (DOD) of 50% at a current of 60 mA g−1 after standing for 10 min. After standing for a period of time until the potential was stable, EIS (electrochemical impedance spectroscopy) studies were conducted using an electrochemical workstation (PARSTAT 2273). In addition, the coefficient of H diffusion was measured in the totally charged state.
The dynamics of the samples were measured using semi-automatic Sieverts equipment with a heating furnace. The hydrogenation dynamics were measured at an initial hydrogen pressure of 3.0 MPa in the temperature range from 553 K to 613 K, and the dehydrogenation dynamics were measured at an initial hydrogen pressure of 0.001 MPa over the same temperature range. Meanwhile, the decomposition behaviour of the hydrogenated samples was also analysed through temperature-programmed desorption (TPD, PCA-1100) and differential scanning calorimetry (DSC, SDT-Q600) at different heating rates. Based on previous studies,25,30 all elements can be said to be uniformly distributed in the experimental sample, including at the edges of grains and grain boundaries, indicating that the experimental sample has uniform hydrogen-storage performance.31
Results and discussion
Microstructure characteristics
Fig. 1 displays the XRD patterns of as-cast and milled NdMg11Ni + x wt% Ni (x = 0, 100, or 200) samples before and after hydrogenation. These reveal that the as-cast samples are composed of a NdMg12 phase and a Mg2Ni phase. The XRD peaks become significantly broadened after ball milling, which is mainly attributed to the refined grains, even to the level of nanocrystals. In addition, as the Ni content increases, the diffraction peaks broaden more severely, implying that the Ni element assists grain refinement, as a Ni element is beneficial when refining RE–Mg intermetallic compounds (IMCs).32 After hydrogenation, the original phases of the as-cast alloy disappear and are replaced by MgH2, NdH3, and Mg2NiH4 phases. Therefore, the hydrogenation process of the as-cast NdMg11Ni alloy can be summarized via the following equations:33| NdMg12 + H2 → MgH2 + NdH3 | (1) |
| Mg2Ni + H2 → Mg2NiH4 | (2) |
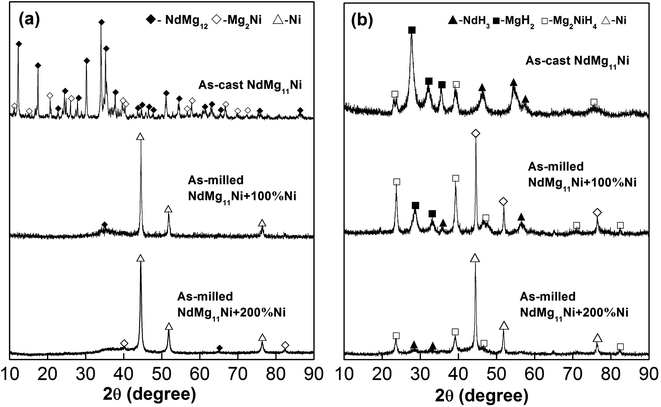 | ||
| Fig. 1 XRD profiles of as-cast and milled (20 h) NdMg11Ni + x wt% Ni (x = 0, 100, or 200) alloys before and after hydriding: (a) before hydriding; and (b) after hydriding. | ||
It is worth mentioning that the XRD peaks of the samples are slightly broadened after hydriding, which is due to the expansion of the crystal cell volume and the occurrence of lattice stress, which are caused by hydrogen atoms. In addition, the ball-milled NdMg11Ni + x wt% Ni (x = 100 or 200) samples retain a nanocrystalline structure after hydriding, having even wider peaks than before hydriding, which is consistent with the hydrogenation results from the as-cast alloy. This refinement process, which is caused by hydrogen, is known as hydrogen-induced amorphization, which was also discovered by Oesterreicher and Bittner.34
Fig. 2 shows the HRTEM images and corresponding SAED patterns of NdMg11Ni + x wt% Ni (x = 0, 100, or 200) alloys. Clearly, both NdMg12 and Mg2Ni phases could be identified in the samples. In addition, after ball milling for 20 h, the x = 100 alloy displays obvious nanocrystalline and amorphous structures, whereas the x = 200 alloy not only retains its original structure but it also has a larger amorphous area, indicating that the Ni element can also facilitate the simultaneous formation of glass, and not just nanocrystals, as stated by Teresiak et al.35
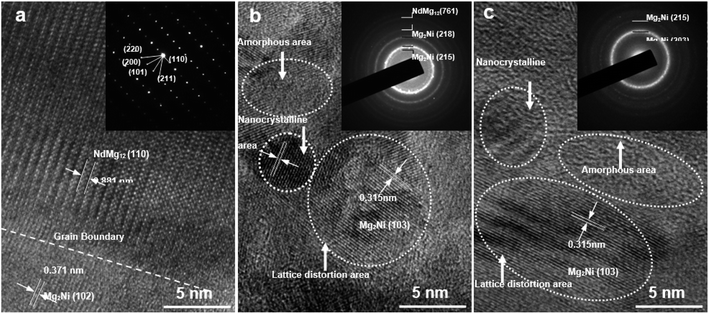 | ||
| Fig. 2 TEM micrographs and SAED patterns of as-cast and milled (20 h) NdMg11Ni + x wt% Ni (x = 0, 100, or 200) alloys: (a) x = 0; (b) x = 100; and (c) x = 200. | ||
Electrochemical dis/charging dynamics
In order to utilize Ni–MH (nickel–metal hydride) batteries widely, superior electrode material electrochemical charge and discharge dynamics are needed. Here, we can investigate the HRD (high-rate discharge) performance to assess the dynamics of a sample electrode electrochemically, which can be described as follows:| HRD = C300/C60 × 100% | (3) |
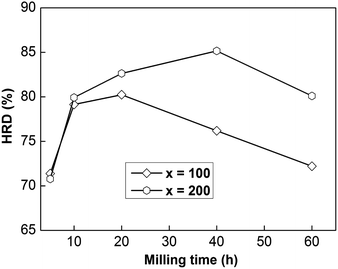 | ||
| Fig. 3 The evolution of the HRD values of as-milled NdMg11Ni + x wt% Ni (x = 100 or 200) alloys with milling time. | ||
In addition, the sample with x = 100 possesses lower HRD values than the sample alloy with x = 200, implying that an increased Ni element content could promote the electrochemical dynamics of samples. Fig. 4 displays the relationship between ball-milling time and discharge capacity for the samples, from which we can find that the discharge capacity was improved obviously with an increase in the nickel content, but it does not continuously improve with ball-milling time, especially in the case of the x = 200 alloy. Obviously, nickel can improve the electrochemical dynamics and discharging capacity performance of the alloy, which has great potential for use in high-powered Ni–MH batteries.
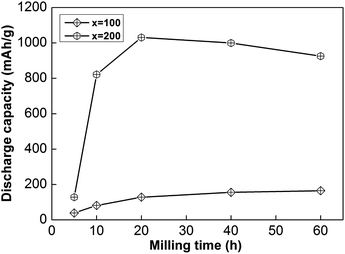 | ||
| Fig. 4 The evolution of the discharge capacities of as-milled NdMg11Ni + x wt% Ni (x = 100 or 200) alloys with milling time. | ||
Generally, HRD largely relies on the H-migration capacity in the sample volume and the rate of electrode-surface charge transfer.36 We studied the influence of the milling duration on the H diffusion capabilities and charge-transfer rate. The diffusion coefficient of H can be obtained via measuring semi-logarithmic curves based on White's model,37 as shown in Fig. 5. The formulas are shown below:
 | (4) |
 | (5) |
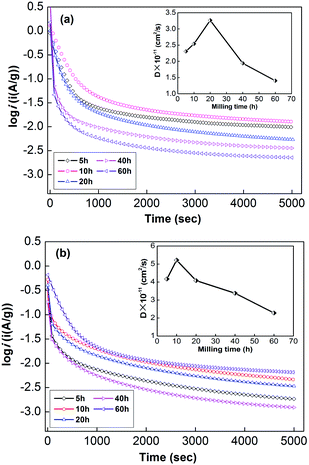 | ||
| Fig. 5 Semilogarithmic curves of anodic current vs. time responses of as-milled NdMg11Ni + x wt% Ni (x = 100, 200) alloys: (a) x = 100, (b) x = 200. | ||
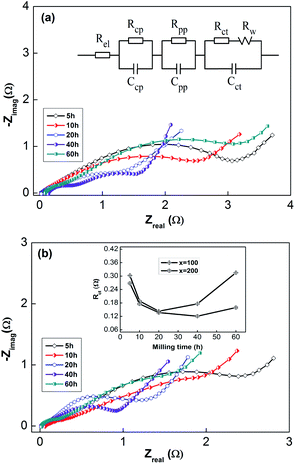 | ||
| Fig. 6 Electrochemical impedance spectra (EIS) of as-milled NdMg11Ni + x wt% Ni (x = 100, 200) alloys: (a) x = 100, (b) x = 200. | ||
Usually, when charge is transferred over an alloy surface, an energy barrier needs to be overcome for electrochemical reactivity to be allowed. The energy barrier is called the apparent activation enthalpy, which can be determined using the below formula:38
 | (6) |
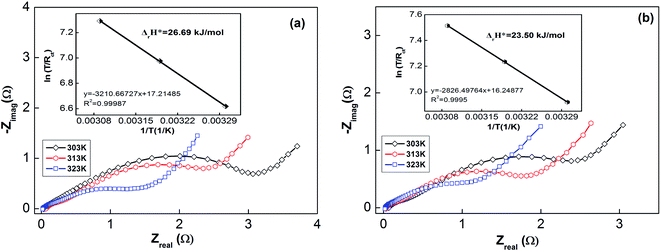 | ||
| Fig. 7 Electrochemical impedance spectra (EIS) of as-milled (10 h) NdMg11Ni + x wt% Ni (x = 100 or 200) alloys at various temperatures: (a) x = 100; and (b) x = 200. | ||
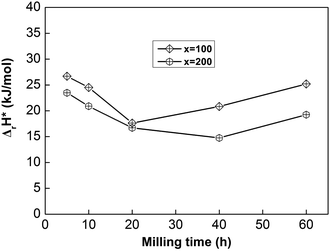 | ||
| Fig. 8 The evolution of the activation enthalpy (ΔrH*) values of as-milled NdMg11Ni + x wt% Ni (x = 100 or 200) alloys with milling time. | ||
Generally, the electrochemical reaction in a Ni–MH cell can be described by the following formula:
 | (7) |
The forward reaction is the charging process, which is composed of two steps: (1) hydrogen ions diffuse from the electrolyte into the alloy (M); and (2) then, the hydrogen ions react with the alloy to form metal hydrides (MHs). The reverse reaction is the discharging process, in which the transfer of charge occurs in an opposite fashion to the charging process. It can be seen that charge transfer is closely related to the surface state of the alloy, depending on factors such as grain boundaries, phase boundaries, defect sites, and the specific surface area. Therefore, the beneficial effects of ball milling can be summarized as follows:
(1) via refining the particle size, the specific surface area is increased to expand the response area;
(2) via creating a nanocrystalline structure, more grain boundaries are provided as diffuser channels; and
(3) the defect sites formed during the ball-milling process can improve the surface activity and reduce the enthalpy of hydride formation.
However, with an increase in the ball-milling time, the amount of amorphous phase that is formed increases, which will severely impede the diffusion of hydrogen ions, although it can also change the surface activity state of the alloy. Therefore, it is of very practical significance to control the amorphous phase content through the ball-milling time.
Hydrogenation and dehydrogenation dynamics
For the convenience of the research, the gaseous hydrogenation dynamics can be evaluated based on the saturated hydrogenation rate (SHR), which can be described as Rat = Cat/Ca100 × 100%, where Cat and Ca100 represent the hydrogenation capabilities after t min and 100 min, respectively. In the same way, the gaseous dehydrogenation dynamics also can be evaluated based on the saturated dehydrogenation rate (SDR), which can be defined as Rdt = Cdt/Ca100 × 100%, where Cdt and Ca100 are the dehydrogenation capabilities after t min and 100 min, respectively. Here, Ca100 is chosen as the saturated hydrogenation capacity because all of the samples can fully absorb and release hydrogen within 100 min.Taking 10 min as standard for hydrogenation and 20 min for dehydrogenation for ease of comparison, the relationships between the Ra10 and Rd20 values and the milling duration are displayed in Fig. 9. Obviously, Ra10 shows a trend of first increasing and then decreasing, whereas Rd20 shows a continuous increase with an extension of the ball-milling time.
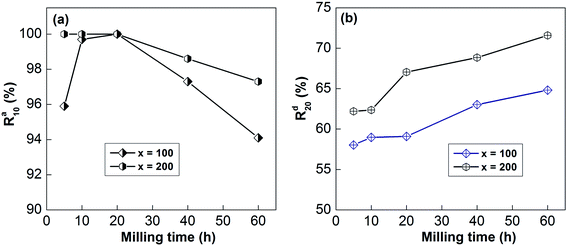 | ||
| Fig. 9 The evolution of the Ra10 (a) and Rd20 (b) values at 613 K of the as-milled alloys with milling time. | ||
For example, prolonging the ball-milling time from 5 h to 60 h raises Rd20 from 62.20% to 71.59% for the x = 200 sample and from 58.03% to 64.81% for the x = 100 sample. The improvement in the dynamics of the sample due to mechanical ball-milling could be attributed to variations in the internal structure. After mechanical ball-milling, the typical polycrystalline structure transforms into nanocrystalline and amorphous structures. The introduction of nanocrystalline structures raises the number of interfaces and provides more paths for the rapid diffusion of hydrogen, thereby improving the dynamic properties of the alloy. At the same time, nanocrystalline and amorphous structures can also lower the hydrogen diffusion barrier.15,39 However, the hydrogenation dynamics begin to deteriorate when the milling time is more than 20 h, which is owing to the formation of amorphous structures; the H atom diffusion rate in the nanocrystalline phase is much higher than in amorphous structures. As for the positive influence of prolonging the milling duration on the dehydrogenation dynamics, it has been well proved that decreasing the grain size below the micron scale could significantly enhance the decomposition performance of RE–Mg IMCs.6,40 The dynamics of de/hydrogenation are enhanced by the addition of nickel elements, which may be due to the formation of highly catalytic surfaces during mechanical grinding.41
In addition, the SHR and SDR values of the sample with x = 100 are much lower than those of the sample with x = 200 at all milling times, which means that the Ni element is also beneficial for the gaseous reaction of hydrogen. The same results have been described by Anik et al.42
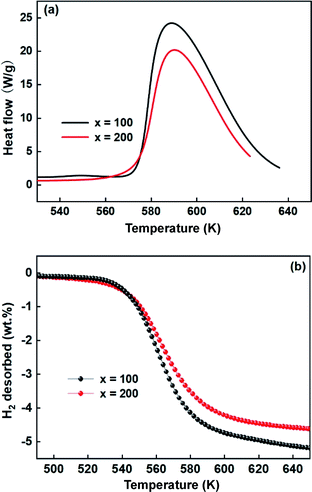
In addition, DSC and TPD studies also were performed to further understand the effects of Ni on the desorption dynamics. Fig. 10 shows the DSC and TPD curves of alloys that were ball-milled for 60 h. From the DSC curves in Fig. 10a, the alloys have almost the same peak temperature, but the alloy with x = 200 shows a smaller peak area than the alloy with x = 100, indicating that the alloy with x = 200 possesses lower decomposition energy and excellent dynamics. Similarly, Fig. 10b also shows that the alloy with x = 200 possesses a lower initial dehydrogenation temperature, which is consistent with the DSC results.
Dehydrogenation activation energy
The previous analysis shows that determining the apparent activation enthalpy is the most essential way to characterize the electrochemical dynamics. Similarly, the activation energy is also important for characterizing the gaseous absorption and release of hydrogen. However, hydrogenation is a reaction restricted by nucleation and diffusion, and there is no computing model that can calculate the activation energy of hydrogenation.Therefore, the activation energy of the dehydrogenation reaction can be obtained through the JMA equation (eqn (8)) and the Arrhenius formula (eqn (9)),43,44 as follows:
ln[−ln(1 − α)] = η![[thin space (1/6-em)]](https://www.rsc.org/images/entities/char_2009.gif) ln ln![[thin space (1/6-em)]](https://www.rsc.org/images/entities/char_2009.gif) k + η k + η![[thin space (1/6-em)]](https://www.rsc.org/images/entities/char_2009.gif) ln ln![[thin space (1/6-em)]](https://www.rsc.org/images/entities/char_2009.gif) t t
| (8) |
 | (9) |
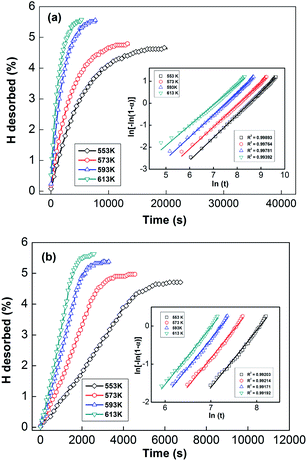
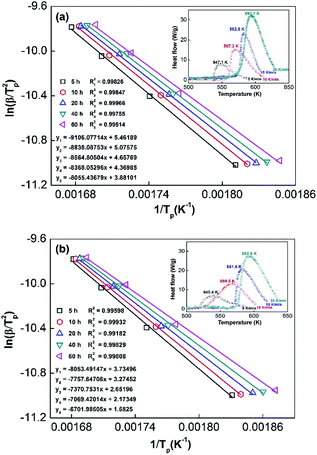
In order to calculate the value of α, the dynamic curves from the dehydrogenation of ball-milled (20 h) NdMg11Ni + x wt% Ni (x = 100 or 200) samples at 553–613 K were obtained and are presented in Fig. 11. Therefore, according to the information in Fig. 11 and eqn (8), plots of ln[−ln(1 − α)] vs. ln(t) at different temperatures can be drawn, which is called the Avrami diagram, as displayed in the insets of Fig. 11; from these, it seen that the Avrami diagrams are almost linear. Therefore, ln(k) at different temperatures can be easily obtained based on the ratio of the intercept to the slope in the Avrami diagrams. So, Edea can be calculated using eqn (9) after logarithmic transformation. Plots of ln(k) vs. 1/T after different ball-milling times are presented in Fig. 12. The calculated Edea values are listed in Table 1. Meanwhile, the activation energies of dehydrogenation can be calculated via the Kissinger equation (eqn (10))45 as follows:
 | (10) |
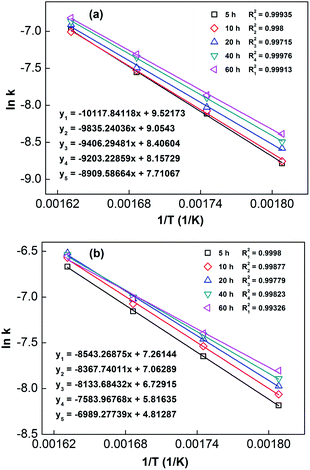 | ||
| Fig. 12 Arrhenius plots of NdMg11Ni + x wt% Ni (x = 100 or 200) alloys milled for different times: (a) x = 100; and (b) x = 200. | ||
| Milling time (h) | Edea (kJ mol−1) | Edek (kJ mol−1) | ||
|---|---|---|---|---|
| x = 100 | x = 200 | x = 100 | x = 200 | |
| 5 | 84.1 | 71.0 | 75.7 | 67.0 |
| 10 | 81.8 | 69.6 | 73.5 | 64.5 |
| 20 | 78.2 | 67.6 | 71.2 | 61.3 |
| 40 | 76.5 | 63.1 | 69.6 | 58.8 |
| 60 | 74.1 | 58.1 | 67 | 55.7 |
Obviously, all of the alloys show one endothermic peak in the DSC curves, implying that every reaction follows the same course. In the meantime, we observed that the endothermic peaks of the x = 200 sample have a tendency to drift toward low temperatures, indicating that the dehydrogenation dynamics of the samples can be improved via the inclusion of a Ni element. Using the logarithmic variation of the data in Fig. 13 and based on eqn (10), graphs of ln(β/Tp2) vs. 1/Tp can be established, which are called Kissinger diagrams. The Kissinger diagrams of samples with different ball-milling times are displayed in Fig. 13. Therefore, the values of Edek can be quickly computed from the slopes of the Kissinger diagrams, and these are listed in Table 1.
According to the values in Table 1, the activation energies computed via the Kissinger method are lower than those calculated via the Arrhenius method due to differences in the experimental environment.46 In addition, the results are similar to those obtained relating to SDR, in which the values of Ea decrease with an increase in the ball-milling time. This further indicates that the dehydrogenation process is a nucleation growth process. Moreover, the positive catalysis effects of nickel have again been demonstrated, which is very significant for research into the modification of Mg-based alloys. Even in the alloy milled for 5 h, the Ea values remain outstanding compared with other Mg-based alloys, such as Sm5Mg41 (135.3 kJ mol−1),47 Y5Mg24 (122.0 kJ mol−1),48 Mg90Ce5Ni5 (124.6 kJ mol−1),49 and Mg80La6.45Ni13.52 (136.2 kJ mol−1) alloys.50
Conclusions
The hydrogen storage dynamics of as-milled NdMg11Ni + x wt% Ni (x = 100 or 200) samples were systematically investigated, and the main results are summarized as follows:(1) The microstructures of the alloys were changed by ball milling, and nanocrystalline amorphous structures were formed. In addition, with an increase in the grinding time, the amorphous phase content increases obviously. Moreover, an increase in the Ni content improves the dynamics of the NdMg11Ni alloy, both in an electrochemical and gaseous sense.
(2) As the ball-milling time increases, the electrochemical dynamics reach a maximum level, which is attributed to the ability to transfer charge. However, the effect is limited by the amorphous phase produced through the prolongation of the ball-milling time.
(3) As the ball-milling time increases, the dynamic hydrogen absorption and desorption performances in the gaseous state showed different trends: the hydrogenation dynamics reached a maximum after 20 h, while the dehydrogenation dynamics were constantly enhanced upon prolonging the ball-milling time. These phenomena are closely related to the microstructure and corresponding activation energy.
(4) The activation energy is an important index for evaluating the dynamics of Mg-based alloys, including the electrochemical and gaseous state kinetics, and it is related to the microstructure, which can be affected by ball milling and nickel catalysis. In addition, the Ea value of NdMg11Ni + 200 wt% Ni with a ball-milling time of 60 h is 55.7 kJ mol−1 based on the Kissinger model, which is slightly smaller than the value obtained based on the Arrhenius model (58.1 kJ mol−1).
Conflicts of interest
There are no conflicts to declare.Acknowledgements
This study was financially supported by the National Natural Science Foundation of China (No. 51901105, 51871125, and 51761032), Natural Science Foundation of Inner Mongolia, China (No. 2019BS05005), and Inner Mongolia University of Science and Technology Innovation Fund (2019QDL-B11).References
- D. Mori and K. Hirose, Int. J. Hydrogen Energy, 2009, 34, 4569–4574 CrossRef CAS.
- P. Dibandjo, C. Zlotea, R. Gadiou, C. M. Ghimbeu, F. Cuevas, M. Latroche, E. Leroy and C. Vix-Guterl, Int. J. Hydrogen Energy, 2013, 38, 952–965 CrossRef CAS.
- T. N. Veziroglu and S. Sahin, Energy Convers. Manage., 2008, 49, 1820–1831 CrossRef CAS.
- L. Schlapbach and A. Züttel, Nature, 2001, 414, 353–358 CrossRef CAS.
- I. P. Jain, L. Chhagan and A. Jain, Int. J. Hydrogen Energy, 2010, 35, 5133–5144 CrossRef CAS.
- B. Sakintuna, F. Lamari-Darkrim and M. Hirscher, Int. J. Hydrogen Energy, 2007, 32, 1121–1140 CrossRef CAS.
- N. A. A. Rusman and M. Dahari, Int. J. Hydrogen Energy, 2016, 41, 12108–12126 CrossRef CAS.
- Y. H. Sun, C. Q. Shen, Q. W. Lai, W. Liu, D. W. Wang and K. F. Aguey-Zinsou, et al., Energy Storage Materials, 2018, 10, 168–198 CrossRef.
- L. E. Klebanoff and J. O. Keller, Int. J. Hydrogen Energy, 2013, 38, 4533–4576 CrossRef CAS.
- Y. Wang, X. Wang and C. M. Li, Int. J. Hydrogen Energy, 2010, 35, 3550–3554 CrossRef CAS.
- Y. Wang, S. Z. Qiao and X. Wang, Int. J. Hydrogen Energy, 2008, 33, 5066–5072 CrossRef CAS.
- H. Yong, S. H. Guo, Z. M. Yuan, Y. Qi, D. L. Zhao and Y. H. Zhang, J. Mater. Sci. Technol., 2020, 51, 84–93 CrossRef.
- H. Yong, X. Wei, Y. H. Wang, S. H. Guo, Z. M. Yuan, Y. Qi, D. L. Zhao and Y. H. Zhang, J. Phys. Chem. Solids, 2020, 144, 109516 CrossRef CAS.
- S. Kalinichenka, L. Röntzsch, T. Riedl, T. Gemming, T. Weißgärber and B. Kieback, Int. J. Hydrogen Energy, 2011, 36, 1592–1600 CrossRef CAS.
- L. Hima-Kumar, B. Viswanathan and S. Srubuvasa-Murthy, J. Alloys Compd., 2008, 461, 72–76 CrossRef.
- H. Gu, Y. Zhu and L. Li, Int. J. Hydrogen Energy, 2008, 33, 2970–2974 CrossRef CAS.
- T. Spassov, V. Rangelova and N. Neykov, J. Alloys Compd., 2002, 334, 219–223 CrossRef CAS.
- M. Y. Song, Y. J. Kwak, H. S. Shin, S. H. Lee and B. G. Kim, Int. J. Hydrogen Energy, 2013, 38, 1910–1917 CrossRef CAS.
- Y. J. Lv, B. Zhang and Y. Wu, J. Alloys Compd., 2015, 641, 176–180 CrossRef CAS.
- H. Yong, S. H. Guo, Z. M. Yuan, Y. Qi, D. L. Zhao and Y. H. Zhang, Renewable energy, 2020, 157, 828–839 CrossRef CAS.
- A. Moreira, E. Prokofiev, G. Ferreira de Lima, E. Rauch, M. Veron, W. JoséBotta, M. Kawasaki and T. G. Langdon, Int. J. Hydrogen Energy, 2013, 38, 8306–8312 CrossRef.
- S. Bliznakov, N. Drenchev, B. Drenchev, P. Delchev, P. Solsona and T. Spassov, J. Alloys Compd., 2005, 404–406, 682–686 CrossRef CAS.
- S. S. Han, H. Y. Lee, N. H. Goo, W. T. Jeong and K. S. Lee, J. Alloys Compd., 2002, 330–332, 841–845 CrossRef CAS.
- A. A. Poletaev, R. V. Denys, J. P. Maehlen, J. K. Solberg, B. P. Tarasov and V. A. Yartys, Int. J. Hydrogen Energy, 2012, 37, 3548–3557 CrossRef CAS.
- H. Yong, S. H. Guo, Z. M. Yuan, W. Zhang, Y. Qi, D. L. Zhao and Y. H. Zhang, J. Rare Earths, 2020, 38, 633–641 CrossRef CAS.
- Y. Wang, X. Wang and C. M. Li, Int. J. Hydrogen Energy, 2010, 35, 3550–3554 CrossRef CAS.
- Y. H. Zhang, X. Wei, W. Zhang, Z. M. Yuan, J. L. Gao, Y. Qi and H. P. Ren, Int. J. Hydrogen Energy, 2020, 45, 33832–33845 CrossRef CAS.
- Y. H. Zhang, W. Zhang, W. G. Bu, Y. Gai, Y. Qi and S. H. Guo, Renewable energy, 2019, 132, 167–175 CrossRef CAS.
- Y. Qi, Y. H. Zhang, W. Zhang, J. L. Gao, Z. M. Yuan, W. G. Bu, Y. Q. Li and S. H. Guo, Int. J. Hydrogen Energy, 2017, 42, 18473–18483 CrossRef CAS.
- H. Yong, S. H. Guo, Z. M. Yuan, Y. Qi, D. L. Zhao and Y. H. Zhang, Int. J. Hydrogen Energy, 2019, 44, 16765–16776 CrossRef CAS.
- N. A. Medvedeva, A. A. Mironova, N. E. Skryabina and D. Fruchart, Int. J. Hydrogen Energy, 2020, 45, 7892–7900 CrossRef CAS.
- M. Abdellaoui, S. Mokbli, F. Cuevas, M. Latroche, A. Percheron-Guégan and H. Zarrouk, J. Alloys Compd., 2003, 356–357 Search PubMed , 557–561.
- R. V. Denys, A. A. Poletaev, J. K. Solberg, B. P. Tarasov and V. A. Yartys, Acta Mater., 2010, 58, 2510–2519 CrossRef CAS.
- H. Oesterreicher and H. Bittner, J. Less-Common Met., 1980, 73, 339–344 CrossRef CAS.
- A. Teresiak, A. Gebert, M. Savyak, M. Uhlemann, C. Mickel and N. Mattern, J. Alloys Compd., 2005, 398, 156–164 CrossRef CAS.
- X. Y. Zhao, Y. Ding, L. Q. Ma, L. Y. Wang, M. Yang and X. D. Shen, Int. J. Hydrogen Energy, 2008, 33, 6727–6733 CrossRef CAS.
- G. Zhang, B. N. Popov and R. E. White, J. Electrochem. Soc., 1995, 142, 2695–2698 CrossRef.
- N. Kuriyama, T. Sakai, H. Miyamura, I. Uehara, H. Ishikawa and T. Iwasaki, J. Alloys Compd., 1993, 202, 183–197 CrossRef CAS.
- M. Anik, F. Karanfil and N. K. kdeveci, Int. J. Hydrogen Energy, 2012, 37, 299–308 CrossRef CAS.
- Y. Wu, W. Han, S. X. Zhou, M. V. Lototsky, J. K. Solberg and V. A. Yartys, J. Alloys Compd., 2008, 466, 176–181 CrossRef CAS.
- M. Y. Song, C.-D. Yim, S. N. Kwon, J.-S. Bae and S.-H. Hong, Int. J. Hydrogen Energy, 2008, 33, 87–92 CrossRef CAS.
- M. Anik, J. Alloys Compd., 2010, 491, 565–570 CrossRef CAS.
- K. J. Laidler, Pure Appl. Chem., 1996, 68, 149–192 CAS.
- J. F. Fernandez and C. R. Sanchez, J. Alloys Compd., 2003, 356–357, 348–352 CrossRef CAS.
- H. E. Kissinger, Anal. Chem., 1957, 29, 1702–1706 CrossRef CAS.
- M. Baricco, M. W. Rahman, S. Livraghi, A. Castellero, S. Enzo and E. Giamello, J. Alloys Compd., 2012, 536, S216–S221 CrossRef CAS.
- Z. M. Yuan, T. Yang, W. G. Bu, H. W. Shang, Y. Qi and Y. H. Zhang, Int. J. Hydrogen Energy, 2016, 41, 5994–6003 CrossRef CAS.
- T. Yang, Z. M. Yuan, W. G. Bu, Z. C. Jia, Y. Qi and Y. H. Zhang, Int. J. Hydrogen Energy, 2016, 41, 2689–2699 CrossRef CAS.
- H. J. Lin, L. Z. Ouyang, H. Wang, D. Q. Zhao, W. H. Wang, D. L. Sun and M. Zhu, Int. J. Hydrogen Energy, 2012, 37, 14329–14335 CrossRef CAS.
- Q. Li, Y. B. Pan, H. Y. Leng and K. Chou, Int. J. Hydrogen Energy, 2014, 39, 14247–14254 CrossRef CAS.
| This journal is © The Royal Society of Chemistry 2021 |

