
 Open Access Article
 This Open Access Article is licensed under a Creative Commons Attribution-Non Commercial 3.0 Unported Licence
Vibrational band-structures caused by internal rotations of the boron Wankel rotor B11−
Yonghong Xua,
Huihui Wangab,
Yonggang Yang *ab,
Changyong Liab,
Liantuan Xiaoab and
Suotang Jiaab
*ab,
Changyong Liab,
Liantuan Xiaoab and
Suotang Jiaab
aState Key Laboratory of Quantum Optics and Quantum Optics Devices, Institute of Laser Spectroscopy, Shanxi University, Taiyuan 030006, China. E-mail: ygyang@sxu.edu.cn
bCollaborative Innovation Center of Extreme Optics, Shanxi University, Taiyuan 030006, China
First published on 19th January 2021
Abstract
Nuclear quantum effects are often neglected for systems without hydrogen atoms. However some planar boron rotors turn out to exhibit remarkable nuclear quantum effects. Recent experiment on infrared spectroscopy of B13+ shows unexpected spectral broadening which still awaits physical explanation. Here we present quantitative investigations of the vibrational energy levels of B11− up to full dimension. A harmonic-bath averaged Hamiltonian suitable for planar boron rotors is constructed and used to predict typical types of vibrational states of B11−. Band structures caused by internal rotations are found for all the investigated vibrational states. The experimental phenomenon of spectral broadening is thus due to the band structures of the corresponding vibrational levels. The detailed information of the relevant vibrational states reported in the present work may provide valuable references for future investigations of high resolution spectroscopy of B11−.
1 Introduction
Molecular machines have been extensively investigated both experimentally and theoretically.1–3 The development of boron-based molecular machines, in particular molecular motors,4,5 is a promising research field. In 2010 the planar boron cluster B19− (ref. 6 and 7) was reported to behave like a molecular Wankel motor, in which the intramolecular rotation between the inner and the outer rings is almost barrierless. Soon later similar internal rotations were reported in B13+,8,9 B20−,10 and B218−.11 The above mentioned boron clusters have roughly circular shapes thus the internal rotations are expected to be kind of smooth. It was then found that elongated boron clusters B11− and B15+ also exhibit similar internal rotations.12,13 The elongated boron clusters were described as nanoscale tank treads and the reason for their fluxionality were further addressed by investigations on B10C.14 Recently the transition-metal-doped boron cluster NiB11− was also reported to exhibit internal rotation between its inner B3 ring and the outer B8 ring.15 In general the wide availability of boron-based molecular Wankel motors profits from the fact that most medium-sized boron clusters are planar or quasi-planar.16,17 The fluxionality of strong covalently bonded molecules such as the boron clusters was counterintuitive, but it was rationalized as a consequence of delocalized chemical bondings.4 A sufficiently large outer ring is important for such kind of internal rotations of boron clusters.5It should be noted that nuclear quantum effects are in general important for large amplitude motions18 such as the internal rotations of boron clusters.19–22 In 2017 a universal mechanism for the internal rotations of planar boron clusters B11−, B13+, B15+, and B19− was proposed,19 with explicit treatment of nuclear quantum effects. Accordingly the inner wheel of each boron cluster rotates with respect to its pseudo-rotating outer bearing.19 Rigorous study of nuclear quantum effects in medium to large molecules is challenging,23–26 in particular when there are large amplitude motions. For this purpose the reaction path/surface Hamiltonian which divides the system into a few large amplitude motions and many small amplitude harmonic vibrations is a good alternative.27,28 For reference a simplified one-dimensional reaction path Hamiltonian has been adopted in ref. 19, neglecting all the normal modes perpendicular to the reaction path, to predict band structures for the rotational/pseudo-rotational energy levels of B11−, B13+, B15+, and B19−. The first experimental infrared spectroscopy of B13+ shows unexpected broadening of some absorption bands,29 which is consistent with the picture of energy bands but different from isolated levels calculated by standard harmonic frequencies. To discover what is the possible reason behind the observed spectral broadening it is important to obtain the details of all the relevant vibrational levels with resolution up to internal rotations. For this purpose we need full dimensional treatment for the corresponding vibrational states which will deeply expand and improve the results and physical picture in ref. 19.
In the present work we will quantitatively investigate the vibrational energy bands of the planar boron rotor B11− using the intrinsic reaction path Hamiltonian. The nuclear quantum effects will be included up to full dimension. The relation between the intrinsic reaction path and the adopted reaction path in ref. 19 will be elucidated. The theory and methods for the Hamiltonian and vibrational states are in Section 2. The results and discussions are in Section 3 and the conclusions in Section 4.
2 Theory and methods
2.1 The intrinsic reaction path and coordinates
The global minimum (GM) and transition state (TS) structures of B11− are obtained using Gaussian09 suit of programs30 at the PBE0/6-311+G* level of theory.31 All the subsequent ab initio calculations are performed at the same level. B11− is a planar rotor. Due to the indistinguishability of identical boron atoms, there are in total 11! = 39, 916, 800 equivalent GMs. The number of accessible GMs is 18 by only considering the in-plane soft mode motions. They are connected cyclically by 18 TSs according to the following reaction mechanism
To get more details of the reaction we first locate the reaction path by the IRC (intrinsic reaction coordinate) calculations32 as implemented in Gaussian09. This will start with a TS and follow the steepest descent direction until finally reaching a GM. The reaction path can be mathematically defined by the structure R0(s) of B11− for each value of s. Here s is the intrinsic reaction coordinate which is a mass-weighted variable in units of  , where me is electron mass and a0 is Bohr radius. Thus the potential energy curve along the reaction path is V0(s) = V[R0(s)].
In ref. 19 the reaction path has been well approximated as the inner wheel (two inner atoms) rotating with respect to the outer bearing (namely the outer ring of nine atoms) accompanied by small amplitude reshaping of the outer bearing (known as pseudorotation33) to adapt to the inner wheel's rotation. In ref. 19 it was shown that the complete set of motions during this reaction (namely both the internal rotation and the pseudorotation) can be uniformally characterized by a single angle variable φ. Consequently either s or φ can be used as our reaction coordinate. The equivalence between s and φ will be discussed in Section 3.
An arbitrary structure of B11− can be characterized by a vector R with 3N = 33 cartesian components for the coordinates of N = 11 atoms. First of all we need to define the coordinates of arbitrary structures using our reaction coordinate φ. To simplify the things we use the molecular fixed frame with the origin at the center of mass and the orientations of the xyz-axes along the three principal axes of the moment of inertia. Consequently the three dimensional translation is separated and the three dimensional global rotation can be separated within a good approximation.
To define the coordinates of an arbitrary structure R, we need another 3N − 7 coordinates apart from φ. It is more convenient to use the corresponding mass-weighted coordinates ![[R with combining tilde]](https://www.rsc.org/images/entities/b_i_char_0052_0303.gif) . There are 3N − 7 vibrational motions perpendicular to the reaction path. For most of the processes which are of interest, the perpendicular vibrations have small amplitudes. Therefore it is convenient to introduce the normal modes. Specifically we need to define normal mode vectors êk(φ) on each grid φ of the reaction path. Subsequently the corresponding normal mode coordinates Qk can be defined.
. There are 3N − 7 vibrational motions perpendicular to the reaction path. For most of the processes which are of interest, the perpendicular vibrations have small amplitudes. Therefore it is convenient to introduce the normal modes. Specifically we need to define normal mode vectors êk(φ) on each grid φ of the reaction path. Subsequently the corresponding normal mode coordinates Qk can be defined.
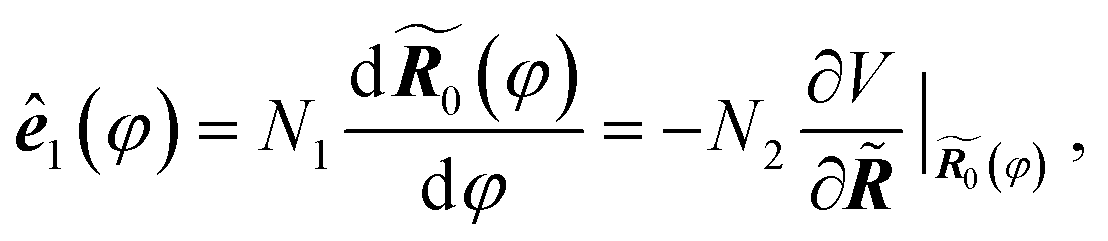
For convenience we denote the unit vector for the reaction coordinate, namely the tangent of the reaction path, as ê1(φ). By definition we have
 | (1) |
 and the Hessian matrix
  on each point of the reaction path R0(φ) which can be routinely obtained by quantum chemistry calculations. Note we use simplified notations
  and
and  for the force and Hessian matrix with corresponding components
  and
and  . The perpendicular normal mode vectors are
| êk(φ), k = 2, 3, …, 3N − 6. | (2) |
They are obtained by diagonalizing the projected Hessian matrix
 | (3) |
 | (4) |
Note all the ,  and Qk are mass-weighted coordinates.
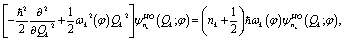
2.2 The reaction path Hamiltonian and vibrational states
The vibrational wavefunctions are
 | (5) |
According to ref. 34, the 3N − 7 perpendicular modes Q2, Q3, …, Q3N−6 form a harmonic bath which weakly affects the motions along the reaction coordinate φ. For convenience we define nb = (n2, n3, …, n3N−6) thus n = (n1, nb). Using similar adiabatic approximations in ref. 34 and 35, the wavefunctions are approximated as
 | (6) |
 parametrically depends on φ. Here
  is the nk-th eigenstate of the corresponding harmonic oscillator defined by
 | (7) |
| Hvib(φ,Q)ψvibn(φ,Q) = Enψvibn(φ,Q) | (8) |
 | (9) |
 is the harmonic-bath averaged (HBA) Hamiltonian adapted from ref. 34 and 35
 | (10) |
 | (11) |
 | (12) |
 | (13) |
 | (14) |
The central approximation of the HBA Hamiltonian is the adiabatic separation of the full dimensional wavefunction in eqn (6). The adiabatic approximation will be questionable if the motions along the reaction coordinate(s) are not slow compared to the perpendicular vibrations of normal modes. In this case it is not recommended to use the HBA Hamiltonian. Another condition which should be fulfilled is weak mode-coupling since the HBA Hamiltonian is truncated to the second order of the coupling parameters Blk(φ) according to ref. 34. In most cases we may use reaction coordinate(s) to characterise large amplitude motions. Large amplitude may corresponds to long period and thus implies relatively good adiabatic separation. On the other hand the couplings may be decreased with suitable definitions of reaction coordinate(s). For the present reaction of internal rotations of B11−, it is suitable to use the HBA Hamiltonian for vibrational analysis.
3 Results and discussions
3.1 The reaction path and the harmonic-bath averaged Hamiltonian
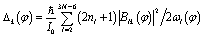
The intrinsic reaction path R0(s) obtained from IRC calculations for one-step reaction GM18 ⇌ GM1 is shown in Fig. 1a. Each point in Fig. 1a stands for a boron atom and different boron atoms for a given structure are distinguished by different color. The potential energy curve V0(s) along the reaction path is shown in Fig. 1b. To gain more insights into the reaction mechanism, the normal modes (from diagonalization of unprojected Hessian matrix) which correlate with motions along the reaction path are shown in Fig. 1c (TS18,1) and Fig. 1d (GM1). The corresponding normal mode is the one with the imaginary frequency for TS18,1 and the lowest-frequency in-plane mode for GM1. The rather good correlation between the IRC in Fig. 1a and a single normal mode imply weak couplings between the reaction coordinate and the perpendicular normal modes. | ||
Fig. 1 The intrinsic reaction path and the associated normal modes. (a) The reaction path for the reaction GM18 ⇌ TS18,1 ⇌ GM1 of B11− obtained by IRC calculations using Gaussian09. (b) The potential energy curve V0(s) along the reaction path. The corresponding domain for s is  . (c) and (d) The normal modes of the TS18,1 (c) and GM1 (d) which correlate with the motions along the reaction path. . (c) and (d) The normal modes of the TS18,1 (c) and GM1 (d) which correlate with the motions along the reaction path. | ||
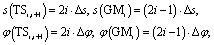
We define the molecule to be in the xy-plane. According to ref. 19 the structure of TS1,2 can be obtained by rotating TS18,1 around the z-axis by 20° + 180° = 200°. In terms of the reaction coordinate φ, from TS18,1 to TS1,2 corresponds to the internal rotation of the inner wheel with respect to the outer bearing around the z-axis by φ = 20° accompanied by small amplitude motions of the outer bearing atoms (pseudorotations).
To be more specific, we use two angles φr and φb to characterize the rotations of the wheel and bearing, respectively. The corresponding moments of inertia for the wheel and bearing are Ir and Ib, respectively. The internal rotational angle is thus φ = φr − φb. For φ = 20°, we have  and
and  . Thus we can get TS1,2 by first rotating the inner wheel of TS18,1 around z-axis by 20° with corresponding small adaptions of outer bearing. Then perform a global rotation around z-axis by −0.68°. An equivalent way to obtain TS1,2 from TS18,1 is thus a simple global rotation around z-axis by 200°–0.68° = 199.32°. In this way we generate all the 18 TSs and obtain the full reaction path shown in Fig. 2a. The corresponding potential energy curve V0(s), or equivalently V0(φ), is shown in Fig. 2b with potential barrier ΔVb = 225.65 hc cm−1.
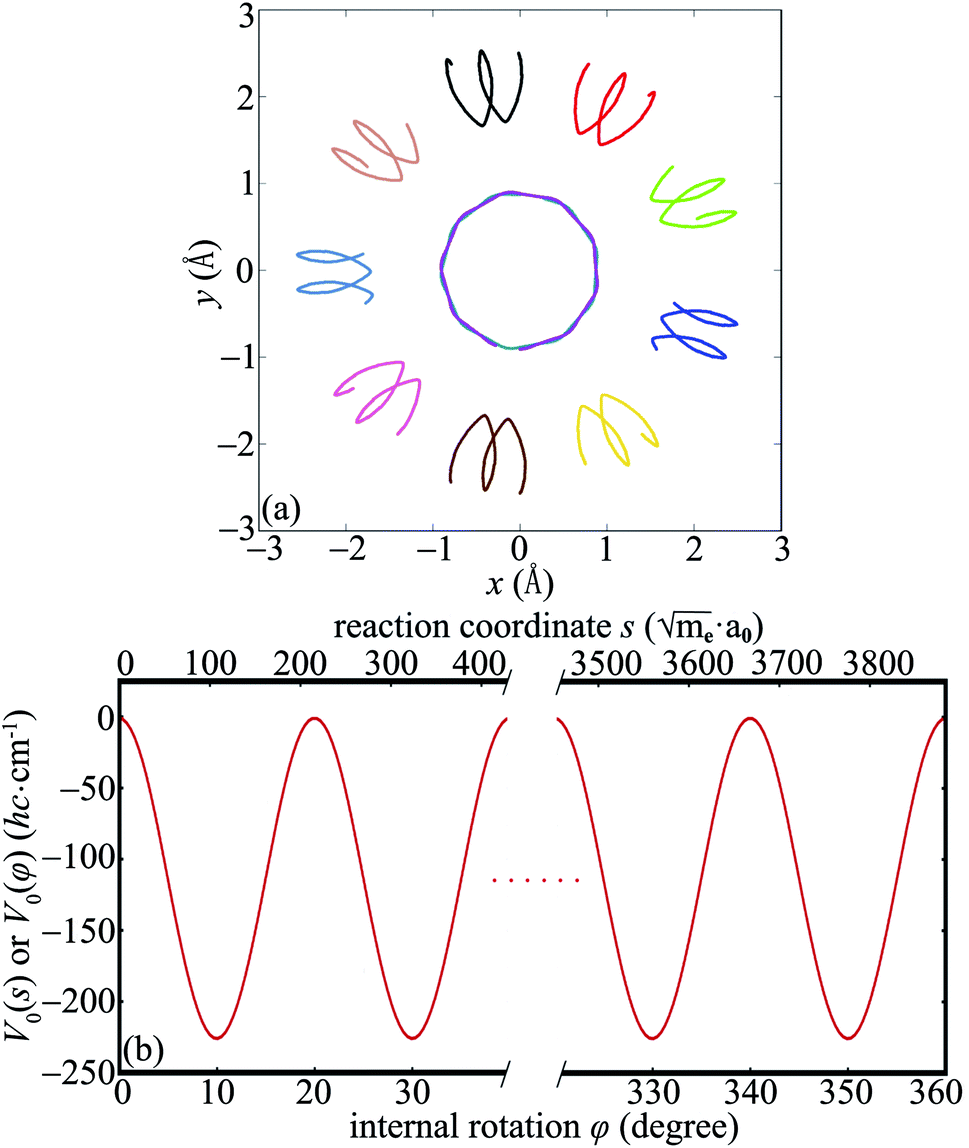 | ||
| Fig. 2 The full cycle of the reaction path and the corresponding potential energy curve. (a) The reaction path for the reaction TS18,1 ⇌ GM1 ⇌ TS1,2 ⇌ GM2 … ⇌ GM18 ⇌ TS18,1. Note the initial TS18,1 and the last TS18,1 are different in the orientations by a small angle. This is because internal rotation of φ = 360° is accompanied by a small-angle global rotation. (b) The corresponding potential energy curve along the reaction path. Two equivalent coordinates are indicated in the upper and lower abscissas for the intrinsic reaction coordinate s and the internal rotation φ, respectively. | ||
In Fig. 2b we use two coordinates to characterize the same reaction. One is the intrinsic reaction coordinate s from ab initio calculations. The other one is the internal rotation φ defined in ref. 19. It is straightforward to obtain the following relations:
 | (15) |
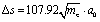 and Δφ = 10°. Within a good approximation the two variables s and φ can be linearly transformed by s = kφ, with
 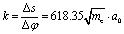 . The details can be found from the two abscissas of Fig. 2b. By considering the zero order kinetic energy of both cases we have
 | (16) |
 we can get the moment of inertia for φ as I0 = k2 = 3.82 × 10⁵me·a02 which agrees well with the reported value of 3.74 × 10⁵me·a02 in ref. 19. The good agreement further confirms the equivalence between the two coordinates s and φ.
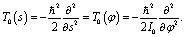
Up to now we have the complete information for the zero-order Hamiltonian H0(φ) = T0(φ) + V0(φ) up to an arbitrary energy reference which will be specified in Section 3.2. According to eqn (10), the zero-order Hamiltonian can be improved to the HBA Hamiltonian HHBA(φ) provided the zero-order moment of inertia and potential are replaced by Ieff(φ) and VHBA(φ), respectively. The details of  and Ieff(φ) are shown in Fig. 3 for typical sets of quantum numbers nb of the harmonic bath.
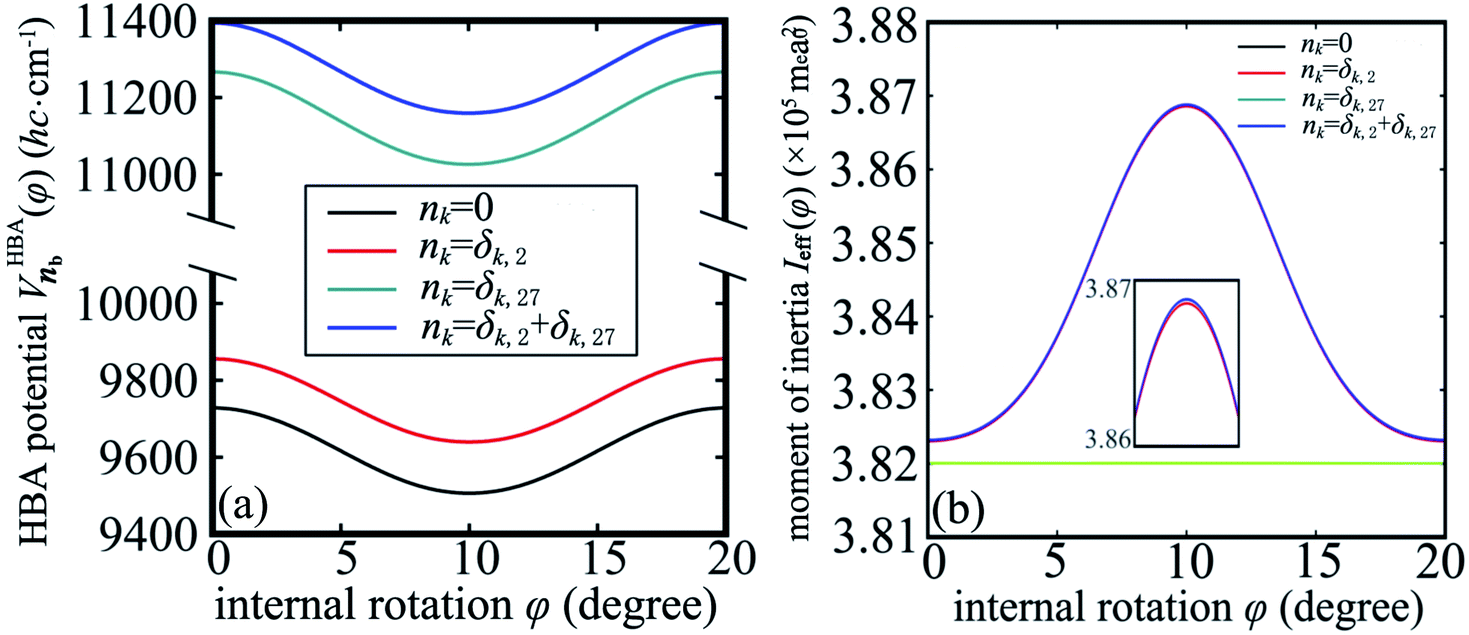 | ||
Fig. 3 (a) The potential  for the harmonic-bath averaged Hamiltonian in eqn (10) with given quantum numbers nb for the normal modes perpendicular to the reaction path. (b) The effective moment of inertia Ieff(φ) for the internal rotation with given quantum numbers nb. The green line indicates the zero-order moment of inertia I0. Four different cases of nb are investigated in both (a) and (b). for the harmonic-bath averaged Hamiltonian in eqn (10) with given quantum numbers nb for the normal modes perpendicular to the reaction path. (b) The effective moment of inertia Ieff(φ) for the internal rotation with given quantum numbers nb. The green line indicates the zero-order moment of inertia I0. Four different cases of nb are investigated in both (a) and (b). | ||
In the subsequent sections we selectively investigate three typical cases of the harmonic bath: the ground state, fundamental excitations, and combinational excitations. They can be identified by nb which includes all the quantum numbers nk for k ≥ 2. Specifically we choose four cases including the ground state for nk = 0, two fundamental excitations for nk = δk,2 and nk = δk,27, and one combinational excitation for nk = δk,2 + δk,27. Among all the 26 normal modes of the harmonic bath, the mode 2 and mode 27 are the lowest-frequency and the highest-frequency modes, respectively. Accordingly the HBA potential energy curves  for the four cases are shown in Fig. 3a. They all have similar shapes as the zero-order potential V0(φ) in Fig. 1b and 2b. However they include corrections caused by couplings between any pair of coordinates, cf. eqn (10)–(14). An apparent consequence of these couplings is that the HBA potential barrier will be modified. The corresponding potential barriers are 221.90, 216.46, 240.39, and 234.92hc cm−1 for nk = 0, δk,2, δk,27, and δk,2 + δk,27, respectively. Compared to the zero-order barrier of 225.65hc cm−1, the corresponding barriers are modified by −1.66%, −4.07%, 6.53%, and 4.11%, respectively. At first glance, the modifications of the HBA potential barriers are not large. However eigenenergies are in general rather sensitive to potential barriers. More details will be discussed in the subsequent sections.
Strictly speaking the effective moment of inertia Ieff(φ) also depends on the set of quantum numbers nb associated with the harmonic bath. However the dependence turns out to be negligible according to Fig. 3b. To simplify the notations we didn't explicitly write out the dependence of Ieff(φ) on nb. The differences of Ieff(φ) between the four studied cases are not noticable on the graphic scale of Fig. 3b. An enlarged plot for φ ∈ [8, 12] degrees is shown in the inset of Fig. 3b. Form the inset we can identify the extremely slight difference between nk = 0 and nk = δk,27. The contributions to Ieff(φ) from mode 2 is almost zero. Consequently the difference between nk = 0 and nk = δk,2 (or between nk = δk,27 and nk = δk,2 + δk,27) is not noticable even in the enlarged inset. The value for the zero-order moment of inertia I0 = 3.82 × 10⁵me·a02 is indicated as a horizonal line. The value of Ieff(φ) is always larger than I0 for arbitrary φ due to non-negative characteristics of the factor Δ1(φ) in eqn (12). In general the difference between Ieff(φ) and I0 is not large, which further validates eqn (10) for the present work.
3.2 The vibrational energy levels
Having the harmonic-bath averaged Hamiltonian at hand, we can calculate the corresponding eigenenergies of vibrational states with any quantum numbers n. Accordingly the eigenenergies for the four cases studied in Fig. 3 (namely four sets of nb = {nk, k ≥ 2}) are listed in Tables 1–4, respectively. In each table the lowest 36 eigenenergies are documented, which are labeled by the quantum number n1 associated with the reaction coordinate φ. In general the 36 energy levels form two energy bands. For each of the investigated cases, the lowest energy band consists of 18 levels which are 0 ≤ n1 ≤ 17 with a band width less than 2hc cm−1. While the second band for 18 ≤ n1 ≤ 35 has a band width more than 20hc cm−1. Between the two energy bands there is a fairly large band gap of about 100hc cm−1. Higher energy bands with levels above the barrier can also be calculated in the same spirit.
For detailed comparisons, the eigenenergies En calculated by three different models are reported in Tables 1–4. Apart from the HBA Hamiltonian, the other two are the harmonic approximation and the zero-order Hamiltonian, respectively. The harmonic energies are evaluated as  , where ωGMk = ωk(φ = 10°) is the corresponding harmonic frequency of the GM structure. Here n1 is set to zero and ω1 is the frequency of the mode shown in Fig. 1d. For convenient comparisons, the zero-order Hamiltonian is defined as
  to be consistent with the other two models in energy reference. Note the Hamiltonian used in ref. 19 is T0(φ) + V0(φ), which is essentially the same as H0(φ) except for different energy references.
The harmonic energy is listed in the second column of each table. The corresponding harmonic energy in Table 1, namely for the ground state, is the zero point energy. Apparently the zero point energy of 9580.6hc cm−1 is quite large. This large zero point energy is automatically included in all the reported values of eigenenergies in Tables 1–4 by the three models. The zero-order eigenenergies are essentially the same for all different cases of the harmonic bath, with detailed values listed in the third column of each table. The only difference between the third columns of any two tables is just a global shift of all energy levels. The ground state energy of 9581hc cm−1 is quite close to the harmonic value, which further confirms the good correlation between the normal mode in Fig. 1d and the internal rotation characterized in Fig. 1a and 2a. The eigenenergies obtained by diagonalization of the HBA Hamiltonian are listed in the fourth column of each table. In general the HBA energies are lower than the corresponding zero-order values. This is because the HBA Hamiltonian contains contributions from full dimensional motions of the molecule. Consequently the molecule has more freedom to relax, compared to the one-dimensional zero-order Hamiltonian. For example, the HBA ground state energy of 9569.66hc cm−1 is more stable than the corresponding zero-order level by 11.34hc cm−1.
| Quantum numbera n1 | Eigenenergyb En (hc cm−1) | HBA improvementsc of En (hc cm−1) | Excitation energy En − E0 (hc cm−1) | |||||
|---|---|---|---|---|---|---|---|---|
| Harmonic | H0 | HHBA | From VHBA | From Ieff | From HHBA | H0 | HHBA | |
| a Eigenenergies associated with the reaction coordinate φ are labelled with quantum number n1. The quantum number nk (k ≥ 2) is associated with the k-th normal mode.b Energies are calculated by three different models: the harmonic approximation, the zero-order Hamiltonian H0(φ) and the HBA Hamiltonian HHBA(φ) in eqn (10).c The improvements by HHBA(φ) with respect to H0(φ). | ||||||||
| 0 | 9580.60 | 9581.00 | 9569.66 | −11.14 | −0.20 | −11.34 | — | — |
| 1, 2 | — | 9581.05 | 9569.69 | −11.14 | −0.22 | −11.36 | 0.05 | 0.03 |
| 3, 4 | — | 9581.21 | 9569.83 | −11.14 | −0.25 | −11.38 | 0.21 | 0.17 |
| 5, 6 | — | 9581.46 | 9570.07 | −11.13 | −0.27 | −11.39 | 0.46 | 0.41 |
| 7, 8 | — | 9581.76 | 9570.35 | −11.12 | −0.29 | −11.41 | 0.76 | 0.69 |
| 9, 10 | — | 9582.10 | 9570.68 | −11.11 | −0.32 | −11.42 | 1.10 | 1.02 |
| 11, 12 | — | 9582.41 | 9570.98 | −11.10 | −0.34 | −11.43 | 1.41 | 1.32 |
| 13, 14 | — | 9582.68 | 9571.24 | −11.09 | −0.35 | −11.44 | 1.68 | 1.58 |
| 15, 16 | — | 9582.85 | 9571.41 | −11.08 | −0.36 | −11.44 | 1.85 | 1.75 |
| 17 | — | 9582.91 | 9571.47 | −11.08 | −0.37 | −11.44 | 1.91 | 1.81 |
| 18 | — | 9686.58 | 9673.75 | −12.47 | −0.36 | −12.83 | 105.58 | 104.09 |
| 19, 20 | — | 9687.08 | 9674.25 | −12.47 | −0.37 | −12.83 | 106.08 | 104.59 |
| 21, 22 | — | 9688.56 | 9675.72 | −12.45 | −0.39 | −12.84 | 107.56 | 106.06 |
| 23, 24 | — | 9690.95 | 9678.10 | −12.43 | −0.43 | −12.85 | 109.95 | 108.44 |
| 25, 26 | — | 9694.15 | 9681.28 | −12.40 | −0.48 | −12.87 | 113.15 | 111.62 |
| 27, 28 | — | 9697.99 | 9685.10 | −12.36 | −0.53 | −12.89 | 116.99 | 115.44 |
| 29, 30 | — | 9702.19 | 9689.28 | −12.31 | −0.60 | −12.91 | 121.19 | 119.62 |
| 31, 32 | — | 9706.28 | 9693.35 | −12.26 | −0.67 | −12.93 | 125.28 | 123.69 |
| 33, 34 | — | 9709.48 | 9696.54 | −12.21 | −0.73 | −12.94 | 128.48 | 126.88 |
| 35 | — | 9710.73 | 9697.79 | −12.19 | −0.76 | −12.94 | 129.73 | 128.13 |
To get further details on how large the HBA Hamiltonian makes improvements to the eigenenergies compared to the zero-order Hamiltonian, the differences between the values of the corresponding eigenenergies En obtained by the HBA and the zero-order Hamiltonians are documented in Column 7 of each table. In general all the energy levels are further stabilized due to the improvements from the HBA Hamiltonian. Specifically the eigenenergies En are improved due to the HBA potential VHBA and the moment of inertia Ieff. We further calculated the improvements solely by VHBA without Ieff, or solely by Ieff without VHBA. The corresponding results are shown in Column 5 and Column 6, respectively. The improvements of En from Ieff almost have no differences between the four cases, which is consistent with Fig. 3b. The improvements in Column 7 of each table can be well approximated as sum of the corresponding values in Columns 5 and 6. This is because the two factors VHBA and Ieff mainly affect potential energy and kinetic energy separately. Since Ieff is larger than I0, cf. Fig. 3b or eqn (11), the kinetic energy from the HBA Hamiltonian is lower than the zero-order case. Concerning the potential energy, the difference between VHBA and V0 contains two terms according to eqn (10). One term is ΔV(φ) in eqn (14). According to eqn (14), ΔV(φ) is negative and does not depends on quantum numbers nb of normal modes. For each of the reported energy levels the mean value of ΔV(φ) is about −100hc cm−1. The other term is the average energy of the 26 normal modes in terms of effective harmonic frequencies ωeffk(φ). According to eqn (11) each effective frequency ωeffk(φ) is larger than the original frequency ωk(φ). Consequently the contribution of this term to the total eigenenergy En is larger than the corresponding zero-order case. The sum of the above two potential energy terms leads to negative contributions for En (compared to zero-order) as shown in Column 5 of each table.
For possible comparisons with high-resolution experiments which may be measurable in the future, we further calculated the excitation energy En − E0 for each of the investigated states. The corresponding values are documented in the last two columns of Tables 1–4 for zero-order and HBA models, respectively. For the ground state harmonic bath (Table 1) all the excitation energies from HBA Hamiltonian are slightly redshifted compared to zero-order case. Similarly all the HBA excitation energies are redshifted by about 20hc cm−1 in Table 2 (fundamental excitation of mode 2). However, for the fundamental excitation of mode 27 in Table 3, all the HBA excitation energies are blueshifted by several wavenumbers. Then the combinational excitation case in Table 4 also exhibits redshifts for all the HBA excitation energies due to the competition between mode 2 and mode 27.
| Quantum number n1 | Eigenenergy En (hc cm−1) | HBA improvements of En (hc cm−1) | Excitation energy En − E0 (hc cm−1) | |||||
|---|---|---|---|---|---|---|---|---|
| Harmonic | H0 | HHBA | From VHBA | From Ieff | From HHBA | H0 | HHBA | |
| 0 | 9729.77 | 9730.17 | 9701.25 | −28.72 | −0.20 | −28.92 | 149.17 | 131.59 |
| 1, 2 | — | 9730.22 | 9701.29 | −28.72 | −0.22 | −28.93 | 149.22 | 131.63 |
| 3, 4 | — | 9730.38 | 9701.44 | −28.70 | −0.25 | −28.94 | 149.38 | 131.78 |
| 5, 6 | — | 9730.63 | 9701.69 | −28.68 | −0.27 | −28.94 | 149.63 | 132.03 |
| 7, 8 | — | 9730.94 | 9702.00 | −28.65 | −0.29 | −28.94 | 149.94 | 132.34 |
| 9, 10 | — | 9731.27 | 9702.34 | −28.62 | −0.32 | −28.93 | 150.27 | 132.68 |
| 11, 12 | — | 9731.59 | 9702.66 | −28.59 | −0.34 | −28.92 | 150.59 | 133.00 |
| 13, 14 | — | 9731.85 | 9702.94 | −28.57 | −0.35 | −28.91 | 150.85 | 133.28 |
| 15, 16 | — | 9732.02 | 9703.12 | −28.55 | −0.36 | −28.90 | 151.02 | 133.46 |
| 17 | — | 9732.08 | 9703.18 | −28.55 | −0.37 | −28.90 | 151.08 | 133.52 |
| 18 | — | 9835.75 | 9803.16 | −32.25 | −0.36 | −32.60 | 254.75 | 233.50 |
| 19, 20 | — | 9836.25 | 9803.66 | −32.23 | −0.37 | −32.59 | 255.25 | 234.00 |
| 21, 22 | — | 9837.73 | 9805.16 | −32.19 | −0.39 | −32.57 | 256.73 | 235.50 |
| 23, 24 | — | 9840.12 | 9807.58 | −32.13 | −0.43 | −32.54 | 259.12 | 237.92 |
| 25, 26 | — | 9843.32 | 9810.82 | −32.03 | −0.48 | −32.50 | 262.32 | 241.16 |
| 27, 28 | — | 9847.16 | 9814.72 | −31.92 | −0.53 | −32.44 | 266.16 | 245.06 |
| 29, 30 | — | 9851.36 | 9819.00 | −31.77 | −0.60 | −32.36 | 270.36 | 249.34 |
| 31, 32 | — | 9855.45 | 9823.19 | −31.61 | −0.67 | −32.27 | 274.45 | 253.53 |
| 33, 34 | — | 9858.65 | 9826.48 | −31.45 | −0.73 | −32.17 | 277.65 | 256.82 |
| 35 | — | 9859.90 | 9827.78 | −31.38 | −0.76 | −32.12 | 278.90 | 258.12 |
| Quantum number n1 | Eigenenergy En (hc cm−1) | HBA improvements of En (hc cm−1) | Excitation energy En − E0 (hc cm−1) | |||||
|---|---|---|---|---|---|---|---|---|
| Harmonic | H0 | HHBA | From VHBA | From Ieff | From HHBA | H0 | HHBA | |
| 0 | 11![[thin space (1/6-em)]](https://www.rsc.org/images/entities/char_2009.gif) 096.46 096.46 |
11096.85 |
11090.25 |
−6.39 | −0.20 | −6.60 | 1515.86 | 1520.59 |
| 1, 2 | — | 11096.91 |
11090.28 |
−6.40 | −0.23 | −6.63 | 1515.91 | 1520.62 |
| 3, 4 | — | 11097.07 |
11090.40 |
−6.42 | −0.25 | −6.67 | 1516.07 | 1520.74 |
| 5, 6 | — | 11097.32 |
11090.59 |
−6.44 | −0.27 | −6.72 | 1516.32 | 1520.93 |
| 7, 8 | — | 11097.62 |
11090.84 |
−6.48 | −0.30 | −6.78 | 1516.62 | 1521.18 |
| 9, 10 | — | 11097.95 |
11091.12 |
−6.51 | −0.32 | −6.84 | 1516.95 | 1521.46 |
| 11, 12 | — | 11098.27 |
11091.38 |
−6.55 | −0.34 | −6.89 | 1517.27 | 1521.72 |
| 13, 14 | — | 11098.54 |
11091.60 |
−6.58 | −0.35 | −6.94 | 1517.54 | 1521.94 |
| 15, 16 | — | 11098.71 |
11091.74 |
−6.60 | −0.36 | −6.96 | 1517.71 | 1522.08 |
| 17 | — | 11098.77 |
11091.79 |
−6.61 | −0.37 | −6.98 | 1517.77 | 1522.13 |
| 18 | — | 11202.44 |
11199.17 |
−2.87 | −0.37 | −3.27 | 1621.44 | 1629.51 |
| 19, 20 | — | 11202.94 |
11199.63 |
−2.90 | −0.37 | −3.31 | 1621.94 | 1629.97 |
| 21, 22 | — | 11204.41 |
11200.98 |
−3.00 | −0.39 | −3.43 | 1623.41 | 1631.32 |
| 23, 24 | — | 11206.80 |
11203.17 |
−3.17 | −0.43 | −3.64 | 1625.80 | 1633.51 |
| 25, 26 | — | 11210.00 |
11206.07 |
−3.41 | −0.48 | −3.93 | 1629.00 | 1636.41 |
| 27, 28 | — | 11213.84 |
11209.53 |
−3.74 | −0.54 | −4.32 | 1632.84 | 1639.87 |
| 29, 30 | — | 11218.05 |
11213.24 |
−4.17 | −0.61 | −4.81 | 1637.05 | 1643.58 |
| 31, 32 | — | 11222.14 |
11216.75 |
−4.68 | −0.68 | −5.39 | 1641.14 | 1647.09 |
| 33, 34 | — | 11225.33 |
11219.40 |
−5.17 | −0.74 | −5.93 | 1644.33 | 1649.74 |
| 35 | — | 11226.59 |
11220.41 |
−5.39 | −0.76 | −6.18 | 1645.59 | 1650.75 |
| Quantum number n1 | Eigenenergy En (hc cm−1) | HBA improvements of En (hc cm−1) | Excitation energy En − E0 (hc cm−1) | |||||
|---|---|---|---|---|---|---|---|---|
| Harmonic | H0 | HHBA | From VHBA | From Ieff | From HHBA | H0 | HHBA | |
| 0 | 11245.63 |
11246.03 |
11221.88 |
−23.94 | −0.20 | −24.14 | 1665.03 | 1652.22 |
| 1, 2 | — | 11246.08 |
11221.91 |
−23.94 | −0.23 | −24.17 | 1665.08 | 1652.25 |
| 3, 4 | — | 11246.24 |
11222.04 |
−23.95 | −0.25 | −24.20 | 1665.24 | 1652.38 |
| 5, 6 | — | 11246.49 |
11222.25 |
−23.97 | −0.27 | −24.24 | 1665.49 | 1652.59 |
| 7, 8 | — | 11246.79 |
11222.52 |
−23.98 | −0.30 | −24.28 | 1665.79 | 1652.86 |
| 9, 10 | — | 11247.13 |
11222.81 |
−24.00 | −0.32 | −24.32 | 1666.13 | 1653.15 |
| 11, 12 | — | 11247.44 |
11223.08 |
−24.02 | −0.34 | −24.36 | 1666.44 | 1653.42 |
| 13, 14 | — | 11247.71 |
11223.32 |
−24.04 | −0.35 | −24.39 | 1666.71 | 1653.66 |
| 15, 16 | — | 11247.88 |
11223.47 |
−24.05 | −0.36 | −24.41 | 1666.88 | 1653.81 |
| 17 | — | 11247.94 |
11223.52 |
−24.05 | −0.37 | −24.42 | 1666.94 | 1653.86 |
| 18 | — | 11351.61 |
11328.66 |
−22.56 | −0.37 | −22.95 | 1770.61 | 1759.00 |
| 19, 20 | — | 11352.11 |
11329.13 |
−22.59 | −0.37 | −22.99 | 1771.11 | 1759.47 |
| 21, 22 | — | 11353.58 |
11330.50 |
−22.66 | −0.39 | −23.08 | 1772.58 | 1760.84 |
| 23, 24 | — | 11355.97 |
11332.73 |
−22.78 | −0.43 | −23.24 | 1774.97 | 1763.07 |
| 25, 26 | — | 11359.17 |
11335.70 |
−22.97 | −0.48 | −23.47 | 1778.17 | 1766.04 |
| 27, 28 | — | 11363.01 |
11339.23 |
−23.22 | −0.54 | −23.79 | 1782.01 | 1769.57 |
| 29, 30 | — | 11367.22 |
11343.03 |
−23.56 | −0.61 | −24.19 | 1786.22 | 1773.37 |
| 31, 32 | — | 11371.31 |
11346.65 |
−23.97 | −0.68 | −24.67 | 1790.31 | 1776.99 |
| 33, 34 | — | 11374.50 |
11349.38 |
−24.37 | −0.74 | −25.12 | 1793.50 | 1779.72 |
| 35 | — | 11375.76 |
11350.43 |
−24.55 | −0.76 | −25.33 | 1794.76 | 1780.77 |
To deeply investigate the properties of the energy bands, we can arrange the four studied cases in terms of barrier heights. Consequently we have Tables 2, 1, 4, and 3 with barrier heights in ascending order: 216.46, 221.90, 234.92, and 240.39hc cm−1, respectively. Note we only focus on results of the HBA model for the time being. In this order the band widths of the lowest energy band are 1.93, 1.81, 1.64, and 1.54hc cm−1, respectively. The band widths of the second energy band are 24.62, 24.04, 21.77, and 21.24hc cm−1, respectively. Clearly the band width decreases when the barrier height increases, for both the lowest and the second energy bands. While the corresponding band gaps are 99.98, 102.28, 105.14, and 107.38hc cm−1, respectively. The band gap increases when the barrier height increases. Since the differences between the effective moment of inertia are negligible, cf. Fig. 3b, the behavior of the band structures can be predicted and explained purely in terms of the barrier heights. The band gap can be approximately estimated as the fundamental excitation energy for an isolated potential well. Higher barrier leads to larger curvature of the potential well, which in turn has higher fundamental transition frequency. The band width is determined by tunnelling between neighbouring potential wells. Higher barrier leads to smaller tunnelling probability and consequently to narrower band width. For infinitely high barrier, tunnelling is prohibited thus the band width would be zero. Harmonic approximation corresponds to the case of infinitely high barrier so that the system would be located in a single potential well. In this case the unexpected spectral broadening observed in ref. 29 would disappear. However in reality the barrier is rather low. Consequently tunnelling between neighboring potential wells gives rise to fairly large tunnelling splittings which appear as band widths of vibrational levels. The phenomenon happens essentially in all the relevant vibrational levels, which leads to spectral broadening of the infrared spectra.
4 Conclusions
Nuclear quantum effects beyond harmonic approximation are important for boron Wankel rotors. A simplified one-dimensional model in ref. 19 predicts rotational/pseudo-rotational energy bands which triggers full dimensional quantum mechanical investigations to unravel the origin of the line broadening of recent infrared spectra.29 In the present work we construct a practical harmonic-bath averaged Hamiltonian and calculate the eigenenergies of relevant vibrational states, starting from a full dimensional reaction path Hamiltonian using the cyclic intrinsic reaction coordinate. Typical vibrational states including cases of ground-state, fundamental, and combinational excitations of normal modes are investigated. All the calculated energy levels associated with the internal rotations of B11− are improved compared to the one dimensional results in ref. 19 for the case of ground-state normal modes. The present work further includes analysis of typical excitations of normal modes. Different mode excitations are found to have negligible effects on the moment of inertia but do have some influence on the effective potential for the internal rotation. The height of the potential barrier is modified due to mode excitations which in turn changes the details of the energy bands. With increasing barrier the band width decreases and the band gap increases. For all the investigated vibrational states, the lowest and second energy bands have band widths ranging from 1.5 to 2.0hc cm−1 and from 21 to 25hc cm−1, respectively. The corresponding band gaps ranges from 99 to 108hc cm−1. We find that the observed phenomenon of spectral broadening in ref. 29 is due to the band structures of the vibrational levels of boron rotors. The observed spectral broadening will be narrowed provided all the 10B atoms are substituted by 11B atoms. Heavier boron atoms lead to smaller tunnelling probability and consequently to a narrower band width for each energy band. This isotope effects can be observed by infrared experiments provided the resolution is sufficiently high. The reported quantitative energy levels in this paper may provide valuable references for future related investigations of high resolution spectroscopy. In addition the present method can be applied to study vibrational states of other medium to large molecules which may be rather challenging for typical full dimensional quantum dynamics calculations.Author contributions
Y. Y. provided the concept and the model; Y. X. carried out the calculations, obtained the results, and prepared the figures; Y. Y. wrote the first draft of the manuscript. All coauthors contributed to the final version of the manuscript.Conflicts of interest
There are no conflicts of interest to declare.Acknowledgements
We would like to express our gratitude to Professor Jörn Manz (Berlin), Professor Si-Dian Li (Taiyuan), and Professor Hua-Jin Zhai (Taiyuan) for stimulating discussions and careful reading of the manuscript. This work profits from financial support, in part by the National Key Research and Development Program of China (2017YFA0304203), the Program for Changjiang Scholars and Innovative Research Team (IRT_17R70), the National Natural Science Foundation of China (11904215), the 111 project (Grant No. D18001), the Fund for Shanxi 1331 Project Key Subjects Construction, and the Hundred Talent Program of Shanxi Province.References
- B. A. Feringa, Angew. Chem., Int. Ed., 2017, 56, 11060–11078 CrossRef CAS.
- J.-P. Sauvage, Angew. Chem., Int. Ed., 2017, 56, 11080–11093 CrossRef CAS.
- J. F. Stoddart, Angew. Chem., Int. Ed., 2017, 56, 11094–11125 CrossRef CAS.
- S. Pan, J. Barroso, S. Jalife, T. Heine, K. R. Asmis and G. Merino, Acc. Chem. Res., 2019, 52, 2732–2744 CrossRef CAS.
- S. Jalife, L. Liu, S. Pan, J. L. Cabellos, E. Osorio, C. Lu, T. Heine, K. J. Donald and G. Merino, Nanoscale, 2016, 8, 17639–17644 RSC.
- W. Huang, A. P. Sergeeva, H.-J. Zhai, B. B. Averkiev, L.-S. Wang and A. I. Boldyrev, Nat. Chem., 2010, 2, 202–206 CrossRef CAS.
- J. O. C. Jiménez-Halla, R. Islas, T. Heine and G. Merino, Angew. Chem., Int. Ed., 2010, 49, 5668–5671 CrossRef.
- G. Martinez-Guajardo, A. P. Sergeeva, A. I. Boldyrev, T. Heine, J. M. Ugalde and G. Merino, Chem. Commun., 2011, 47, 6242–6244 RSC.
- J. Zhang, A. P. Sergeeva, M. Sparta and A. N. Alexandrova, Angew. Chem., Int. Ed., 2012, 51, 8512–8515 CrossRef CAS.
- T. B. Tai, A. Ceulemans and M. T. Nguyen, Chem.–Eur. J., 2012, 18, 4510–4512 CrossRef CAS.
- D. Moreno, S. Pan, L. L. Zeonjuk, R. Islas, E. Osorio, G. Martinez-Guajardo, P. K. Chattaraj, T. Heine and G. Merino, Chem. Commun., 2014, 50, 8140–8143 RSC.
- Y.-J. Wang, X.-Y. Zhao, Q. Chen, H.-J. Zhai and S.-D. Li, Nanoscale, 2015, 7, 16054–16060 RSC.
- Y.-J. Wang, X.-R. You, Q. Chen, L.-Y. Feng, K. Wang, T. Ou, X.-Y. Zhao, H.-J. Zhai and S.-D. Li, Phys. Chem. Chem. Phys., 2016, 18, 15774–15782 RSC.
- Y.-J. Wang, J.-C. Guo and H.-J. Zhai, Nanoscale, 2017, 9, 9310–9316 RSC.
- X.-Y. Zhao, X.-M. Luo, X.-X. Tian, H.-G. Lu and S.-D. Li, J. Cluster Sci., 2019, 30, 115–121 CrossRef CAS.
- W.-L. Li, X. Chen, T. Jian, T.-T. Chen, J. Li and L.-S. Wang, Nat. Rev. Chem., 2017, 1, 0071 CrossRef CAS.
- Q. Chen, T.-T. Chen, H.-R. Li, X.-Y. Zhao, W.-J. Chen, H.-J. Zhai, S.-D. Li and L.-S. Wang, Nanoscale, 2019, 11, 9698–9704 RSC.
- E. T. Markland and M. Ceriotti, Nat. Rev. Chem., 2018, 2, 0109 CrossRef.
- Y. Yang, D. Jia, Y.-J. Wang, H.-J. Zhai, Y. Man and S.-D. Li, Nanoscale, 2017, 9, 1443–1448 RSC.
- D. Jia, J. Manz and Y. Yang, AIP Adv., 2018, 8, 045222 CrossRef.
- T. Grohmann and J. Manz, Mol. Phys., 2018, 116, 2538–2555 CrossRef CAS.
- T. Grohmann, D. Haase, D. Jia, J. Manz and Y. Yang, J. Chem. Phys., 2018, 149, 184302 CrossRef.
- Y. Yang and O. Kühn, Mol. Phys., 2008, 106, 2445–2457 CrossRef CAS.
- V. May and O. Kühn, Charge and Energy Transfer Dynamics in Molecular Systems, WILEY-VCH Verlag GmbH & Co. KGaA, Weinheim, 3rd edn, 2011 Search PubMed.
- Molecular Quantum Dynamics, ed. F. Gatti, Springer-Verlag, Heidelberg, 2014 Search PubMed.
- C. Fábri, R. Marquardt, A. G. Császár and M. Quack, J. Chem. Phys., 2019, 150, 014102 CrossRef.
- W. H. Miller, N. C. Handy and J. E. Adams, J. Chem. Phys., 1980, 72, 99–112 CrossRef CAS.
- T. Carrington Jr and W. H. Miller, J. Chem. Phys., 1984, 81, 3942–3950 CrossRef.
- M. R. Fagiani, X. Song, P. Petkov, S. Debnath, S. Gewinner, W. Schöllkopf, T. Heine, A. Fielicke and K. R. Asmis, Angew. Chem., Int. Ed., 2017, 56, 501–504 CrossRef CAS.
- M. J. Frisch, G. W. Trucks and H. B. Schlegel, et al., Gaussian 09, Revision B.01, Gaussian Inc., Wallingford, CT, 2009 Search PubMed.
- C. Adamo and V. Barone, J. Chem. Phys., 1999, 110, 6158–6170 CrossRef CAS.
- K. Fukui, Acc. Chem. Res., 1981, 14, 471–476 CrossRef.
- J. Manz, J. Am. Chem. Soc., 1980, 102, 1801–1806 CrossRef CAS.
- Y. Yang and M. Meuwly, J. Chem. Phys., 2010, 133, 064503 CrossRef.
- Y. Yang, X. Liu, M. Meuwly, L. Xiao and S. Jia, J. Phys. Chem. A, 2012, 116, 11134–11139 CrossRef CAS.
| This journal is © The Royal Society of Chemistry 2021 |