
 Open Access Article
 This Open Access Article is licensed under a Creative Commons Attribution-Non Commercial 3.0 Unported Licence
Enzymatic hydrolysis using bacterial cultures as a novel method for obtaining antioxidant peptides from brewers' spent grain†
Dominika Ciurko *,
Wojciech Łaba,
Barbara Żarowska and
Tomasz Janek
*,
Wojciech Łaba,
Barbara Żarowska and
Tomasz Janek
Wrocław University of Environmental and Life Sciences, Department of Biotechnology and Food Microbiology, Faculty of Biotechnology and Food Science, J. Chełmońskiego 37, 51-630 Wrocław, Poland. E-mail: wojciech.laba@upwr.edu.pl; barbara.zarowska@upwr.edu.pl; tomasz.janek@upwr.edu.pl; dominika.ciurko@upwr.edu.pl; Tel: +48 71 320 7723
First published on 25th January 2021
Abstract
Brewers' spent grain was used as a substrate to obtain protein hydrolysates with antioxidant activity. Hydrolysis was conducted in the culture using proteolytic bacteria. Hydrolysis was controlled by measurement of α-amino group concentration and with the aid of size exclusion chromatography. For each culture the degree of hydrolysis was calculated. The most efficient protein hydrolysis was observed in the cultures of Bacillus cereus (43.06%) and Bacillus lentus (41.81%). In addition, gelatin zymography was performed in order to detect bacterial proteases and their activity. The profile of secreted enzymes was heterogeneous, while the greatest variety was observed for Bacillus polymyxa. Brewers' spent grain protein hydrolysates exhibited high antioxidant activity. Bacillus subtilis and Bacillus cereus post-cultured media displayed the highest activity, respectively 1291.97 and 1621.31 μM TEAC per g for ABTS, 188.89 and 160.93 μM TEAC per g for DPPH, and 248.81 and 284.08 μM TEAC per g for the FRAP method.
1. Introduction
Barley, as well as hops, water and yeast, is a basic raw material used in the traditional approach to beer production. Grain of barley consists of three main parts: the germ (embryo), the endosperm (comprising the aleurone and starchy endosperm) and grain coverings divided into three fractions: seed coat, pericarp layers and husk. As a result of the brewing process, consisting of malting and mashing stages, barley's grains are transformed into fermentation medium to produce beer, known as wort. However, the brewing process is selective and allows only for the utilization of those nutrients necessary to produce the wort, while water-insoluble proteins and the cell wall residues of grain are rejected.1 This residual, solid fraction is called ‘brewers’ spent grain’ (BSG) and is primarily composed of cellulose (17%), non-cellulosic polysaccharides (28%) and lignin (28%). Moreover, the presence of significant quantities of lipids, vitamins, minerals, phenolic acids and proteins (20%) has been confirmed by numerous studies.2The BSG protein fraction is composed of barley hordeins, glutelins, globulins and albumins.3 The hordein fraction comprises approximately 35–55% of the total barley proteins and is considered as the main storage proteins. Barley glutelins, the second major fraction, constitute around 35–45% of the total storage proteins. The glutelin fraction is distinguished by high proportions of glutamine/glutamic acid (20.2%), and glycine (8.4%) and high concentration of hydrophobic amino acids (35%) among which proline (11.2%), leucine (8.0%), alanine (6.3%) and valine (6.1%) are dominant.4 Globulins and albumins represent functional and nutritional significance of a barley grain. Globulins are built mostly of glutamine/glutamic acid, glycine, asparagines/aspartic acid, leucin and alanin.5
Barley is a conventional raw material used in beer production. It is estimated that approximately 16% of the annual world barley production is used in malting.6 However, the consumer preferences have changed over the year. In the last few years, the expansion of craft and home brewing has added to the demand for wheat beers. In addition, more attention is paid to the international breweries producing wheat beer.7 An excellent example is the German market, where wheat beer production nearly doubled from 1990 to 2009. Currently, one out of every ten beers sold in Germany is a wheat beer.8
Wheat protein content ranges from 6 to 20%, depending on the variety and environmental conditions during growth. While barley grain contains mostly low-molecular weight protein, the wheat protein fraction is mainly built of high-molecular-weight molecules, classified into two groups: the storage and cytoplasmic proteins. Albumins and globulins, included in the second group, account for about 15–20% of the total protein content. Their function is to maintain physiological activity of grain.8 Gliadins and glutenins represent two types of storage proteins collectively known as prolamins, due to the high content of proline and glutamine. Wheat gliadins account for about 30% of the total grain protein and occur in the monomeric form.9 Glutenins account for about 35% of the total protein content and belong to the group of the largest molecules found in nature, due to molecular weight exceeding one million.10
Current research trends show that a growing number of researchers are engaged in exploration of new methods for BSG protein utilization. It seems to be justified due to the growing BSG production, high average protein concentration (20%) and by the fact that approximately 65% of the total malt proteins are retained in the BSG structure.3 Numerous studies focused on the use of BSG proteins to produce hydrolysates with significant biological activity.11–13 However, there is a large variety of methods commonly used by researchers. One of the best known is based on the production of BSG protein-enriched isolate in the first stage of the process, followed by hydrolysis conducted by use of commercially available enzymes such as Alcalase, Corolase PP, Flavourzyme, Promod 144MG. In this case, the first stage of research, production of protein cocktail, is usually performed by use of alkaline extraction.14 Another widely use method replaces enzymatic hydrolysis of BSG proteins with acid precipitation.11 A completely different approach to BSG protein solubilization was applied by Treimo et al.,15 in whose research the BSG protein fraction was extracted as a result of the combined action of carbohydrases (Depol740 and Econase) and peptidase (Alcalase and Promod 439).
Bacterial hydrolysis, another approach allowing for the exploitation of BSG proteins in various scientific fields, was scrupulously explored by researchers. In the study of Kotlar et al.16 the optimal conditions for the enzymatic hydrolysis of BSG performed by Bacillus cereus strain were defined, including the storage and sterilization conditions, medium composition and the enzyme source as parameters affecting the microbial-mediated processing of BSG. As the research demonstrated, the drying of BSG at 60 °C for 24–48 h was the most beneficial method to provide storage stability, whereas autoclaving was the best treatment for microbial inactivation, providing an additional positive effect on the proteolytic activity, due to the thermal coagulation of some BSG proteins. The optimal medium composition for the protein solubilization included 36% of pretreated BSG. The process proceeded more effectively with the participation of crude enzyme extract, rather than with the same concentration of fresh culture.
In other research, Łaba et al.17 investigated the impact of BSG medium composition on protease production and protein solubilization in cultures of B. cereus PCM 2849 and B. subtilis PCM 2850. There were significant differences between the two tested strains. The former exhibited nearly five times higher proteolytic activity in the BSG medium with minerals (MgSO4, KH2PO4, FeSO4·7H2O, CaCl2) than in the medium without minerals. Oppositely, in the culture of the latter, a significant difference in the proteolytic activity was not observed, whereas better results were obtained in the culture conducted without minerals.
In the present study, BSG proteins are hydrolyzed directly in the bacterial cultures in order to obtain protein hydrolysates with significant biological activity. This simple procedure, facilitate the utilization of the total raw material as a medium for bacterial growth. Sugars, lipids, vitamins and minerals included in BSG structure allow the proper development of bacterial cultures. The great advantage of this approach is the ability to skip the protein extraction procedure, due to the multi-functional nature of microorganisms. It entails relevant reduction of economic cost and workload.
The BSG used in this research represents a unique raw material because of being a mixture of the insoluble part of wheat and barley grain. Therefore, the profile of compounds obtained as a result of proteolysis may be more diverse. Such a procedure increases the opportunity to obtain heterogenic mixture of biologically active compounds.
2. Materials and methods
2.1. Chemicals
Luria-Bertani (LB) broth was purchased from Sigma (Sigma-Aldrich, Schnelldorf (Germany)), De Man, Rogosa and Sharpe (MRS) broth and Tryptic Soy (TSB) broth were purchased from Sigma (Millipore, Schnelldorf (Germany)). Folin & Ciocalteu's Phenol Reagent (FC reagent), Triton X-100 (laboratory grade), sodium dodecyl sulfate (SDS; (≥99%)), 2,2′-azino-bis(3-ethylbenzothiazoline-6-sulfonic acid) (ABTS; (≥98%)), potassium peroxodisulfate (≥99%), 2,2-diphenyl-1-picrylhydrazyl (DPPH), 6-hydroxy-2,5,7,8-tetramethylchroman-2-carboxylic acid (Trolox; (≥97%)), iron(III) chloride hexahydrate (FeCl3 × 6H2O; (≥97%)), and protease from Bacillus licheniformis ≥2.4 U were purchased from Sigma (Sigma-Aldrich, Schnelldorf (Germany)). 2,4,6-Tris(2-pyridyl)-S-triazine (TPTZ; (≥98%)) was purchased from Sigma (Supelco, Schnelldorf (Germany)). Coomassie Brilliant Blue R 250 was purchased from Sigma (Sigma-Aldrich, Darmstadt, (Germany)). Peptide digest assay standard and Thermo Scientific PageRuler Plus Prestained Protein Ladder were purchased from Thermo Fisher Scientific (Waltham (USA)). All chemicals used in this research were of analytical grade.2.2. Materials, microorganisms and cultivation media
The BSG samples, obtained from a single batch (October 2018), were collected from the brewery (Browar Stu Mostów, Wrocław, Poland) and dried in order to prevent microbial contamination and spoilage. The process was carried out for 48 h at 50 °C with periodic mixing and was controlled by measuring the humidity of the raw material. The initial malt from which BSG was obtained was composed of 30% barley and 70% wheat grain.Bacterial strains used to hydrolyze BSG proteins were obtained from the Polish Collection of Microorganisms of the Institute of Immunology and Experimental Therapy (Wrocław, Poland). Bacillus cereus PCM 2849, Bacillus subtilis PCM 2850, Bacillus polymyxa ATCC 842, Bacillus lentus PCM 450, Kocuria rhizophila PCM 2931, and Micrococcus luteus ATCC 4698, selected due to the ability to produce proteolytic enzymes, were cultured in the LB broth for 24 h at 28 °C with rotary shaking (180 rpm). Bacillus licheniformis PCM 1847 was cultured under the same conditions at 37 °C. Lactobacillus rhamnosus PCM 489 and Escherichia coli PCM 2560 were incubated in MRS broth (pH = 6.2) at 37 °C and TSB broth at 28 °C respectively. After 24 h, post-culture media were centrifuged (8 min, 3900 rpm), then the cell sediment was resuspended and washed twice with sterile distilled water. Each bacterial cell suspension was used as an inoculum in the next stage of research, in order to hydrolyze BSG proteins.
2.3. In silico analysis of brewers' spent grain proteins as a source of bioactive peptides
BSG as a convenient source of protein was explored in terms of the possibility of obtaining bioactive peptides, as a result of hydrolysis. By means of the National Center for Biotechnology Information (NCBI), amino acid sequences of dominant proteins of barley and wheat were found and explored using the BIOPEP-UWM database.18 In order to analyze barley's protein, B hordein (GenBank: AAZ76368.1), C hordein (GenBank: AAA92333.1), D hordein (GenBank: BAA11642.1), gamma 1 hordein (GenBank: AFM77737.1), gamma 2 hordein (GenBank: CAE45747.1), gamma 3 hordein (GenBank: AFM77739.1), globulin (GenBank: AAP31050.1) and glutelin (GenBank: BAK04052.1) were applied. Alpha gliadin (GenBank: ABS72146.1), alpha/beta gliadin (GenBank: BAS02464.1), gamma gliadin (GenBank: AAQ63856.1), omega gliadin (GenBank: AAT01617.1) and glutenin (GenBank: CAA27052.1) were used to examined wheat as a source of bioactive peptide. Barley and wheat protein sequences were cleaved in silico using specific bacterial enzymes. Subtilisin (EC 3.4.21.62), coccolysin (EC 3.4.24.30), proteinase P1 (EC 3.4.21.96), oligopeptidase F (EC 3.4.24), oligopeptidase B (EC 3.4.21.83), thermolysin (EC 3.4.24.27), proteinase K (EC 3.4.21.67) and 8-V-protease (EC 3.4.21.19) were selected for variant cleavage specificity and bacterial origin. After exploring the BSG potential, as a source of bioactive peptides, subsequent phases of research were implemented.2.4. Preparation of the brewers' spent grain protein hydrolysate
BSG protein hydrolysis were performed in 250 ml Erlenmeyer flasks containing 50 ml of the medium composed of (g L−1): BSG (50), MgSO4 (1), KH2PO4 (0.1), K2HPO4 (0.13), CaCl2 (0.5), FeSO4 × 7H2O (0.01). After sterilization, the medium was adjusted to pH = 7 using sterile 5 M NaOH (addition of approx. 350 μl per flask). This stage of the work was essential to create appropriate conditions for bacterial growth, because of the significant drop in pH value observed as a result of BSG sterilization. Afterwards, the BSG medium was inoculated with 2 × 10⁹ cells of each bacterial culture. Uninoculated BSG medium represented a control sample. Protein hydrolysis was carried out at 28 °C with rotary shaking (180 rpm) until the concentration of α-amino groups in the medium reached its maximum value. At every 24 h of cultures, two-milliliter samples were taken, the pH was measured and the concentration of α-amino groups was quantified using the ninhydrin method.192.5. Determination of the degree of hydrolysis
For each culture, the degree of hydrolysis (% DH) was calculated, as an appropriate parameter for assessing the process efficiency. The % DH for each experiment was calculated by comparison of bacterial hydrolysis with hydrolysis conducted in hydrochloric acid (total hydrolysis). The following process was conducted in three replicates as described by Shahidi et al.20 The sample of BSG (1 g) was suspended in 8 ml of 6 M HCl and hydrolyzed for 24 h at 105 °C. After cooling the sample was filtered and the process was completed by the addition of 8 ml of 6 M NaOH. Concentration of α-amino groups, obtained as a result of depicted procedure, was considered to be the maximum achievable and it served as a point of reference for the further calculations. DH% for each bacterial culture was calculated according to the following equation:| % DH= (BH × 100)/TH | (1) |
2.6. Size exclusion chromatography as a tool to investigate brewers' spent grain protein hydrolysis
The hydrolysis of BSG proteins was additionally monitored using a size exclusion chromatography system. At every 24 h of hydrolysis conducted by bacterial cells, samples were taken, clarified by centrifugation (5 min, 10![[thin space (1/6-em)]](https://www.rsc.org/images/entities/char_2009.gif) 000 rpm) filtered through 0.45 μm membrane and analyzed. The purpose of the study was to observe increasing concentration of hydrolysis products, in the form of macromolecular protein in the first phase of bacterial growth, and its disintegration products as the process progresses. Chromatography was conducted using a Bio-Rad chromatography system, including an ENrich SEC 70 10 × 300 column with separation range of 0.5–70 kDa. The column was equilibrated and elution was performed in 50 mM Tris–HCl buffer, containing 0.2 M NaCl (pH = 7.9). Samples (50 μl) were typically eluted at a 0.8 ml min−1 flow rate and the absorbance of the eluate was monitored at 280 nm. Each analytical determination was carried out in duplicate.
000 rpm) filtered through 0.45 μm membrane and analyzed. The purpose of the study was to observe increasing concentration of hydrolysis products, in the form of macromolecular protein in the first phase of bacterial growth, and its disintegration products as the process progresses. Chromatography was conducted using a Bio-Rad chromatography system, including an ENrich SEC 70 10 × 300 column with separation range of 0.5–70 kDa. The column was equilibrated and elution was performed in 50 mM Tris–HCl buffer, containing 0.2 M NaCl (pH = 7.9). Samples (50 μl) were typically eluted at a 0.8 ml min−1 flow rate and the absorbance of the eluate was monitored at 280 nm. Each analytical determination was carried out in duplicate.
2.7. Gelatin zymography as an appropriate method for detection of bacterial enzymes
In order to estimate the profile of extracellular proteases, secreted in each bacterial culture, gelatin zymography was performed. The zymography was conducted to estimate the molecular weight of BSG protein-hydrolyzing enzymes, for each bacterial species. It was performed according to Zhang et al.21 with slight modifications. The overall process of the gelatin zymography is illustrated in Fig. 1.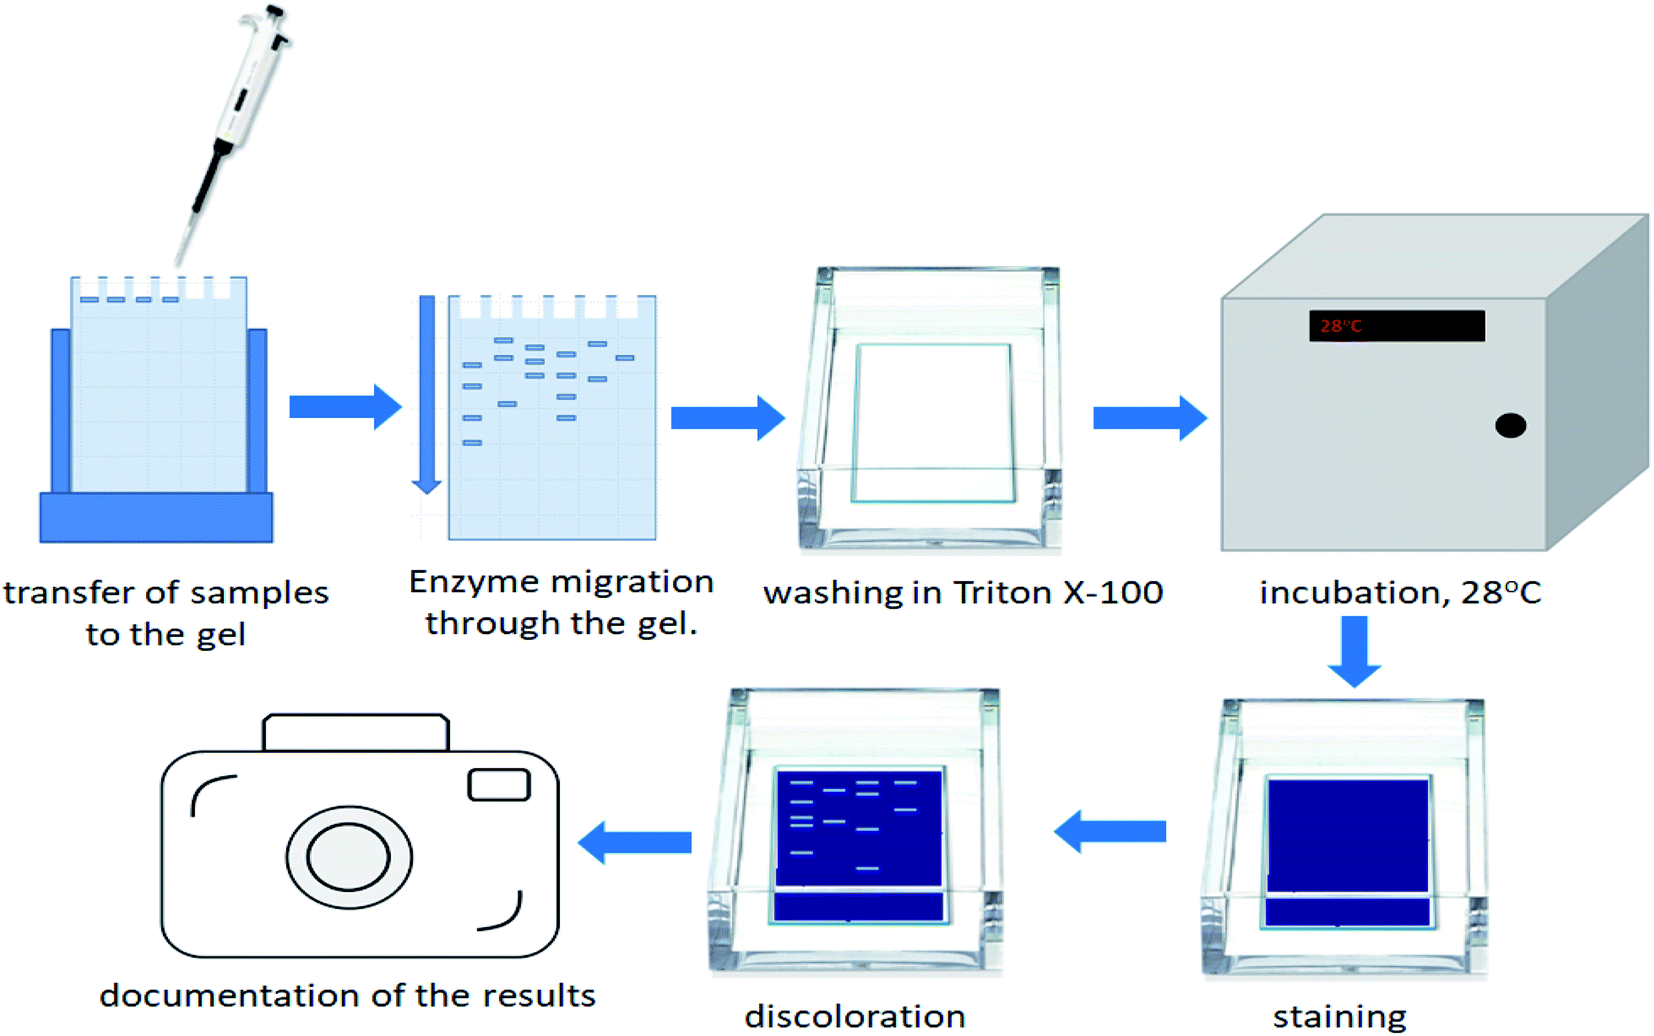 | ||
| Fig. 1 Illustration of the zymography process. | ||
At the end of the BSG hydrolysis, samples (2 ml) from each bacterial culture were taken, clarified by centrifugation (5 min, 10000 rpm), filtered through 0.45 μm membrane and diluted (1:1) in loading buffer (62.5 mM Tris–HCl (pH 6.8), 2% SDS, 25% glycerol, 0.01% bromophenol blue). Then, samples containing enzymes were cooled and subjected to SDS-PAGE in 10% Tris-glycine SDS-polyacrylamide gels containing 0.1% gelatin. In this technique gelatin is digested by active proteolytic enzymes after their separation throughout the gel. Electrophoresis was run under non-denaturing conditions, in order to maintain enzyme activity, at 150 V with constant cooling (electrophoresis container placed on ice in cold room). Maintenance of low temperature prevented excessive digestion of casein during migration of enzymes. Afterwards, the gels were washed in three cycles of 30 min in Triton solution (2.5% Triton X-100, 50 mM Tris–HCl) to remove the SDS residue. Gels were then immersed in 50 mM Tris–HCl buffer (pH = 7.5) enriched by 5 mM CaCl2 and 150 mM NaCl and incubated overnight at 28 °C. The following step, performed to fully activate the enzymes, allowed for the formation of proteolytic clear bands. After incubation, gels were stained with Coomassie Brilliant Blue R250 (0.1% Coomassie blue, 40% methanol, 10% acetic acid) for 3 h, and destained (40% methanol, 10% acetic acid) until clear bands against a blue background were detected. Finally, gels were washed with distilled water and photographed. Thermo Scientific PageRuler Plus Prestained Protein Ladder (10 to 250 kDa) was used as molecular weight standard. Uninoculated BSG medium and a commercial protease from Bacillus licheniformis ≥2.4 U g−1 were used as a control and positive control respectively.
Gelatin zymography was performed to estimate, which enzyme was responsible for BSG protein hydrolysis in each culture. Generally, the more complex the profile of enzymes in the culture is, the more divergent is the mixture of obtained products. It is connected with the specificity of individual enzymes, allowing for the decomposition of polypeptide chains in various ways; hence, wider profiles of active enzymes resulted in obtaining greater concentrations of hydrolysis products.
2.8. Determination of peptide concentration
Peptide concentration was estimated by the modified method of Raveschot et al.22 Initially, 100 μl of the tested sample was mixed with 500 μl of AB reagent and incubated for 10 min at room temperature. Then, 50 μl of FC reagent was added to the reaction mixture and incubated for 30 min in the dark. In order to evaluate peptide concentration the absorbance at 750 nm was measured. A standard curve was established with a peptide digest standard. The calibration curve was performed in a range of 10–100 μg ml−1. AB reagent, necessary in this assay, was prepared as follows: reagent A (0.1 M NaOH + 0.2 M Na2CO3) was mixed with reagent B (1% sodium citrate) in a ratio of 50:1.
2.9. Determination of antioxidant activity of peptides
As a final stage of the research, the antioxidant activity of the control sample (uninoculated medium) and post-culture BSG media were measured using ABTS assay,23 DPPH free radical method24 and FRAP assay.25 The research was aimed at confirmation of the presence of biological active compounds, formed as a result of BSG protein hydrolysis.Initially, ABTS radical cations (ABTS˙+) were created, by mixing 7 mM ABTS stock solution with 2.45 mM Potassium peroxodisulfate and allowing the mixture to stand in the dark at room temperature for 12–16 h. Then, the absorbance of the radical solution was adjusted to 0.7 (±0.02) at 734 nm using distilled water. 10 μl of the tested samples were mixed with 990 μl of ABTS˙+, vortexed and incubated in the dark, at room temperature. After 5 min of reaction, absorbance at 734 nm was measured using The Spark multimode microplate leader (Tecan Group Ltd.). Trolox ethanol solution was served to prepare the standard curve (0–2000 μM). Measured activity of tested samples was expressed as Trolox equivalent antioxidant capacity per gram of peptide (μM g−1).
Antioxidant activity, expressed as capacity to scavenge DPPH free radicals was investigated according to Xu et al.24 with some modifications. Basically, 50 μl of each sample were added to 950 μl of ethanol solution of DPPH radical (final concentration 0.1 mM), mixed vigorously and left to stand at room temperature in the dark for 30 min. The absorbance of each sample was measured against the corresponding blank (50 μl of the sample suspended in 950 μl of ethanol) at 517 nm using The Spark multimode microplate leader (Tecan Group Ltd.). The free radical scavenging activity was calculated using the calibration Trolox curve, prepared in a range of 20–1000 μM and expressed as micromoles of Trolox equivalent per gram of peptide (μM g−1).
According to Benzie et al.25 the antioxidant activity of samples were measured using the FRAP method with slight modifications. Initially, 300 μl of working solution (1A:1B:10C), A (10 mM TPTZ in 40 mM HCl), B (20 mM FeCl3 × 6H2O), C (0.3 M acetate buffer pH = 3.6) were mixed with 100 μl of each sample. Mixtures were incubated for 10 min at room temperature and then the absorbance was measured using The Spark multimode microplate leader (Tecan Group Ltd.) at 593 nm. Methanolic solutions of known Trolox concentrations in the range of 0.05–0.5 μM ml−1 were used to prepare the calibration curve.
3. Results and discussion
3.1. Description of bioactive peptides obtained as a result of proteolysis simulation
The extensive in silico proteolysis of BSG protein, conducted by means of the BIOPEP-UWM database, demonstrated a significant role of barley and wheat proteins, as a source of biologically active peptide with various activities. Numerous peptides with short amino acid chains, in the range of 2–13 aa, were the products of proteolysis stimulation. Among sequences listed in appendices (Tables S1 and S2†), di-and tripeptides prevailed.The investigation of peptides obtained from barley and wheat proteins exhibited antioxidant, glucose uptake stimulating and vasoactive substance release stimulating activities. There were inhibitors of angiotensin-converting enzyme (ACE), calmodulin-dependent cyclic nucleotide phosphodiesterase (CaMPDE), prolyl oligopeptidase and renin. Inhibitors of dipeptidyl peptidase IV (DPP IV) and dipeptidyl peptidase-III (DPP-III) were the most frequent products of proteolysis stimulation. However, due to the number, inhibitors of DPP IV and DPP-III were not included in the ESI.† Many of the amino acid sequences, obtained in silico, exhibited more than one biological activity. For example, the peptide of the IR sequence demonstrated four different activities, including antioxidant and inhibitory activity against ACE, CaMPDE and renin.
Furthermore, immunostimulating (YG) and anxiolytic (YL) peptides as a product of barley hydrolysis stimulation and anti-inflammatory (YPP and IPP) peptides as a result of wheat proteolysis were formed. Additionally, wheat proteolysis may lead to release of alpha-glucosidase inhibitors (YP), opioid delta receptor ligands (GYY) and analgesic peptides (YR).
Unfortunately, as a result of barley and wheat proteolysis stimulation, the presence of a few peptides with negative effects on human health was also detected. It concerns peptides toxic to people suffering from celiac disease. Peptide of the QQQP sequence was formed as a product of barley's gamma 3 hordein hydrolysis, while QQPY, YPQPQ and QQQP sequences were the product of wheat α-gliadin and γ-gliadin proteolysis. Darewicz et al.26 pointed to wheat's glutenin and gliadin and other homologous proteins of barley, rye and maize as a main source of celiac toxic peptides in food products. Moreover, as the authors mentioned, the multiple occurrence of celiac toxic peptides in beer was recently confirmed. By use of bioinformatical instruments, a list of the bioactive peptides, products of BSG proteolysis simulation, was prepared. The number of presented activities indicates many possibilities of the use of BSG protein hydrolysates in various branches of industry, from food to pharmaceuticals. Therefore, further research stages have been implemented.
3.2. Bacterial hydrolysis of BSG proteins
Initially, in order to estimate progress of proteolysis, the pH values of the cultures and uninoculated medium (control) were investigated. Samples were taken at 24 h intervals. Keeping in mind that protein degradation in the microbial culture is accompanied by increasing pH value, it is an appropriate method to monitor the proteolysis. At the beginning, pH for all tested bacterial species was in the range of 6 to 7. Then, during 24 h, a slight decrease for most of the bacterial cultures was noted. The following pattern, presented for the B. subtilis PCM 2850 curve (Fig. 2), indicated utilization of sugars, one of the components of BSG, as an easily available carbon source, in the first place. Consequently, during 24 h of hydrolysis conducted by B. subtilis PCM 2850, the acidification of the culture medium to nearly pH 5 was noted. In the following hours (24–72) the expected increase of pH value in the culture of BSG hydrolyzing bacteria was observed, to eventually reach pH 8. At the same time, only minor changes were noted for non-hydrolyzing species. An excellent example of non-hydrolyzing bacteria was E. coli PCM 2560 culture, where the pH value remained almost at the same level throughout the process (pH = 5.5–6). Also, the pH of uninoculated media (control) remained stable (pH = 6).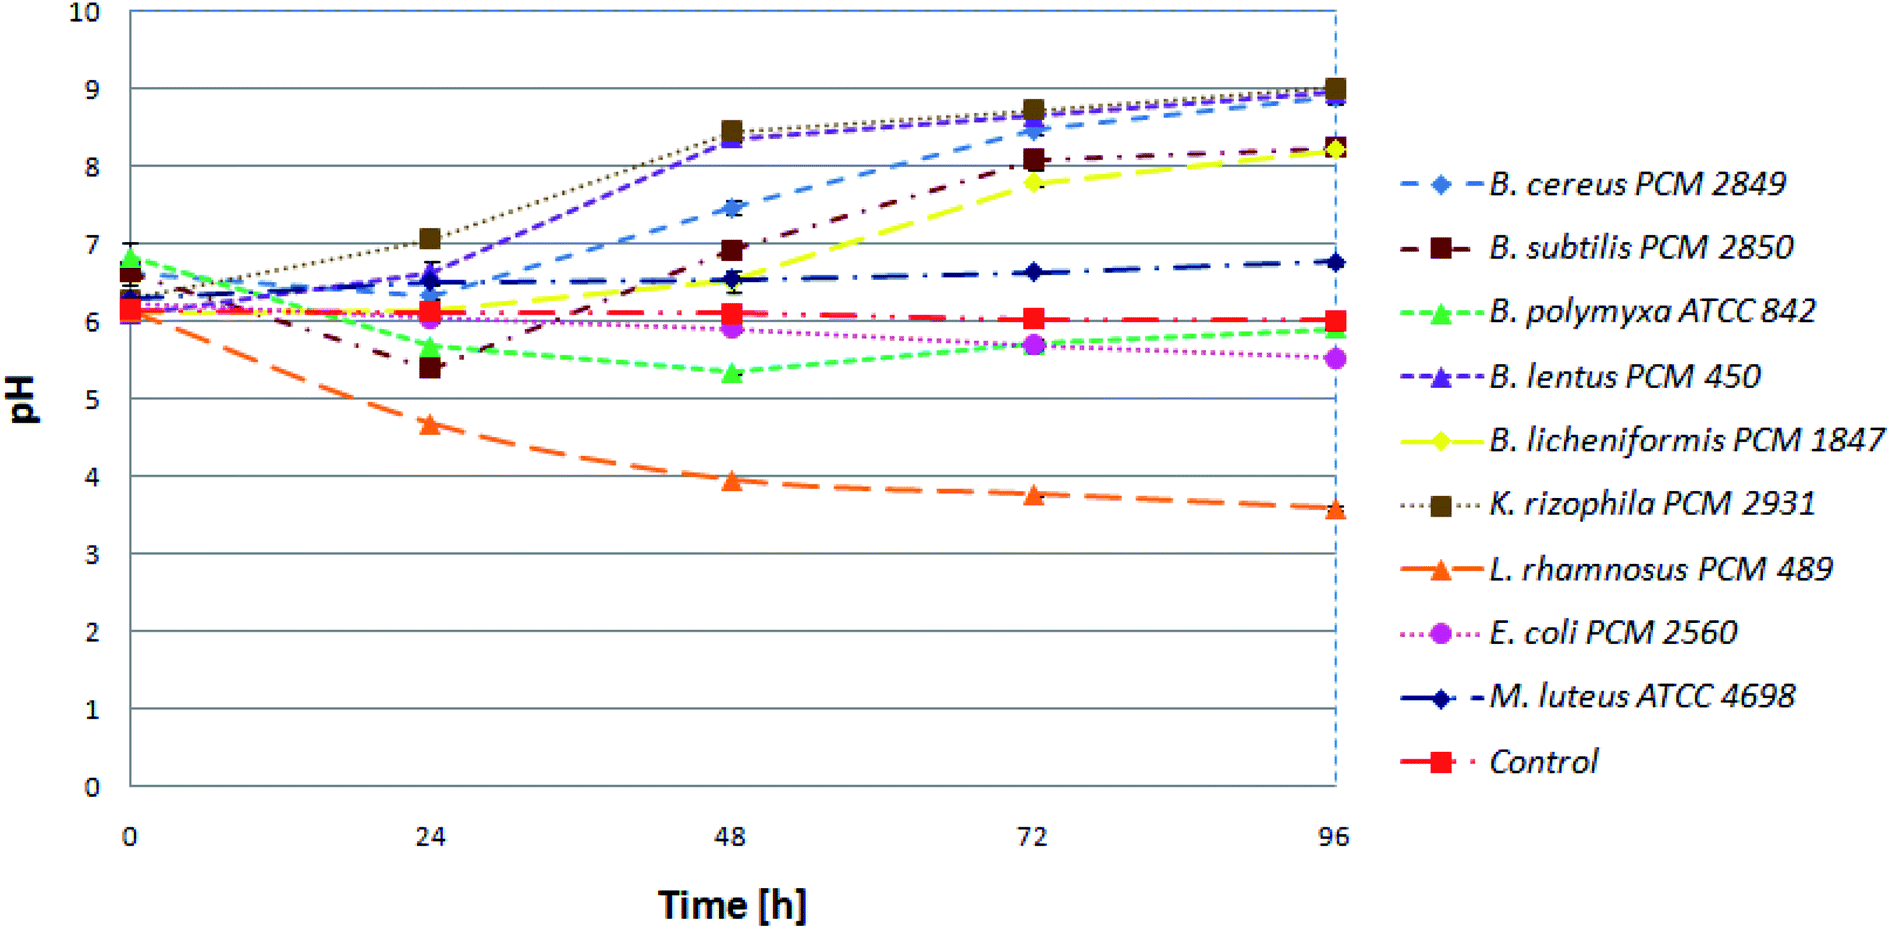 | ||
| Fig. 2 Kinetics of pH value in the bacterial cultures. | ||
Similar observation was made by Paul et al.,27 who investigated the process of feather protein hydrolysis in the culture of Paenibacillus sp. They observed the shift of medium pH towards the alkaline range from 8.5 to 9.3 during the course of feather degradation. The observed tendency of the medium alkalization could be explained by the hydrolysis of feather protein, followed by the release of deamination products. To summarize, pH monitoring is a useful tool to observe the changes occurring during protein hydrolysis. By the increasing pH value, the protein hydrolysis conducted in bacterial cultures can be easily confirmed.
BSG proteins were efficiently hydrolyzed by six (B. cereus PCM 2849, B. subtilis PCM 2850, B. polymyxa ATCC 842, B. lentus PCM 450, B. licheniformis PCM 1847, K. rhizophila PCM 2931) of all tested species (Fig. 3) evidenced by increasing concentration of α-amino groups.
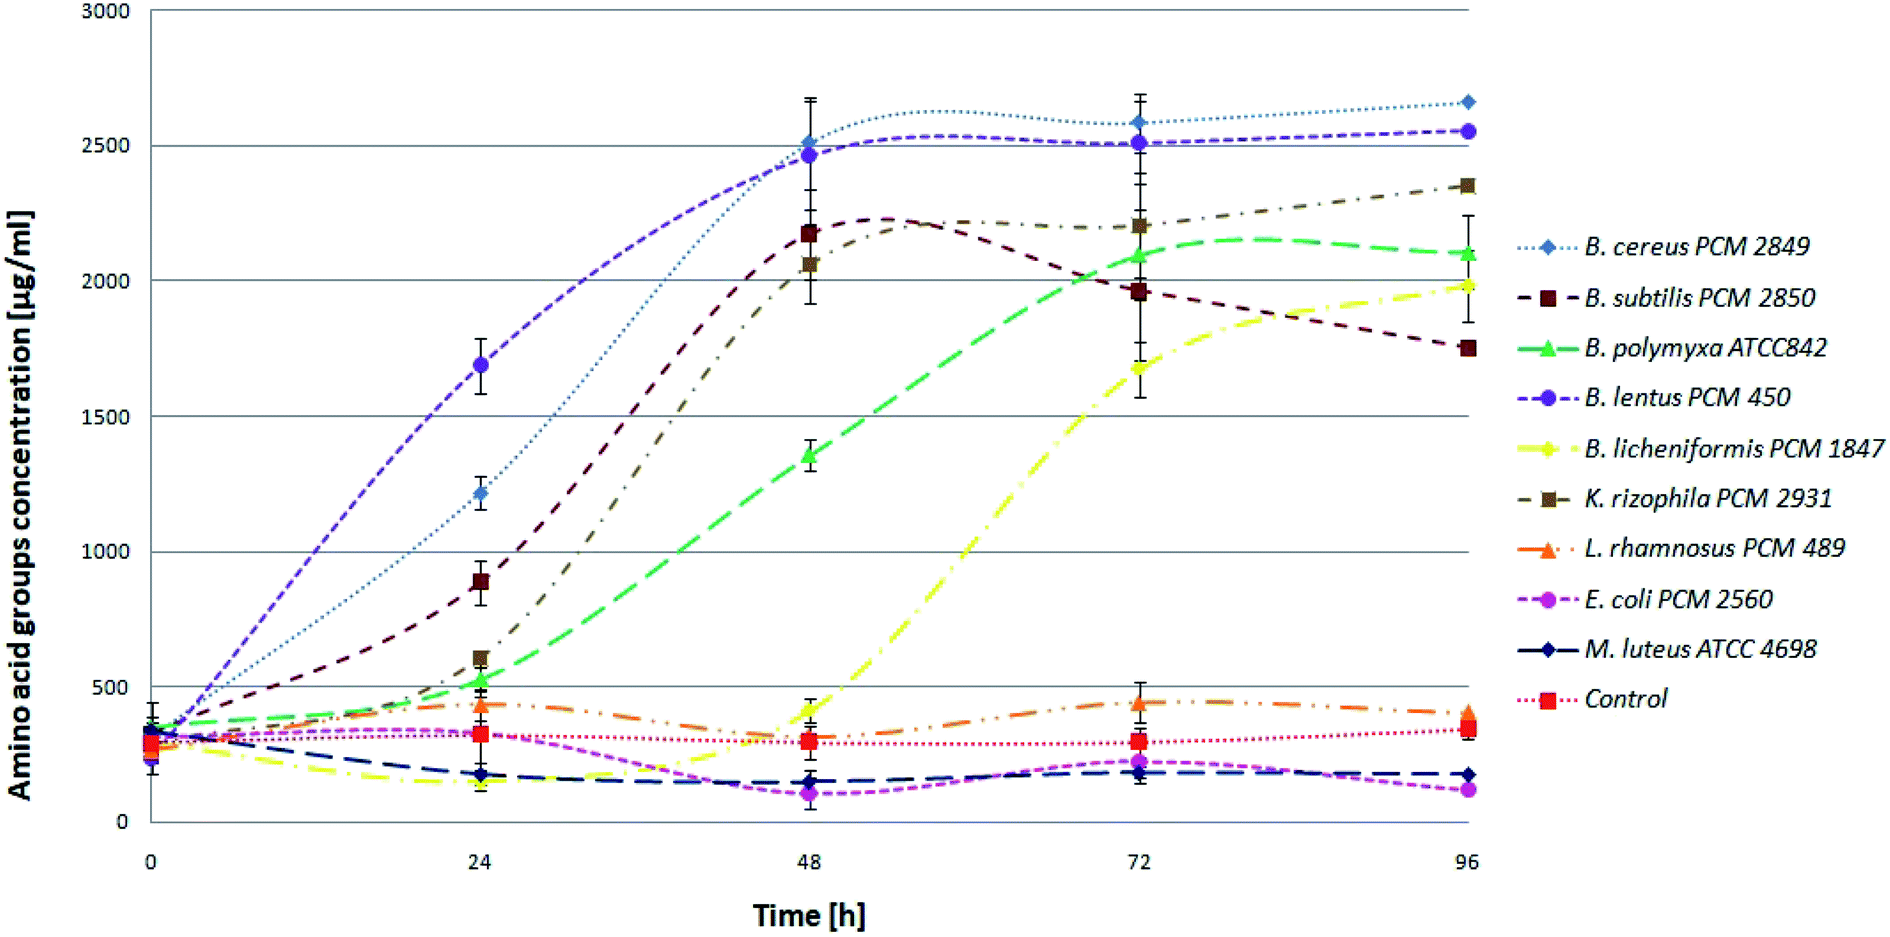 | ||
| Fig. 3 Kinetics of the hydrolysis of BSG protein in the bacterial cultures. | ||
At the beginning, directly after medium inoculation, the concentration of α-amino groups in the bacterial cultures reached approximately 300 μg ml−1, while the calculated % DH was approximately 4–5%. The presence of free α-amino groups at this stage of the process was a result of high temperatures, causing partial protein hydrolysis during medium sterilization. Then, for the listed species, progressive hydrolysis of BSG proteins was observed. It was manifested by increasing concentration of hydrolysis products and by the above-mentioned increase in pH value. The best results were obtained in B. cereus PCM 2849 and B. lentus PCM 450 cultures, where the concentration of α-amino groups, after 72 h of bacterial growth, exceeded 2583.3 μg ml−1 and 2508.3 μg ml−1 respectively. Furthermore, a rapid increase of % DH was observed (Fig. 4). At the first day of hydrolysis conducted by B. cereus PCM 2849, a significant rise of % DH, from 5.3% immediately after inoculation until 20.3% after 24 h of hydrolysis was noted. Obtained results are in line with studies of Kotlar et al.,28 where the hydrolysis of BSG protein by B. cereus extracellular peptidase was investigated. In the following research DH% after 2 h of reaction reached 2.7% and the process was stopped after 24 h, obtaining around 22%.
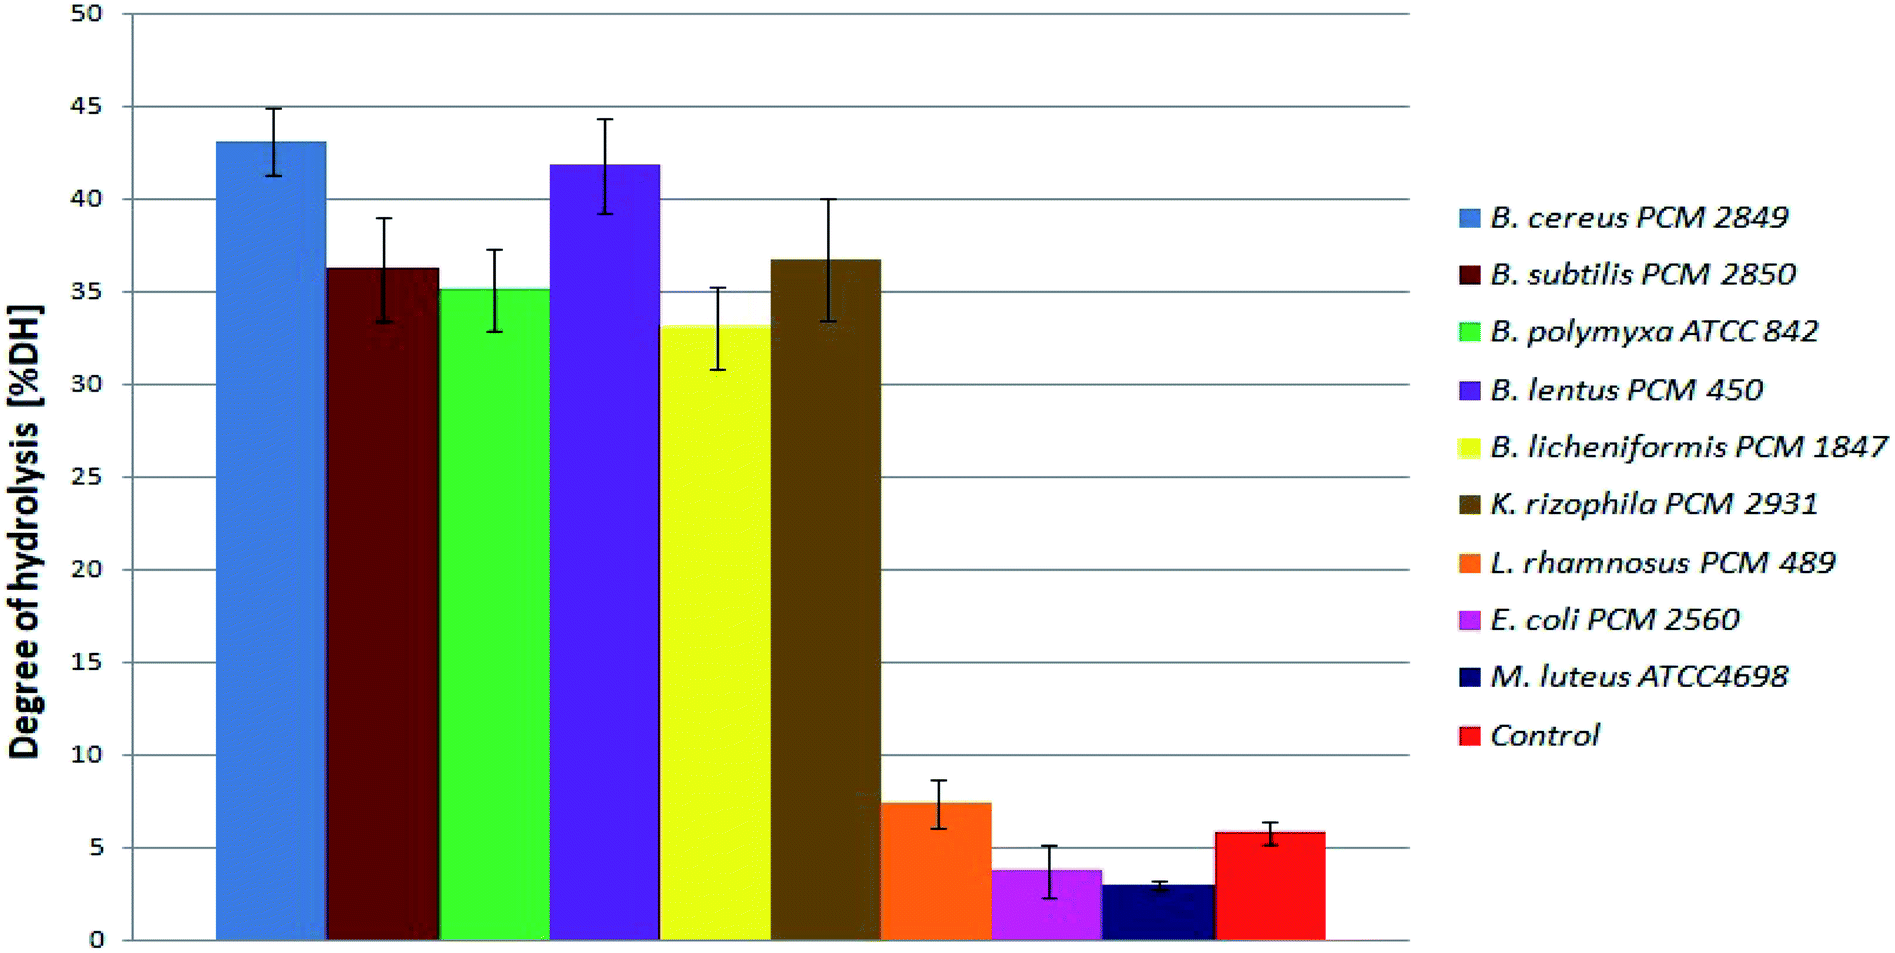 | ||
| Fig. 4 Degree of BSG protein hydrolysis obtained as a result of hydrolysis conducted in bacterial cultures. | ||
Similar research was performed by Celus et al.29 where commercial B. licheniformis Alcalase, Aspergillus oryzae Flavourzyme and porcine-derived pepsin were used to hydrolyze BSG protein concentrate. The best result was obtained by use of Alcalase, after 2 h of hydrolysis (13%).
In another study, conducted by Kong et al.30 wheat gluten was hydrolyzed with the aid of various proteolytic enzymes, in their optimal conditions. The process was conducted with the application of Alcalase, trypsin, Pancreatin, Neutrase and Protamex, in 30 minute reactions. The most efficient gluten hydrolysis occurred in the presence of Alcalase. In general, the degree of hydrolysis varied from 0% to 15.8%, depending on the enzyme applied.
Comparison of the results of Kotlar et al.,28 Celus et al.29 and Kong et al.30 to our outcomes indicated predominance of the hydrolysis conducted in the culture conditions over the use of ready-made enzyme. The application of living bacterial cells, capable of producing a broad spectrum of proteolytic enzymes, resulted in a higher degree of peptide chain cleavage. It is related to the simultaneous action of several proteolytic enzymes, with different specificity, while commercial enzyme preparations usually do not provide it. Moreover, the process conducted with the aid of commercial proteases is limited, due to gradual inactivation of enzymes. Conditions under which the enzyme remains active are strictly defined; any deviation can cause enzyme inactivation. Therefore, the hydrolysis process is usually short and not so effective. In the culture conditions enzyme secretion is continuous, induced by the presence of nutrients in the medium. This makes the hydrolysis process in the culture conditions more stable and consequently more efficient.
3.3. Protein profile variations observed through size exclusion chromatography analysis
Similar profile and concentration of the BSG protein at the beginning of hydrolysis (0 h) in various bacterial cultures was observed using size exclusion chromatography. Profile similarity was exhibited by comparable position and area of peaks in the chromatograms of tested species (Fig. 5). As a result of bacterial hydrolysis, a significant amount of protein involved in maintenance of the grain structure changed into a soluble form. It was demonstrated by a substantial increase of peak area on the chromatograms. Furthermore, considerable portion of released protein was hydrolyzed into small particles. However, the subsequent process proceeded after 24 h or in most cases after 48 h of hydrolysis. It was manifested by a decrease of peaks' area corresponding to high molecular weight proteins (peaks flowing out in the first phase of chromatographic separation, at 10–20 ml) at the extent of the increase of peaks corresponding to protein with a lower molecular weight (peaks flowing out of the column after 20 ml).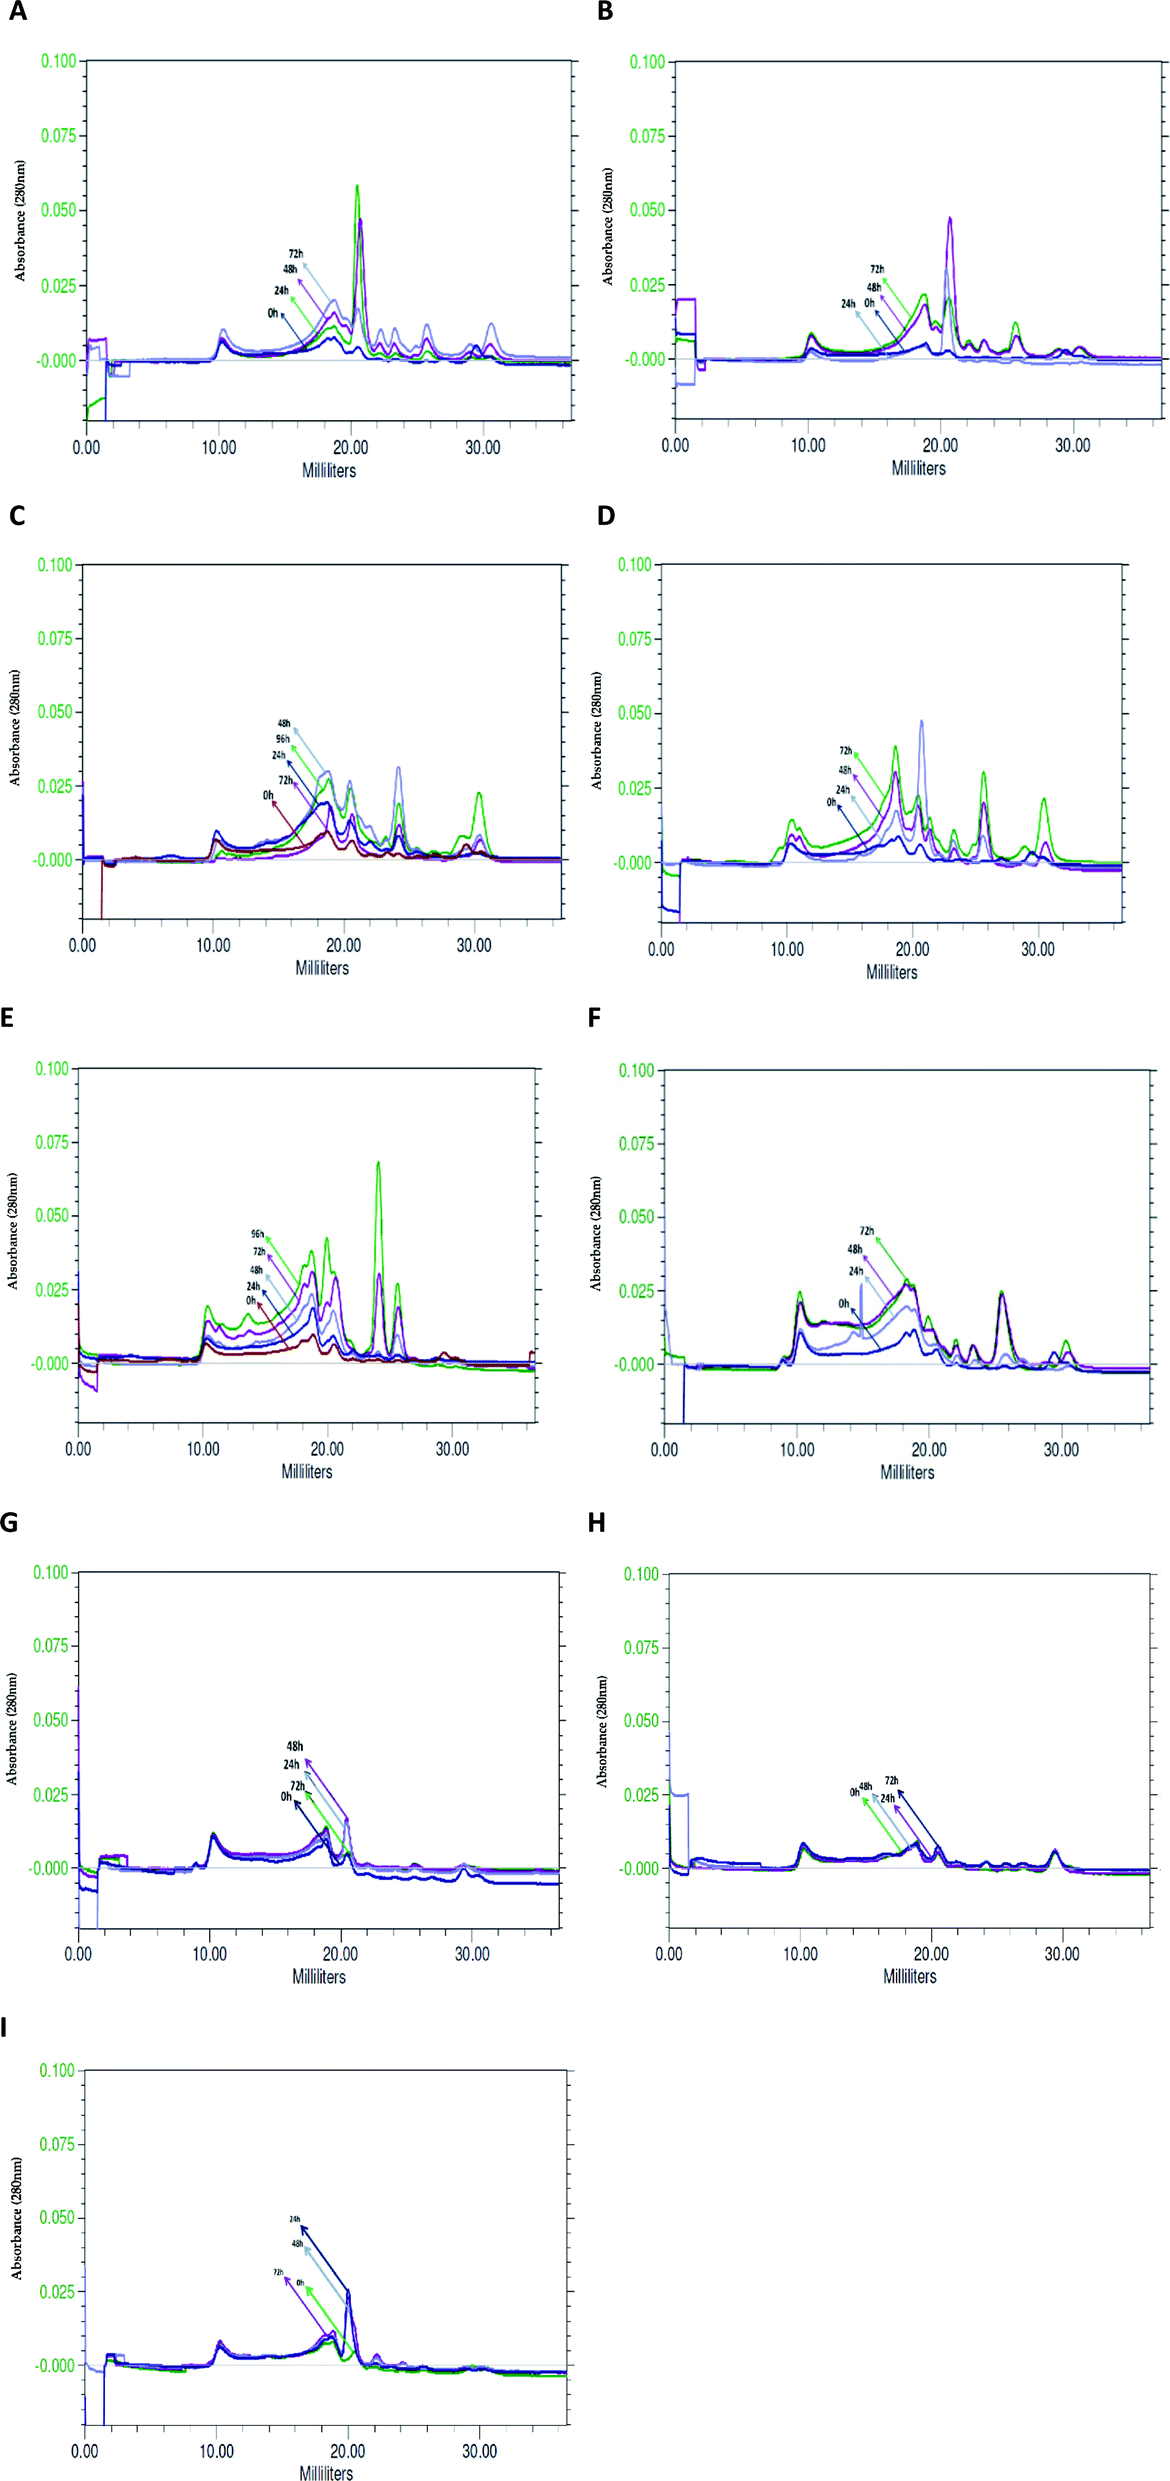 | ||
| Fig. 5 Chromatograms, illustrating changes occurring in the BSG medium in the successive hours of hydrolysis conducted by: (A) B. cereus PCM 2849, (B) B. subtilis PCM 2850, (C) B. polymyxa ATCC 842, (D) B. lentus PCM 450, (E) B. licheniformis PCM 1847, (F) K. rhizophila PCM 2931, (G) M. luteus ATCC 4698, (H) L. rhamnosus PCM 489, (I) E. coli PCM 2560. | ||
B. cereus PCM 2849 (Fig. 5A). and B. subtilis PCM 2850 (Fig. 5B) cultures were characterized by the presence of the common, dominant protein, corresponding to the peak at V = 20.0 ml. During the first 24 h or 48 h of hydrolysis, respectively for the listed species, protein concentration increased. It was monitored on chromatograms as an increasing peak area. Then a gradual peak decline, as a result of protein chain cutting, was observed. It was closely related to the formation of the hydrolysis products, which appeared as minor peaks at the end of chromatograms.
Due to hydrolysis conducted by B. lentus PCM 450 (Fig. 5D) and B. polymyxa ATCC 842 (Fig. 5C) enzymes, the presence of the same protein peak, appearing at V = 20.0 ml, was detected. However, in the culture of B. lentus PCM 450 the peak area increased during the first 24 h, according to the pattern observed for B. cereus PCM 2849, while in the culture of B. polymyxa ATCC 842 peak area was significantly lower and increased for 48 h. In addition, two associated peaks, appearing at 18 ml and 30 ml, were detected in both cultures. The maximal peak areas were noted after 72 h of hydrolysis and were apparently lower in the B. polymyxa ATCC 842 samples. B. lentus PCM 450 culture was additionally characterized by the presence of protein, appearing at V = 26 ml, while the analysis of B. polymyxa ATCC 842 samples demonstrated the presence of a peak at V = 24 ml. Summarizing, in both cultures, a substantial increase of soluble protein concentration was observed, which indicated efficient proteolysis of BSG protein.
The activity of B. licheniformis PCM 1847 proteolytic enzymes is based primarily on the release of protein, involved in BSG structure, rather than the fragmentation of previously released protein into small particles. On the running chromatograms, it was demonstrated by the constant increase of all appearing peaks' area (Fig. 5E). B. licheniformis PCM 1847 culture was characterized by the presence of two proteins peak, corresponding to large peaks appearing at the values of 24 ml and 26 ml, which was unusual for other cultures.
The chromatogram from K. rhizophila PCM 2931 samples' analysis was considerably different from the others (Fig. 5F). A substantial increase of peaks' area were observed, until the end of proteolysis. Most of the peaks were stretched, relatively flat. The only exception was a peak at V = 26 ml and few minor peaks appearing at the end of the chromatogram.
Analysis of the chromatograms of M. luteus ATCC 4698, L. rhamnosus PCM 489 and E. coli PCM 2560 (Fig. 5G–I) indicated no progress in BSG proteolysis. It was evidenced by the lack of peaks on the running chromatograms. If any peaks appeared, their area was minimal and invariable. The lines corresponding to the next hour of cultures overlapped, which indicated no changes in the bacterial media. Compression of the chromatograms of M. luteus ATCC 4698, L. rhamnosus PCM 489 and E. coli PCM 2560 with chromatograms of the other tested bacteria showed the size exclusion chromatography as an appropriate tool, enabling tracking of hydrolysis. By the use of size exclusion chromatography, the changes occurring in the culture medium during protein proteolysis are possible to observe. By the increasing peak area, the solubilization of the protein into the culture medium could be detected. Moreover the profile of the peaks on the chromatograms revealed whether hydrolysis occurred and indicated the degree of polypeptide chain cleavage. The presence of multiple peaks, defined by the various retention times, indicated that the analyzed sample contained various components. Degree of variation in the composition of the unknown sample is significant information in the search for bioactive compounds.
3.4. Detection of bacterial proteases by gelatin zymography
The analysis of post-culture media by use of zymography demonstrated intensified production of proteases in each bacterial culture. At the same time no proteolytic zones were observed for the control sample (uninoculated medium) (data not published). Proteolytic enzyme production in the bacterial cultures was induced by the presence of BSG, the sole carbon and nitrogen source. Zymography allowed for the estimation of molecular weight of the proteolytic enzymes of each tested species. Analysis of B. cereus PCM 2849 post-cultured medium revealed the presence of high-molecular weight proteases with relative molecular mass of 100, 70 and 55 kDa (Fig. 6A), which was higher than that reported in the previous work of Vijayaraghavan et al.31 In the mentioned work, the secretion of B. cereus enzyme with molecular weight of 46 kDa was noted.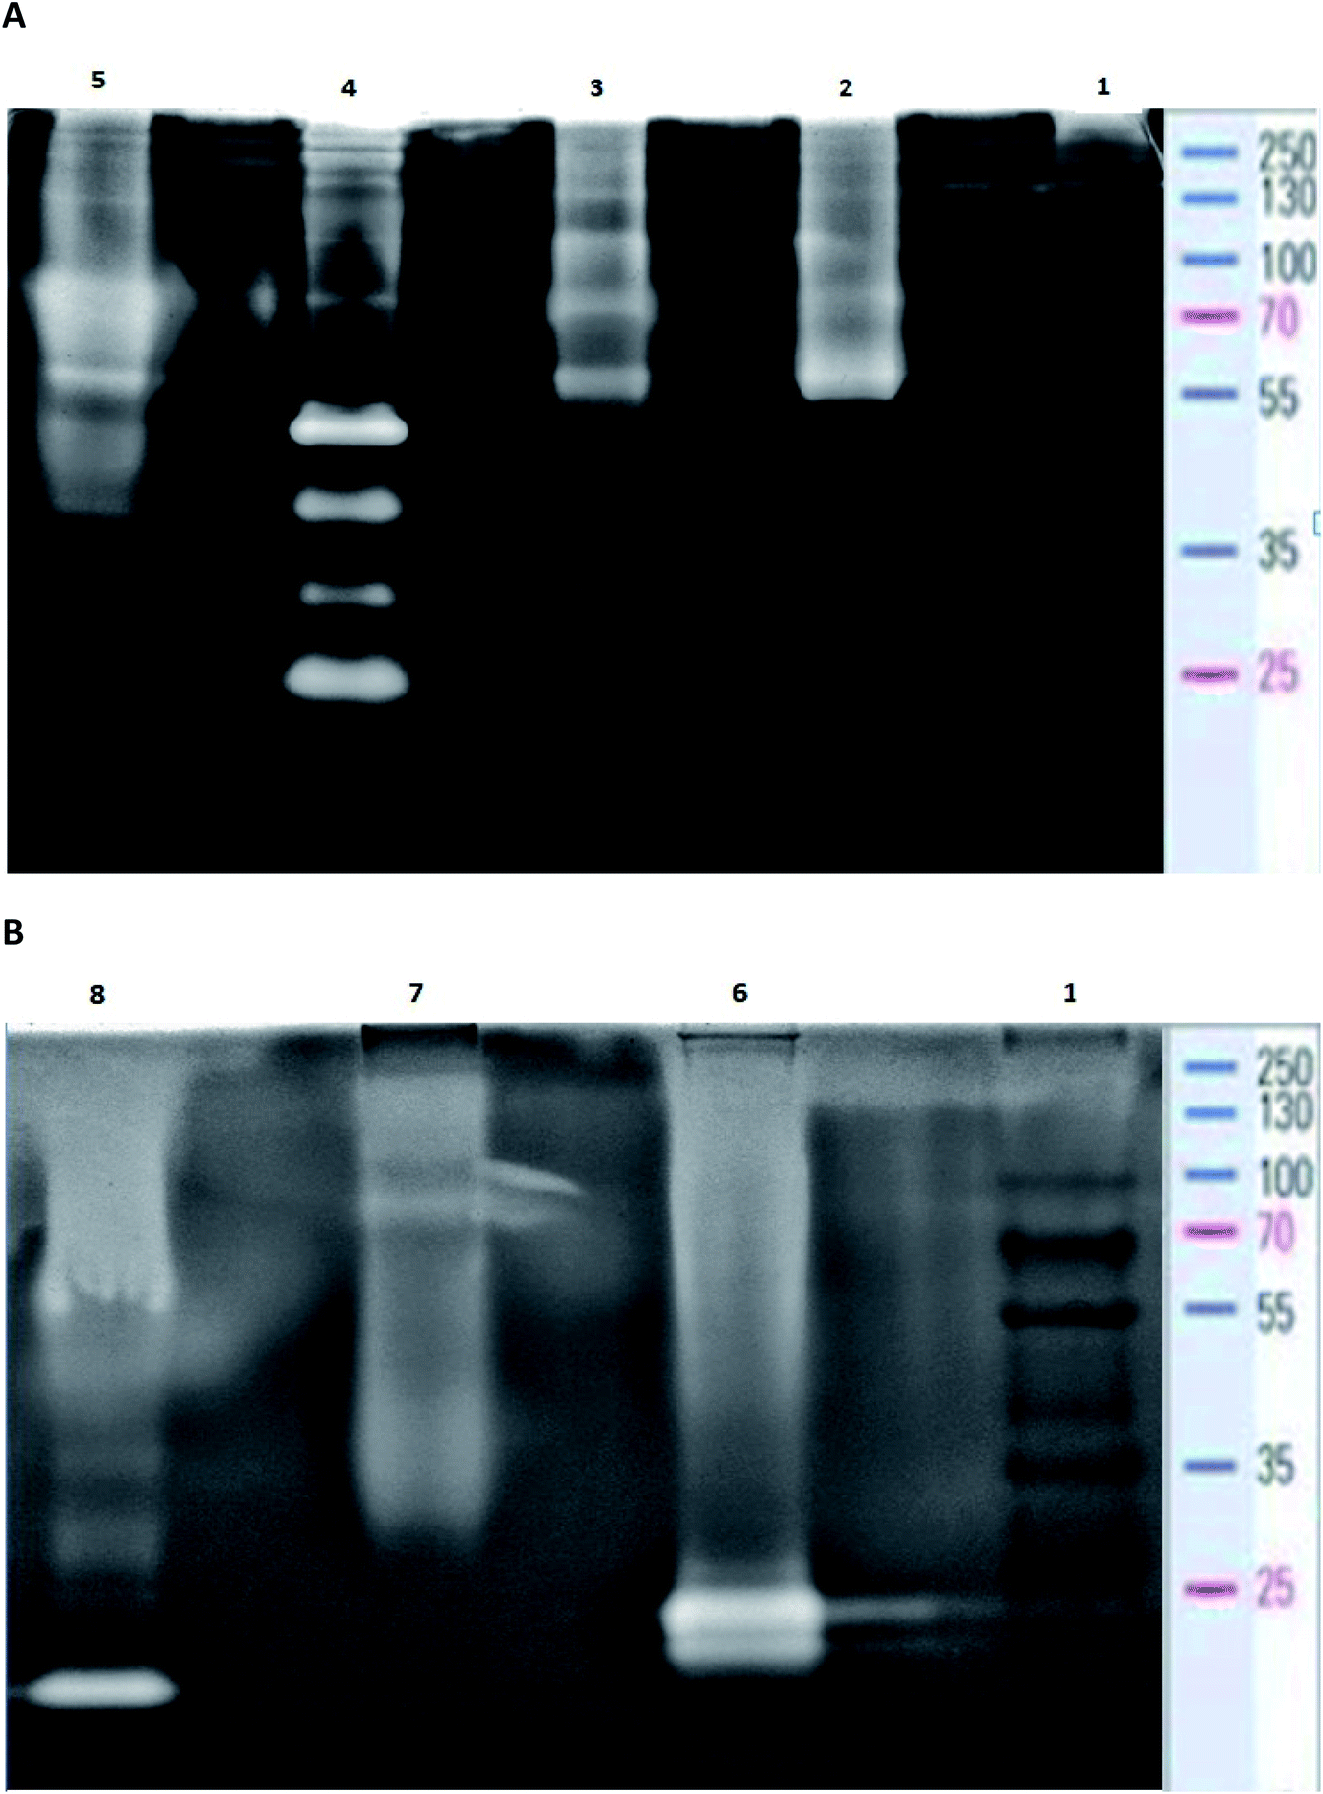 | ||
| Fig. 6 Casein zymogram showing bands of protein cleavage on 10% SDS-PAGE. (A) (Lane 1) Molecular mass marker, (lane 2) B. cereus PCM 2849, (lane 3) B. subtilis PCM 2850, (lane 4) B. polymyxa ATCC 842, (lane 5) B. lentus PCM 450. (B) (Lane 1) Molecular mass marker, (lane 6) B. licheniformis PCM 1847, (lane 7) K. rhizophila PCM 2931, (lane 8) protease from B. licheniformis (Sigma Aldrich). | ||
The profile of enzymes produced by B. subtilis PCM 2850 was similar to the one exhibited by B. cereus PCM 2849. Apart from those mentioned above (100, 70 and 55 kDa), two additional proteases were revealed (Fig. 6A). Those enzymes appeared as barely visible bands, characterized by molecular weight of 40 kDa and 30 kDa. However, their poor visibility on the zymography gel pointed to their low activity in the culture medium and hence low participation in the proteolysis process. Results of B. subtilis PCM 2850 protease zymography were partially confirmed in the research performed by Pillai et al.32 where zymogram profiling of the extracellular enzymes of B. subtilis P13 showed the appearance of proteases of 66 kDa, 43 kDa, 31 kDa and 20 kDa. Almost all listed enzymes (66 kDa, 43 kDa, 31 kDa) correspond well with those detected in our research. However, the protease with molecular mass 31 kDa was identified by the author as a dominant, major proteolytic factor, while in our research the impact of that enzyme was presumably minimal. Proteolytic enzymes of B. subtilis were the subject of the research of Balaji et al.33 and Res et al.,34 where proteases with molecular mass in a range between 64 and 69 kDa and equal to 50 kDa were detected. Due to the similar outline of B. cereus PCM 2849 and B. subtilis PCM 2850 proteases, much the same was the profile of the hydrolysis products, as presented in Fig. 5A and B.
Bacillus polymyxa is one of the most industrially significant facultative anaerobic bacteria due to producing a wide range of hydrolytic enzymes. B. polymyxa produced a great amount of extracellular protease with molecular masses of 20, 35, 50 and 210 kDa applied in detergent formulation, the food industry, leather processing, chemical synthesis and waste management.35
As a result of detailed analysis of B. polymyxa ATCC 842 culture, a wide spectrum of secreted enzymes was confirmed in this research (Fig. 6A). Besides four dominant proteases with molecular weight 25 kDa, 30 kDa, 40 kDa, 50 kDa, slight clear bands, corresponding to macromolecular proteases, appeared on the gel at 70 kDa, 100 kDa, 130 kDa and 210 kDa. Our results correspond well with the research conducted by Alvarez et al.36 In the following research, at least four intense proteolytic halos with molecular masses of 20, 35, 50 and 210 kDa were noted. Summarizing the observations, B. polymyxa ATCC 842 produced the widest spectrum of proteases in comparison to the other species tested in this research. This consequently translated into the 2–4 times higher concentration of peptides in the post-culture fluid (Table 1).
| B. cereus PCM 2849 | B. subtilis PCM 2850 | B. polymyxa ATCC 842 | B. lentus PCM 450 | B. licheniformis PCM 1847 | K. rhizophila PCM 2931 | Control | |
|---|---|---|---|---|---|---|---|
| Peptide concentration [mg ml−1] | 104 ± 001 | 128 ± 008 | 430 ± 007 | 180 ± 017 | 191 ± 001 | 196 ± 009 | 070 ± 002 |
B. lentus is another example of industrial organisms that produce a commercial protease preparations called Esperase (Novo Nordisk) and Purafact (Genencor Int.).37 The analysis of B. lentus PCM 450 post-cultured medium confirmed high potential of this strain to produce proteolytic enzymes (Fig. 6A). On the zymogram gel, distinct bands, appearing in a range between 70–90 kDa and 40–50 kDa, were visualized. Significant dispersion of these bands may indicate the presence of a few enzymes slightly differing in molecular weight, visible as one, big single band. In addition, two more bands with molecular weight 130 kDa and 55 kDa were detected.
The profile of B. licheniformis PCM 1847 proteolytic enzymes was distinct from the other tested bacterial species. Two comparable, low molecular-mass bands were detected on the zymogram gel (Fig. 6B). Enzymes characterized by the mass of around 21 and 23 kDa were not produced by the other tested bacterial species and were in line with the results of analysis conducted for commercial protease from B. licheniformis. The molecular weight of the commercial enzyme, appearing on the gel as a single band, was determined to be around 21 kDa (Fig. 6B). In the studies performed by Yilmaz et al.38 the activity band of the B. licheniformis A10 protease was observed through the zymogram in the form of a clear casein hydrolysis zone with molecular weight 40.55 kDa, while in the other studies39 four proteolytic enzymes, three (34, 28, and 18 kDa) from B. licheniformis DJ-2 and one (30 kDa) from B. licheniformis NJ-5, were detected under SDS-denaturing conditions.
K. rhizophila PCM 2931, a keratinolytic bacterium previously isolated from living poultry, exhibits significant proteolytic properties. However, the molecular mass of proteases secreted by K. rhizophila PCM 2931 was difficult to estimate, which could be due to low concentration of the proteases in the post-cultured medium (Fig. 6B). In effect, a barely visible band appearing at around 81 kDa and dispersed zones of proteolytic activity at molecular weight in a range of 100–250 kDa and 45–30 were observed in this research. Profiles of K. rhizophila PCM 2931 enzymes were previously successfully examined by Łaba et al.,40 where two activity bands were determined: a minor band of approximately 80 kDa and a dominant band between 130 and 180 kDa.
3.5. Antioxidant activity of brewers' spent grain protein hydrolysates
Assessment of peptide concentrations using the FC reagent showed significantly greater accumulation of peptides in the B. polymyxa ATCC 842 post-culture medium (4.30 mg ml−1), compared to the rest of the bacterial species. Moreover, the culture of B. licheniformis PCM 1847 and K. rhizophila PCM 2931 was characterized by relatively high peptide content of about 2 mg ml−1. Results of the peptide determination are summarized in Table 1.The antioxidant activity of BSG protein hydrolysates was initially measured using the ABTS method. The method allowed for determination of the total antioxidant activity of multicomponent samples. The principle of the ABTS assay is generation of the nitrogen-centered radical cation (ABTS˙+) through oxidation of ABTS by persulfate, which can be followed spectrophotometrically. Hydrolysates produced as a result of bacterial action displayed high antioxidant activity, expressed in terms of Trolox equivalent antioxidant capacity per gram of peptide (μM TEAC per g peptides) (Fig. 7).
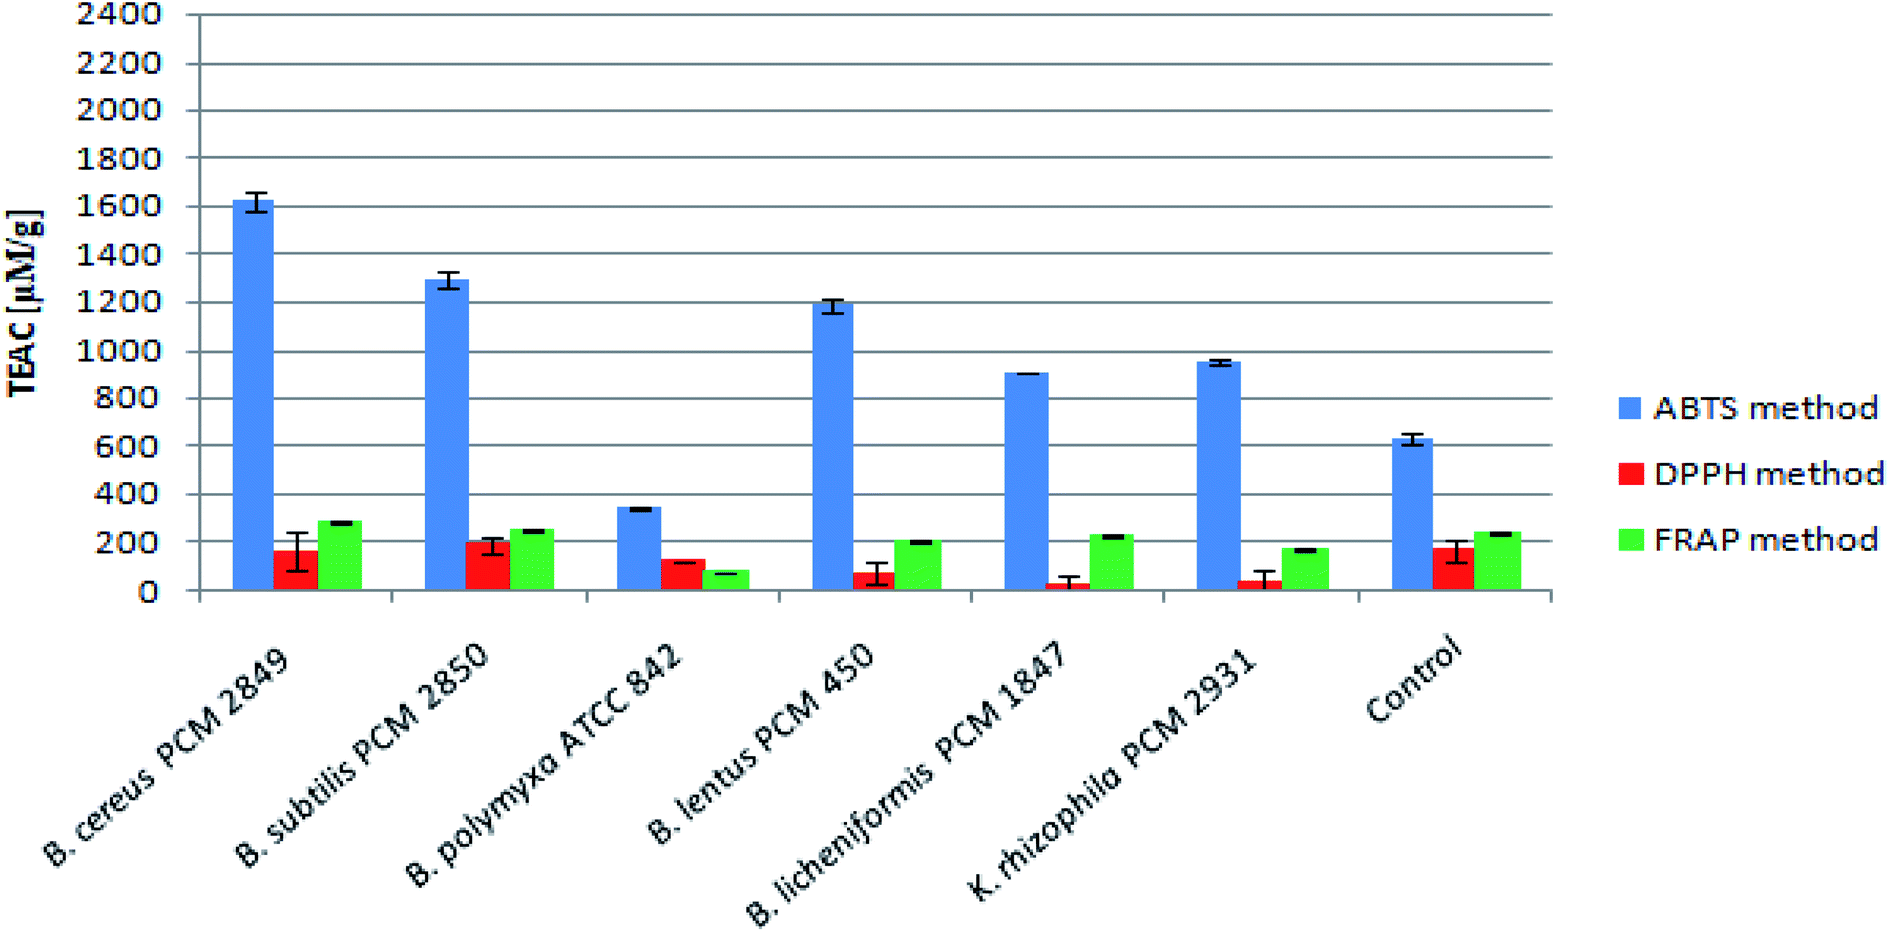 | ||
| Fig. 7 Antioxidant activity of BSG protein hydrolysates measured by ABTS, DPPH and FRAP assays. | ||
B. cereus PCM 2849 hydrolysate exhibited higher antioxidant activity (1621.31 μM TEAC per g peptides) than the rest of samples, where the activity was in the range up 345.18 μM TEAC per g peptides (B. polymyxa ATCC 842) to 1291.97 μM TEAC per g peptides (B. subtilis PCM 2850). In comparison, the activity of the control sample totaled 634.29 μM TEAC per g peptides. Olanca et al.41 determined the total antioxidant activity of the wheat gluten and gluten hydrolysates. The activity of gluten hydrolysate (172.1 μM g−1) evidently increased as a result of hydrolysis conducted by the enzymes of wheat bug. Hydrolysates characterized by 3% DH and 5% DH exhibited activity totaling 240 μM g−1 and 228 μM g−1 respectively. Mareček et al.42 assessed the correlation between antioxidant activity of barley/malt and the variety of barley, weather conditions, application of Zn2+ fertilizer. The average antioxidant activity determined using the ABTS method was in the range 2.1 to 2.5 μM g−1 for barley and 2.7–3.0 μM g−1 for malt.
The antioxidant activity of the BSG hydrolysates was additionally measured in terms of the ability to scavenge DPPH radicals. B. subtilis PCM 2850 post-culture samples exhibited the highest activity, reaching 188.89 μM g−1 peptides (Fig. 7). At the same time, the antioxidant activity in the medium of the other bacteria did not exceed the value obtained for the control (167.10 μM TEAC per g peptides). It indicates rapid utilization of the antioxidant compounds, released during medium sterilization in some bacteria cultures and low rate of formation the new antioxidants. Mareček et al.42 determined the antioxidant capacity of barley and malt by the DPPH method. The antioxidant activity ranged from 1.2 to 1.7 μM g−1 for barley and from 1.8–2.6 μM g−1 for malt respectively. However, the results obtained with the DPPH method were considerably lower as compared to the ABTS method. It could be explained on the basis of the previous research of Arnao.43 As the author mentioned, both ABTS and DPPH methods involve a radical chromogen, which is depleted in the presence of an antioxidant. However, there are several important differences in the response of radicals to antioxidants and their manipulation. The DPPH radical is acquired directly without preparation (ready to dissolve), while the ABTS radical must be generated using enzymatic or chemical reactions. Another important reason is the differences in the solubility of ABTS and DPPH radicals. The ABTS radical can be solubilized in aqueous or in organic media, in which the antioxidant activity can be measured due to the hydrophilic and lipophilic nature of the antioxidants, while the DPPH radical must be dissolved in organic media, which is an important limitation when interpreting the role of hydrophilic antioxidants.
In this research, ABTS radicals were solubilized in aqueous solution, while DPPH radicals were solubilized in ethanol solution, which probably was the cause of the observed differences.
As the final stage of the research, the antioxidant activity of the BSG hydrolysates was measured using FRAP method. The mechanism of the performed assay is totally different from the ABTS and DPPH method. In this case, the colorless oxidized Fe3+ form of iron is converted into a reduced, blue-colored Fe2+, due to the action of the electron donation from antioxidants.44 However, despite a different mechanism, in this case the results were at the same level as those obtained by DPPH methods (Fig. 7). The highest activity levels were detected in the BSG hydrolysates of B. cereus PCM 2849 (284.08 μM TEAC per g peptides) and B. subtilis PCM 2850 (248.81 μM TEAC per g peptides) species, whereas in the research of Connolly et al.12 the antioxidant activity of BSG hydrolysates was in the range from 183.31 to 295.76 μM TEAC per g protein depending on protease combinations. In addition, similar results were obtained by Vieira et al.,11 in a study aimed at preparing BSG hydrolysates by use of Alcalase, Neutrase and brewers' spent yeast protease. The reported antioxidant activity was in the range of 247.71–403.53 μM TEAC per g per dw.
4. Conclusions
BSG was efficiently hydrolyzed in the bacterial cultures and the highest activity, expressed as the ability to cleave the protein chain, was observed in relation to the Bacillus genus. This approach ensured the optimal conditions for the enzymes' secretion and action. It was confirmed by means of gelatin zymography, where the full profile of bacterial enzymes was visualized. BSG protein hydrolysates demonstrated high antioxidant activity.The results of this research indicated a number of possibilities of using BSG hydrolysates in various scientific fields. Our future research will be focused on the isolation of bioactive peptides from the obtained hydrolysates. Moreover, the investigation of the properties of isolated peptides will be a priority task. According to Hartmann and Meisel,45 many food-derived peptides exhibit strong biological activity including antioxidant, immunomodulatory, and blood pressure-lowering (ACE inhibitory) properties. The BSG protein hydrolysate, derived from a brewery by-product, can be a low cost and promising peptide source.
Moreover, there are many other possible applications of the obtained BSG protein hydrolysates. In the research conducted by Colla et al.46 plant-derived protein hydrolysate was applied as a hormone-like active, nitrogen uptake and growth stimulating agent for corn (Zea mays L.), tomato and dwarf pea (Pisum sativum L.). As described by Pasupuleti et al.,47 protein hydrolysates are widely used in the manufacture of probiotics, starter cultures and fermented products. In addition, the use of protein hydrolysates, as an important nutrient for growth and maintenance, has been increasing in animal nutrition.
Finally, BSG protein hydrolysate can be applied in the cosmetics industry. According to Burnett et al.,48 wheat protein and wheat gluten hydrolysates function as skin and hair conditioning agents in personal care products. The Cosmetic Ingredient Review Expert Panel previously assessed the safety of animal and plant-derived amino acids, hydrolyzed corn and wheat protein to qualify them as safe for use in cosmetic products. Hydrolysates of BSG obtained in this work, containing both wheat and barley protein decomposition products, could be a more economically advantageous option for the cosmetic industry.
In conclusion, this article presented a new biological method to effectively hydrolyze protein from BSG using bacteria. The produced protein hydrolysates offer an alternative nitrogen and antioxidant source to synthetics.
Funding
This work was supported by the National Science Centre, Poland, project 2019/03/X/NZ9/00052. The Article Processing Charge (APC) was financed under the Leading Research Groups support project from the subsidy increased for the period 2020–2025 in the amount of 2% of the subsidy referred to Art. 387 (3) of the Law of 20 July 2018 on Higher Education and Science, obtained in 2019.Conflicts of interest
The authors declare that the research was conducted in the absence of any commercial or financial relationships that could be construed as a potential conflict of interest.Acknowledgements
We thank Prof. Joanna Kawa-Rygielska (Wroclaw University of Environmental and Life Sciences, Poland) for generously providing brewers' spent grain.References
- W. Kunze, Technology Brewing and Malting, VLB Berlin, 2004, pp. 18–152 Search PubMed.
- S. I. Mussatto, G. Dragone and I. C. Roberto, J. Cereal Sci., 2006, 1–14 CrossRef CAS.
- P. Forssell, H. Kontkanen, H. A. Schols, S. Hinz, V. G. H. Eijsink, J. Treimo, J. A. Robertson, K. W. Waldron, C. B. Faulds and J. Buchert, J. Inst. Brew., 2008, 114, 306–314 CrossRef CAS.
- C. Wang, Z. Tian, L. Chen, F. Temelli, H. Liu and Y. Wang, Cereal Chem., 2010, 87, 597–606 CrossRef CAS.
- R. Linko, A. Lapvetelainen, P. Laakso and H. Kallio, Cereal Chem., 1989, 66, 478–482 CAS.
- M. X. Zhou, in Advanced Topics in Science and Technology in China, 2010, pp. 1–17 Search PubMed.
- K. Mastanjević, B. Šarkanj, R. Krska, M. Sulyok, B. Warth, K. Mastanjević, B. Šantek and V. Krstanović, Food Chem., 2018, 254, 115–121 CrossRef.
- A. Faltermaier, D. Waters, T. Becker, E. Arendt and M. Gastl, J. Inst. Brew., 2014, 120, 1–15 CrossRef CAS.
- F. Battais, F. Pineau, Y. Popineau, C. Aparicio, G. Kanny, L. Guerin, D. A. Moneret-Vautrin and S. Denery-Papini, Clin. Exp. Allergy, 2003, 33, 962–970 CrossRef CAS.
- R. D'Ovidio and S. Masci, J. Cereal Sci., 2004, 39, 321–339 CrossRef.
- E. F. Vieira, D. D. da Silva, H. Carmo and I. M. P. L. V. O. Ferreira, Food Chem., 2017, 228, 602–609 CrossRef CAS.
- A. Connolly, M. Cermeño, D. Crowley, Y. O'Callaghan, N. M. O'Brien and R. J. FitzGerald, Food Res. Int., 2019, 121, 524–532 CrossRef CAS.
- E. Vieira, J. Teixeira and I. M. P. L. V. O. Ferreira, Eur. Food Res. Technol., 2016, 242, 1975–1984 CrossRef CAS.
- A. Connolly, M. B. O'Keeffe, C. O. Piggott, A. B. Nongonierma and R. J. Fitzgerald, Food Chem., 2015, 176, 64–71 CrossRef CAS.
- J. Treimo, B. Westereng, S. J. Horn, P. Forssell, J. A. Robertson, C. B. Faulds, K. W. Waldron, J. Buchert and V. G. H. Eijsink, J. Agric. Food Chem., 2009, 57, 3316–3324 CrossRef CAS.
- C. E. Kotlar, M. Belagardi and S. I. Roura, Biotechnol. Appl. Biochem., 2011, 58, 464–475 CrossRef CAS.
- W. Łaba, M. Piegza and J. Kawa-Rygielska, J. Chem. Technol. Biotechnol., 2017, 92, 1389–1396 CrossRef.
- P. Minkiewicz, A. Iwaniak and M. Darewicz, Int. J. Mol. Sci., 2019, 20, 5978 CrossRef CAS.
- S. W. Sun, Y. C. Lin, Y. M. Weng and M. J. Chen, J. Food Compos. Anal., 2006, 19, 112–117 CrossRef CAS.
- F. Shahidi, U. D. Chavan, A. K. Bal and D. B. McKenzie, Food Chem., 1999, 64, 39–44 CrossRef CAS.
- H. Zhang, L. Xu, D. Xiao, J. Xie, H. Zeng, Z. Wang, X. Zhang, Y. Niu, Z. Shen, J. Shen, X. Wu and E. Li, J. Clin. Pathol., 2007, 60, 555–561 CrossRef CAS.
- C. Raveschot, B. Cudennec, B. Deracinois, M. Frémont, M. Vaeremans, J. Dugersuren, S. Demberel, D. Drider, P. Dhulster, F. Coutte and C. Flahaut, Food Chem., 2020, 304, 125415 CrossRef CAS.
- R. Re, N. Pellegrini, A. Proteggente, A. Pannala, M. Yang and C. Rice-Evans, Free Radicals Biol. Med., 1999, 26, 1231–1237 CrossRef CAS.
- B. J. Xu and S. K. C. Chang, J. Food Sci., 2008, 73, H19–H27 CrossRef CAS.
- I. F. F. Benzie and J. J. Strain, Anal. Biochem., 1996, 239, 70–76 CrossRef CAS.
- M. Darewicz, J. Borawska, P. Minkiewicz, A. Iwaniak and P. Starowicz, Food. Sci. Technol. Qual., 2015, 22, 26–41 Search PubMed.
- T. Paul, S. K. Halder, A. Das, S. Bera, C. Maity, A. Mandal, P. S. Das, P. K. D. Mohapatra, B. R. Pati and K. C. Mondal, Biocatal. Agric. Biotechnol., 2013, 2, 50–57 CrossRef.
- C. E. Kotlar, A. G. Ponce and S. I. Roura, LWT, 2013, 50, 378–385 CrossRef CAS.
- I. Celus, K. Brijs and J. A. Delcour, J. Agric. Food Chem., 2007, 55, 8703–8710 CrossRef CAS.
- X. Kong, H. Zhou and H. Qian, Food Chem., 2007, 102, 759–763 CrossRef CAS.
- P. Vijayaraghavan, S. Lazarus and S. G. P. Vincent, Saudi J. Biol. Sci., 2014, 21, 27–34 CrossRef CAS.
- P. Pillai, S. Mandge and G. Archana, Process Biochem., 2011, 46, 1110–1117 CrossRef CAS.
- S. Balaji, M. Senthil Kumar, R. Karthikeyan, R. Kumar, S. Kirubanandan, R. Sridhar and P. K. Sehgal, World J. Microbiol. Biotechnol., 2008, 24, 2741–2745 CrossRef CAS.
- J. M. B. Res, M. Padmapriya and B. C. Williams, J. Microbiol. Biotechnol. Res., 2012, 2, 612–618 Search PubMed.
- S. Lal and S. Tabacchioni, Indian J. Microbiol., 2009, 49, 2–10 CrossRef CAS.
- V. M. Alvarez, I. Von Der Weid, L. Seldin and A. L. S. Santos, Lett. Appl. Microbiol., 2006, 43, 625–630 CrossRef CAS.
- R. Gupta, Q. Beg and P. Lorenz, Appl. Microbiol. Biotechnol., 2002, 15–32 Search PubMed.
- B. Yilmaz, M. O. Baltaci, M. Sisecioglu and A. Adiguzel, J. Enzyme Inhib. Med. Chem., 2016, 31, 1241–1247 CrossRef CAS.
- N. S. Choi, J. H. Choi, B. H. Kim, Y. J. Han, J. S. Kim, S. G. Lee and J. J. Song, Electrophoresis, 2009, 30, 2234–2237 CrossRef CAS.
- W. Łaba, B. Żarowska, D. Chorążyk, A. Pudło, M. Piegza, A. Kancelista and W. Kopeć, AMB Express, 2018, 8, 9 CrossRef.
- B. Olanca and D. S. Özay, Cereal Chem., 2010, 87, 518–523 CrossRef CAS.
- V. Mareček, A. Mikyška, D. Hampel, P. Čejka, J. Neuwirthová, A. Malachová and R. Cerkal, J. Cereal Sci., 2017, 73, 40–45 CrossRef.
- M. B. Arnao, Trends Food Sci. Technol., 2000, 419–421 CrossRef CAS.
- K. Schlesier, M. Harwat, V. Böhm and R. Bitsch, Free Radical Res., 2002, 36, 177–187 CrossRef CAS.
- R. Hartmann and H. Meisel, Curr. Opin. Biotechnol., 2007, 163–169 CrossRef CAS.
- G. Colla, Y. Rouphael, R. Canaguier, E. Svecova and M. Cardarelli, Front. Plant Sci., 2014, 5, 448 Search PubMed.
- V. K. Pasupuleti, C. Holmes and A. L. Demain, in Protein Hydrolysates in Biotechnology, 2010, pp. 1–9 Search PubMed.
- C. Burnett, W. F. Bergfeld, D. V. Belsito, R. A. Hill, C. D. Klaassen, D. C. Liebler, J. G. Marks, R. C. Shank, T. J. Slaga, P. W. Snyder, F. A. Andersen and B. Heldreth, Int. J. Toxicol., 2018, 37, 55S–66S CrossRef CAS.
Footnote |
| † Electronic supplementary information (ESI) available. See DOI: 10.1039/d0ra08830g |
| This journal is © The Royal Society of Chemistry 2021 |