
 Open Access Article
 This Open Access Article is licensed under a Creative Commons Attribution-Non Commercial 3.0 Unported Licence
A simple and sensitive approach for the electrochemical determination of amaranth by a Pd/GO nanomaterial-modified screen-printed electrode
Somayeh Tajika,
Hadi Beitollahi *b,
Ho Won Jang*c and
Mohammadreza Shokouhimehr*c
*b,
Ho Won Jang*c and
Mohammadreza Shokouhimehr*c
aResearch Center for Tropical and Infectious Diseases, Kerman University of Medical Sciences, Kerman, Iran
bEnvironment Department, Institute of Science and High Technology and Environmental Sciences, Graduate University of Advanced Technology, Kerman, Iran. E-mail: h.beitollahi@yahoo.com
cDepartment of Materials Science and Engineering, Research Institute of Advanced Materials, Seoul National University, Seoul 08826, Republic of Korea. E-mail: hwjang@snu.ac.kr; mrsh2@snu.ac.kr
First published on 23rd December 2020
Abstract
It is essential to develop easy-to-use sensors towards a better monitoring of food additives so that human health can be positively influenced. A type of critical food additive that is widely used in making soft drinks and diverse foodstuff is called amaranth. This study aimed at presenting a novel Pd/GO nanomaterial-modified screen-printed electrode (Pd/GO/SPE), which is responsible for providing a sensing interface during the process of specifying the electrochemical features of amaranth. The morphology and structure of the Pd/GO nanomaterial was investigated by Fourier-transform infrared spectroscopy, thermal gravimetric analysis, X-ray photoelectron spectroscopy, X-ray diffraction, energy-dispersive X-ray spectroscopy, scanning transmission electron microscopy, and high-resolution transmission electron microscopy. When the optimized conditions was adjusted, Pd/GO/SPE proved to be a capable sensor for conducting a very sensitive sensing towards the amaranth under a common working situation of 575 mV. In this regard, it was embarked on measuring some of the sensor features, including its sensitivity, linear dynamic range, and detection limit for amaranth with the values of 0.0948 μA μM−1, 0.08 μM–360.0 μM and 30.0 nM were obtained, respectively.
1. Introduction
High stability, lasting color, good solubility, and low-cost are among special properties of amaranth (E 123), an inorganic azo colorant, which makes it a widely used additive used in numerous foods such as cakes, drinks, candies and desserts. However, health problems including anxiety, allergy, dizziness, and sometimes cancer could be caused by artificial azo colorants compared to natural colorants.1–4 Therefore, U.S.A. has forbidden the use of amaranth in food, and China does not allow amounts of this additive in soft drinks over the maximum limit of 0.05 g kg−1 (GB2760-2014).5–7 Amaranth has recently been determined by numerous methods, namely spectrophotometry,8,9 high performance liquid chromatography (HPLC),10,11 thin layer chromatography (TCL),12 electrochemical analysis,13–18 fluorescence,19,20 colorimetry,21 and electrophoresis.22 Electrochemical method is superior to the aforementioned methods due to the excellent merits, e.g., easy operation, low cost, simple equipment requirement, and quick response.23–27 Despite the fact that numerous electrochemical sensors with high sensitivity are built for analyte determination, there is still a challenge of high selectivity for the determination of numerous compounds in the analysis of real samples.28–44 This challenge is caused by the interferences of structural analogues. Thus, high selectivity of new electrochemical sensors is required for real application.The electrochemical field has witnessed the enormous use of screen-printed carbon electrodes (SPCEs) mainly because of the optimal characteristics of SPCEs, including wide potential window, standard background current, good chemical stability, and affordable methods.45–49 Furthermore, the SPCE surface is flexibly modifiable to suit numerous purposes associated with different analytes, which can also improve in numerous ways. Such versatility, along with its miniaturized size as well as its potential for being connected to portable tools and instruments allows for the on-site specification of target analytes.50–52
Consequently, little information is available on the bare electrodes for the determination of analytes since unmodified electrodes are unable to distinguish signals of analytes, which pushes researchers into using numerous inorganic and organic materials in order to modify such electrodes. The most developed sensors among chemically modified ones are the nanostructured materials.53–56
Presently, metal nanoparticles, graphene, carbon nanotubes, fullerenes, etc., are utilized in sensor applications and biomedicine because of the fact that nanomaterials have basic properties such as mechanical features, good optical, smaller size, and magnetic characteristics.57,58 Metal nanoparticles have attracted considerable attention over the last few decades due to their unique features and large ratio of surface-to-volume compared with their bulk counter parts.59 Once the screen-printed electrode is modified with numerous nanomaterials, its performance will improve with regard to selectivity and sensitivity, and subsequently, the rate of electron transfer increases between the electroactive species and the electrode surface.60
In this study, the use of the Pd/GO nanomaterial-modified screen-printed electrode (Pd/GO/SPE) as a sensor for the voltammetric determination of amaranth is described. A good electrocatalytic effect of the proposed sensor on amaranth was well observed. In the end, the analytical performance of the suggested sensor for amaranth determination in real samples will be evaluated.
2. Experimental
2.1. Apparatus and chemicals
An Autolab potentiostat/galvanostat (PGSTAT 302N, Eco Chemie, the Netherlands) is utilized to measure electrochemicals. General Purpose Electrochemical System (GPES) software is considered for controlling conditions of experiments. Moreover, SPE (DropSens; DRP-110: Spain) possessed three usual unmodified graphite working electrode and electrodes of the graphite counter electrode and also a silver pseudo-reference electrode. A Metrohm 710 pH meter was utilized to determine pH. Nano Pure System (Barnstead) was used to deionize water. The use of the conventional Al Kα source (Sigma probe, VG Scientific) aimed at performing X-ray photoelectron spectroscopy (XPS). X-ray diffraction (XRD, D8-Advance) with high resolution, scanning TEM (STEM, JEOL JEM-2100F), transmission electron microscopy (TEM, JEOL JEM-3010) supplied with an energy-dispersive X-ray spectroscopic (EDX) analysis, thermogravimetric analyses (TGA, concurrent DTA/TGA analyst) as well as infrared radiations (IR, Nicolet iS50) were all used to investigate the provided Pd/GO nanomaterial.Amaranth and all other reagents used were of analytical grade. They were purchased from Merck and Sigma-Aldrich companies with highest available purity. Orthophosphoric acid as well as the related salts, which are above the pH range of 2.0–9.0 are utilized to prepare the solutions of buffer. The highest available grade of organic reagents as well as F127 was provided from Sigma-Aldrich Co. for the present study. The chemicals used in this study were purchased from the Sigma-Aldrich and Alfa Chemical Companies. Water was deionized by a Nano Pure System (Barnstead).
2.2. Preparing Pd/GO nanomaterial
The synthesis of graphene oxide from graphite was performed using the modified Hummer's procedure. Typically, the addition of commercial graphite powder (10 g) to 230 mL condensed H2SO4 subject to cooling under the temperature of 20 °C was carried out, after which the addition of 300 g potassium permanganate took place at the time of stirring. A temperature of 40 °C was then considered for the adjustment of the reaction, while stirring continuously for 1 h. The addition of water (500 mL) and increasing the temperature up to 100 °C were the next steps, followed by the slow addition of 2.5 mL H2O2 (30 wt%) to the resulting compound. HCl solution (200 mL) was used to wash and purify the suspension with the use of a filter together with a funnel. Neutrality of the mixture was taken into account for the repetition of the suspension washing. A mixing procedure at the temperature of room was performed for the synthesis of Pd/GO nanomaterial preparation. The addition of 30 mL of GO solution (5 mg mL−1) using a beaker and its stirring at the room temperature were performed, after which a Pluronic F-127 solution with water as the solvent (2 g) was introduced. Eventually, Pd NPs decorated on GO could be produced by the addition on K2PdCl4 (100 mg) to the solution and stirring it for over 10 h at room temperature. Filtration and complete washing of the suspension were performed using hot water as well as ethanol. The re-dispersion of the supplied Pd/GO nanomaterial in aqueous media was then performed as the final step, leading to the overall supplied Pd/GO solution concentration equal to 30 mg mL−1.2.3. Preparing the electrodes
According to the research design, the Pd/GO nanomaterial has been used to coat the bare SPE based on a simplified process. Then, the dispersion of 1 mg of the Pd/GO nanomaterial has been done in 1 mL aqueous solution in 45 min ultra-sonication. Then, 5 μL of the procured suspension has been dropped on the carbon working electrode surfaces. Finally, the solution has been kept at room temperature to be dried.3. Result and discussion
3.1. Characterization of the Pd/GO nanomaterial
Simple lining of Pd NPs on the GO sheet surface aimed at producing the Pd/GO nanomaterial with excellent catalytic activities. STEM (Fig. 1) was used to display the GO and Pd/GO nanomaterial surface morphologies. Uniform and discrete decoration of the small Pd NPs (∼5 nm) was performed on the GO surface to increase their active sites for exposure along with the Pd/GO nanomaterial specific surface area.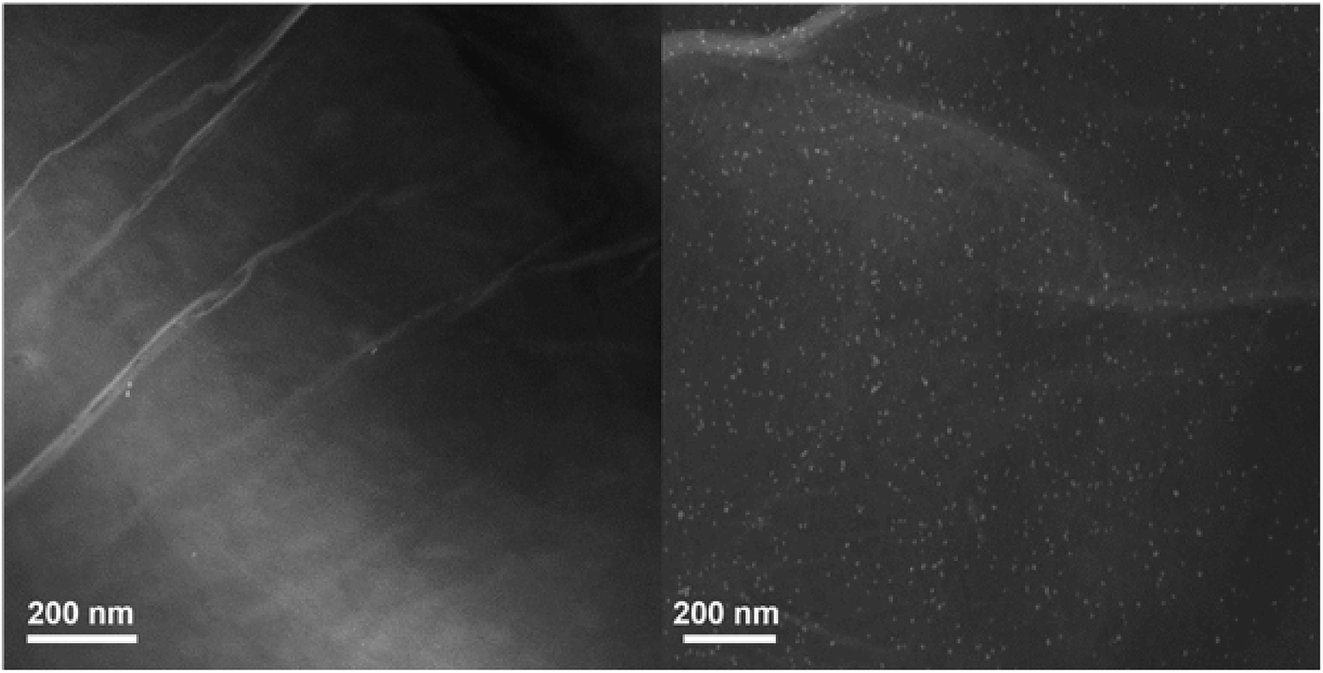 | ||
| Fig. 1 STEM images of GO and Pd/GO nanomaterial. | ||
The results obtained from EDX mapping (Fig. 2) indicated quite well Pd NP distribution across the GO, while the Pd/GO nanomaterial with the capability of being reproduced was successfully provided via a green and uncomplicated procedure. Moreover, it was shown by the HRTEM images that uniformity in the decoration of Pd NPs on GO would also yield similar results. The Pd NP distribution density was approximately 510 μm−1. No detachable damages were shown by the Pd NP presence on the GO support and the appearance of ripples in GO sheets could obviously be observed. Furthermore, the HRTEM images (Fig. 3) indicated fine crystalline Pd NPs with a diameter of ∼5 nm. Also, the TEM images indicated similar results in a way that the uniform loading of Pd NPs on GO could be observed. Distinct confirmation of carbon and Pd species' presence in Pd/GO was achieved by EDX.
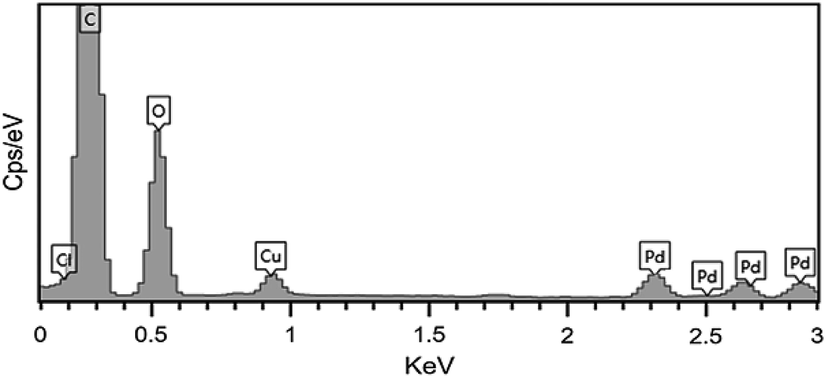 | ||
| Fig. 2 The EDX spectrum of the Pd/GO nanomaterial. | ||
 | ||
| Fig. 3 HRTEM images of the Pd/GO nanomaterial. | ||
XRD characterizations were performed for more investigation of the crystal structure in both GO and Pd/GO NC. The XRD results of GO indicated a maximum at 10.90°, representing the GO layer disorder stack (Fig. 4). Nevertheless, the appearance of main maximum values at 2θ = 40.02°, 46.59°, 68.08°, and 82.90° in Pd/GO XRD patterns to (111), (200), (220), and (311), respectively, (JCPDS 01-087-0641) could obviously demonstrate that Pd NP loading had been successfully decorated on GO.
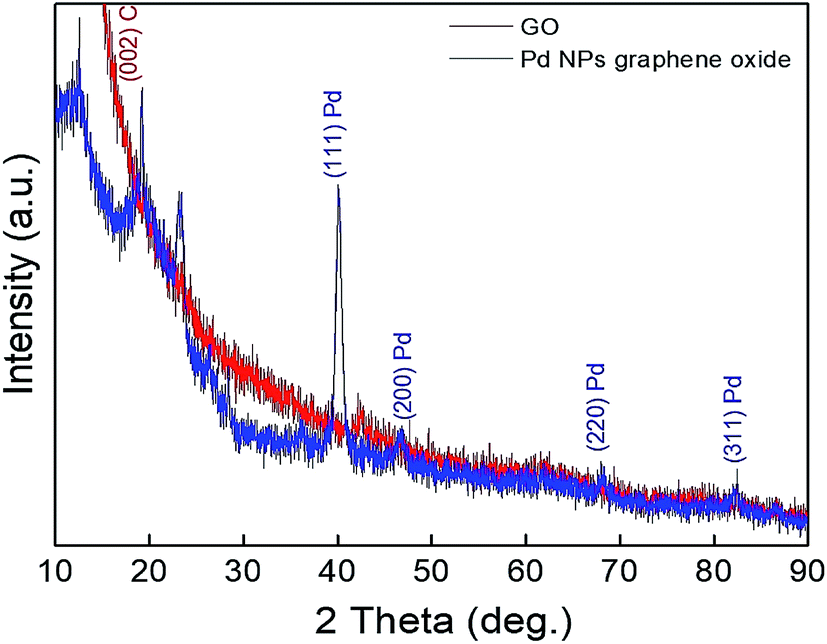 | ||
| Fig. 4 XRD patterns for GO and Pd/GO nanomaterial. | ||
FT-IR was used to confirm the GO and Pd/GO surface stabilities (Fig. 5). Heavy residuals of H2O compared to that of Pd/GO ever after drying dried is confirmed by the powerful adsorption band at 3450 cm−1 (O–H stretching vibration) regarding GO. Moreover, the specific adsorption bands were at 1725 cm−1 attributed to the C![[double bond, length as m-dash]](https://www.rsc.org/images/entities/char_e001.gif) O stretching vibrations and 1600 cm−1 attributed to the CC (graphene skeletal vibration) in GO. Nevertheless, the two maximum values experienced a Pd/GO decrease, which reflects decreasing F127.
O stretching vibrations and 1600 cm−1 attributed to the CC (graphene skeletal vibration) in GO. Nevertheless, the two maximum values experienced a Pd/GO decrease, which reflects decreasing F127.
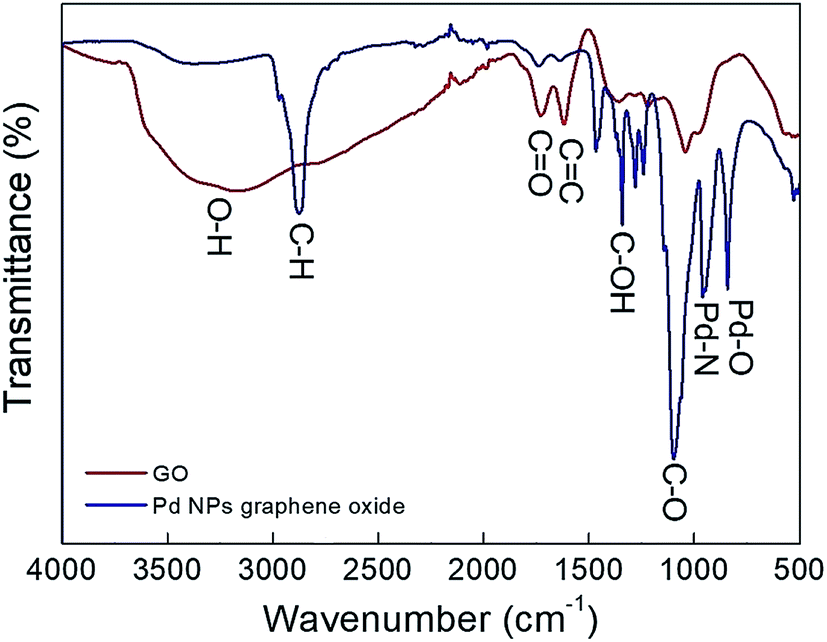 | ||
| Fig. 5 FT-IR analysis of GO and Pd/GO nanomaterial. | ||
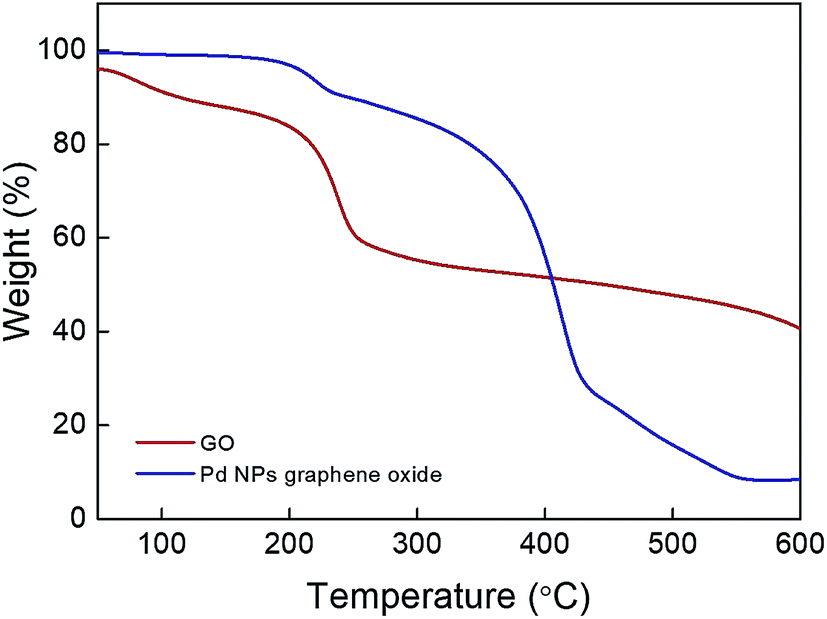
The different values in FT-IR represent the structural variations following the Pd loading that can also be obtained in the TGA analysis for GO as well as Pd/GO (Fig. 6). Losing intercalated water molecules leads to the GO weight loss (∼16%), after which there is the second reduction taking place quickly with respect to the functional group decomposition at approximately 200 °C, while ∼5% weight loss in the case of Pd/GO indicates the existence of insignificant amounts of moisture in the nanomaterial provided, demonstrating the removal of the moist content and unstable oxygen functional groups when mild F127 is introduced. Sudden increase in the lost weight at ∼400 °C in the case of Pd/GO may show associations with the F127 removal. It was supposed that the Pd NP loading mechanism on GO would be associated with the decreasing effects of F127 with OH functional groups, as the factor with contributions to the reduction for the Pd ions. The transfer of the OH functional groups into carbonyl groups was the next step, which followed this process.
 | ||
| Fig. 6 TGA analysis of GO and Pd/GO nanomaterial. | ||
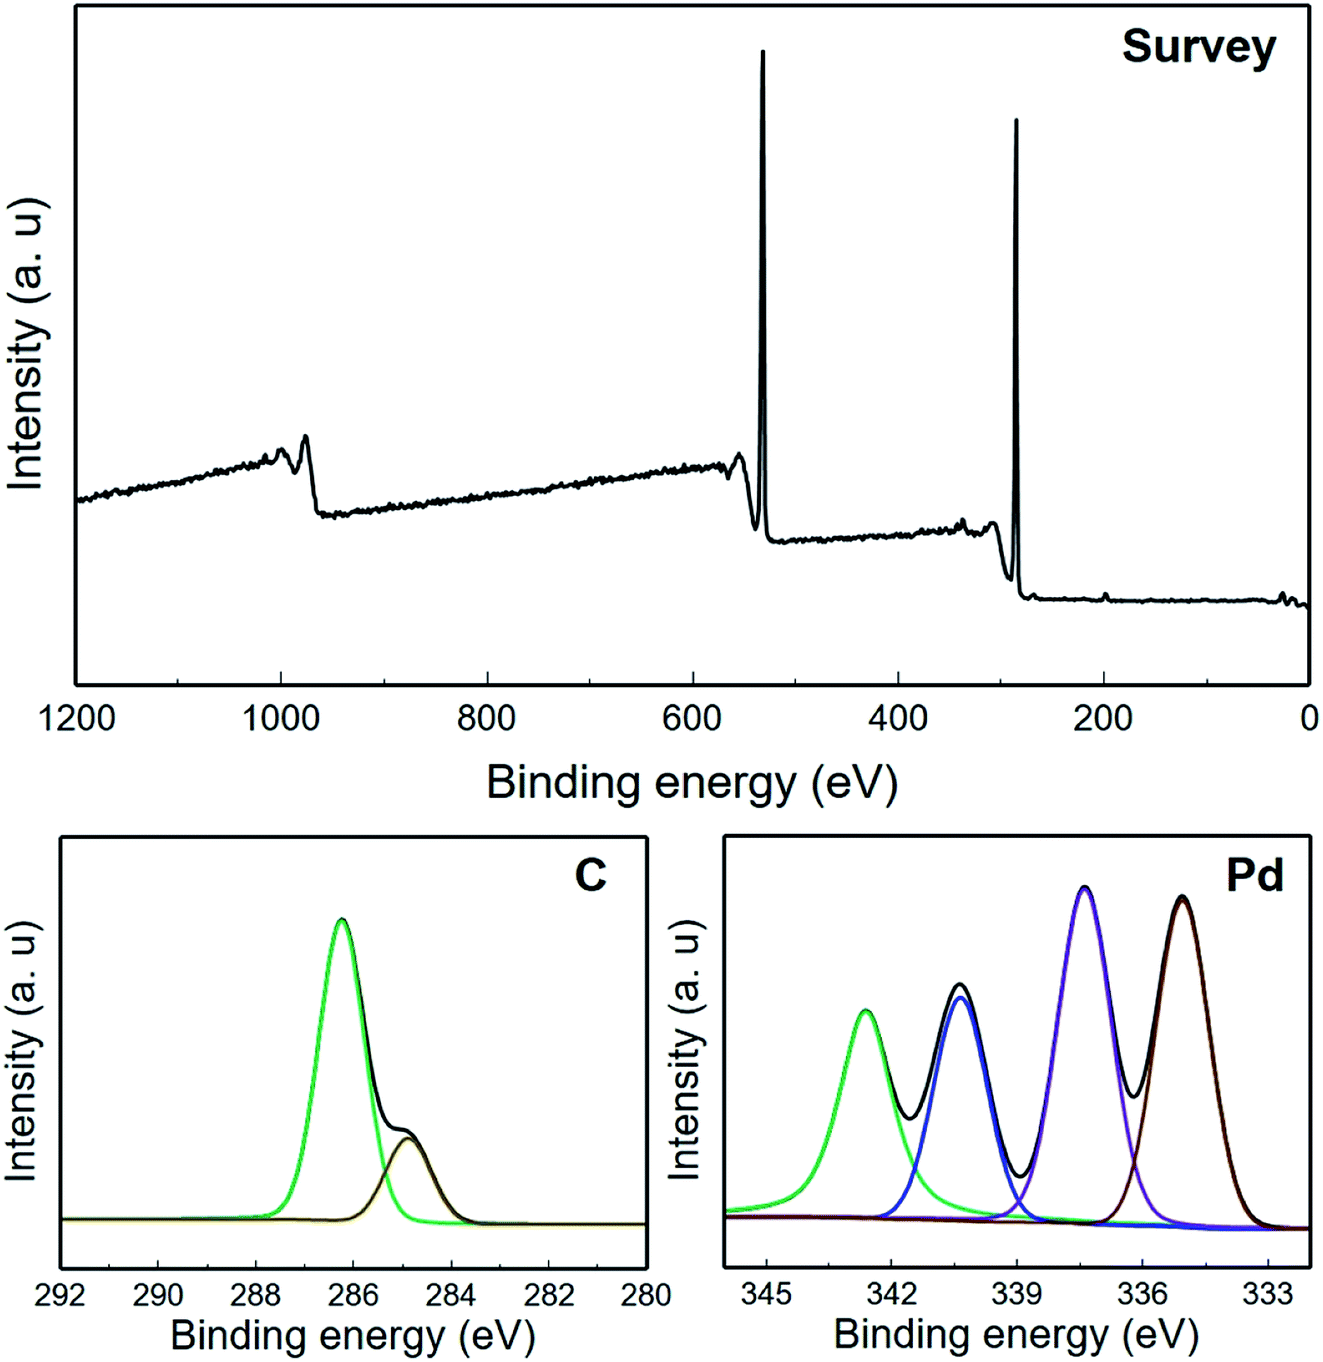
Fig. 7 indicates the XPS analysis related to Pd/GO NC. The XPS spectrum shows the Pd/GO surface composition along with the Pd NP appearance on GO. Moreover, a considerable decrease in the number of oxygen functional groups can be observed given the reducing procedure in relation to Pluronic F127. Interaction with the GO oxygen functional groups was shown by the Pd ions in the solution because Pd possessed electrophilic properties that led to the generation of a Pd–O linkage, consequently facilitating the Pd anchoring on the GO surface. Furthermore, the present functional imperfect locations on GO are capable of reducing the Pd ion mobility, subsequently avoiding the aggregation and facilitating the maintenance of Pd NPs.
 | ||
| Fig. 7 XPS analysis of the Pd/GO nanomaterial. | ||
3.2. The electrochemical profile of amaranth on Pd/GO/SPE
For studying electrochemical behaviours of amaranth which are pH dependant, providing an optimized pH-value could be of high significance to obtain acceptable outputs. Hence, the modified electrode is used for conducting experiments under different pH values ranging from 2.0 to 9.0. Finally, the most promising outputs are seen in the case of electrooxidation of amaranth at the pH equal to 7.0.Fig. 8 depicts CVs for amaranth oxidation at bare SPE (a) and Pd/GO/SPE (b) in 0.1 M PBS (pH of 7.0) solution containing 125.0 μM amaranth at the scan rate of 50 mV s−1. The anodic peak potential for amaranth oxidation on the bare SPE was about 850 mV, while on Pd/GO/SPE, the peak potential is around 575 mV. This reduction of around 275 mV proposes that the Pd/GO nanomaterial possesses a highly efficient electrocatalytic activity considering the oxidation of amaranth. The improvement of the anodic peak current using ∼4.6 times demonstrates excellent Pd/GO/SPE properties like appropriate electron transfer rate and high surface area.
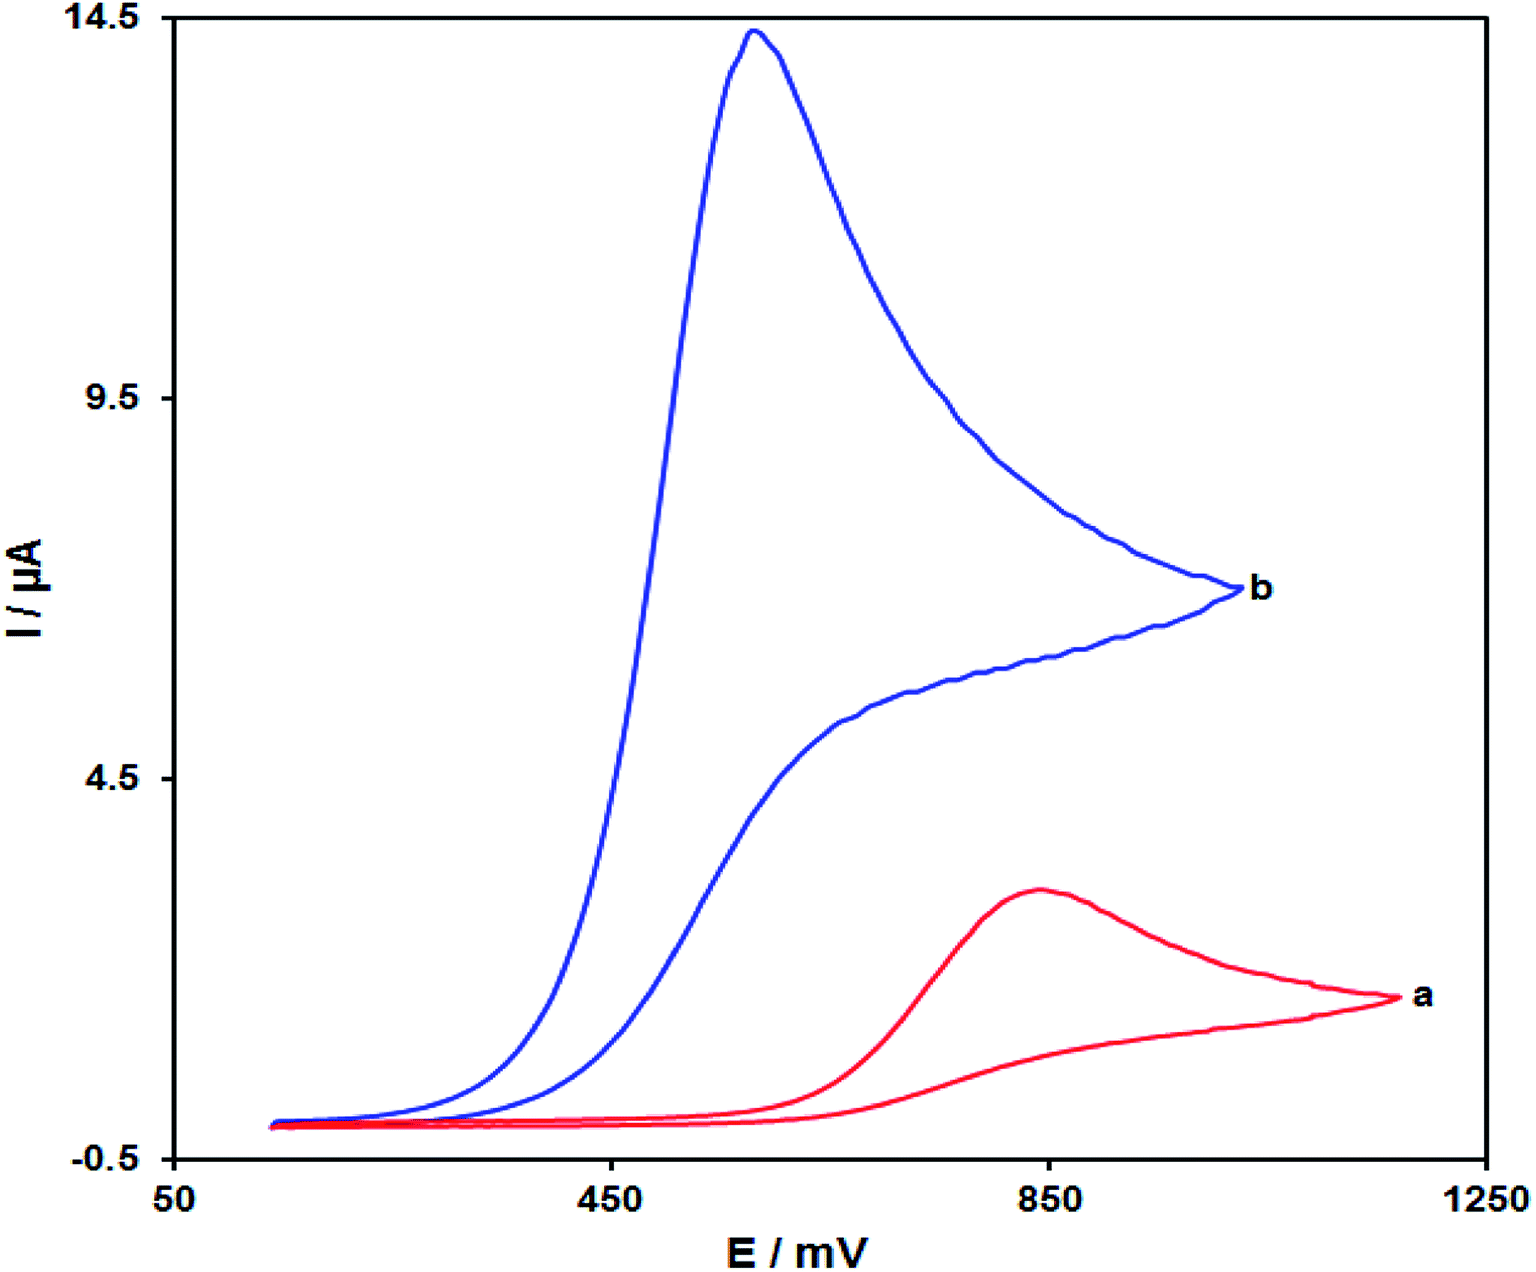 | ||
| Fig. 8 CVs of (a) SPE and (b) Pd/GO/SPE, in the presence of 125.0 μM of amaranth at pH equal to 7.0. The scan rates in each case equalled 50 mV s−1. | ||
3.3. Effects of the scan rates on the outputs
The relationship between the scan rate and peak current present promising data with respect to electrochemical mechanisms. Hence, the influence of the scan rate on the peak current of 100.0 μM of amaranth is studied by LSV in the range from 10 to 500 mV s−1 in PBS (0.1 M, pH equal to 7.0) (Fig. 9). The electrode response of amaranth is a diffusion-controlled process since the peak current of oxidation is proportional to the square root of the scan rate (Fig. 9, inset). | ||
| Fig. 9 LSV of Pd/GO/SPE in 0.1 M PBS (pH equal to 7.0) consisting of 100.0 μM amaranth at diverse scan rates. 1–6 corresponded to 10, 25, 50, 100, 300 and 500 mV s−1. Inset: variations in the anodic peak currents versus ν1/2. | ||
Fig. 10 demonstrates a Tafel plot that represents the data achieved from the increasing part of the current against voltage curve recorded under a constant scan rate (10 mV s−1). It is notable that this part of the voltammogram called the Tafel region is affected using the electron transfer kinetics between the substrate (amaranth) and Pd/GO/SPE. The number of electrons considered in the rate determining step is predicted from the Tafel plot slope. A slope of 0.1672 V is achieved for amaranth. In the rate determining step, considering one electron transfer, charge transfer coefficient (α) was calculated as 0.65 for amaranth.
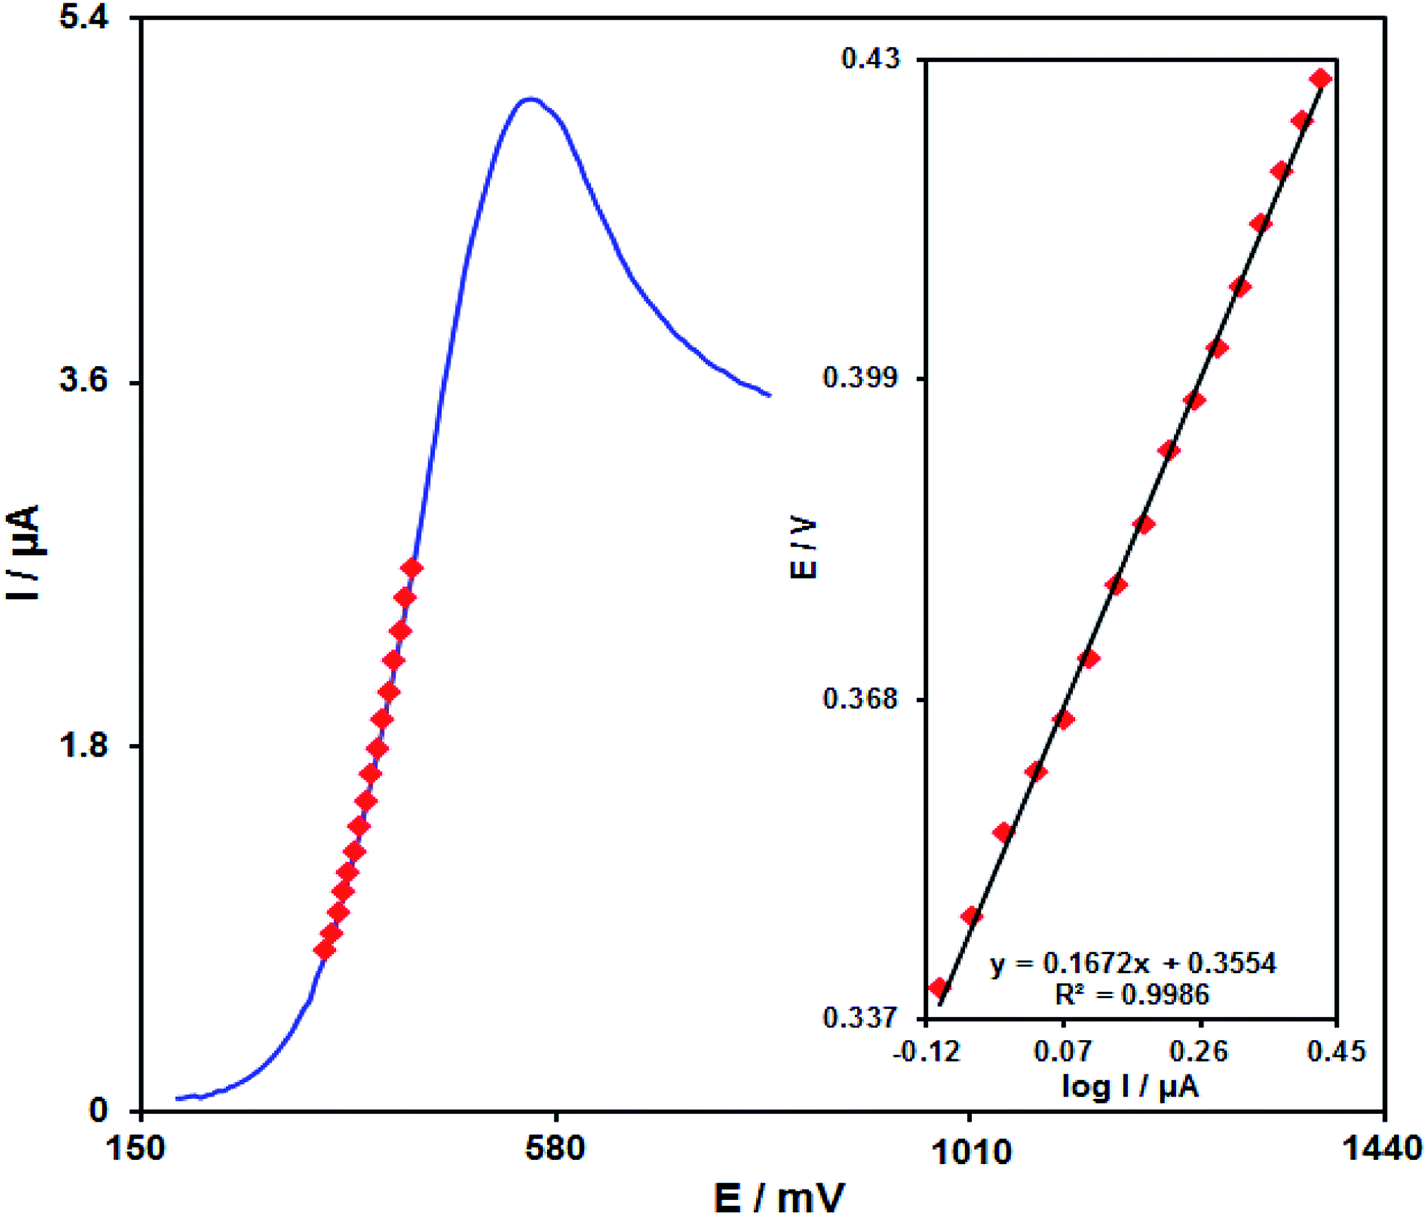 | ||
| Fig. 10 The LSV at 10 mV s−1 of Pd/GO/SPE in 0.1 M PBS under pH of 7.0 by 100.0 μM amaranth. Inset shows the Tafel plot. | ||
3.4. Chronoamperometric analysis
A chronoamperometric study was carried out for calculating the diffusion coefficient (D) of amaranth on the surface Pd/GO/SPE at an optimum condition. Fig. 11 displays the chronoamperometric results of diverse concentrations of the amaranth sample in PBS considering pH of 7.0. In addition, the Cottrell equation is proposed in the case of the chronoamperometric analysis of the electroactive moiety in the basis of the mass transfer restricted states:| I = nFAD1/2Cbπ−1/2t−1/2 |
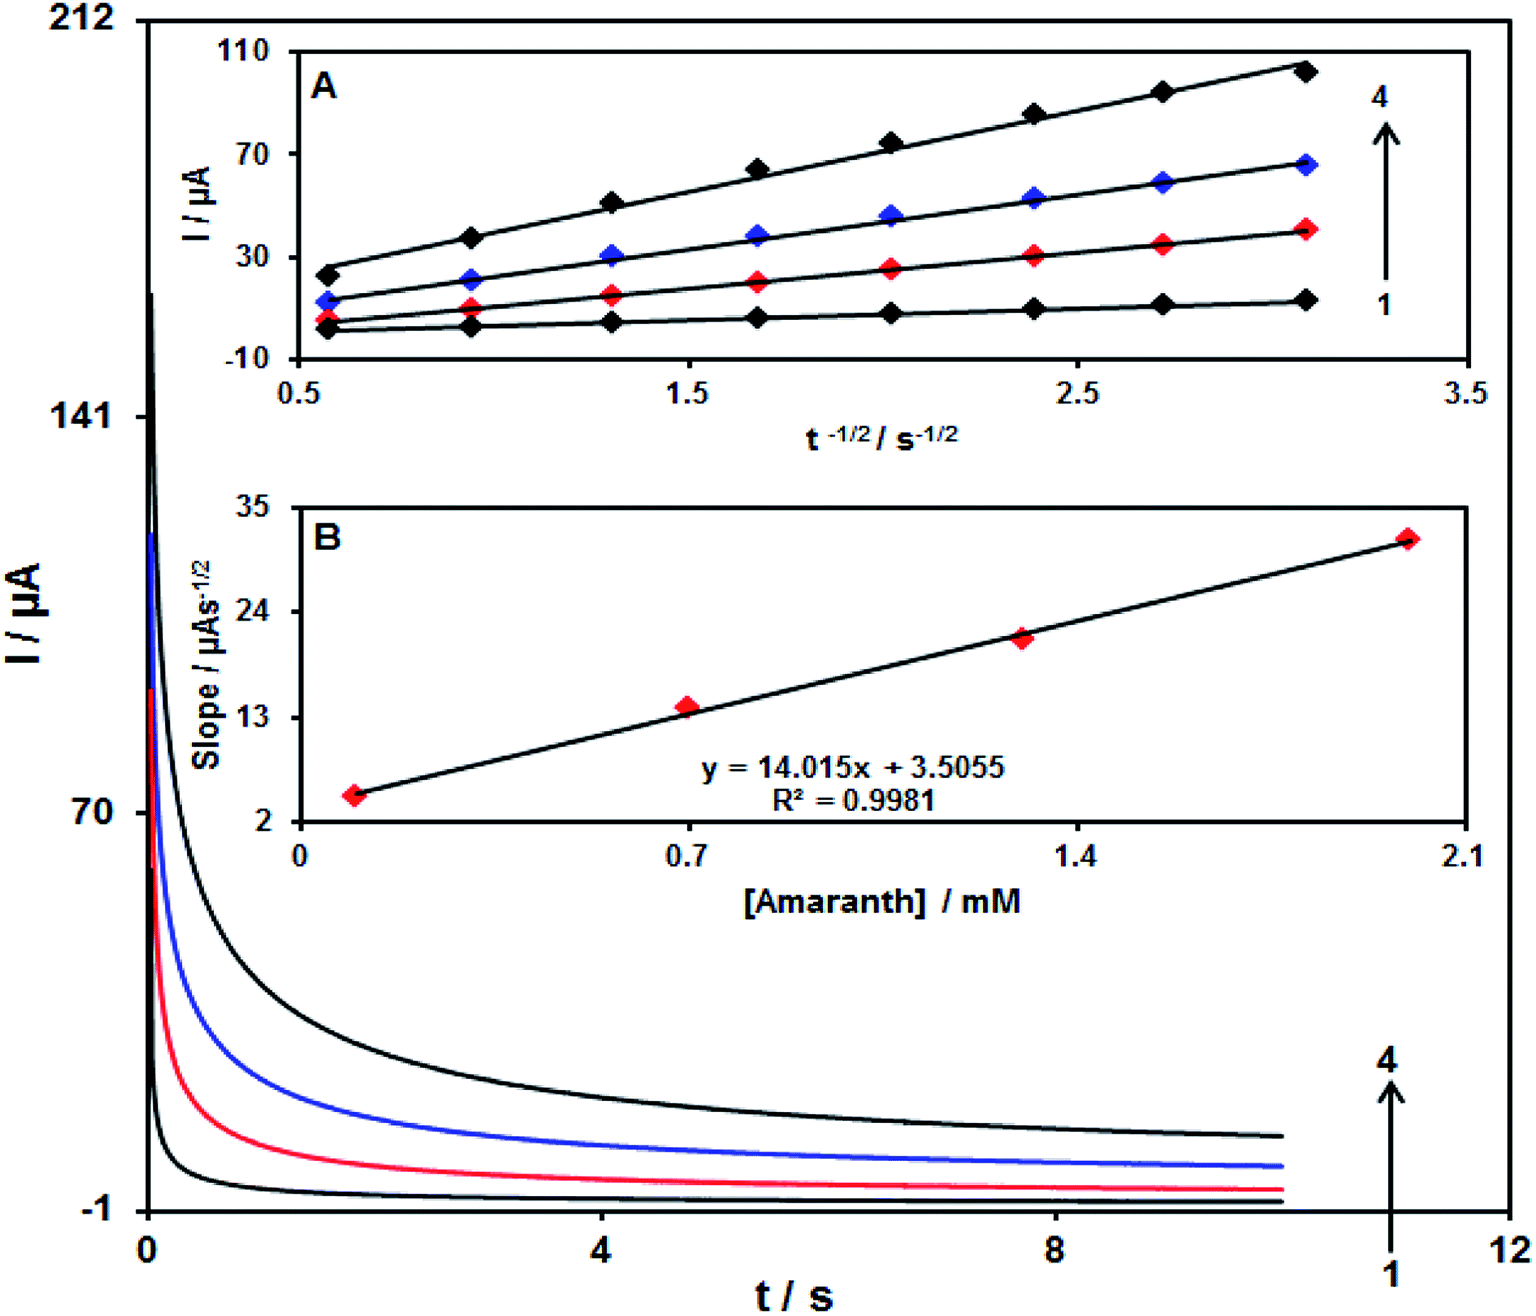 | ||
| Fig. 11 The chronoamperograms obtained at Pd/GO/SPE in 0.1 M PBS at pH of 7.0 for distinct concentrations of amaranth. Note that, 1 to 4 related to 0.1, 0.7 1.3, and 2.0 mM of amaranth. (Inset A) The I plot versus t−1/2 observed by chronoamperograms 1 to 4. (Inset B) Slope plot of the straight line vs. concentration of amaranth. | ||
Fig. 11A demonstrated experimental outcomes of I vs. t−1/2, showing the most proper fit for various concentrations of amaranth. In addition, in Fig. 11A, final slopes relative to the straight lines are drawn vs. amaranth concentration (Fig. 11B). Hence, the D mean value equalled 1.6 × 10⁻⁵ cm2 s−1 with regard to the Cottrell equation and resultant slopes.
3.5. Calibration curve
The DPV method explored the relationship that exists between the peak current and different concentrations of amaranth. As shown in Fig. 12, the DPVs of Pd/GO/SPE in the presence of distinct concentration of amaranth is recorded in the concentration range of 0.08–360.0 μM. The detection limit of 30.0 nM has been achieved for the analysis of amaranth on the surface of Pd/GO/SPE. Table 1 presents a comparison study of voltammetric techniques for the detection of amaranth at the as-prepared electrode in this study and some other studies. | ||
| Fig. 12 DPVs of Pd/GO/SPE in 0.1 M PBS with pH equal to 7.0 consisting of distinct concentrations of amaranth. 1 to 11 with respect to 0.08, 2.5, 10.0, 30.0, 60.0, 100.0, 150.0, 200.0, 250.0, 300.0 and 360.0 μM of amaranth. The inset demonstrates the peak current plot as a function of the amaranth concentration ranging from 0.08 to 360.0 μM. | ||
| Electrochemical sensor | Method | Linear dynamic range | Limit of detection | Ref. |
|---|---|---|---|---|
| a Multi-wall carbon nanotube thin film-modified gold electrode.b MWCNT film-modified glassy carbon electrode.c Mercury meniscus-modified silver solid amalgam electrode (m-AgSAE).d Liquid mercury free-polished AgSAE (pAgSAE).e Direct current adsorptive stripping voltammetry (DCAdSV).f 1-Methyl-3-butylimidazolium bromide and CuO-decorated single-wall carbon nanotubes modified carbon paste electrode.g Square wave voltammetry.h RuO2 nano-road and 1,3-dipropylimidazolium bromide modified CPE.i SWCNT–titanium nitride nanocomposite modified GCE. | ||||
| MWCNT/GEa | DPV | 1.0 × 10⁻⁵ to 1.0 × 10⁻⁶ M | 6.8 × 10⁻⁸ M | 3 |
| MWCNT/GCEb | DPV | 40 nM to 0.8 μM | 35 nM | 6 |
| m-AgSAEc | DCAdSVe | 4.0 × 10⁻⁹ to 8.9 × 10⁻⁸ M | 2.1 × 10⁻⁹ M | 18 |
| pAgSAEd | 8.9 × 10⁻⁸ to 7.0 × 10⁻⁷ M | 1.5 × 10⁻⁸ M | ||
| 1-M-3-BIBr/CuO/SWCNT/CPEf | SWVg | 0.004–750 μM | 1.0 nM | 61 |
| RuO2 NR/DPIBr/CPEh | SWV | 0.008–550 μM | 3.0 nM | 62 |
| SWCNT–TiN/GCEi | DPV | 0.1–100 μM | 40 nM | 63 |
| Pd/GO/SPE | DPV | 0.08 μM–360.0 μM | 30.0 nM | This work |
3.6. Stability, repeatability and reproducibility of Pd/GO/SPE
The stability of Pd/GO/SPE was evaluated by recording the oxidation signal equal to 50.0 μM amaranth for more than a period of 2 weeks. After 2 weeks, 2.6% deviation is detected with the compression of the first oxidation signal of amaranth that proved promising stability of Pd/GO/SPE as a voltammetric sensor.In order to analyze the repeatability of the response of Pd/GO/SPE, the peak currents of CV experiments of 50.0 μM amaranth after 12 times using the same sensor are measured and then compared. For the results, the relative standard deviation (RSD) is found to be 2.8%, demonstrating the appropriate repeatability of the modified electrode.
The reproducibility of this sensor was examined by using five Pd/GO/SPEs in the same condition containing 50.0 μM amaranth, and the RSD value for this compound was founded to be 2.4%. This RSD value for the analysis of amaranth reflects that Pd/GO/SPE showed a good reproducibility property.
3.7. Analysis of real samples
Finally, the performance of Pd/GO/SPE as a new electrochemical sensor for analyzing amaranth in different samples of water samples and fruit juices. Table 2 shows obtained data as well as the recovery data proved the ability of Pd/GO/SPE as a sensitive sensor in the case of the analysis of amaranth in real samples.| Sample | Spiked | Found | Recovery (%) | R.S.D. (%) |
|---|---|---|---|---|
| a All the concentrations are in μM (n = 3). | ||||
| Orange juice | 0 | — | — | — |
| 5.0 | 4.9 | 98.0 | 2.4 | |
| 7.0 | 7.2 | 102.9 | 3.5 | |
| 9.0 | 9.1 | 101.1 | 1.7 | |
| 11.0 | 10.9 | 99.1 | 2.2 | |
| Apple juice | 0 | — | — | — |
| 4.0 | 4.1 | 102.5 | 1.9 | |
| 6.0 | 5.9 | 98.3 | 2.3 | |
| 8.0 | 8.1 | 101.3 | 2.1 | |
| 10.0 | 9.9 | 99.0 | 3.2 | |
| Tap water | 0 | — | — | — |
| 5.0 | 5.1 | 102.0 | 3.4 | |
| 7.5 | 7.3 | 97.3 | 1.8 | |
| 10.0 | 10.3 | 103.0 | 2.9 | |
| 12.5 | 12.4 | 99.2 | 2.4 | |
4. Conclusions
In this study, we reported the green synthesis and characterization of the Pd/GO nanomaterial. The as-synthesized Pd/GO nanomaterial was used as an electrocatalyst to modify SPE for amaranth detection. The voltammetric obtained data confirmed the significant enhancement of the oxidation current and reduction overpotential for the electrooxidation of amaranth at the surface of Pd/GO/SPE compared to the bare SPE. Pd/GO/SPE showed excellent sensitivity towards amaranth detection (0.0948 μA μM−1) with good linear response in a wide concentration range (0.08 μM–360.0 μM), and low detection limit (30.0 nM). In addition, the proposed sensor presented long-term stability, good repeatability, and excellent reproducibility. Furthermore, the potential utility of this sensor was validated by the analysis of amaranth in real samples (e.g., orange juice, apple juice, and tap water) and good recoveries could be obtained from different spiked values. Consequently, this sensor functions as an appropriate sensing platform for other food additives and appears to be highly promising.Conflicts of interest
There are no conflicts to declare.Acknowledgements
This research was supported by the National Research Foundation of Korea (NRF) funded by the Ministry of Science and ICT (2020M2D8A206983011). Furthermore, the financial support from the Basic Science Research Program (2017R1A2B3009135) through the National Research Foundation of Korea is appreciated.References
- M. P. Char, E. Niranjana, B. K. Swamy, B. S. Sherigara and K. V. Pai, Int. J. Electrochem. Sci., 2008, 3, 588 CAS.
- Q. He, J. Liu, X. Liu, G. Li, P. Deng and J. Liang, Colloids Surf., B, 2018, 172, 565 CrossRef CAS.
- S. Chandran, L. A. Lonappan, D. Thomas, T. Jos and K. G. Kumar, Food Anal. Methods, 2014, 7, 741 CrossRef.
- Q. Han, X. Wang, Z. Yang, W. Zhu, X. Zhou and H. Jiang, Talanta, 2014, 123, 101 CrossRef CAS.
- Y. Zhang, T. Gan, C. Wan and K. Wu, Anal. Chim. Acta, 2013, 764, 53 CrossRef CAS.
- P. Wang, X. Hu, Q. Cheng, X. Zhao, X. Fu and K. Wu, J. Agric. Food Chem., 2010, 58, 12112 CrossRef CAS.
- M. Wang, Y. Gao, Q. Sun and J. Zhao, Food Chem., 2015, 172, 873 CrossRef CAS.
- J. J. Berzas-Nevado, C. Guiberteau-Cabanillas, A. M. Contento-Salcedo and R. Martin-Villamuelas, Anal. Lett., 1999, 32, 1879 CrossRef CAS.
- C. C. Blanco, A. G. Campana and F. A. Barrero, Talanta, 1996, 43, 1019 CrossRef CAS.
- M. Kucharska and J. Grabka, Talanta, 2010, 80, 1045 CrossRef CAS.
- F. E. Lancaster and J. F. Lawrence, Food Addit. Contam., 1989, 6, 415 CrossRef CAS.
- T. X. Tang, X. J. Xu, D. M. Wang, Z. M. Zhao, L. P. Zhu and D. P. Yang, Food Anal. Methods, 2015, 8, 459 CrossRef.
- I. Elaissaoui, H. Akrout, S. Grassini, D. Fulginiti and L. Bousselmi, Chemosphere, 2019, 217, 26 CrossRef CAS.
- L. Li, H. Zheng, L. Guo, L. Qu and L. Yu, Talanta, 2019, 197, 68 CrossRef CAS.
- Y. Gao, L. Wang, Y. Zhang, L. Zou, G. Li and B. Ye, Talanta, 2017, 168, 146 CrossRef CAS.
- S. Jing, H. Zheng, L. Zhao, L. Qu and L. Yu, Food Anal. Methods, 2017, 10, 3149 CrossRef.
- L. Ji, Y. Zhang, S. Yu, S. Hu and K. Wu, J. Electroanal. Chem., 2016, 779, 169 CrossRef CAS.
- S. Tvorynska, B. Josypčuk, J. Barek and L. Dubenska, Food Anal. Methods, 2019, 12, 409 CrossRef.
- Y. Li, S. Luo, L. Sun, D. Kong, J. Sheng, K. Wang and C. Dong, Food Anal. Methods, 2019, 12, 1658 CrossRef.
- L. Liu, Z. Mi, H. Li, C. Li, Q. Hu and F. Feng, RSC Adv., 2019, 9, 26315 RSC.
- S. Wu, Y. Yu, C. Zhang and F. Chen, J. Anal. Sci. Technol., 2020, 11, 1 CrossRef.
- M. Perez-Urquiza and J. L. Beltran, J. Chromatogr. A, 2000, 898, 271 CrossRef CAS.
- H. Karimi-Maleh, F. Karimi, Y. Orooji, G. Mansouri, A. Razmjou, A. Aygun and F. Sen, Sci. Rep., 2020, 10, 1 CrossRef.
- H. Karimi-Maleh, F. Karimi, S. Malekmohammadi, N. Zakariae, R. Esmaeili, S. Rostamnia, M. LütfiYola, N. Atar, S. Movaghgharnezhad, S. Rajendran, A. Razmjou, Y. Orooji, S. Agarwal and V. K. Gupta, J. Mol. Liq., 2020, 310, 113185 CrossRef CAS.
- H. Karimi-Maleh, F. Karimi, M. Alizadeh and A. L. Sanati, Chem. Rec., 2019, 20, 682 CrossRef.
- H. Karimi-Maleh, K. Cellat, K. Arıkan, A. Savk, F. Karimi and F. Şen, Mater. Chem. Phys., 2020, 250, 123042 CrossRef CAS.
- H. Karimi-Maleh and O. A. Arotiba, J. Colloid Interface Sci., 2020, 560, 208 CrossRef CAS.
- H. Beitollahi, H. Karimi-Maleh and H. Khabazzadeh, Anal. Chem., 2008, 80, 9848 CrossRef CAS.
- G. Yang, Y. Chen, L. Li and Y. Yang, Clin. Chim. Acta, 2011, 412, 1544 CrossRef CAS.
- S. Tajik, H. Beitollahi, F. Garkani Nejad, M. Safaei, K. Zhang, Q. V. Le, R. S. Varma, H. W. Jang and M. Shokouhimehr, RSC Adv., 2020, 10, 21561 RSC.
- Y. Yu, M. Guo, M. Yuan, W. Liu and J. Hu, Biosens. Bioelectron., 2016, 77, 215 CrossRef CAS.
- J. Zou, J. Ma, Y. Zhang, L. Huang and Q. Wan, J. Chem. Technol. Biotechnol., 2014, 89, 259 CrossRef CAS.
- S. Tajik, H. Beitollahi, M. R. Aflatoonian, B. Mohtat, B. Aflatoonian, I. Sheikh Shoaie, M. A. Khalilzadeh, M. Ziasistani, K. Zhang, H. W. Jang and M. Shokouhimehr, RSC Adv., 2020, 10, 15171 RSC.
- B. Yang, J. Wang, D. Bin, M. Zhu, P. Yang and Y. Du, J. Mater. Chem. B, 2015, 3, 7440 RSC.
- N. B. Messaoud, M. E. Ghica, C. Dridi, M. B. Ali and C. M. Brett, Sens. Actuators, B, 2017, 253, 513 CrossRef.
- S. Tajik, H. Beitollahi, F. Garkani Nejad, K. Zhang, Q. V. Le, H. W. Jang, S. Y. Kim and M. Shokouhimehr, Sensors, 2020, 12, 3364 CrossRef.
- S. Orecchio and D. Amorello, Foods, 2019, 8, 59 CrossRef CAS.
- C. Yang, J. Zhao, J. Xu, C. Hu and S. Hu, Int. J. Environ. Anal. Chem., 2009, 89, 233 CrossRef CAS.
- H. Beitollahi, M. A. Khalilzadeh, S. Tajik, M. Safaei, K. Zhang, H. W. Jang and M. Shokouhimehr, ACS Omega, 2020, 5, 2049 CrossRef CAS.
- H. Karimi-Maleh, C. T. Fakude, N. Mabuba, G. M. Peleyeju and O. A. Arotiba, J. Colloid Interface Sci., 2019, 554, 603 CrossRef CAS.
- F. Tahernejad-Javazmi, M. Shabani-Nooshabadi and H. Karimi-Maleh, Composites, Part B, 2019, 172, 666 CrossRef CAS.
- A. Khodadadi, E. Faghih-Mirzaei, H. Karimi-Maleh, A. Abbaspourrad, S. Agarwal and V. K. Gupta, Sens. Actuators, B, 2019, 284, 568 CrossRef CAS.
- M. Miraki, H. Karimi-Maleh, M. A. Taher, S. Cheraghi, F. Karimi, S. Agarwal and V. K. Gupta, J. Mol. Liq., 2019, 278, 672 CrossRef CAS.
- H. Karimi-Maleh, M. Sheikhshoaie, I. Sheikhshoaie, M. Ranjbar, J. Alizadeh, N. W. Maxakato and A. Abbaspourrad, New J. Chem., 2019, 43, 2362 RSC.
- S. Tajik, H. Beitollahi, F. Garkani Nejad, K. Zhang, Q. V. Le, H. W. Jang, S. Y. Kim and M. Shokouhimehr, Sensors, 201920, 11, 3256 Search PubMed.
- I. Mazurenko, O. Tananaiko, O. Biloivan, M. Zhybak, I. Pelyak, V. Zaitsev and A. Walcarius, Electroanalysis, 2015, 27, 1685 CrossRef CAS.
- M. R. Aflatoonian, S. Tajik, B. Mohtat, B. Aflatoonian, I. Sheikh Shoaie, H. Beitollahi, K. Zhang, H. W. Jang and M. Shokouhimehr, RSC Adv., 2020, 10, 13021 RSC.
- D. Talarico, F. Arduini, A. Amine, D. Moscone and G. Palleschi, Talanta, 2015, 141, 267 CrossRef CAS.
- F. Arduini, L. Micheli, D. Moscone, G. Palleschi, S. Piermarini, F. Ricci and G. Volpe, TrAC, Trends Anal. Chem., 2016, 79, 114 CrossRef CAS.
- P. Bollella, G. Fusco, D. Stevar, L. Gorton, R. Ludwig, S. Ma, H. Boer, A. Koivula, C. Tortolini, G. Favero, R. Antiochia and F. Mazzeia, Sens. Actuators, B, 2018, 256, 921 CrossRef CAS.
- S. Tajik, H. Beitollahi, M. R. Aflatoonian, B. Aflatoonian, I. Sheikh Shoaie, M. A. Khalilzadeh, K. Zhang, Q. V. Le, H. W. Jang and M. Shokouhimehr, Microchem. J., 2020, 157, 104890 CrossRef CAS.
- S. Palanisamy, B. Thirumalraj and S. M. Chen, J. Electroanal. Chem., 2016, 760, 97 CrossRef CAS.
- A. Ahmad, Y. Wei, F. Syed, M. Imran, Z. U. H. Khan, K. Tahir and Q. Yuan, RSC Adv., 2015, 5, 99364 RSC.
- M. Shafiq, S. Anjum, I. Anjum and B. H. Abbasi, Foods, 2020, 9, 148 CrossRef CAS.
- S. Tajik, H. Beitollahi, S. Z. Mohammadi, M. Azimzadeh, K. Zhang, Q. V. Le, Y. Yamauchi, H. W. Jang and M. Shokouhimehr, RSC Adv., 2020, 10, 30481 RSC.
- M. P. Kingsley, P. K. Kalambate and A. K. Srivastava, RSC Adv., 2016, 6, 15101 RSC.
- V. Erady, R. J. Mascarenhas, A. K. Satpati, S. Detriche, Z. Mekhalif, J. Dalhalle and A. Dhason, J. Electroanal. Chem., 2017, 806, 22 CrossRef CAS.
- N. Chauhan, S. Chawla, C. S. Pundir and U. Jain, Biosens. Bioelectron., 2017, 89, 377 CrossRef CAS.
- M. Devaraj, R. Saravanan, R. Deivasigamani, V. K. Gupta, F. Gracia and S. Jayadevan, J. Mol. Liq., 2016, 221, 930 CrossRef CAS.
- T. Dayakar, K. V. Rao, J. Park, P. Krishna, P. Swaroopa and Y. Ji, J. Mater. Sci.: Mater. Electron., 2019, 30, 9725 CrossRef CAS.
- M. Bijad, H. Karimi-Maleh, M. Farsi and S. A. Shahidi, Food Anal. Methods, 2017, 10, 3773 CrossRef.
- M. Sheikhshoaie, H. Karimi-Maleh, I. Sheikhshoaie and M. Ranjbar, J. Mol. Liq., 2017, 229, 489 CrossRef CAS.
- J. L. He, W. Kou, C. Li, J. J. Cai, F. Y. Kong and W. Wang, Int. J. Electrochem. Sci., 2015, 10, 10074 CAS.
| This journal is © The Royal Society of Chemistry 2021 |