 Open Access Article
Nanofiltration filter paper based on multi-walled carbon nanotubes and cellulose filter papers
Wan-hong Sun,
Lan-feng Hui *,
Qian Yang and
Guo-dong Zhao
Tianjin Key Laboratory of Pulp and Paper, Tianjin University of Science & Technology, Tianjin 300457, China. E-mail: huipeak@163.com; Tel: +86-22-60602006
First published on 4th January 2021
Abstract
Air filter paper with a high filtration efficiency that can remove small-size pollutant particles and toxic gases is vital for human health and the environment. We report a nanofiltration paper that is based on wood fiber filter paper with good mechanical properties and a three-dimensional network structure. The filter paper was prepared by impregnation with multi-walled carbon nanotubes (MWCNTs) and phenol-formaldehyde (PF). The results showed that MWCNTs were present on the surfaces of the fibers and between the pores, which increased the specific surface area of the fibers and enhanced the effective interception of the particles. The optimum impregnation concentration of the MWCNT was 0.1%. Compared with the cellulose fibers (CFs), the average pore diameter of the 0.1% MWCNT–CF filter paper was reduced by 8.05%, the filtration efficiency was increased by 0.64%, and the physical properties were slightly enhanced. After impregnation with PF, the mechanical properties of the air filter paper were significantly enhanced. The PF on the fiber surfaces and at the junction of the fibers covered the MWCNTs. Based on the change in the filter paper properties after impregnation, the optimal filter paper strength index and filtration performance were observed at a solid PF content of 8.4%.
1. Introduction
Particles with different sizes and components in the air are in contact with and absorbed by the human body.1 Epidemiological studies have shown a strong correlation between airborne particulate exposure and respiratory disease, cardiovascular disease, and mortality.2,3 Inhalable particulate matter (PM10, aerodynamic diameter < 10 μm) and fine particulate matter (PM2.5, aerodynamic diameter < 2.5 μm) are more likely to carry harmful substances, such as heavy metals or gaseous pollutants, into the human respiratory tract and even the alveolus, causing health hazards.4 Common pollutant control methods include source control, ventilation, and purification.5 Filter paper is an effective material to reduce the concentration of particulate matter in air purification.Filter paper usually removes particles based on five physical effects: gravity, collision, screening, diffusion, and static electricity.6 The removal efficiency of filter paper is closely related to the relative size of the particle diameter and the paper pore size. Smaller pore sizes of the paper correspond to smaller sizes of the particles that it can intercept under the same filtration efficiency.7,8 Adjusting the structure of the filter paper to improve the air flow resistance can increase the residence time of the pollutant particles in the filter paper, resulting in a higher removal efficiency.9,10 However, the filter filtration resistance directly affects the energy consumption of the filter, such that extremely high filtration resistances are not recommended.11 The filtration efficiency has exhibited dependence on the fiber coarseness. Specifically, finer fibers have exhibited higher filtration efficiencies at a constant pressure drop.12 However, air filter paper must maintain a certain porosity to allow air flow. Nanofibers can increase the specific surface area of the filter paper to generate filter papers with small pore sizes, high filtration efficiencies, and high porosities.
Traditional air filter paper is mainly composed of micron-grade fibers with high air permeability, small airflow resistance, and a poor filtration effect for small particles, which do not meet the requirements of many modern industries for high filtration precision air filter paper. In our work, multi-walled carbon nanotube (MWCNT) air filter paper with a high filtration efficiency and antibacterial activity for extremely small particle pollutants was prepared.13 To reduce the pore size of the filter paper, MWCNTs with large aspect ratios and high specific surface areas were introduced to cellulose fiber (CF) filter paper, which has a low filtration resistance and high mechanical strength due to its porous nanofiber structure.14 The MWCNT–CF filter paper exhibited high air permeability following the incorporation of the MWCNTs. In addition, the MWCNTs exhibited a fine antibacterial ability, which is suitable for industries that require antibacterial, high-efficiency air filter paper.
2. Materials and methods
2.1 Preparation of MWCNT–CF air filter paper
First, the performance of the CF filter paper was studied after loading MWCNTs with different contents. The MWCNT dispersion (10–15 nm in diameter, 10% concentration) was purchased from Beijing Carbon Yang Technology Co., Ltd., China. CF filter paper (quantitative 90 g m−2) was purchased from Shandong Longde Technology Co., Ltd., China. The MWCNTs were diluted with deionized water to 0.01%, 0.05%, 0.1%, 0.5%, and 1%. The CF filter paper was then dipped into the diluted MWCNT dispersing solution for 30 s and dried in an oven (electric blast drying oven, DGG-101-1, Tianjin Tianyu Experimental Instrument Co., Ltd., China.), with a drying time and temperature of 15 min and 105 °C, respectively.15,162.2 Preparation of the PF–MWCNT–CF air filter paper
In this study, phenol-formaldehyde (PF) resin was used to impregnate the MWCNT–CF air filter paper to improve the physical strength of the paper. PF resin (solid content 58%) was purchased from Shanghai Kain Chemical, China. The CF filter paper loaded with 0.5% MWCNTs was impregnated for the second time with PF (dissolved in 99.5% anhydrous methanol). The experiments followed an impregnation time of 30 s, a drying temperature of 105 °C, and a drying time of 15 min. By heating the PF, the gelatinous resin formed a polymer chain resin,17 which gradually hardened from a viscous flow state and appropriately improved the strength of the paper. The resin impregnation amount was calculated by the following formula:
 | (1) |
2.3 Characterization
The prepared samples were characterized by field-emission scanning electron microscopy (SEM; GeminiSEM 500, Zeiss, Germany), a computer-controlled tensile testing machine (CP-KZ300, Sichuan Changjiang Paper Instrument Co., Ltd., China), and a burst strength tester (969920, L&W, Sweden). The air permeability and pore size distribution of the samples were measured by a digital air permeability meter (YG461E, Ningbo Textile Mill, China) and a capillary pore size analyzer (Porolux 100, Porometer NV, Belgium).2.4 Filtration performance
The Palas MFP 3000 filter material test system (MFP 3000, Palas Company, Germany) and test dust ISO A2 fine ash were used for testing. The following test conditions were implemented: an end pressure of 2000 Pa, a dust concentration of 1000 mg m−3, a rated gas flow rate of 66 L min−1, a sample area of 100 cm2, and a sample surface velocity of 11.1 cm s−1. The filtration efficiency, filtration resistance, and dust retention of the filter paper were tested. The calculation formula of the filtration efficiency was as follows:
 | (2) |
The calculation formula of the dust retention is defined as follows:
| CR = Mi − Mj −M, | (3) |
3. Results and discussion
3.1 Effect of MWCNT concentration on performance of CF air filter paper
As shown in Table 1, higher MWCNT impregnation concentrations on the CF filter paper resulted in heavier papers. The loading capacity was far greater than that of other groups at an MWCNT concentration of 1%.| Filter paper | Impregnation amount (%) |
|---|---|
| 0.01% MWCNT–CF | 2.96 |
| 0.05% MWCNT–CF | 3.40 |
| 0.10% MWCNT–CF | 3.68 |
| 0.50% MWCNT–CF | 4.56 |
| 1.00% MWCNT–CF | 8.05 |
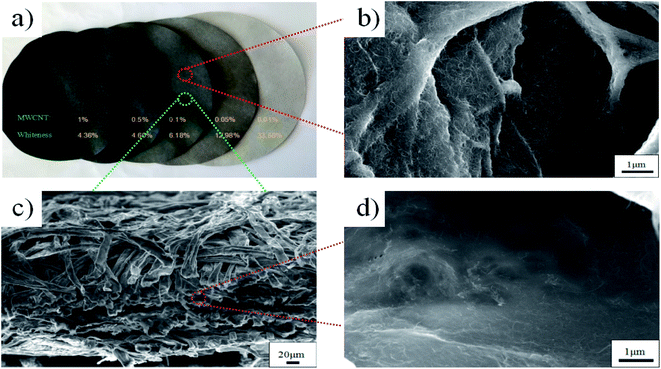
Fig. 1a indicates that the whiteness of the MWCNT–CF filter paper significantly decreased as the MWCNT concentration increased from 0.01% to 0.5%, which also reflected the different loading capacities of MWCNTs on the CF filter paper. Fig. 1b shows the SEM image of the 0.1% MWCNT–CF filter paper. Many small-curved MWCNTs adhered to the surfaces of the paper fibers and between the pores, reducing the pore size. The cross-section of the 0.1% MWCNT–CF filter paper (Fig. 1c) and the surface morphology of the intermediate wood fiber in the cross-section (Fig. 1d) were characterized to verify that the MWCNTs entered the deep layer of the CF filter paper during impregnation. As shown in Fig. 1d, the MWCNT content was significantly lower than that on the paper surface, and its distribution structure was also different from that on the paper surface. MWCNTs did not adhere to the surfaces of the fibers as a result of their low content in the middle of the paper. However, due to the high concentration of MWCNTs on the paper surface, it is easy to twine due the strong van der Waals forces.18,19 This phenomenon also explains the increase in the tensile index and burst index observed on the MWCNT-impregnated filter paper (Fig. 2f).
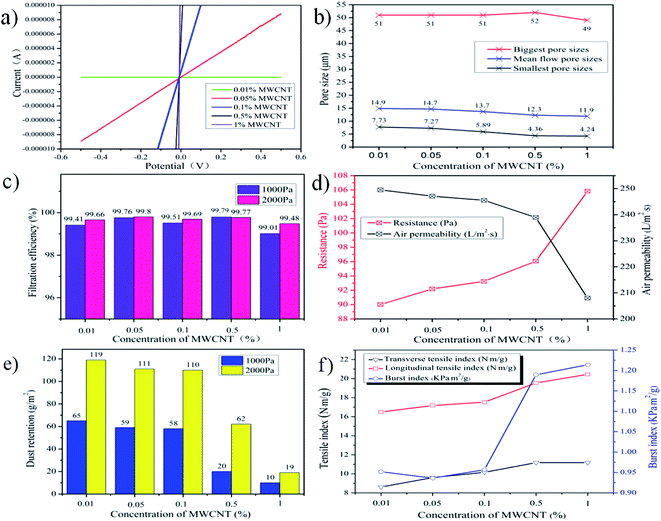
Fig. 2a shows the conductivity test results of the MWCNT–CF filter paper at different concentrations, which were based on the MWCNT conductivity.20 The conductivity of these filter papers also reflected the MWCNT content, which was consistent with the paper whiteness results. Fig. 2b shows the pore size variations of the CF filter paper at different MWCNT impregnation concentrations. The test principle of this method was based on the through-holes in the paper. The figure with the maximum aperture was almost unchanged, and the average and minimum aperture gradually decreased. Fig. 2c shows the filtration efficiency diagram of the MWCNT–CF filter paper at end pressures of 1000 and 2000 Pa. In principle, a filtration efficiency higher than 1000 Pa was caused by the presence of a filter cake formed by dust at 2000 Pa.21 However, the measurement results closer to 100% exhibited larger measurement errors. Fig. 2c shows that the efficiency of each paper sample was more than 99%. In addition, the data did not show a significant rise or fall, which was caused by the inevitable measurement errors.
Fig. 2d presents the test results for the CF filter paper with MWCNT concentrations from 0.01% to 1%, where in the air permeability decreased by 2.82%, 3.76%, 4.37%, 6.94%, and 18.98% as the resistance increased by 22.16%, 25.12%, 26.56%, 30.37%, and 43.62%, respectively. Excess MWCNT loading onto the paper blocked the filter paper pores, resulting in poor air permeability. The paper was not able to purify a large amount of air in a short time, that is, the resistance of filtering the air flow increased and affected the energy consumption of the filter paper in the working process. Fig. 2e shows the dust retention of the MWCNT–CF filter paper at end pressures of 1000 and 2000 Pa. The dust retention also significantly affected the air filter paper, which directly determined the service life of the filter paper.22 As shown in the figure, the dust retention at 2000 Pa was higher than that at 1000 Pa, which was determined by the measurement time. The increase in the MWCNT concentration on the CF filter paper resulted in dust retention decreases of 0.83%, 7.53%, 8.33%, 48.33%, and 84.17%. The SEM images showed that the MWCNT content on the surface of the filter paper was higher than that inside. When the MWCNT concentration was more than 0.5%, the MWCNTs were intensively distributed on the surface of the filter paper, thereby holding less dust and preventing the dust from entering the interior of the large dust retention space. Based on these results, we chose to proceed using 0.1% MWCNT–CF. As shown in Fig. 2f, an increase in the MWCNT concentration first caused a rapid increase and then a slow increase in the MWCNT–CF filter paper tensile index and burst index. Although the 1% MWCNT–CF exhibited the highest physical strength compared with the MWCNT loading capacity, we chose 0.5% as the best impregnation concentration for physical strength.
3.2 Effect of PF on properties of the MWCNT–CF air filter paper
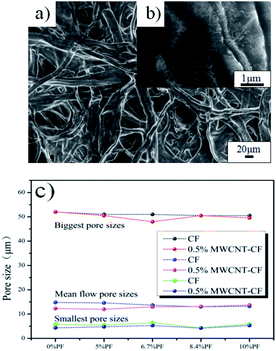
CF filter paper and 0.5% MWCNT–CF filter paper were impregnated with PF at different solid contents. As shown in Table 2, the impregnation amount of PF increased with the solid content (the impregnation amount is generally 10–30% in the industry). The MWCNT–CF filter paper exhibited greater PF absorption compared with the CF filter paper. As shown in Fig. 3a, the PF was attached at the junctions of the fibers, and Fig. 3b shows that the PF covered the MWCNTs. MWCNTs were close to the fiber surface, which increased the specific surface area of a single fiber and created more grooves, thus allowing more resin absorption. Table 2 shows that the filtration efficiency of each filter paper sample was greater than 99%.| Filter paper | Impregnation amount (%) | Efficiency (1000 Pa, %) | Efficiency (2000 Pa, %) |
|---|---|---|---|
| 0.00% PF–CF | 0.00 | 96.37 | 97.09 |
| 5.00% PF–CF | 12.95 | 99.03 | 99.12 |
| 6.70% PF–CF | 17.62 | 99.05 | 99.14 |
| 8.40% PF–CF | 22.03 | 99.12 | 99.11 |
| 10.00% PF–CF | 27.55 | 99.28 | 99.19 |
| 0.00% PF–MWCNT–CF | 1.99 | 99.79 | 99.77 |
| 5.00% PF–MWCNT–CF | 15.91 | 99.93 | 99.91 |
| 6.70% PF–MWCNT–CF | 20.85 | 99.75 | 99.89 |
| 8.40% PF–MWCNT–CF | 26.08 | 98.60 | 99.35 |
| 10.00% PF–MWCNT–CF | 30.73 | 98.23 | 99.92 |
As shown in Fig. 3c, the mean flow pore sizes and smallest pore sizes of each filter paper sample were slightly reduced. These results were due to the presence of alcohol-soluble PF on the fiber surface and at the fiber junction, and the degree of heat transfer in the fiber direction was insignificant during the drying process of the filter paper. Thus, the PF did not significantly reduce the pore size of the filter paper.
Fig. 4a shows the change of the air permeability and the resistance of the PF-impregnated CF filter paper and the 0.5% MWCNT–CF filter paper with different solid contents. As shown in the figure, the air permeability of the PF–CF filter paper was higher than that of the PF–MWCNT–CF filter paper with the same solid content, and the opposite resistance was observed. The CF filter paper air permeability decreased by 1.37%, 4.34%, 4.67%, and 6.14%, and the resistance increased by 2.55%, 4.73%, 10.38%, and 15.82%, respectively, as the PF solid content increased from 5% to 10% compared with the original paper. The air permeability of the MWCNT–CF filter paper was reduced by 3.09%, 4.32%, 5.18%, and 6.27%, and the resistance increased by 5.63%, 4.10%, 11.80%, and 15.89%, respectively, compared with the MWCNT–CF filter paper without PF impregnation. These values did not change significantly. The change in the PF solid content minimally affected the air permeability and resistance of the filter paper.
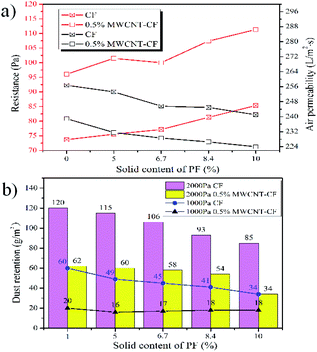 | ||
| Fig. 4 Test performance chart of the PF-impregnated filter paper. (a) Air permeability and resistance. (b) Dust retention. | ||
As shown in Fig. 4b, the increase in the PF solid content resulted in a slight decrease in dust retention of both filter paper samples at end pressures of 1000 and 2000 Pa. However, the dust retention of the PF–MWCNT–CF filter paper was very low due to the influence of the MWCNTs. The decrease in the dust retention was consistent with the decrease in the pore size.
Fig. 5a shows the change in the tensile index of the two filter paper samples after impregnation with PF. The tensile index of the two kinds of filter paper significantly increased after impregnation with PF. An increase in the PF solid content minimally affected the transverse tensile strength of the CF filter paper. The transverse tensile index of the MWCNT–CF filter paper did not significantly change with the increase in the PF solid content. The longitudinal tensile index of the two kinds of filter paper first increased, then decreased, and finally reached a maximum at 8.4%. This was the same trend as the burst index of the two filter paper samples shown in Fig. 5b. After the filter paper was impregnated by PF and dried in the oven, a stable three-dimensional network structure was formed. The surface layer of the fiber and the interface between the fibers were covered by PF, which generated a more stable network structure and enhanced the physical properties of the filter paper. Although the tensile and bursting strengths of the filter paper increased after impregnation with PF, the paper weight also increased, and the ratio of the two can highlight the change of the paper strength. Herein, 8.4% PF–MWCNT–CF exhibited the optimal results.
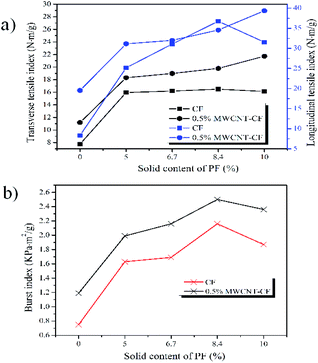 | ||
| Fig. 5 Test performance chart of the PF-impregnated filter paper. (a) Tensile index. (b) Burst index. | ||
4. Conclusions
After the CF filter paper was impregnated with an MWCNT dispersion, MWCNTs adhered to the surface of the filter paper, thus reducing the pore size and resulting in a higher filter paper surface content compared with that inside the paper. When the load of MWCNTs was greater than 4.56%, the pores readily became blocked, which was not conducive to filtration. At a loading rate of 3.68%, the resistance increased by 26.56% and the dust-holding capacity only increased by 8.33%. At this time, the filtration efficiency was 99.69% (2000 Pa), and the paper strength was also enhanced.The filtration performance of the MWCNT–CF filter paper impregnated with PF showed little change. The burst index of PF–MWCNT–CF filter paper increased by 110% compared with MWCNT–CF filter paper. The tensile index increased constantly, but the dust retention was too low when the PF solid content was 10%. Thus, the optimal impregnation concentration was 8.4%. At this time, the longitudinal tensile index and transverse tensile index of the filter paper increased by 77.01% and 80.41% respectively, compared with MWCNT–CF filter paper.
Conflicts of interest
There are no conflicts to declare.Acknowledgements
This work was financially supported by the National Key Research and Development Plan (Grant No. 2017YFB0308300). We thank LetPub (http://www.letpub.com) for its linguistic assistance during the preparation of this manuscript.References
- R. Zhang, C. Liu and P. C. Hsu, et al., Nanofiber Air Filters with High-Temperature Stability for Efficient PM2.5 Removal from the Pollution Sources, Nano Lett., 2016, 3642 CrossRef CAS.
- D. W. Dockery, An association between air-pollution and mortality in 6 United-States cities, N. Engl. J. Med., 1993, 329, 1753–1759 CrossRef CAS.
- C. Chen, B. Zhao and C. J. Weschler, Indoor Exposure to "Outdoor PM10" Assessing Its Influence on the Relationship Between PM10 and Short-term Mortality in US Cities, Epidemiology, 2012, 23(06), 870–878 CrossRef.
- D. W. Dockery and P. H. Stone, Cardiovascular risks from fine particulate air pollution, N. Engl. J. Med., 2007, 356(05), 511–513 CrossRef CAS.
- J. D. Spengler, J. M. Samet and J. F. McCarthy, Indoor Air Quality Handbook, Mc GrawHill, New York, 2001 Search PubMed.
- D. X. Kang, ULPA Filter Paper, China Pulp Pap., 1997,(02), 7–20 Search PubMed.
- R. Gopal, S. Kaur and Z. Ma, et al., Electrospun nanofibrous filtration membrane, J. Membr. Sci., 2006, 281(01–02), 581–586 CrossRef CAS.
- T. Uyar, R. Havelund and J. Hacaloglu, et al., Functional electrospun polystyrene nanofibers incorporating α-, β-, and γ-cyclodextrins: comparison of molecular filter performance, ACS Nano, 2010, 4(09), 5121 CrossRef CAS.
- H. Souzandeh, K. S. Johnson and Y. Wang, et al., Soy-Protein-Based Nanofabrics for Highly Efficient and Multifunctional Air Filtration, ACS Appl. Mater. Interfaces, 1944, 8(31), 20023–20031 CrossRef.
- P. Chen, Study on Influence Factor of Collection Efficiency of the Electrostatic Precipitator, Northeastern University, 2009 Search PubMed.
- W. L. He, Z. P. Lin and X. L. Zhang, et al., Analysis on the Test Methods and Standards of Air Filter for General Ventilation, Contamination Control & Air-conditioning Technology, 2012,(03), 15–19 Search PubMed.
- T. Subbiah, G. S. Bhat and R. W. Tock, et al., Electrospinning of nanofibers, J. Appl. Polym. Sci., 2010, 96(02), 557–569 CrossRef.
- D. Liu, Preparation and Antibacterial Properties of Nanosilver-Loaded Polydopamine Coated Multi-Wall Carbon Nanotubes, J. Adv. Phys. Chem., 2015, 04(02), 24–30 CrossRef CAS.
- Q. N. Wang, Synthesis and Filtration Properties of Hot Gas Filters for Removal of Ultrafine Particles, Donghua University, 2017 Search PubMed.
- A. Muhammad, H. T. Wang and S. Dong, et al., Metal oxide intercalated layered double hydroxide nanosphere: with enhanced electrocatalyic activity towards H2O2 for biological applications, Sens. Actuators, B, 2017, 239, 243–252 CrossRef.
- A. Muhammad, A. Ayesha and Z. Y. Wang, et al., Hierarchical CNTs@CuMn Layered Double Hydroxide Nanohybrid with Enhanced Electrochemical Performance in H2S Detection from Live Cells, Anal. Chem., 2019, 91, 3912–3920 CrossRef.
- Z. G. Hu, G. S. Zhu and Y. M. Gao, et al., Study on anticorrosion performance of waterborne epoxy ester resin coating cured by zirconium ion crosslinker, Mod. Chem. Ind., 2019, 39(07), 167–169 Search PubMed.
- A. Yamakawa, S. Suzuki and T. Oku, et al., Nanostructure and physical properties of cellulose nanofiber-carbon nanotube composite films, Carbohydr. Polym., 2017, 171, 129 CrossRef CAS.
- A. Hajian, S. B. Lindström and T. Pettersson, et al., Understanding the Dispersive Action of Nanocellulose for Carbon Nanomaterials, Nano Lett., 2017, 17(03), 1439 CrossRef CAS.
- C. Wang, S. Yang and Q. Ma, et al., Preparation of carbon nanotubes/graphene hybrid aerogel and its application for the adsorption of organic compounds, Carbon, 2017, 118, 765–771 CrossRef CAS.
- Y. Y. Bai, J. F. Xie and Q. N. Wang, Multi-scale Polyimide/Carbon Fibers Hybrid Filters for Hot Gas Filtration, Mater. Sci. Forum, 2015, 464–469 Search PubMed.
- X. L. Zhang, Z. P. Lin and W. H. Zhu, et al., Pressure drop of filter during dust clogging period and related test method, Heating, Ventilating, Air-Conditioning, 2013, 43(05), 109–113 Search PubMed.
| This journal is © The Royal Society of Chemistry 2021 |

