 Open Access Article
Continuous selective deoxygenation of palm oil for renewable diesel production over Ni catalysts supported on Al2O3 and La2O3–Al2O3†
Kyriakos N. Papageridis a,
Nikolaos D. Charisiou
 a,
Savvas Douvartzidesab,
Victor Sebastian
 cde,
Steven J. Hinderf,
Mark A. Bakerf,
Ayesha A. AlKhoorig,
Sara I. AlKhoorig,
Kyriaki Polychronopoulou
 gh and
Maria A. Goula
 *a
*a
aLaboratory of Alternative Fuels and Environmental Catalysis (LAFEC), Department of Chemical Engineering, University of Western Macedonia, GR-50100, Greece. E-mail: mgoula@uowm.gr; Tel: +30 24610 68296
bDepartment of Mechanical Engineering, University of Western Macedonia, GR-50100, Greece
cDepartment of Chemical Engineering and Environmental Technology, Universidad de Zaragoza, Campus Río Ebro-Edificio I + D, 50018 Zaragoza, Spain
dInstituto de Nanociencia y Materiales de Aragón (INMA), Universidad de Zaragoza-CSIC, c/María de Luna 3, 50018 Zaragoza, Spain
eNetworking Research Center on Bioengineering, Biomaterials and Nanomedicine, CIBERBBN, 28029 Madrid, Spain
fThe Surface Analysis Laboratory, Faculty of Engineering and Physical Sciences, University of Surrey, Guildford, GU2 4DL, UK
gDepartment of Mechanical Engineering, Khalifa University of Science and Technology, P.O. Box 127788, Abu Dhabi, United Arab Emirates
hCenter for Catalysis and Separations, Khalifa University of Science and Technology, P.O. Box 127788, Abu Dhabi, United Arab Emirates
First published on 24th February 2021
Abstract
The present study provides, for the first time in the literature, a comparative assessment of the catalytic performance of Ni catalysts supported on γ-Al2O3 and γ-Al2O3 modified with La2O3, in a continuous flow trickle bed reactor, for the selective deoxygenation of palm oil. The catalysts were prepared via the wet impregnation method and were characterized, after calcination and/or reduction, by N2 adsorption/desorption, XRD, NH3-TPD, CO2-TPD, H2-TPR, H2-TPD, XPS and TEM, and after the time-on-stream tests, by TGA, TPO, Raman and TEM. Catalytic experiments were performed between 300–400 °C, at a constant pressure (30 bar) and different LHSV (1.2–3.6 h−1). The results show that the incorporation of La2O3 in the Al2O3 support increased the Ni surface atomic concentration (XPS), affected the nature and abundance of surface basicity (CO2-TPD), and despite leading to a drop in surface acidity (NH3-TPD), the Ni/LaAl catalyst presented a larger population of medium-strength acid sites. These characteristics helped promote the SDO process and prevented extended cracking and the formation of coke. Thus, higher triglyceride conversions and n-C15 to n-C18 hydrocarbon yields were achieved with the Ni/LaAl at lower reaction temperatures. Moreover, the Ni/LaAl catalyst was considerably more stable during 20 h of time-on-stream. Examination of the spent catalysts revealed that both carbon deposition and degree of graphitization of the surface coke, as well as, the extent of sintering were lower on the Ni/LaAl catalyst, explaining its excellent performance during time-on-stream.
1 Introduction
Over the last decades world energy consumption has dramatically increased due to the growth in population and economic output, especially in emerging market economies, leaving fossil fuel reserves depleted. Moreover, there is almost unanimous agreement amongst the scientific community that the increase in the concentration of greenhouse gases (GHG) into the atmosphere leads to climate change at a scale that threatens the very survival of the biosphere, including the human species.1–3 One way to reduce CO2 emissions is to replace petro-based sources in transportation with biofuels, as the sector uses nearly 40% of global primary energy.4An important renewable resource for the production of green liquid fuels are triglycerides, which consist of C8–C24 fatty acids, the main components of vegetable oils and animal fats; these are usually used for the production of biodiesel, a mixture of Fatty Acids Methyl Esters (FAMEs). However, biodiesel has a number of important disadvantages, in comparison to petroleum diesel, such as low thermal and oxidation stability (due to its high oxygen content), low heating value, high viscosity and poor cold weather performance.5 Moreover, the process also results in the production of large amounts of crude glycerol as byproduct, which at the moment is considered an industrial waste, despite intense efforts at developing processes that will utilize it.6,7 Therefore, the development of technologies that overcome the disadvantages associated with the production and use of biodiesel are of great interest.
Selective catalytic deoxygenation (SDO) of triglycerides is a process that produces a mixture of C15–C18 normal and isomer paraffins, also called “renewable diesel”, “green diesel” or “bio-hydrogenated diesel (BHD)”, which has chemical resemblance to that of conventional petroleum diesel. As a result, green diesel provides better diesel properties in comparison to biodiesel, such as high cetane number, high energy density, very low sulfur content and since it does not contain oxygen, it is non-corrosive, more stable and it can be used in neat or blend form.8–12
The SDO of triglycerides involves three different reactions, which are commonly known as hydrodeoxygenation (HDO), decarbonylation (deCO) and decarboxylation (deCO2). HDO (1) is an exothermic reaction, which leads to a saturated hydrocarbon product that has the same number of carbon atoms as the corresponding fatty acid bound in the triglyceride, as oxygen is removed in the form of H2O molecules. However, while HDO is highly selective to diesel-like hydrocarbons it also requires high H2 pressures (mostly available only in centralized facilities), and the use of sulfated catalysts (which can contaminate the final product with sulfur). On the other hand, deCO (2a) and (2b) and deCO2 (3) are mildly endothermic reactions that produce a saturated hydrocarbon product with one carbon atom less than the corresponding fatty acid bound in the triglyceride, as oxygen is removed in the form of CO and CO2, respectively. The deCO and deCO2 reactions are quite difficult to distinguish, as CO2 and CO react with H2 on the surface of the catalyst. Therefore, these routes are commonly known as deCOx reactions.13–16
 | (1) |
 | (2a) |
 | (2b) |
 | (3) |
Most of the studies in the literature have focused on the development of noble metal catalysts, such as Pt, Pd, Ru and Rh, supported on high surface area carriers, as such systems are known to exhibit high activity and selectivity to deCOx reactions.17–28 However, despite their high catalytic performance, noble metals are sensitive to a small number of oxygenated compounds present in the feedstock. Moreover, noble metals are considered expensive for large scale applications. Therefore, recent research focuses on the development of low cost, transition metal catalysts based on Ni, Cu and Co, that have been shown to exhibit comparable catalytic performance to those of precious metals in the deCOx of triglycerides. For example, Veriansyah et al.27 studied the effects of six different types of metal supported catalysts on the deoxygenation of soybean oil to produce renewable diesel. The experiments were carried out in a high-pressure batch reactor at 400 °C, with an H2 pressure of 92 bar. The authors showed that for a catalyst/oil weight ratio of 0.044 deoxygenation activity decreased in the order of NiMo/γ-Al2O3 > Pd/γ-Al2O3 > CoMo/γ-Al2O3 > Ni/SiO2–Al2O3 > Pt/γ-Al2O3 > Ru/γ-Al2O3. Similarly, Morgan et al.28 examined the conversion of triglycerides (tristearin and triolein) to diesel-like hydrocarbons in a batch reactor at 350 °C and 7 bar and showed that the deoxygenation activity followed the order Ni/C > Pt/C > Pd/C. Moreover, the Ni/C catalyst provided the higher C8–C17 product yield.
Alumina is a ubiquitous supporting material for a variety of catalytic reactions, due to its high specific surface area (which improves metal dispersion) and high thermal stability under reaction conditions.29–36 Moreover, as it is mildly acidic, a property that is considered beneficial in catalysts used for the deoxygenation of triglycerides, it has been used extensively in catalytic systems tested in the SDO process. An excellent work was provided by Gousi et al.,36 which screened Ni catalysts with loading in the range of 0–100 wt%, in a semi-batch reactor at 310 °C, 40 bar and volume of oil (mL)/mass of catalyst (g) ratio equal to 100, and observed that both the conversion of sunflower oil and the yield of hydrocarbons maximize at Ni about 60 wt%. The initial increase of the conversion up to the critical metal loading of 60 wt% was attributed to the increase of the metal active phase with a simultaneous decrease of the amount of an inactive NiAl2O4-like phase. The subsequent fall of the deoxygenation rate at higher metal loadings was attributed to the competitive decrease of the specific surface area. The authors also reported that the main liquid products consisted primarily of n-C15 to n-C18, intermediate fatty acids and esters. However, alumina is also known to induce the deposition of carbon, which inevitably, leads to catalyst deactivation. For the SDO, the formation of coke deposits on Ni/Al2O3 systems has been associated with the ability of Ni to promote the cracking reaction and the acidity of the γ-Al2O3 support.37
Catalyst deactivation and/or improved performance in Ni catalyzed reactions are commonly addressed by the addition of modifiers. In some of our previous works, we confirmed that the incorporation of La2O3 in an Al2O3 support improves the dispersion of the active species, strengthens the interactions between active phase and support, increases the basic sites of the catalyst and redistributes the acid sites in terms of strength and density; as a result, considerably improved catalytic performance was observed.38,39 However, to the best of our knowledge, the use of Ni/La2O3–Al2O3 catalysts in the deoxygenation of palm oil in trickle bed reactors has never been reported in the literature.
In fact, searching through the relevant literature, it becomes obvious that although one may find a small number of research studies for the SDO of model compounds in trickle bed reactors,9,37,40,41 studies involving triglycerides, such as palm oil, are almost nonexistent. However, there is an obvious need to move into trickle bed reactors using oil feedstocks, as such systems allow the evaluation of catalytic stability during long term time-on-stream tests, a necessary part of scaling up the process. Amongst the handful of available works, mention should be made to the group of Faungnawakij for the works presented in ref. 9 and 40. In the first of these works,9 the authors studied the production of renewable diesel via the deoxygenation of refined palm oil in a trickle bed reactor using Co, Ni, Pd and Pt mono-metallic catalysts supported on γ-Al2O3, prepared by the incipient wetness impregnation method. Deoxygenation tests were conducted at 330 °C, H2 pressure of 50 bar, liquid hourly space velocity (LHSV) of 1 h−1 and H2/oil feed ratio of 1000 cm3 cm−3. The authors reported that catalytic activity decreased in the order of Co (88%) > Pd (85%) > Pt (80%) > Ni (70%) and that Ni, Pd and Pt catalysts were more selective to the deCO reaction pathway, whereas the Co catalyst was selective for both deCOx and HDO reaction pathways. In the second work,40 the authors studied the deactivation and regeneration behavior of Ni and Co catalysts supported on γ-Al2O3 during the hydrodeoxygenation of palm oil and concluded that the main reason for catalyst deactivation, after 150 h of time-on-stream, was carbon deposition; sintering only played a minor role.
In view of the foregoing, the present study investigated the effect of hydrotreating temperature and LHSV on the catalytic performance of Ni catalysts supported on γ-Al2O3 and γ-Al2O3 modified with La2O3, in a continuous flow trickle bed reactor, for the selective deoxygenation of palm oil. The catalysts were prepared via the wet impregnation method, at a constant metal loading of 8 wt%. The catalytic samples, after calcination and/or reduction, were characterized by N2 adsorption/desorption, XRD, NH3-TPD, CO2-TPD, H2-TPR, H2-TPD, XPS and TEM, in order to provide an insight into the effect on performance by their physical and chemical properties. Moreover, the spent catalysts after 20 h of time-on-stream tests were characterized by TGA, TPO, Raman and TEM, in order to determine the extent of carbon deposition and metal particle sintering on the spent samples.
2 Materials and methods
2.1 Reagents and feedstock
The analysis of the liquid products of the reaction necessitated the use of a number of high quality chemical reagents (detailed information regarding chemical grades can be found in ref. 42), i.e., linoleic acid, palmitic acid, oleic acid, stearic acid, tridecane, cyclohexanone, a mixture of 37 fatty acid methyl esters (all Sigma-Aldrich), heptane, dodecane, cyclohexane, chloroform (all Honeywell) and a calibration sample kit #2 for n-C8 to n-C18 alkanes (Agilent Technologies). The main components of the palm oil used as feed are presented in Table 1.| Fatty acid | Structure | Formula | Composition, wt% |
|---|---|---|---|
| Myristic acid | C14:0 | C14H28O2 | 0.90 |
| Palmitic acid | C16:0 | C16H32O2 | 41.60 |
| Palmitoleic acid | C16:1 | C16H30O2 | 0.70 |
| Stearic acid | C18:0 | C18H36O2 | 2.10 |
| Oleic acid | C18:1 | C18H34O2 | 43.90 |
| Linoleic acid | C18:2 | C18H32O2 | 10.40 |
| Linolenic acid | C18:3 | C18H30O2 | 0.40 |
2.2 Catalysts preparation
The properties of the commercially available alumina (Akzo) and lanthana–alumina (4 wt% La2O3, W.R. Grace, MI-386) supports used herein can be found in ref. 38 and 39. The Ni based catalysts used in the present work were prepared via the wet impregnation method. In brief, prior to catalyst synthesis, the γ-Al2O3 support was crushed and sieved to particles with sizes between 350 and 500 μm. The La2O3–Al2O3 support was first pelletized and then crushed/sieved to the same size. Both supports were air-dried overnight at 120 °C and calcined at 400 °C for 4 h under an atmosphere of air. Thereafter, the impregnation solutions were prepared using calculated amounts of Ni(NO3)2·6H2O (≥97%, Fluka), dissolved in distilled and de-ionized water in order to obtain final catalysts of 8 wt% Ni loading. The resulting slurries were evaporated using a rotary evaporator at 70 °C for 6 h, dried at 120 °C for 12 h and finally calcined at 400 °C for 4 h. These samples will be hereafter denoted as Ni/Al and Ni/LaAl catalysts.2.3 Catalysts characterization
The specific surface area (SSA), pore volume (Vp) and pore size distribution (PSD) was investigated using a high-resolution porosimeter (3Flex Micromeritics). The SSA was determined by the multi-point Brunauer–Emmett–Teller (BET) method in the relative pressure range 0.05 < P/P0 < 0.20, while PSD was calculated by the BJH Theory.The total metal loading (wt%) of the catalysts was determined by Inductively Coupled Plasma Atomic Emission Spectroscopy (ICP-AES-on a Perkin-Elmer Optima 4300DV apparatus). The detailed methodology used has been described previously.43
The X-ray diffraction (XRD) profiles of the catalytic samples were obtained using a ThermoAl diffractometer system at 40 kV and 30 mA, with Cu Kα radiation source (λ = 0.15178 nm). The diffraction patterns were recorded between Bragg angles (2θ) 2°–70°, at a scanning rate of 0.04° per 1.2 min.
The acidity and basicity of the catalytic samples was determined using NH3 and CO2 temperature-programmed desorption (NH3-/CO2-TPD) experiments. Catalyst reducibility and the strength of Ni–support interaction were studied using H2 temperature-programmed reduction (H2-TPR). The NH3-/CO2-TPD and H2-TPR experiments were conducted on an Autochem 2920 Micromeritics. H2-TPD experiments were performed in a quartz fixed-bed reactor. The precise methodology used can be found in the ESI accompanying ref. 42. The H2 signal (m/z = 2) was continuously monitored with an on-line mass spectrometer (QMS 200 Prisma Quadrupole Mass Spectrometer) and converted into concentration (ppm).
The oxidation state and atomic composition of the catalysts were studied by X-ray photoelectron spectroscopy (XPS) using a ThermoFisher Scientific Instruments K-Alpha+ spectrometer. The XPS spectra were recorded using a monochromated Al Kα X-ray source (hν = 1486.6 eV).
Transmission electron microscopy (TEM) observations on the reduced and spent catalysts were carried out using a 200 kV G2 20 S-Twin Tecnai microscope with a LaB6 electron source fitted with a “SuperTwin®” objective lens allowing a point-to-point resolution of 2.4 Å.
Apart from electron microscopy, the coke deposited on the spent catalytic samples was characterized by: (a) Raman spectroscopy using a Witec Alpha 300 instrument, equipped with 532 nm laser and research grade optical microscope with various lenses. The instrument features a manual sample positioning with both planar (x,y-direction) and depth scans (z-direction). All the catalysts spectra were acquired using single-point Raman spectrum acquisition. (b) Temperature Programmed Oxidation (TPO), using Autochem 2920 unit under a 20% O2/He gas atmosphere. (c) Thermogravimetric analysis (TGA) carried out using a Leco TGA701. In the procedure, 100 mg of the spent catalyst were subjected to TGA scan from room temperature to 1000 °C at a heating rate of 10 °C min−1 under a flow of dry air (3.5 L min−1). Curie point standards were utilized for the temperature calibration.
2.4 Catalysts evaluation
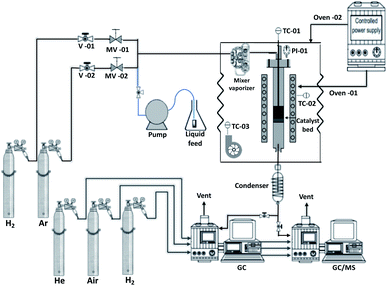
Prior to performing any catalytic reaction measurement, a specific amount of catalyst (held in place using quartz wool) was in situ activated by flowing 50 mL min−1 of H2 (99.999 v/v%) in atmospheric pressure, at 400 °C, for 2 h. Following activation, the catalyst was purged under a flow of 100 mL min−1 of Ar (99.999 v/v%), the system was set to the desired reaction temperature and pressure and the reaction feed was introduced into the catalyst bed along with a flow of H2. The liquid stream of the palm oil dissolved in dodecane (5 wt%), which was kept under continuous stirring at room temperature, was introduced to the system at a rate of 0.2 mL min−1. In order to ensure operation at steady state conditions, the first measurement was taken after the feed had passed for approximately 80 min through the catalyst bed. In addition, a non-catalytic experiment (blank experiment) was carried out at 375 °C, 30 bar, 1.2 h−1 and 1000 cm3 (cm3)−1 in order to assess the extent of non-catalytic (as opposed to catalytic) contributions to diesel-like hydrocarbons and fatty acids yield. The liquid products were manually collected from the gas–liquid separator while the gaseous products were sent to a gas chromatograph (GC).
The selective deoxygenation of palm oil was carried out using two different sets of experiments. During the first set of experiments (experimental protocol #1) the liquid and gaseous product composition was investigated during short time-on-stream tests (6 h) as follows: (a) at temperatures between 300–400 °C, and (b) at LHSV between 1.2–3.6 h−1 (for comparison purposes, all other parameters were kept constant). Experimental protocol #2 aimed at investigating the stability of the catalysts during long-term stability tests (20 h) at 375 °C and LHSV = 1.2 h−1 (as these were identified as the optimal conditions during experimental protocol #1). For both protocols, the H2 pressure and the H2/oil ratio were kept constant at 30 bar and 1000 cm3 (cm3)−1, respectively. During the short time stability tests liquid and gaseous products were analyzed at 1 h intervals. For the long stability tests, liquid effluents were analyzed every 4 h and gaseous products every 1 h.
The liquid products were analyzed offline by an Agilent 7890A/5975C Triple-Axis Detector diffusion pump Gas Chromatographer-Mass Spectrometer (GC-MS), equipped with an Agilent Multimode inlet and an Agilent 7683B Automatic Liquid Sampler. The multimode inlet, containing a deactivated open ended helix liner (Agilent Technologies), was operated in a split ratio of 25![[thin space (1/6-em)]](https://www.rsc.org/images/entities/char_2009.gif) :
:![[thin space (1/6-em)]](https://www.rsc.org/images/entities/char_2009.gif) 1, split flow rate of 50 mL min−1 and a temperature of 300 °C which was maintained for the duration of the analysis.
1, split flow rate of 50 mL min−1 and a temperature of 300 °C which was maintained for the duration of the analysis.
The methodology used for the analysis of the liquid products, followed closely the one reported by Santillan-Jimenez et al.13,14 and Lercher et al. in ref. 44, and has been provided in detail in ref. 42.
 | (4) |
 | (5) |
 | (6) |
 | (7) |
3 Results and discussion
3.1 Catalysts characterization
It is noted that additional information regarding the characterization of the catalysts using N2 adsorption/desorption, ICP-AES, XRD, H2-TPD and XPS can be found in the ESI.†Elemental analysis (ICP-AES) carried out on the calcined catalysts showed that the desired Ni loading was achieved for both as it was found equal to 7.83 wt% for the Ni/Al and 7.92 wt% for the Ni/LaAl. Fig. S1a and b† presents the adsorption–desorption isotherms obtained for the calcined Ni/Al and Ni/LaAl catalysts. Both have relatively similar specific surface areas (SSA) and pore volumes i.e., 158.5 m2 g−1 and 0.44 cm3 g−1 for the Ni/Al and 142.2 m2 g−1 and 0.55 cm3 g−1 for the Ni/LaAl.
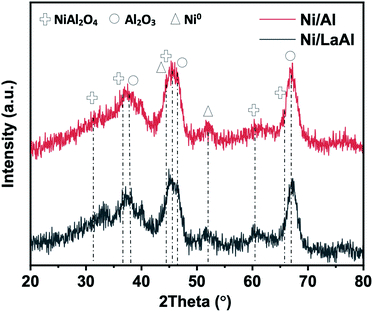
Fig. 2 presents the X-ray diffractograms of the reduced Ni/Al and Ni/LaAl catalysts. The characteristic peaks of NiO at 37° and 43° and Ni0 at 44° and 51° can be barely traced. So as expected, a mixture of metallic Ni0 and NiO are present in the catalyst. Fig. S1c† presents the corresponding X-ray diffractograms for the calcined Ni/Al and Ni/LaAl catalysts.
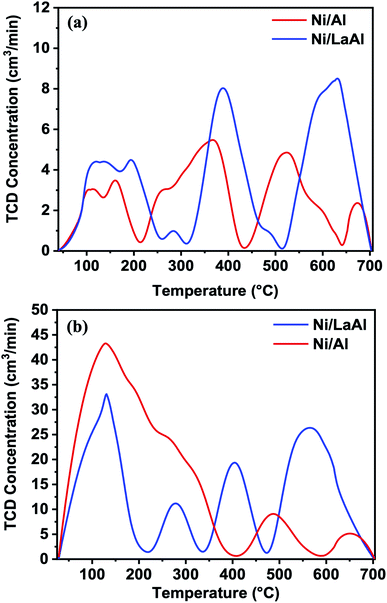
The number and strength of basic sites present on the calcined Ni/Al and Ni/LaAl catalysts were investigated through CO2-TPD experiments (Fig. 3a). The experiments were carried out at room temperature (25 °C), after pre-treatment in reducing atmosphere. According to the literature,45,46 the basic sites can be categorized according to their strength, in relation with the CO2 temperature desorption peaks as: (i) weak (50–200 °C), (ii) intermediate (200–400 °C), and (iii) strong (400–650 °C). From the results presented herein, the Ni/Al catalyst presents three well defined peaks; thus, these can be linked to the presence of weak, medium and strong basic sites, respectively. On the other hand, the CO2-TPD profile of the Ni/LaAl catalyst shows three well resolved CO2 desorption peaks, as the Ni/Al, but rather shifted to higher temperatures. This dictates that La addition strengthens the basic sites. The desorption peaks at the highest temperature regime can be linked to the thermal decomposition of La-carbonates, respectively.47 It is worth pointing out that the modification of γ-Al2O3 support with La2O3 alters significantly the nature of the surface basicity (shift to higher temperature), as well as their abundance; the concentration of the basic sites was found for the Ni/Al and Ni/LaAl to be 34.2 and 47 mmol CO2 per gcat, respectively. Also, the density of the basic sites is 0.216 and 0.33 mmol CO2 per gcat. Wierzbicki et al.48 reported that weak, medium and strong basic sites are assigned to the surface OH− groups, to the Lewis acid-base pairings and to the surface O2− species at low-coordination environment, respectively.
The acidity of the Ni/Al and Ni/LaAl catalysts were examined using NH3-TPD measurements. As can be observed from Fig. 3b, the Ni/Al and Ni/LaAl catalysts are dominated by three desorption regions; the first is located at temperatures lower than 200 °C, the second at medium desorption temperatures (200–500 °C), and the third at temperatures higher than 500 °C. These desorption areas can be assigned to weak, medium and strong acid sites,45,46 whereas the low temperature peak can be partially assigned to the physisorbed ammonia. The peaks detected at temperatures higher than 500 °C may partially correspond to NOx species being produced as a result of NH3 reaction with the oxygen species of the catalyst. From the NH3-TPD profiles of the catalytic materials tested herein, both catalysts present mostly weak acid sites, while the modification of γ-Al2O3 support with the introduction of La2O3 led to a drop in surface acidity from 200 mmol gcat−1 (Ni/Al) to 170 mmol gcat−1 (Ni/LaAl). Also, the density of the acid sites is 1.26 and 1.19 mmol NH3 per m2 for Ni/Al and Ni/LaAl, respectively. Though the Ni/LaAl catalyst has a distinct peak at 400 °C (medium strength acid sites). This is of great interest for the reaction under investigation, as mildly acidic catalytic materials promote the SDO process and prevent extending cracking and the formation of coke. The results of the NH3-TPD profile of the Ni/Al catalyst are in line with the findings reported from Li et al.49
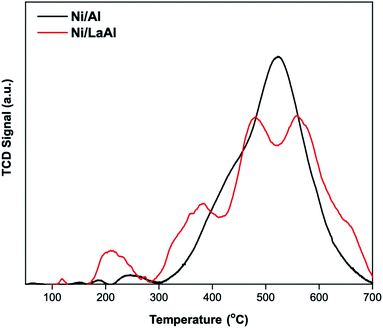
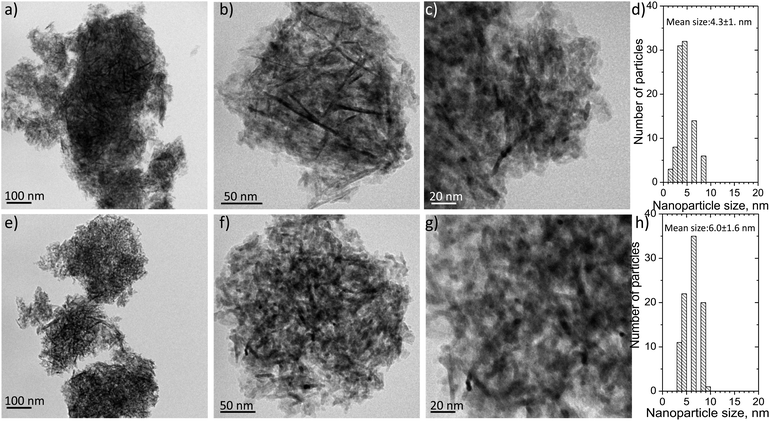
The reducibility behavior of the Ni/Al and the Ni/LaAl catalysts and the degree of interaction of Ni species with the support were studied using H2-TPR studies (Fig. 4). It is generally accepted that the reduction of NiO weakly interacting with the support takes places at temperatures lower than 500 °C, while the reduction of NiO strongly interacting with the bulk of the support takes place over this temperature.50,51 Kathiraser et al.,52 using La-modified Ni/Al2O3 catalysts for the CO2 reforming of CH4, reported that the TPR peaks in the 300–500 °C range can be linked to free and amorphous NiO phase, respectively, whereas the peaks in the 500–650 °C range correspond to the reduction of the mixed Ni-support phase towards metallic Ni. As can be observed from Fig. 4, and for both the Ni/Al and Ni/LaAl catalysts, the main reduction peak of the NiO species is in the 300–650 °C region, in good agreement with the H2-TPR reduction behavior of similar catalysts found in the literature.49,52,53 However, it is noted that in the case of the Ni/LaAl catalyst there is an additional peak around 220 °C which supports the fact that the modification of alumina using La2O3 facilitated the reduction of the Ni species and most likely led to polydispersion of NiO species (in terms of particle size) that are in different electronic interaction with the support. According to the histogram results (based on the TEM studies) the size distribution is between 2–10 nm. This is in agreement with the inability to trace Ni or NiO using XRD. It is also worth noticing that in the H2-TPR the different species of Ni or NiO are monitored not only in relation to their size but also in relation to their geometrical location with respect to the support; the latter dictates the extend of Ni or NiO interaction with the support. For instance, it is possible to get two different peaks for small crystallites of Ni at low and high temperature corresponding to weak and strong Ni–support interactions. This increases the polydispersity that was measured using the H2-TPR technique.
The strength of H2 interaction with the Ni centers, as well as, the amount of chemisorbed H2 were investigated by H2-TPD experiments; these were carried out on the reduced Ni/Al and Ni/LaAl catalysts. As can be observed from the profiles obtained (Fig. S2†), the Ni/Al catalyst shows H2 desorption peaks at 70, 490 and 720 °C, while the Ni/LaAl catalyst at 40, 160, 480, 750 and 810 °C. As is well understood, H2 desorption peaks at temperatures lower than 450 °C can be assigned to H2 desorbed from the active metal sites, while peaks located at temperatures higher than 450 °C may come from H2 located in the subsurface layers, H2 spillover and/or reoxidation of Ni by water inherent on the sample after reduction.54,55 Ni dispersion (DNi, %) and the mean Ni particle size (dNi, nm) of the catalysts were calculated based on the amount of H2 desorbed (<450 °C), and the results are presented in Table 2.
The high resolution XPS Ni 2p spectra for the reduced Ni/Al and Ni/LaAl catalysts are presented in Fig. S3,† while the accompanying elemental compositions are given in Table 3. For the Ni 2p3/2 peak, both catalysts present a low binding energy shoulder corresponding to Ni0 at around 853.0 eV and a strong peak at 856.1 ± 0.2 eV corresponding to NiAl2O4.56 The presence of NiAl2O4 is in agreement with the XRD results, where this is the only Ni oxide observed. From the O 1s spectra (not shown herein) the peak identified at binding energies 531.2 ± 0.1 eV corresponds to lattice oxygen for Al2O3. Also, it can be seen (Table 3) that in the presence of La, more Ni prefers to reside on the surface (higher Ni surface atomic concentration).
| Catalyst | Element | O (1s) | Al (2p) | La (2p) | Ni (2p) |
|---|---|---|---|---|---|
| Ni/Al | Element. conc. (at%) | 63.48 | 34.31 | 2.21 | |
| Ni/LaAl | Binding energy (eV) | 531.24 | 74.27 | 856.31 | |
| Ni/Al | Element. conc. (at%) | 62.08 | 33.62 | 0.45 | 3.85 |
| Ni/LaAl | Binding energy (eV) | 531.19 | 74.21 | 836.22 | 856.16 |
Fig. 5 shows representative transmission electron microscopy images with different magnifications and the mean Ni particle size distribution histograms for the reduced Ni/Al and Ni/LaAl catalysts. It appears that for both catalysts the distribution of Ni particles on the support is quite uniform and rather homogeneously deposited on the surface. As a result of the relatively low calcination/reduction temperatures used herein (400 °C), the average Ni size (Fig. 5d and h) was rather small, estimated at 4.3 ± 1.6 nm for the Ni/Al and 6.0 ± 1.6 nm for the Ni/LaAl.
3.2 Catalytic activity
As is well understood, it is important to ensure operation at steady state conditions in order to accurately evaluate catalytic performance. The group of Crocker et al.57,58 reported two highly interesting works devoted to the transformation of used cooking oil and waste free fatty acids into green diesel via decarboxylation/decarbonylation (deCOx) reactions using Ni based catalysts. In contrast to our study, they found that the prepared catalytic materials required >24 or even 48 h of time-on-stream in order to attain steady state conditions. However, the period of time required in order to attain steady state conditions in the system is highly dependent on both the catalyst and the reaction conditions employed. Similar behavior to our study was observed by Veses et al.59 and Alvarez-Galvan et al.,60 who reported that steady state was achieved after 45 min and 2–3 h, respectively.
The hydrotreating temperature has an important effect on the SDO reaction, as it affects the extent that decarboxylation/decarbonylation, hydrodeoxygenation, isomerization and hydrocracking reactions occur and the catalyst's lifetime.61–63 As an example, Srifa et al.,61 using palm oil as feedstock over a NiMoS2/γ-Al2O3 catalyst, reported that a small increase in the reaction temperature (from 270 to 300 °C) resulted at considerable improvement in the selectivity towards C15–C18 hydrocarbons (from 26.7% to 89.8%). Moreover, Šimáček et al.63 using a commercial hydrorefining Ni–Mo/γ-Al2O3 catalyst in the hydrodeoxygenation of rapeseed oil, reported that the liquid products obtained below 310 °C contained reactants and intermediates, while over 310 °C the liquid products contained only C17 and C18 hydrocarbons.
For comparison purposes, a blank experiment at 375 °C (experimental protocol #1) was performed in order to determine the liquid product distribution during palm oil deoxygenation in the absence of catalyst. The results showed that the liquid products were mainly composed of fatty acids (>76%) with low hydrocarbon yield (<24%) (Table S1†). Thus, it can be concluded that the thermal contributions to the production of diesel-like hydrocarbons are relatively minor.
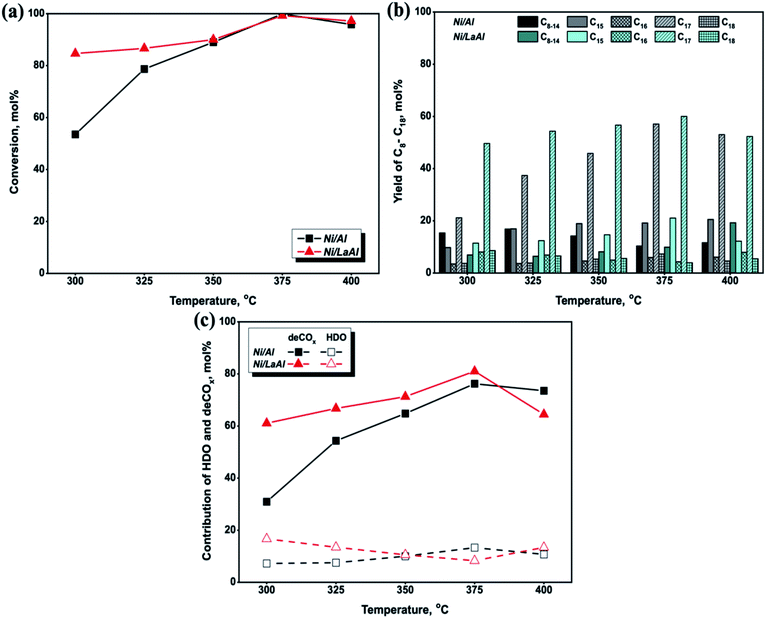
The influence of hydrotreating temperature on the triglyceride conversion for the Ni/Al and Ni/LaAl catalysts tested herein is presented in Fig. 6a, and as can be observed, conversion increased with increasing temperature for both catalysts. However, the Ni/LaAl catalyst appears more active at low reaction temperatures, with conversion taking the value of 85% at 300 °C (54% for the Ni/Al) and 87% at 325 °C (79% for the Ni/Al). Above 350 °C, both catalysts showed similar conversion, which reached 100% at 375 °C, and declined slightly at 400 °C. In broad agreement with our results, Ramesh et al.,64 examining the performance of Ni–MoS/mesoporous zirconia–silica (Zr-SBA-15, Zr-KIT-6, Zr–SiO2, and Zr-FSM-16 with Si/Zr = 10) catalysts on the hydrodeoxygenation of jojoba oil between 225–375 °C (at a constant H2 pressure of 30 bar), reported a slight decrease in the conversion of triglycerides, when the temperature increased over 350 °C.
The influence of hydrotreating temperature on the n-C8 to n-C18 hydrocarbon yield is presented in Fig. 6b. As can be observed, the yield to n-C15 to n-C18 hydrocarbons increased between 300–375 °C, for both catalysts, and the values attained for the Ni/LaAl (in parenthesis the corresponding one for the Ni/Al) were: 78% (38%) at 300 °C, 80% (62%) at 325 °C, 82% (75%) at 350 °C and 89% (90%) at 375 °C; however, it decreased to 78% (84%) at 400 °C. It is speculated that the slight decrease in the conversion of triglycerides (Fig. 6a) and n-C15 to n-C18 hydrocarbons at 400 °C (Fig. 6b) was caused by the sintering of the active phase and the formation of coke on the catalysts surface. This finding is in accordance with the literature,64–66 where it has been argued that the optimum reaction temperature for the C![[double bond, length as m-dash]](https://www.rsc.org/images/entities/char_e001.gif) O bond scission of free fatty acids, with minimum degree of carbon deposition during the SDO process, is in the range of 350–375 °C; a further increase of temperature to 400 °C and above leads to coke formation due to the occurrence of cracking/hydrocracking reactions, the complex oil composition and the large molecules.
O bond scission of free fatty acids, with minimum degree of carbon deposition during the SDO process, is in the range of 350–375 °C; a further increase of temperature to 400 °C and above leads to coke formation due to the occurrence of cracking/hydrocracking reactions, the complex oil composition and the large molecules.
Furthermore, as illustrated in Fig. 6b, the n-C17 and n-C15 hydrocarbons were always higher for both catalytic samples, which indicates a promotion of the deCO2 and deCO reaction pathways. Specifically, for the Ni/Al catalyst, the yield of n-C17 gradually increased from 21% at 300 °C to the maximum value of 57% at 375 °C, while the yield of n-C15 also increased from 10% to 19%. However, the Ni/LaAl catalyst showed higher n-C17 and n-C15 yields, with values for the former hydrocarbon ranging from 49 to 60% and for the latter from 11 to 21%, between 300 and 375 °C. Moreover, although the yield of n-C18 and n-C16 hydrocarbons was less than 10% (between 300–375 °C) for both catalysts, an opposing trend was observed, i.e., it increased for the Ni/Al and decreased for the Ni/LaAl sample. Specifically, for the former catalyst, the yield of n-C18 increased from 4% to 7% and the yield of n-C16 rose from 4% to 6%, from 300 °C to 375 °C respectively. In contrast, the n-C18 and n-C16 yield for the Ni/LaAl catalyst declined between 300–375 °C, taking values from 9% to 4% and from 8% to 4%, respectively.
Another difference between the catalysts tested was observed in terms of the yield towards lighter n-C8–C14 hydrocarbons. Specifically, for the Ni/Al catalyst the yield of n-C8–C14 decreased from 15% to 10%, which may be explained by secondary catalytic cracking of the intermediates produced. Chen et al.,67 studied the catalytic performance of 10 wt% Ni/HZSM-5 (Si/Al = 25) catalyst on the hydroprocessing of fatty acid methyl esters (FAME) at temperatures between 260 °C and 300 °C and at H2 pressures ranging from 4–12 bar and reported that when increasing the reaction temperature from 260 °C to 300 °C, under any level of H2 pressure (4, 8 and 12 bar), the yield of C8–C16 hydrocarbons decreased, and attributed this finding to secondary catalytic cracking of the intermediates produced. In contrast with the Ni/Al catalyst, the yield of n-C8–C14 for the Ni/LaAl increased from 7% to 10% from 300 to 375 °C (and to 19% at 400 °C), indicating that at higher hydrotreating temperatures, cracking occurs along with the deCOx reactions, leading to the formation of hydrocarbons with lower molecular weight.16,63,68
The results reported above are in full agreement with those obtained by the groups of Srifa et al.69 and Liu et al.70 In particular, Srifa et al.69 studied the hydrodeoxygenation of palm oil over NiAl2O4 spinel-type catalysts, with different reduction temperatures at 330 °C, 50 bar, LHSV of 1 h−1 and H2/oil feed ratio of 1000 N cm3 (cm3)−1 and reported that the deCOx reactions were dominant over the HDO pathway. Liu et al.70 studied the transformation of jatropha oil into green diesel in a fixed bed reactor over five catalytic materials supported on γ-Al2O3 as follows: 5Ni15Mo/Al2O3 catalyst in both sulfided and non-sulfided state and 5Ni15Mo0.5La/Al2O3, 5Ni15Mo5La/Al2O3, 5Ni15Mo15La/Al2O3 non-sulfided catalysts. The catalytic tests were carried out at 280–400 °C, 35 bar, LHSV of 0.9 h−1 and H2/oil feed ratio of 1000 cm3 (cm3)−1. The authors reported that the highest C15–C18 hydrocarbons yield was achieved by the 5Ni15Mo5La/Al2O3 non-sulfided catalyst at 370 °C taking value equal to 78%. Moreover, the C15–C18 fraction greatly increased from 280 °C to 370 °C, however, between 370 °C to 400 °C there was no significant effect on the C15–C18 yield. Furthermore, the light fraction yield increased with temperature, as higher temperatures favored the cracking reaction.
In order to clarify further the deoxygenation behavior of the catalysts tested herein, the mol% contributions of HDO and deCO/deCO2 reactions were calculated using eqn (6) and (7) and the results are presented in Fig. 6c. The results confirm that both the Ni/Al and Ni/LaAl catalysts promoted the deCO2 and deCO deoxygenation paths much more extensively than HDO, for the entire temperature range under investigation. These results are consistent with published works reporting that Ni based catalysts favor the deCOx reaction paths and not the HDO reaction.9,41,69,71 Moreover, as the palm oil used in the present study consisted mainly of C16 and C18 fatty acids, it can be deduced that the main components of the liquid products should be n-C15 and n-C17 hydrocarbons due to the highly selective deCOx reaction paths.
As mentioned above, the main gaseous products were H2, CO2, CO and CH4 and the results are presented in Table 4. Leaving aside H2, which was used as feed, CH4 was the main gas product due to the methanation reaction between CO or CO2 with H2. The presence of C2H6 and C3H8 in only trace amounts indicates their cracking, producing CH4. An interesting observation is that CO2 seems to be produced in slightly higher amounts than CO, which may possibly indicate that CO is relatively easier to hydrogenate to CH4.72 The above are in line with the findings reported by a number of published works concerning the influence of Ni catalysts on the selectivity of the gaseous products.9,41,65,73,74
| Catalysts | Temperature (°C) | Gas product composition (mol%) | |||
|---|---|---|---|---|---|
| CO2 | H2 | CH4 | CO | ||
| Ni/Al | 300 | 2.80 | 90.64 | 6.22 | 0.36 |
| 325 | 2.03 | 91.59 | 6.38 | 0.00 | |
| 350 | 4.04 | 86.30 | 7.97 | 1.68 | |
| 375 | 2.92 | 91.82 | 4.66 | 0.60 | |
| 400 | 2.21 | 88.67 | 9.11 | 0.00 | |
| Ni/LaAl | 300 | 3.32 | 87.07 | 9.16 | 0.45 |
| 325 | 3.39 | 88.56 | 7.34 | 0.71 | |
| 350 | 2.69 | 89.89 | 6.70 | 0.72 | |
| 375 | 2.82 | 86.73 | 10.45 | 0.00 | |
| 400 | 2.19 | 79.77 | 16.93 | 1.11 | |
In concluding, the improved catalytic activity exhibited by the Ni/LaAl catalyst can be probably understood on the basis of the increased dispersion of Ni on its surface (XPS) and the increased Ni–support interaction (H2-TPR). Moreover, it is likely that the lower overall acidity of the Ni/LaAl catalyst (TPD) suppressed the hydrocracking reactions, which helps explain its improved yield towards C15–C18 alkanes.
| Catalysts | LHSV (h−1) | Gas product composition (mol%) | |||
|---|---|---|---|---|---|
| CO2 | H2 | CH4 | CO | ||
| Ni/Al | 1.2 | 2.92 | 91.82 | 4.66 | 0.60 |
| 2.4 | 2.21 | 92.86 | 4.39 | 0.53 | |
| 3.6 | 2.87 | 91.69 | 4.86 | 0.58 | |
| Ni/LaAl | 1.2 | 2.82 | 86.73 | 10.45 | 0.00 |
| 2.4 | 19.06 | 51.30 | 25.42 | 4.22 | |
| 3.6 | 18.37 | 67.93 | 13.69 | 0.00 | |
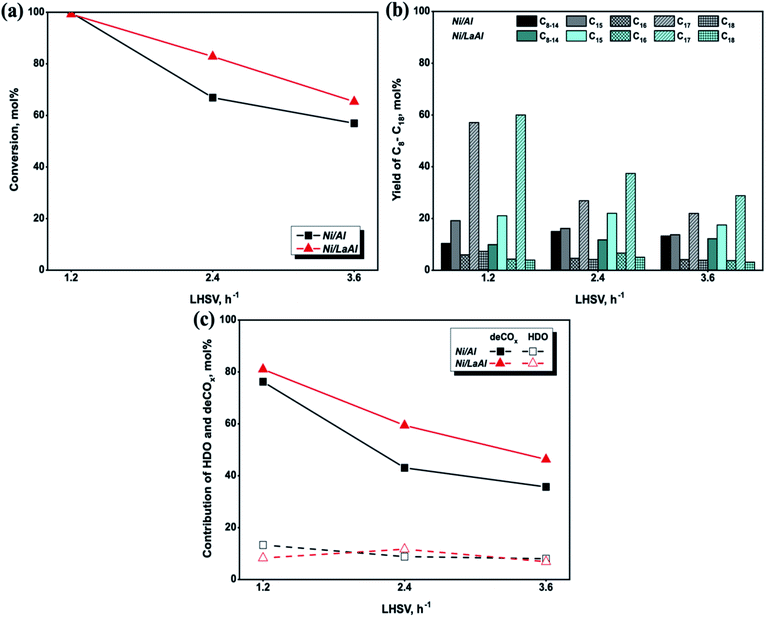
Similar results with the ones reported herein were obtained by Kaewmeesri et al.41 and Nimkarde et al.75 In particular, Kaewmeesri et al.41 observed that the maximum C15–C18 product yield (82%) was achieved for the lowest LHSV (0.5 h−1), as there was sufficient contact time between the reactant and the catalyst, while increasing the LHSV to 2 h−1 caused a decrease to 66%. Moreover, the authors also showed that deCOx was the dominant reaction pathway and that methane was the main gas product generated from CO2/CO hydrogenation. Nimkarde et al.75 investigated the effect of LHSV (1.1–4.5 h−1) during the hydrodeoxygenation of karanja oil and showed that at 380 °C, conversion decreased from 88.6% (1.1 h−1) to 58.3% (4.5 h−1) and from 90.5% (1.1 h−1) to 61% (4.5 h−1) over CoMo and NiMo catalysts, respectively.
3.3 Catalyst stability and carbon deposition studies
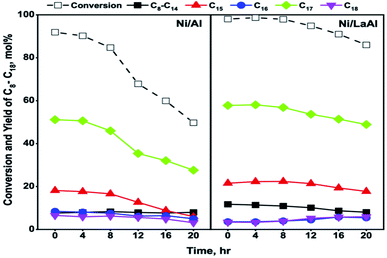
Taromi et al.,33 using canola oil as feed and similar experimental conditions to the ones reported herein (i.e., T = 400 °C, P = 35 bar, H2/oil = 600 cm3 (cm3)−1, LHSV = 0.5 h−1), also observed substantial deactivation for Ni/Al2O3 catalysts. Specifically, after a rather stable operation for approximately 5 h, the conversion values recorded for a Ni/Al2O3 catalyst, prepared via incipient wetness impregnation, decreased from about 80% to 35% after 10 h. Interestingly, a Ni/Al2O3 catalyst prepared via sol gel was more stable as conversion declined from 69% to 54% after 10 h of operation. Lercher et al.,44 using algal oil as feed, reported that a Ni/ZrO2 catalyst did not deactivate after 72 h of time-on-stream tests however, the experiments were conducted at a lower temperature (260 °C) and with a more dilute feed (1.33 wt%, LHSV = 0.32 h−1) thus, the conditions were milder in comparison to those reported herein.
Fig. 9a presents the TGA results for both catalysts. This initial examination revealed that the amount of coke deposited on the Ni/LaAl catalyst was significantly lower (11%) than that deposited on the Ni/Al catalyst (17%). Further examination of the two spent catalysts was carried out using temperature programmed oxidation (TPO, Fig. 9b). It is generally accepted in the literature that, in air rich environments, functional groups physically or chemically adsorbed onto carbon nanomaterials decompose below 200 °C, amorphous carbon species combust at temperatures between 200–500 °C, carbon nanofibers (CNFs) and carbon nanotubes (CNTs) are burned between 500–600/650 °C, and more graphitic structures such as graphite and graphene combust between 600/650–800 °C.80,81 For the Ni/Al catalyst, the peak around 210 °C can likely be ascribed to atomic carbon deposits formed over metallic nickel (which is the most reactive carbon type to oxygen), while the shoulder around 475 °C can be attributed to amorphous coke deposited close to the metal support interphase.82 The largest oxidation peak, at around 635 °C, can be linked to well defined-structured carbon, hard to be oxidized. For the Ni/LaAl catalyst, atomic carbon appears as a shoulder (at around 240 °C) of the peak located at 335 °C. The graphitic carbon peak at 630 °C is significantly less pronounced in comparison to the Ni/Al. Two additional thermal processes should also be taken into consideration; decomposition of the La(OH)3 and LaO2CO3 phases that take place at around 350 °C and 750 °C, respectively, as carbonates are more stable than the hydroxides.83
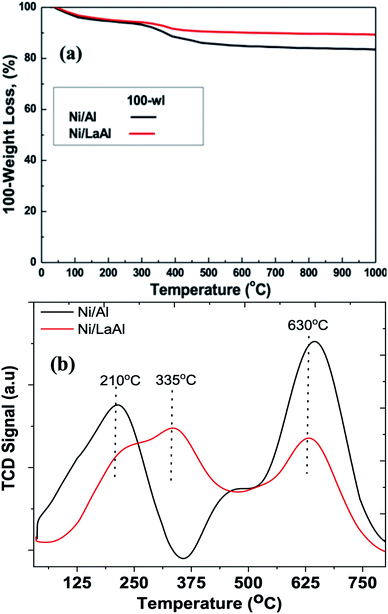 | ||
| Fig. 9 (a) TGA graphs, and (b) TPO profiles of the spent Ni/Al and Ni/LaAl catalysts. Reaction conditions: experimental protocol #2. | ||
The nature and structure of the carbonaceous species deposited on to the spent catalysts was also investigated using Raman spectroscopy and as can be observed in Fig. 10a and b, both catalysts show two well resolved bands around 1340 cm−1 and 1580 cm−1. The former (D band) results from a disorder-double resonant process due to breakdown of the usual wave vector selection rule (A1g symmetry), while the latter (G-band), located at the centre of the Brillouin zone (BZ), is caused by the in-plane optical mode of vibration (E2g symmetry) of two neighboring carbon atoms on the perfect hexagonal graphite.84,85 As it is widely accepted,78,86 the relative intensity of the D and G bands (ID/IG) can be used to describe the structural order of carbon deposits with lower values indicating a higher degree of graphitization. The ID/IG values obtained for the catalysts tested herein where 0.85 for the Ni/Al and 0.91 for the Ni/LaAl, meaning that although the degree of graphitization was not very high for both catalysts, higher fractions of difficult to oxidize structures were deposited on the Ni/Al catalyst, in excellent agreement with the TPO results presented above. Deconvolution of the Ni/Al pattern shows the presence of four peaks, namely, D1 (∼1233 cm−1), D2 (∼1329 cm−1), D3 (1430 cm−1) and G (1582 cm−1). On the other hand, in the case of Ni/LaAl catalyst the deconvoluted Raman peaks were D1 (1228 cm−1), D2 (1329 cm−1), D3 (1397 cm−1) and G1 (1580 cm−1), G2 (1603 cm−1). The origin of the peaks has as follows: G band is linked to graphitic planes, whereas D1 is a sp2-sp3 carbon structure, D2 band is associated to functional groups and disturbances caused by them in the graphene layer. The D3 band is linked to the presence of amorphous carbon (soot).87
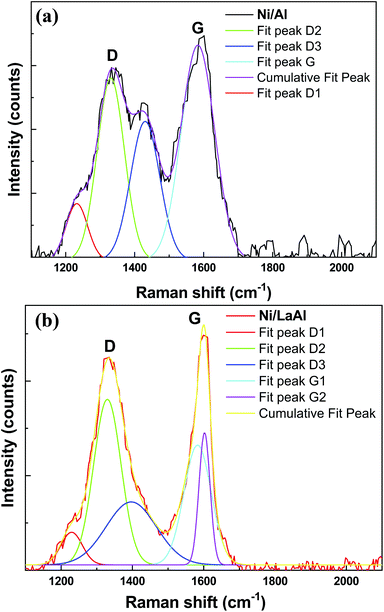 | ||
| Fig. 10 Raman spectra of the spent (a) Ni/Al, and (b) Ni/LaAl catalysts. Reaction conditions: experimental protocol #2. | ||
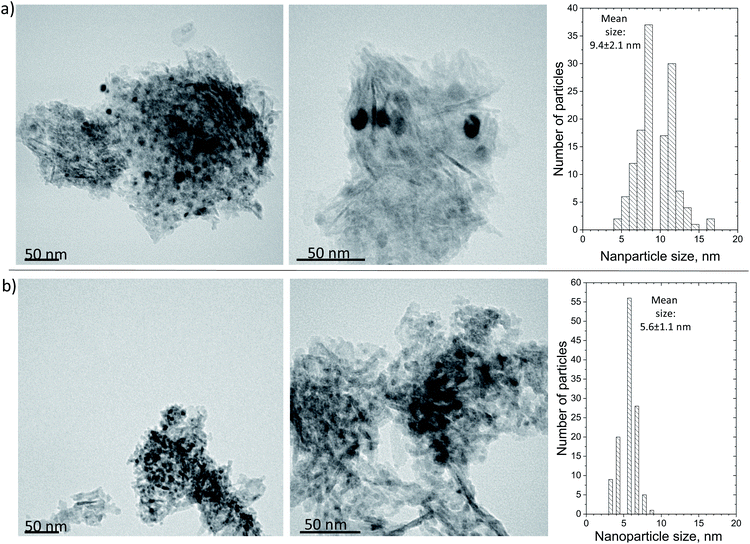
Finally, the morphology of the carbonaceous deposits was probed using TEM (Fig. 11), which failed to identify any clear carbon structures on either of the spent samples. This finding indicates that the surface coke formed a very thin layer not detectable at the working magnification and is in line with the TPO and Raman findings discussed above, i.e., that the deposited carbon had a relatively low degree of graphitization. However, the calculation of the Ni mean nanoparticle size showed that while the Ni/Al suffered from extensive sintering (from 4.3 ± 1.6 nm for the reduced catalyst to 9.4 ± 2.1 nm for the spent), this was mostly avoided on the Ni/LaAl catalyst (from 6.0 ± 1.6 nm for the reduced catalyst to 5.6 ± 1.1 nm for the spent). This finding provides a good explanation for the excellent stability characteristics observed for this sample.
4 Conclusions
The present study investigated the effect of hydrotreating temperature and LHSV on the catalytic performance of Ni catalysts supported on γ-Al2O3 and γ-Al2O3 modified with La2O3, in a continuous flow trickle bed reactor, for the selective deoxygenation of palm oil. Catalytic experiments were performed between 300–400 °C, at a constant temperature (30 bar) and different LHSV (1.2–3.6 h−1). The catalysts were prepared via the wet impregnation method, at a constant metal loading of 8 wt%. The catalytic samples, after calcination and/or reduction, were characterized by N2 adsorption/desorption, XRD, NH3-TPD, CO2-TPD, H2-TPR, H2-TPD, XPS and TEM, in order to provide an insight into the effect on performance by the their physical and chemical properties. Moreover, the spent catalysts after 20 h of time-on-stream tests were characterized by TGA, TPO, Raman and TEM, in order to determine the extent of carbon deposition and metal particle sintering on the spent samples.The results show that the incorporation of La2O3 in the Al2O3 support: (i) increased the Ni surface atomic concentration (XPS), (ii) affected the nature and abundance of surface basicity as the concentration of basic sites was found to be 34.2 mmol CO2 per gcat for the Ni/Al and 47 mmol CO2 per gcat for the Ni/LaAl (the density of the basic sites was 0.216 and 0.33 mmol CO2 per gcat, respectively), and (iii) led to a drop in surface acidity from 200 mmol gcat−1 (Ni/Al) to 170 mmol gcat−1 (Ni/LaAl) and to the density of the acid sites from 1.26 mmol NH3 per m2 (Ni/Al) to 1.19 mmol NH3 per m2 (Ni/LaAl); however, the Ni/LaAl catalyst presented a larger population of medium-strength acid sites. These characteristics helped promote the SDO process and prevented extended cracking and the formation of coke. Thus, higher triglyceride conversions and n-C15 to n-C18 hydrocarbon yields were achieved with the Ni/LaAl at lower reaction temperatures. Moreover, the Ni/LaAl catalyst was considerably more stable during 20 h of time-on-stream. Examination of the spent catalysts revealed that both carbon deposition and degree of graphitization of the surface coke, as well as, the extent of sintering were lower on the Ni/LaAl catalyst, explaining its excellent performance during time-on-stream.
Conflicts of interest
There are no conflicts of interest to declare.Acknowledgements
MAG, NDC and KNP gratefully acknowledge that this researched was co-financed by Greece and the European Union (European Social Fund-ESF) through the Operational Programme “Human Resources Development, Education and Lifelong Learning” (MIS-5050170). SD is thankful for financial assistance provided by the Research Committee of the University of Western Macedonia (grant number 70277). KP acknowledges the financial support from the Abu Dhabi Department of Education and Knowledge (ADEK) under the AARE 2019-233 grant and the support from Khalifa University under the RCII-2018-024.References
- J. Zalasiewicz, C. N. Waters, C. P. Summerhayes, A. P. Wolfe, A. D. Barnosky, A. Cearreta, P. Crutzen, E. Ellis, I. J. Fairchild, A. Gałuszka, P. Haff, I. Hajdas, M. J. Head, J. A. Ivar do Sul, C. Jeandel, R. Leinfelder, J. R. McNeill, C. Neal, E. Odada, N. Oreskes, W. Steffen, J. Syvitski, D. Vidas, M. Wagreich and M. Williams, Anthropocene, 2017, 19, 55–60 CrossRef.
- X. Zheng, D. Streimikiene, T. Balezentis, A. Mardani, F. Cavallaro and H. Liao, J. Cleaner Prod., 2019, 234, 1113–1133 CrossRef.
- P. Bareschino, E. Mancusi, M. Urciuolo, A. Paulillo, R. Chirone and F. Pepe, Renewable Sustainable Energy Rev., 2020, 130, 109962 CrossRef CAS.
- S. Liu, Q. Zhu, Q. Guan, L. He and W. Li, Bioresour. Technol., 2015, 183, 93–100 CrossRef CAS.
- S. L. Douvartzides, N. D. Charisiou, K. N. Papageridis and M. A. Goula, Energies, 2019, 12, 809 CrossRef CAS.
- N. D. Charisiou, K. Polychronopoulou, A. Asif and M. A. Goula, Surf. Coat. Technol., 2018, 352, 92–111 CrossRef CAS.
- N. Vivek, R. Sindhu, A. Madhavan, A. J. Anju, E. Castro, V. Faraco, A. Pandey and P. Binod, Bioresour. Technol., 2017, 239, 507–517 CrossRef CAS.
- A. Afshar Taromi and S. Kaliaguine, Fuel Process. Technol., 2018, 171, 20–30 CrossRef CAS.
- A. Srifa, K. Faungnawakij, V. Itthibenchapong and S. Assabumrungrat, Chem. Eng. J., 2015, 278, 249–258 CrossRef CAS.
- R. W. Gosselink, S. A. Hollak, S. W. Chang, J. Van Haveren, K. P. De Jong, J. H. Bitter and D. S. Van Es, ChemSusChem, 2013, 6, 1576–1594 CrossRef CAS.
- M. Grilc, B. Likozar and J. Levec, ChemCatChem, 2016, 8, 180–191 CrossRef CAS.
- A. E. Coumans and E. J. Hensen, Catal. Today, 2017, 298, 181–189 CrossRef CAS.
- E. Santillan-Jimenez, T. Morgan, R. Loe and M. Crocker, Catal. Today, 2015, 258, 284–293 CrossRef CAS.
- E. Santillan-Jimenez, R. Loe, M. Garrett, T. Morgan and M. Crocker, Catal. Today, 2018, 302, 261–271 CrossRef CAS.
- N. Asikin-Mijan, H. V. Lee, J. C. Juan, A. R. Noorsaadah, H. C. Ong, S. M. Razali and Y. H. Taufiq-Yap, Appl. Catal., A, 2018, 552, 38–48 CrossRef CAS.
- C. Kordulis, K. Bourikas, M. Gousi, E. Kordouli and A. Lycourghiotis, Appl. Catal., B, 2016, 181, 156–196 CrossRef CAS.
- J. A. Hunns, M. Arroyo, A. F. Lee, J. M. Escola, D. Serrano and K. Wilson, Catal. Sci. Technol., 2016, 6, 2560–2564 RSC.
- H. Wang, H. Ruan, H. Pei, H. Wang, X. Chen, M. P. Tucker, J. R. Cort and B. Yang, Green Chem., 2015, 17, 5131–5135 RSC.
- J. Wildschut, F. H. Mahfud, R. H. Venderbosch and H. J. Heeres, Ind. Eng. Chem. Res., 2009, 48, 10324–10334 CrossRef CAS.
- A. S. Berenblyum, R. S. Shamsiev, T. A. Podoplelova and V. Y. Danyushevsky, Russ. J. Phys. Chem. A, 2012, 86, 1199–1203 CrossRef CAS.
- A. S. Berenblyum, T. A. Podoplelova, R. S. Shamsiev, E. A. Katsman and V. Y. Danyushevsky, Pet. Chem., 2011, 51, 336–341 CrossRef CAS.
- X. Zhu, L. L. Lobban, R. G. Mallinson and D. E. Resasco, J. Catal., 2011, 281, 21–29 CrossRef CAS.
- T. Nimmanwudipong, R. C. Runnebaum, D. E. Block and B. C. Gates, Energy Fuels, 2011, 25, 3417–3427 CrossRef CAS.
- W. Jin, L. Pastor-Pérez, J. J. Villora-Pico, M. M. Pastor-Blas, A. Sepúlveda-Escribano, S. Gu, N. D. Charisiou, K. Papageridis, M. A. Goula and T. R. Reina, Energies, 2019, 13, 132 CrossRef.
- J. Chen and Q. Xu, Catal. Sci. Technol., 2016, 6, 7239–7251 RSC.
- M. Rabaev, M. V. Landau, R. Vidruk-Nehemya, A. Goldbourt and M. Herskowitz, J. Catal., 2015, 332, 164–176 CrossRef CAS.
- B. Veriansyah, J. Y. Han, S. K. Kim, S. A. Hong, Y. J. Kim, J. S. Lim, Y. W. Shu, S. G. Oh and J. Kim, Fuel, 2012, 94, 578–585 CrossRef CAS.
- T. Morgan, D. Grubb, E. Santillan-Jimenez and M. Crocker, Top. Catal., 2010, 53, 820–829 CrossRef CAS.
- K. N. Papageridis, G. Siakavelas, N. D. Charisiou, D. G. Avraam, L. Tzounis, K. Kousi and M. A. Goula, Fuel Process. Technol., 2016, 152, 156–175 CrossRef CAS.
- N. D. Charisiou, S. L. Douvartzides, G. I. Siakavelas, L. Tzounis, V. Sebastian, V. Stolojan, S. J. Hinder, M. A. Baker, K. Polychronopoulou and M. A. Goula, Catalysts, 2019, 9, 676 CrossRef CAS.
- N. D. Charisiou, K. N. Papageridis, L. Tzounis, V. Sebastian, S. J. Hinder, M. A. Baker, M. AlKetbi, K. Polychronopoulou and M. A. Goula, Int. J. Hydrogen Energy, 2019, 44, 256–273 CrossRef CAS.
- S. R. Yenumala, S. K. Maity and D. Shee, Catal. Sci. Technol., 2016, 6, 3156–3165 RSC.
- A. Afshar Taromi and S. Kaliaguine, Appl. Catal., A, 2018, 558, 140–149 CrossRef CAS.
- P. Kumar, S. R. Yenumala, S. K. Maity and D. Shee, Appl. Catal., A, 2014, 471, 28–38 CrossRef CAS.
- I. Hachemi, N. Kumar, P. Mäki-Arvela, J. Roine, M. Peurla, J. Hemming, J. Salonen and D. Y. Murzin, J. Catal., 2017, 347, 205–221 CrossRef CAS.
- M. Gousi, C. Andriopoulou, K. Bourikas, S. Ladas, M. Sotiriou, C. Kordulis and A. Lycourghiotis, Appl. Catal., A, 2017, 536, 45–56 CrossRef CAS.
- R. Loe, E. Santillan-Jimenez, T. Morgan, L. Sewell, Y. Ji, S. Jones, M. A. Isaacs, A. F. Lee and M. Crocker, Appl. Catal., B, 2016, 191, 147–156 CrossRef CAS.
- N. D. Charisiou, G. Siakavelas, K. N. Papageridis, A. Baklavaridis, L. Tzounis, K. Polychronopoulou and M. A. Goula, Int. J. Hydrogen Energy, 2017, 42, 13039–13060 CrossRef CAS.
- N. D. Charisiou, L. Tzounis, V. Sebastian, S. J. Hinder, M. A. Baker, K. Polychronopoulou and M. A. Goula, Appl. Surf. Sci., 2019, 474, 42–56 CrossRef CAS.
- A. Srifa, N. Viriya-Empikul, S. Assabumrungrat and K. Faungnawakij, Catal. Sci. Technol., 2015, 5, 3693–3705 RSC.
- R. Kaewmeesri, A. Srifa, V. Itthibenchapong and K. Faungnawakij, Energy Fuels, 2015, 29, 833–840 CrossRef CAS.
- K. N. Papageridis, N. D. Charisiou, S. L. Douvartzides, V. Sebastian, S. J. Hinder, M. A. Baker, S. AlKhoori, K. Polychronopoulou and M. A. Goula, Fuel Process. Technol., 2020, 209, 106547 CrossRef CAS.
- M. A. Goula, N. D. Charisiou, K. N. Papageridis, A. Delimitis, E. Pachatouridou and E. F. Iliopoulou, Int. J. Hydrogen Energy, 2015, 40, 9183–9200 CrossRef CAS.
- B. Peng, X. Yuan, C. Zhao and J. A. Lercher, J. Am. Chem. Soc., 2012, 134, 9400–9405 CrossRef CAS.
- H. Ma, L. Zeng, H. Tian, D. Li, X. Wang, X. Li and J. Gong, Appl. Catal., B, 2016, 181, 321–331 CrossRef CAS.
- N. D. Charisiou, G. Siakavelas, L. Tzounis, B. Dou, V. Sebastian, S. J. Hinder, M. A. Baker, K. Polychronopoulou and M. A. Goula, Int. J. Hydrogen Energy, 2020, 45, 10442–10460 CrossRef CAS.
- W. Mo, F. Ma, Y. Ma and X. Fan, Int. J. Hydrogen Energy, 2019, 44, 24510–24524 CrossRef CAS.
- D. Wierzbicki, R. Debek, M. Motak, T. Grzybek, M. E. Gálvez and P. Da Costa, Catal. Commun., 2016, 83, 5–8 CrossRef CAS.
- X. Li, H. Cheng, G. Liang, L. He, W. Lin, Y. Yu and F. Zhao, Catalysts, 2015, 5, 759–773 CrossRef CAS.
- Y. X. Pan, C. J. Liu and P. Shi, J. Power Sources, 2008, 176, 46–53 CrossRef CAS.
- K. Polychronopoulou, N. Charisiou, K. Papageridis, V. Sebastian, S. Hinder, A. Dabbawala, A. Alkhoori, M. Baker and M. Goula, Nanomaterials, 2018, 8, 931 CrossRef.
- Y. Kathiraser, W. Thitsartarn, K. Sutthiumporn and S. Kawi, J. Phys. Chem. C, 2013, 117, 8120–8130 CrossRef CAS.
- N. D. Charisiou, A. Iordanidis, K. Polychronopoulou, I. V. Yentekakis and M. A. Goula, Mater. Today: Proc., 2018, 27607–27616 CAS.
- S. Ewald, S. Standl and O. Hinrichsen, Appl. Catal., A, 2018, 549, 93–101 CrossRef CAS.
- S. Smeds, T. Salmi, L. P. Lindfors and O. Krause, Appl. Catal., A, 1996, 144, 177–194 CrossRef CAS.
- L. Salvati, L. E. Makovsky, J. M. Stencel, F. R. Brown and D. M. Hercules, J. Phys. Chem., 1981, 85, 3700–3707 CrossRef CAS.
- G. C. Silva, D. Qian, R. Pace, O. Heintz, G. Caboche, E. Santillan-Jimenez and M. Crocker, Catalysts, 2020, 10, 91 CrossRef CAS.
- R. Loe, Y. Lavoignat, M. Maier, M. Abdallah, T. Morgan, D. Qian, R. Pace, E. Santillan-Jimenez and M. Crocker, Catalysts, 2019, 9, 123 CrossRef.
- A. Veses, M. Aznar, I. Martínez, J. D. Martínez, J. M. López, M. V. Navarro, M. S. Callén, R. Murillo and T. García, Bioresour. Technol., 2014, 162, 250–258 CrossRef CAS.
- M. C. Alvarez-Galvan, G. Blanco-Brieva, M. Capel-Sanchez, S. Morales-delaRosa, J. M. Campos-Martin and J. L. Fierro, Catal. Today, 2018, 302, 242–249 CrossRef CAS.
- A. Srifa, K. Faungnawakij, V. Itthibenchapong, N. Viriya-empikul, T. Charinpanitkul and S. Assabumrungrat, Bioresour. Technol., 2014, 158, 81–90 CrossRef CAS.
- Y. Yang, Q. Wang, X. Zhang, L. Wang and G. Li, Fuel Process. Technol., 2013, 116, 165–174 CrossRef CAS.
- P. Šimáček, D. Kubička, G. Šebor and M. Pospíšil, Fuel, 2009, 88, 456–460 CrossRef.
- A. Ramesh, P. Tamizhdurai and K. Shanthi, Renewable Energy, 2019, 138, 161–173 CrossRef CAS.
- S. Khan, A. N. Kay Lup, K. M. Qureshi, F. Abnisa, W. M. A. Wan Daud and M. F. A. Patah, J. Anal. Appl. Pyrolysis, 2019, 140, 1–24 CrossRef CAS.
- X. Li, X. Luo, Y. Jin, J. Li, H. Zhang, A. Zhang and J. Xie, Renewable Sustainable Energy Rev., 2018, 82, 3762–3797 CrossRef CAS.
- L. Chen, H. Li, J. Fu, C. Miao, P. Lv and Z. Yuan, Catal. Today, 2016, 259, 266–276 CrossRef CAS.
- V. A. Yakovlev, S. A. Khromova, O. V. Sherstyuk, V. O. Dundich, D. Y. Ermakov, V. M. Novopashina, M. Y. Lebedev, O. Bulavchenko and V. N. Parmon, Catal. Today, 2009, 144, 362–366 CrossRef CAS.
- A. Srifa, R. Kaewmeesri, C. Fang, V. Itthibenchapong and K. Faungnawakij, Chem. Eng. J., 2018, 345, 107–113 CrossRef CAS.
- J. Liu, C. Liu, G. Zhou, S. Shen and L. Rong, Green Chem., 2012, 14, 2499–2505 RSC.
- E. Santillan-Jimenez, T. Morgan, J. Shoup, A. E. Harman-Ware and M. Crocker, Catal. Today, 2014, 237, 136–144 CrossRef CAS.
- J. Gao, Y. Wang, Y. Ping, D. Hu, G. Xu, F. Gu and F. Su, RSC Adv., 2012, 2, 2358–2368 RSC.
- T. Morgan, E. Santillan-Jimenez, A. E. Harman-Ware, Y. Ji, D. Grubb and M. Crocker, Chem. Eng. J., 2012, 189–190, 346–355 CrossRef CAS.
- N. Asikin-Mijan, N. A. Rosman, G. AbdulKareem-Alsultan, M. S. Mastuli, H. V. Lee, N. Nabihah-Fauzi, I. M. Lokman, F. A. Alharthi, A. A. Alghamdi, A. A. Aisyahi and Y. H. Taufiq-Yap, Process Saf. Environ. Prot., 2020, 142, 336–349 CrossRef CAS.
- M. R. Nimkarde and P. D. Vaidya, Energy Fuels, 2016, 30, 3107–3112 CrossRef CAS.
- N. D. Charisiou, G. I. Siakavelas, B. Dou, V. Sebastian, S. J. Hinder, M. A. Baker, K. Polychronopoulou and M. A. Goula, Catalysts, 2019, 9, 411 CrossRef CAS.
- G. Goula, G. Botzolaki, A. Osatiashtiani, C. M. Parlett, G. Kyriakou, R. M. Lambert and I. V. Yentekakis, Catalysts, 2019, 9, 541 CrossRef CAS.
- K. Polychronopoulou, N. D. Charisiou, G. I. Siakavelas, A. A. Alkhoori, V. Sebastian, S. J. Hinder, M. A. Baker and M. A. Goula, Sustainable Energy Fuels, 2019, 3, 673–691 RSC.
- K. N. Papageridis, N. D. Charisiou, S. Douvartzides, V. Sebastian, S. J. Hinder, M. A. Baker, S. AlKhoori, K. Polychronopoulou and M. A. Goula, Renewable Energy, 2020, 162, 1793–1810 CrossRef CAS.
- M. Velasquez, C. Batiot-Dupeyrat, J. Gallego, J. J. Fernández and A. Santamaria, Diamond Relat. Mater., 2016, 70, 105–113 CrossRef CAS.
- M. Velasquez, C. Batiot-Dupeyrat, J. Gallego and A. Santamaria, Diamond Relat. Mater., 2014, 50, 38–48 CrossRef CAS.
- F. Gholizadeh, A. Izadbakhsh, J. Huang and Y. Zi-Feng, Microporous Mesoporous Mater., 2021, 310, 110616 CrossRef CAS.
- V. Alcalde-Santiago, A. Davó-Quiñonero, D. Lozano-Castelló, A. Quindimil, U. De-La-Torre, B. Pereda-Ayo, J. A. González-Marcos, J. R. González-Velasco and A. Bueno-López, ChemCatChem, 2019, 11, 810–819 CAS.
- J. H. Lehman, M. Terrones, E. Mansfield, K. E. Hurst and V. Meunier, Carbon, 2011, 49, 2581–2602 CrossRef CAS.
- N. D. Charisiou, G. Siakavelas, K. N. Papageridis, A. Baklavaridis, L. Tzounis, G. Goula, I. V. Yentekakis, K. Polychronopoulou and M. A. Goula, Front. Environ. Sci., 2017, 5, 66 CrossRef.
- O. Padilla, J. Gallego and A. Santamaría, Diamond Relat. Mater., 2018, 86, 128–138 CrossRef CAS.
- A. V. Ramya, A. N. Mohan and B. Manoj, Mater. Sci.-Pol., 2016, 34, 330–336 CAS.
Footnote |
| † Electronic supplementary information (ESI) available. See DOI: 10.1039/d0ra08541c |
| This journal is © The Royal Society of Chemistry 2021 |

