
 Open Access Article
 This Open Access Article is licensed under a Creative Commons Attribution-Non Commercial 3.0 Unported Licence
The influence of the morphology of titania and hydroxyapatite on the proliferation and osteogenic differentiation of human mesenchymal stem cells†
Yauheni U. Kuvyrkou‡
 ab,
Nadzeya Brezhneva‡c,
Ekaterina V. Skorb‡d and
Sviatlana A. Ulasevich‡*d
ab,
Nadzeya Brezhneva‡c,
Ekaterina V. Skorb‡d and
Sviatlana A. Ulasevich‡*d
aRepublican Scientific and Practical Center of Transfusiology and Medical Biotechnologies, Dolginovskiy tract 160, 220053 Minsk, Belarus
bBelarusian State Technological University, Sverdlova str. 13a, 220006 Minsk, Belarus
cChemistry Department, Belarusian State University, Leningradskaya str. 14, 220030 Minsk, Belarus
dITMO University, Lomonosova str. 9, 191002 St. Petersburg, Russia. E-mail: saulasevich@itmo.ru
First published on 20th January 2021
Abstract
Herein, the proliferation and osteogenic potential of human mesenchymal stem cells (hMSCs) on the disordered and ordered porous morphology of the titania surface and titania surface modified by hydroxyapatite (HA) are compared for the first time. In 5 days, the MTT-assay showed that the ordered porous morphology of electrochemically fabricated titania nanotubes (TNT) and TNT with chemically deposited hydroxyapatite (TNT–HA) was favorable for stem cell proliferation. In 14 days, RT-qPCR demonstrated that the disordered porous morphology of the sonochemically produced titania mesoporous surface (TMS) and TMS modified by the chemical deposition of HA (TMS–HA) led to the differentiation of hMSCs into the osteogenic direction in the absence of osteogenic inductors. These results originate from the mechanism of mechanotransduction, which sheds a light on the interaction of mesenchymal stem cells with the porous interface through focal adhesion, regulating the expression of genes determining stem cell self-renewal and osteogenic differentiation. The strong focal adhesion of hMSCs adjusted by the disordered TMS and TMS–HA is enough to induce osteogenic differentiation with the delay of cellular self-renewal. The weak focal adhesion of hMSCs tuned by the ordered TNT and TNT–HA affects only cellular self-renewal. The present research makes a new contribution to nanomedicine and engineering of porous implant interfaces for the replacement of bone injuries.
1. Introduction
Bone implantation is one of the most important medical interventions after blood transfusion.1 The ageing population of many countries suffering from diseases such as osteoporosis is increasing.2 Hence, there is a growing need for the design of biomaterials for lab-produced stem cells and implants for clinics.3–6 One of the problems in orthopaedics is that human mesenchymal stem cells (hMSCs) can respond to an implant surface, typically made from titanium and its alloys, with the formation of soft tissue instead of bone tissue. This can lead to the fracture of bones under mechanical stress due to the movement of the bone-related implant. Low-quality regeneration is caused especially by fibrous tissue generation.7It is important to mention that hMSC-based regenerative strategies depend on cell expansion in vitro and the subsequent transplantation of a high number of cells to repair injured tissue in vivo. However, a basic limitation is the loss of functionality or death of transplanted cells due to the fibrous microenvironment in the injured tissue and lack of cellular integration.7–9
Accordingly, numerous techniques have been developed to enhance the surface compatibility of implants with bone. At present, grit blasting followed by acid etching is commonly used to prepare the surface of implants before their insertion into patients.10,11 The properties of the material surface, in particular, its chemistry,11–13 stiffness,14 and nanoscale topography,10,14–16 provide a toolbox to control the fate of cells, ranging from apoptosis to proliferation and differentiation.17–20
In our previous work,20 we showed that the proliferation of hMSCs is higher on disordered titania mesoporous surface (TMS) compared to a smooth polished titania surface after 5 days of incubation. Moreover, TMS can stimulate the differentiation of hMSCs into bone cells without the addition of an osteogenic medium. However, it is unclear how highly-ordered titania nanotubes (TNT) cause the proliferation and osteogenic differentiation of hMSCs. Besides, there is contradictory data about the influence of hydroxyapatite (HA), an inorganic analog of bone tissue, on cell proliferation. HA is a very attractive material used in bone repair because of its appropriate physicochemical properties and chemical characteristics. The presence of a thin calcium phosphate layer is proven to enhance biocompatibility and osteoconductivity.19,21–24 However, although HA has been found to improve the surface biocompatibility, the synergistic effect of substrate surface morphology and the presence of HA is still controversial.
Thus, the aim of our research is to compare the proliferation and osteogenic potential of hMSCs on the ordered and disordered titania morphology and hydroxyapatite surfaces with different morphologies and contents. We modified the disordered TMS and highly-ordered TNT by HA to regulate the proliferation and osteogenic differentiation of hMSCs. We chose the chemical deposition of HA because this method allowed us to synthesize HA particles in the pores of the titania matrix while retaining its morphology. Moreover, the TNT and TMS matrices regulated the size of the HA particles. The size of fabricated particles was in the range of 50–100 nm because this size has been found to be effective in stimulating the osteogenic differentiation of hMSCs.23,24
2. Experimental
2.1. Nanostructuring of titanium surface
Titanium (99.62%) was preliminarily polished in an HF![[thin space (1/6-em)]](https://www.rsc.org/images/entities/char_2009.gif) :HNO3 mixture with a volume ratio of 1:2. The TMS coatings were fabricated using a UIP1000hd ultrasonic processor (Hielscher Ultrasonics, Germany). The electrolyte was 5 M NaOH solution. The operating frequency was 20 kHz and the maximum output power was 220 W. The BS2d22 sonotrode was made from titanium. The sonication process was carried out in a plastic sonication cell at a constant temperature of around 333 K controlled by a temperature sensor immersed in the electrolyte. The sonication parameters were chosen according to the preliminary results showing the best modification of the titania surface. Before the cellular experiments, all the samples were rinsed with Milli-Q water (18 MΩ cm) and annealed at 450 °C for 3 h.
:HNO3 mixture with a volume ratio of 1:2. The TMS coatings were fabricated using a UIP1000hd ultrasonic processor (Hielscher Ultrasonics, Germany). The electrolyte was 5 M NaOH solution. The operating frequency was 20 kHz and the maximum output power was 220 W. The BS2d22 sonotrode was made from titanium. The sonication process was carried out in a plastic sonication cell at a constant temperature of around 333 K controlled by a temperature sensor immersed in the electrolyte. The sonication parameters were chosen according to the preliminary results showing the best modification of the titania surface. Before the cellular experiments, all the samples were rinsed with Milli-Q water (18 MΩ cm) and annealed at 450 °C for 3 h.
To prepare the TNT surface, titanium (99.62%) was anodized in two stages. In the first stage, the titanium was polarized from 0 to 40 V at a scan rate of 0.2 V s−1. In the second stage, the anodizing was conducted at a constant voltage of 40 V for 1 h. The electrolyte was composed of ethylene glycol, 0.75 wt% NH4F and 2 vol% H2O. After the anodizing, the electrodes were rinsed in water and dried. Then, the as-anodized samples were ultrasonically cleaned in Milli-Q water for 30 s to remove surface debris on the TNT surface. The TNT layers were annealed at 450 °C for 3 h in air.
2.2. Deposition of hydroxyapatite in TiO2 pores
The HA nanoparticles were deposited using successive ionic layer adsorption and reaction (SILAR) at room temperature. TMS and TNT were vertically dipped in a saturated Ca(OH)2 aqueous solution for 1 min, rinsed with distilled water, then dipped for 1 min in a 0.02 M (NH4)2HPO4 aqueous solution and rinsed again with distilled water. This cycle was repeated 10–20 times. Then the samples were rinsed in water and dried.2.3. Surface characterization
XRD spectra were recorded on a Bruker D8 Advance diffractometer with the CuKα radiation. All samples were examined in the 2θ range of 10° to 70° at a scanning speed of 1° min−1 and step size of 0.03°.SEM characterization of the samples was performed using a LEO-1420 scanning electron microscope at an operating voltage of 3 kV. Carbon was sputtered under vacuum. Energy-dispersive X-ray spectroscopy (EDS) was conducted using a Hitachi SU-70 microscope coupled with a Bruker EDS detector at an operating voltage of 15 kV.
The infrared (IR) spectra of the samples were recorded using an IR-spectrophotometer VERTEX 70 (Bruker, Germany). The spectra were measured in the range of 400–4000 cm−1. The number of the scans was 32.
The coating composition profile across the formed layer was analyzed by glow discharge optical emission spectroscopy (GDOES) using a HORIBA GD-Profiler 2 (HORIBA, Ltd., Japan).
In GDOES, the samples act as one of the electrodes of the plasma and are supposed to close the plasma chamber. The samples were mounted with copper tape to cover the anode. The anode diameter was 4 mm. The analysis was performed in a nitrogen atmosphere at a pressure of 650 Pa and constant power of 30 W. The depth profile was made via a continuous sputtering process through the sample at a rate of 3 μm. The depth and layer thickness were calculated using a profilometer to accurately provide the mandatory depth information.
2.4. Cell culture
Human bone marrow-derived mesenchymal stem cells (hMSCs) were provided by the stem cell bank at the Republican Scientific and Practical Center of Transfusiology and Medical Biotechnologies (Belarus). The stem cell bank had been established with the informed consent of haematologically healthy donors. All human cellular materials were obtained in accordance with relevant guidelines and appropriate consent. For the proliferation analysis, the hMSCs were cultivated in basal media (10% human AB group serum/α-MEM). For the osteogenic differentiation analysis, one set of hMSCs was put in 2% human AB group serum/DMEM medium containing 100 nM dexamethasone and 50 μg cm−3 L-ascorbic acid, and another set of cells was induced in similar medium without the osteogenic factors. The media were changed every 2–3 days. All the cells of 3–4 passages were seeded on the sample surfaces at 13000 cells per cm3 and were cultured at 37 °C, 95% humidity, and 5% CO2.
2.5. MTT assay
After 5 days of culture, the hMSCs were rinsed with Dulbecco's phosphate-buffered saline (DPBS) and 5 mg cm−3 MTT solution was added to DMEM at a volume ratio of 1:10. The cells were incubated at 37 °C, 95% humidity, and 5% CO2 for 3 h. After removal of the supernatant, DMSO was added to dissolve the dark-blue formazan. The absorbance was measured at 570 nm using a Cary 60 spectrophotometer (Agilent Technologies, USA). The extinction was represented as mean ± 95% confidence interval (n = 4 for each group) for plotting the graphs. Statistical analysis was performed using the GraphPad software.
2.6. Cell staining
After 5 days of culture, hMSCs were rinsed with DPBS, and pre-heated Cell Tracker Green dye/DMEM (1:1000) was added to stain the cytoplasm of the living cells. The cells were incubated under a humid atmosphere (37 °C, 95% humidity) with 5% CO2 for 30 min. The stained cells were rinsed with DPBS and DMEM was added. The stained cells were imaged via confocal laser scanning microscopy. The cellular nuclei were not stained due to the faster diffusion of the nuclear dye from the cellular nucleus during the cultivation of the cells.
For microscopy and imaging, immunofluorescent staining of the focal adhesion contacts was performed. The cells fixed by 4% paraformaldehyde in PBS were quenched for 5 min in 50 mM ammonium chloride and permeabilized with a buffered Triton-X-100 solution for 10 min. The samples with cells were washed in PBS and blocked in 3% BSA in PBS for 1 h. Then the cells were incubated overnight with an anti-vinculin antibody (Sigma V9131) at a ratio of 1:300 in PBS/BSA at 4 °C. After washing with PBS, the cells were incubated with Alexa-Fluor 488 labelled secondary goat anti-mouse antibody (Life Technologies, A-11001) at a ratio of 1:300 for 1 h. After washing, the cells were stained for 20 min with phalloidin Alexa Fluor 594 (Life Technologies, A12381) at a ratio of 1:100. The confocal images clearly showing focal adhesions were selected for analysis. RGB colour images were converted into eight-bit black and white images using the image colour RGB split function so that focal adhesion appeared as black pixels.
2.7. Reverse transcription quantitative polymerase chain reaction (RT-qPCR) analysis
The osteogenic differentiation of hMSCs was analyzed via in real-time reverse transcription-quantitative polymerase chain reaction (RT-qPCR). The expression of the osteocalcin gene, a specific marker for the osteogenic differentiation of stem cells, and the alkaline phosphatase gene was determined by RT-qPCR.After 14 days of culture, the cells were lysed, and total RNA was isolated by TRI-reagent. The RNA samples were treated with DNAse and reverse-transcribed using RevertAid Reverse Transcriptase according to the program: 25 °C for 10 min, 50 °C for 30 min, and 85 °C for 5 min. RT-qPCR allowed the gene expression to be compared quantitatively. RT-qPCR was carried out using a thermocycler for analysing the expression of runt-related transcription factor 2 (RUNX2), C-MYC, alkaline phosphatase (ALP), collagen type I (COLI), osteocalcin (OCN), osteopontin (OSP), protein tyrosine kinase 2 (PTK2), extracellular signal-regulated kinase 1/2 (ERK1/2), cell-cycle-related transcription factor (E2F1), retinoblastoma-associated protein (RB), cyclin-dependent kinase 6 (CDK6), cyclin D1, and glyceraldehyde 3-phosphate dehydrogenase (GAPDH) genes. The primer sequences and amplicon sizes produced by PrimeTech (Belarus) for these genes were as follows: ALP forward primer 5′-ACAACTACCAGGCGCAGTCT-3′, ALP reverse primer 5′-CAGAACAGGACGCTCAGG-3′, 260 bp; COLI forward primer 5′-TGCTCGTGGAAATGATGGTG-3′, COLI reverse primer 5′-CTTCACCCTTAGCACCAACAG-3′, 104 bp; OSC forward primer 5′-GCCCTCACACTCCTCGCC-3′, OSC reverse primer 5′-CTACCTCGCTGCCCTCCTG-3′, 130 bp; OSP forward primer 5′-ACAGCCGTGGGAAGGACAGT-3′, OSP reverse primer 5′-GACTGCTTGTGGCTGTGGGT-3′, 76 bp; RUNX2 forward primer 5′-CAGACCAGCAGCACTCCATA-3′, RUNX2 reverse primer CAGCGTCAACACCATCATTC-3′, 178 bp; C-MYC forward primer 5′-TTTCTACTGCGACGAGGAGG-3′, C-MYC reverse primer 5′-GGCAGCAGCTCGAATTTCTT-3′, 105 bp; PTK2 forward primer 5′-GTCTGCCTTCGCTTCACG-3′, PTK2 reverse primer 5′-GCCGAGATCATGCCACTC-3′, 92 bp; ERK1 forward primer 5′-CCCTAGCCCAGACAGACATC-3′, ERK1 reverse primer 5′-GCACAGTGTCCATTTTCTAACAGT-3′, 94 bp; ERK2 forward primer 5′-TCTGCACCGTGACCTCAA-3′, ERK2 reverse primer 5′-GCCAGGCCAAAGTCACAG-3′, 78 bp; E2F1 forward primer 5′-CACTTTCGGCCCTTTTGCTC-3′, E2F1 reverse primer 5′-GATTCCCCAGGCTCACCAAA-3′, 212 bp; RB forward primer 5′-TTTGTAACGGGAGTCGGGAG-3′, RB reverse primer 5′-ATCGAACTGCTGGGTTGTGT-3′, 648 bp; CDK6 forward primer 5′-CGGAGAGAGTGCTGGTAACTC-3′, CDK6 reverse primer 5′-CCTCGAAGCGAAGTCCTCAA-3′, 204 bp; cyclin D1 forward primer 5′-ACACGGACTACAGGGGAGTTT-3′, cyclin D1 reverse primer 5′-GGAAGCGGTCCAGGTAGTTC-3′, 473 bp; GAPDH forward primer 5′-TCAAGGCTGAGAACGGGAA-3′, and GAPDH reverse primer 5′-TGGGTGGCAGTGATGGCA-3′, 376 bp. GAPDH served as a house-keeping gene, and the expression of the genes of interest was normalized to GAPDH expression. For the quantification of gene expression, the 2−ΔΔCT-method was used.25 The relative transcript level was represented as mean ± 95% confidence interval (n = 3 for each group) to plot the graphs. Statistical analysis was carried out using the GraphPad software.
3. Results and discussion
We investigated the influence of the disordered and ordered titania morphology of implant interfaces to determine the proliferation and osteogenic differentiation preferences of hMSCs. We are interested in: (i) a fundamental model related to the mechanisms of stem cell behaviour in response to the nanoscale features of materials (for the cell biology area) and (ii) an applied model based on the use of nanostructured implant interfaces in nanomedicine. Four types of nanostructured surfaces were fabricated (Fig. 1). Fig. 1a shows the scanning electron microscopy (SEM) image of the polished titanium surface. According to the atomic force microscopy (AFM) data, the roughness of the coating did not exceed 1.2 nm, and thus after thermal treatment, these substrates were used as a control with a smooth topography. TMS (Fig. 1b) was obtained via sonochemical treatment, as described earlier.20–27 The SEM image shows the disordered sponge-like morphology of TMS, where its pores are not ordered and have different pore diameters. The TEM image (Fig. 1b, inset) shows the porous structure. The highly-ordered surface composed of vertical nanotubes formed by the anodization of the polished titanium is shown in Fig. 1c. The mean pore diameter is ca. 60 nm.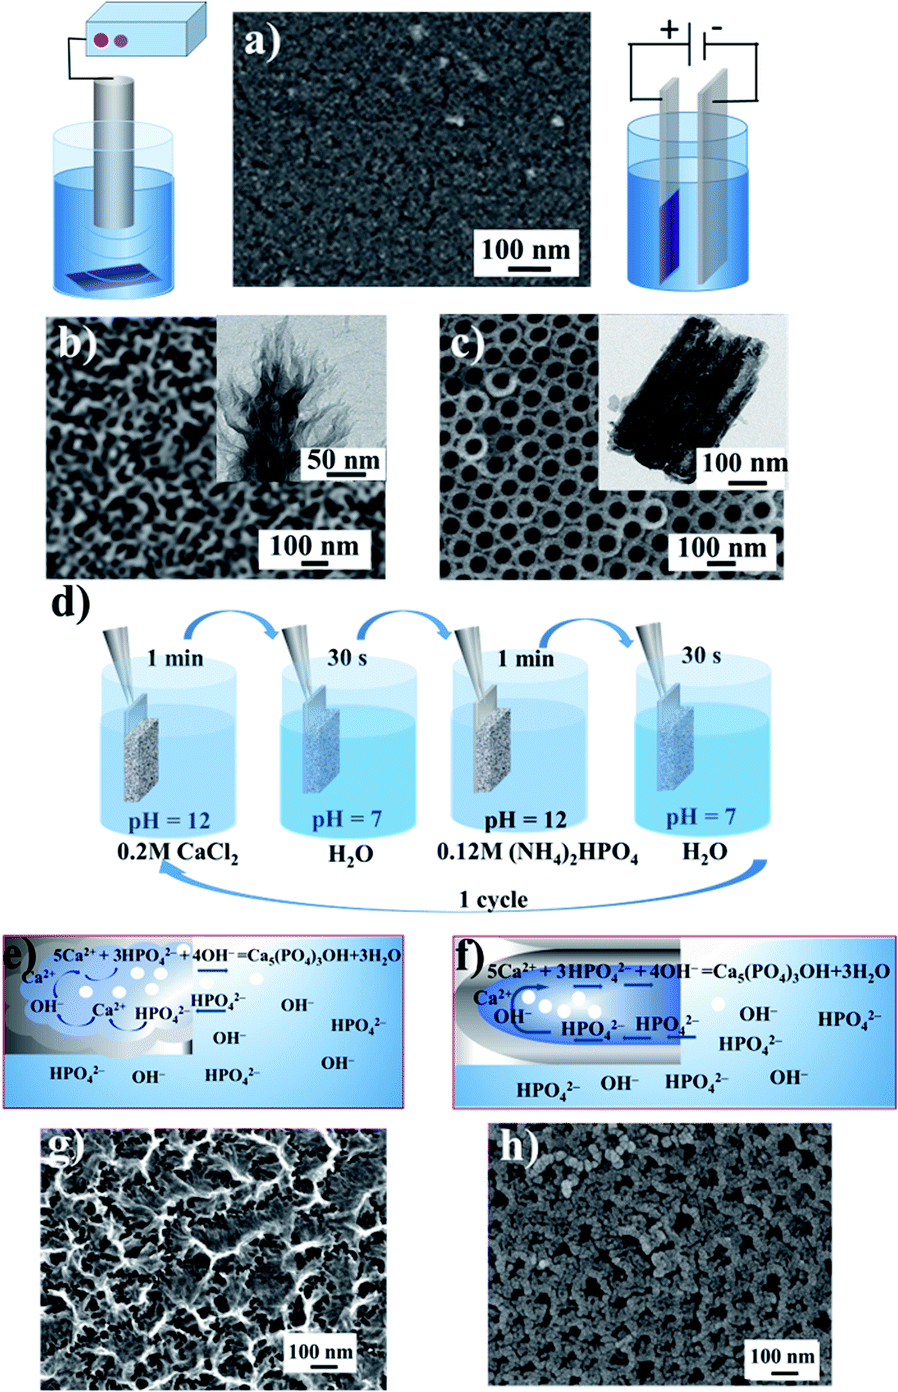 | ||
| Fig. 1 Morphology of the pristine titanium surface (a), sonochemically fabricated titania mesoporous surface (TMS) top-view and cross-section (b), and top-view and cross-section of titania nanotubes (TNT) obtained by electrochemical oxidation (c). Insets show the schemes of the surface nanostructuring. Scheme showing the deposition of hydroxyapatite (HA) into the pores of the titania matrix (d–f). SEM images of the TMS and TNT surfaces with chemically deposited HA: TMS–HA (g) and TNT–HA (h), respectively. | ||
The HA nanoparticles were deposited via successive ion layer adsorption and reaction (SILAR) at room temperature (Fig. 1d). The sample was vertically dipped in a saturated Ca(OH)2 aqueous solution for 1 min, rinsed with distilled water, and then dipped for 1 min in a 0.02 M (NH4)2HPO4 aqueous solution and rinsed again with distilled water. This cycle was repeated 1–20 times. The reagent solutions diffused into the titania pores. Inside the titania matrix, the Ca2+ ions reacted with the PO43− ions in the presence of OH−, producing hydroxyapatite (HA), Ca5(PO4)3OH, as schematically shown in Fig. 1e and f. As a result of the deposition in the pores, the size of the formed particles was limited by the pore diameter of titania and was not greater than 80–100 nm. The particles grew until the pores were filled. In the SEM image of TMS–HA, the precipitated HA looks quite blurry. However, the modified surface maintained the initial sponge-like morphology (Fig. 1j). Fig. 1g shows the HA particles deposited in the TNT pores. According to the SEM images, the mean size of the HA particles in the pores of the TNT is 20–25 nm. The presence of HA was proven by XRD and IR spectroscopy. Fig. 2a presents the X-ray diffraction (XRD) pattern of the TMS coating. The peak of titanium is well distinguished at the 2θ value of 38.7°, while the peaks of anatase and rutile in the 2θ range of 20–30° merged, which may be due to the low crystallinity of the sample.26–28 In the case of TMS, the HA peaks were not detectable in its X-ray diffraction pattern, which may be due to the small amount of HA or its amorphous structure.27–29 The presence of HA was confirmed by IR spectroscopy. The pristine TMS sample was used as the background (Fig. 2c, curve 1). Additional peaks appeared at 3650 cm−1 and 1091 cm−1 in the spectrum of TMS–HA (Fig. 2c, curve 2). Compared to the HA standard (Fig. 2c, curve 3), these bands correspond to the hydroxyl and PO43− groups, irespectively.30 The depth profile analysis of the TMS–HA and TNT–HA coatings confirmed the presence of Ca and P elements in the titania matrix (Fig. 2e, f and ESI, Fig. S1†), respectively. Fig. 2b shows a top-view of the titania nanotubes with the HA particles deposited inside their pores. The XRD data, as shown in Fig. 2d, proves that the as-prepared TNT layer is amorphous, but after annealing at 450 °C, the anatase phase appeared. The rutile phase appeared after heating at a temperature higher than 550 °C. After SILAR treatment of the samples in calcium- and phosphate-containing solutions, additional particles appeared on the top and inside of TNT (Fig. 2d). Thus, the XRD patterns further confirm the deposition of HA nanocrystals (Fig. 2d, inset). It should be noted that an increase in the number of SILAR cycles from 10 to 20 led to a proportional increase in the content of HA in TNT.
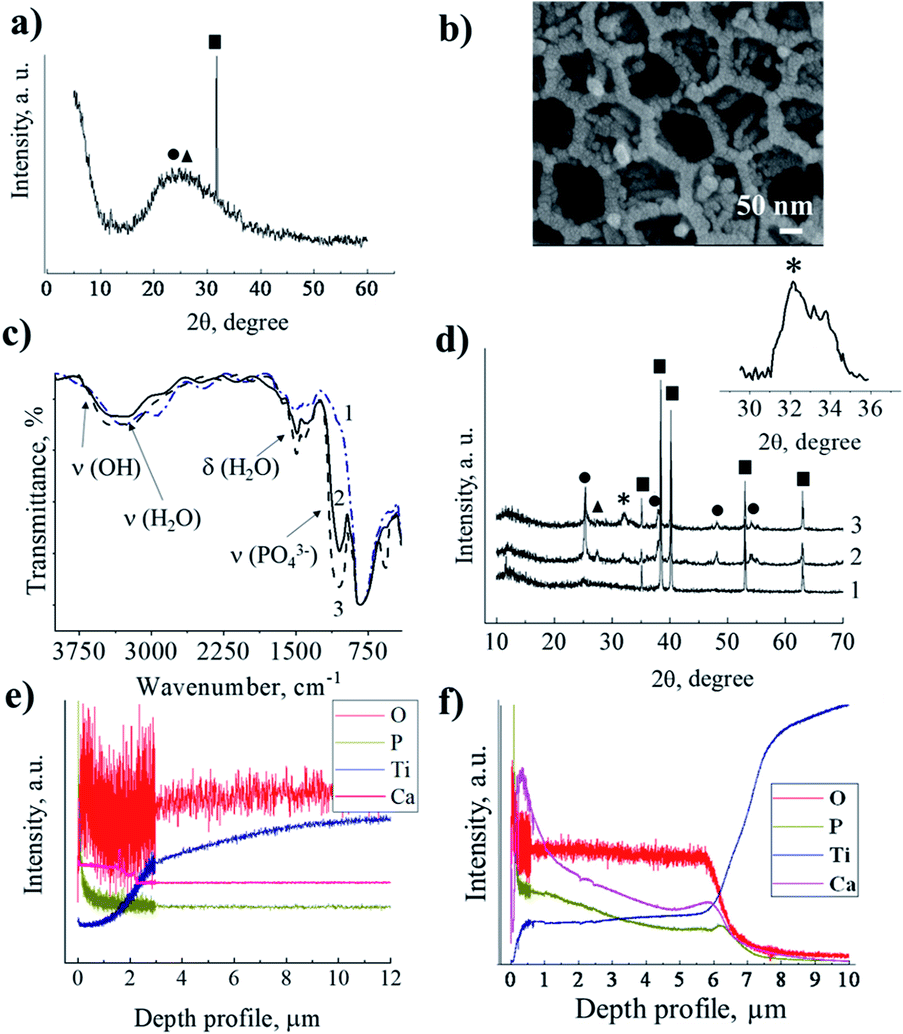 | ||
| Fig. 2 X-ray diffraction patterns (a and d) and IR spectra (c) of the TMS coating without treatment (1) and after chemical deposition of HA (2) compared with pristine HA (3). SEM image of titania nanotubes with HA deposited inside (b). X-ray diffraction patterns of TNT layers without (d) and with chemically deposited HA (d) before (1) and after (2 and 3) annealing at 450 °C for 3 h; 2–10 SILAR cycles and 3–20 SILAR cycles. The inset shows an enlarged part of the XRD pattern in the range of the HA peaks. Abbreviations: ■ – titanium, ● – anatase, ▲ – rutile, * – hydroxyapatite. Depth profile analysis of the TMS–HA (e) and TNT–HA (f) coatings. GDOES depth profiles of the TMS–HA (e) and TNT–HA (f) samples. | ||
The HA particles serve as a reservoir of phosphate and calcium ions for the faster assembling of new bone tissue by osteoblast enzymes produced in vivo. After the deposition of HA, the sample surface retained its pristine morphology, which is fully outlined in our previous papers.20,26,28
We first addressed the comparison of hMSC proliferation and osteogenic differentiation on the disordered porous morphology of TMS and TMS–HA and highly-ordered porous morphology of TNT and TNT–HA in the absence of osteogenic milieu. In general, differentiation is a process of turning undifferentiated cells into specialized cells of tissue or blood. It is a difficult multistage process. In the various stages of differentiation, cells are characterized by various markers. Osteocalcin (OSC) is a specific marker for the osteogenic differentiation of stem cells. Osteocalcin, which is produced by osteoblasts, is only present in bone tissue and dentine.31–33 Cells do not produce inorganic substances. Indirectly, alkaline phosphatase can be used as evidence of extracellular mineralization. Alkaline phosphatase hydrolyzes the phosphate esters and plays a central role in skeletal mineralization.34–41 Herein, we demonstrated the expression of the osteocalcin gene and alkaline phosphatase gene by RT-qPCR to prove the osteogenic differentiation of stem cells. The stem cell proliferation and osteogenic differentiation tests were performed independently. hMSCs are most demanded in human bone regeneration because of the following main advantages: (i) high proliferation, which allows in vitro expansion of high-cellular transplants consisting of non-differentiated mesenchymal stem cells; (ii) multipotency (at least, osteo-, chondro-, and adipogenic differentiation); (iii) non-immunogenicity, which enables autologous allogeneic transplantation into patients; and (iv) immune suppression, which can prevent biomaterial rejection in the human body.31–33 For the investigation of osteogenic differentiation, we induced hMSCs in Dulbecco's Modified Eagle Medium (DMEM) with 2% human AB group serum (for maintaining cellular viability) without osteogenic factors for 14 days. We used smooth titanium as a negative control and smooth titanium with the osteogenic medium consisting of dexamethasone and L-ascorbic acid as a positive control. Alkaline phosphatase (ALP) hydrolyzes phosphate esters and plays a central role in skeletal mineralization.35 Osteocalcin is systematically utilized as a marker for the advent of osteogenic commitment since it is manifested by osteoblasts after proliferation.34
It is a unique marker for the osteogenic differentiation of stem cells. Herein, we demonstrated the expression of the osteocalcin gene and alkaline phosphatase gene by RT-qPCR to prove the osteogenic differentiation of hMSCs. It should be mentioned that the mRNA transcript levels expressed by the cellular cultures on TNT, TNT–HA, and TMS, TMS–HA correlate with that by the cellular cultures on the negative and positive control, respectively. The mRNA transcription events occur in living cells. Consequently, the cells generally maintained their viability on TNT, TNT–HA, TMS, and TMS–HA. In 14 days, we observed that the hMSCs cultured in the medium without the osteogenic supplements underwent osteogenic differentiation on TMS and TMS–HA compared to TNT and TNT–HA. Expression of the critical osteoblast genes was not induced by TNT and TNT–HA (Fig. 3 and ESI Fig. S2–S8†).
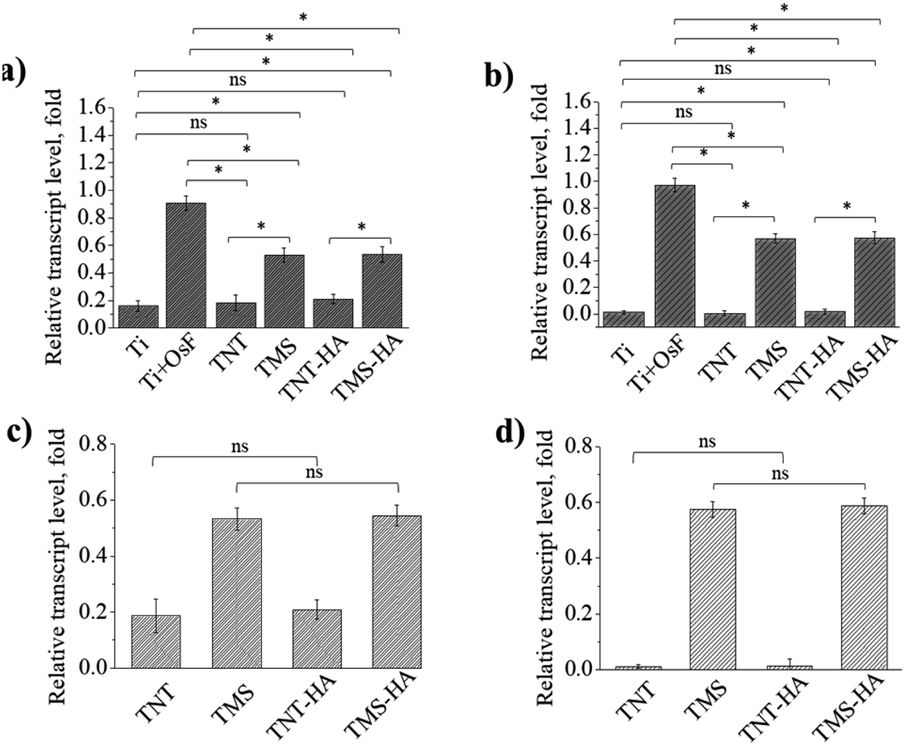 | ||
| Fig. 3 Expression of critical osteoblast genes by mesenchymal stem cells on TNT, TMS, TNT–HA, TMS–HA and controls after 14 days of incubation. Alkaline phosphatase measured by RT-qPCR left side (a and c), osteocalcin measured by RT-qPCR right side (b and d). ns no significance (p ≥ 0.05), *significance (p < 0.05), n = 3. Abbreviations: Ti – polished titanium surface in medium without osteogenic factors; Ti + OsF (osteofactors) – polished titanium surface in osteogenic media; TNT, TMS, TNT–HA and TMS–HA were used in media without osteogenic factors. | ||
It is interesting that the relative transcript level of osteocalcin and alkaline phosphatase inside the cells on the samples with HA and samples without HA was the same. The same tendency was also observed for the TMS–HA and TMS samples. Thus, it can be concluded that nanoscale HA chemically deposited on TNT and TMS does not stimulate the differentiation of hMSCs in the osteogenic direction.
Alkaline phosphatase hydrolyzes the phosphate esters and plays a central role in skeletal mineralization.35–41
Here, we demonstrate the expression of these genes by RT-qPCR to prove the osteogenic differentiation of hMSCs (ESI, Fig. S2†). Previously, we showed that alkali treatment does not influence the osteogenic differentiation of hMSCs on TMS.20 The osteogenic differentiation of hMSCs induced by the morphology of TMS and TMS–HA was less effective compared to the cells induced by the osteogenic growth factors. However, it should be mentioned that the differentiation of the stem cells without the inductors is not usual and this effect of the surface is very interesting.
Fig. 3 details the quantification of the critical osteoblast markers, which are alkaline phosphatase and osteocalcin, osteopontin, and collagen type I, by RT-qPCR. In 14 days of incubation, there was a significant difference in gene expression on TMS and TMS–HA compared to TNT, TNT–HA, and Ti, or both Ti with the osteogenic factors (OsF).
For the proliferation evaluation, we incubated the hMSCs in α-MEM with 10% human AB group serum for 5 days. The smooth surface of polished titanium (Ti) was used as a control. The important point is 24 h, which is sufficient for stem cell adhesion to a substrate. In 5 days, the MTT-assay showed the growth of the hMSC population on all the interfaces. Meanwhile, the population of the stem cells cultivated on the nanostructured surfaces (TNT, TMS, TNT–HA, and TMS–HA) was bigger than on the smooth Ti. The influence of the implant surface morphology on stem cell population growth is shown in Fig. 4a and b (ESI, Fig. S3†).
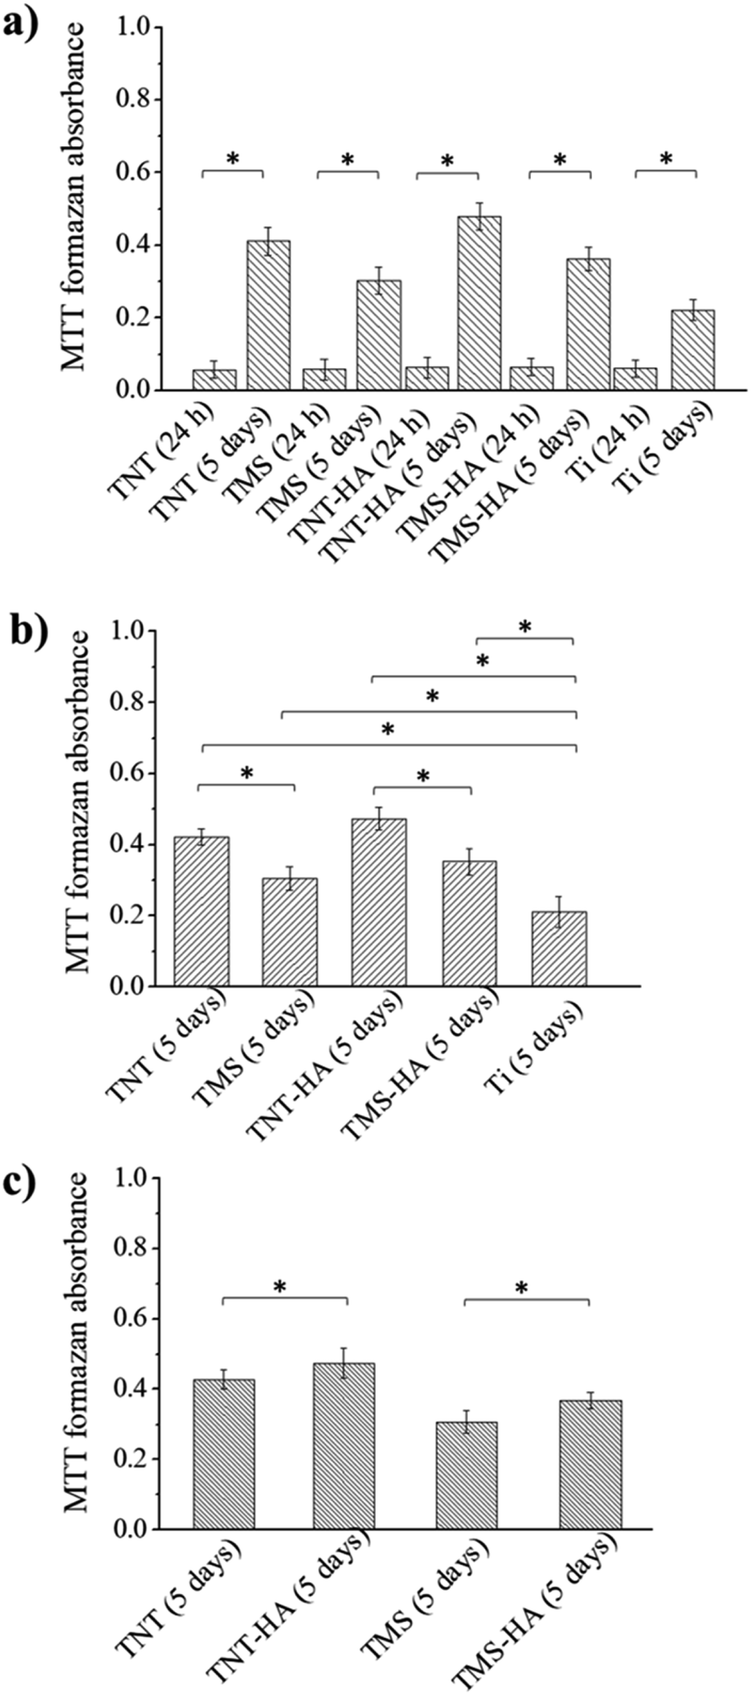 | ||
| Fig. 4 Influence of substrate morphology (a), and nanoscale hydroxyapatite (b and c) on the absorbance of formazan formed by hMSCs on TNT, TNT–HA, TMS, TMS–HA and Ti after 24 h and 5 days of incubation. *significance (p < 0.05), n = 4. Abbreviations: Ti – polished titanium surface; TNT – ordered titania nanotubes; TNT–HA – ordered titania nanotubes with hydroxyapatite; TMS – disordered titania mesoporous surface; and TMS–HA – disordered titania mesoporous surface with HA. | ||
There was no difference in the MTT-assay absorbance after 24 h of cultivation. However, in 5 days, the hMSCs cultured on TNT and TNT–HA grew faster than on TMS and TMS–HA, respectively. Although the MTT-assay absorbance looked almost at the same level, there is a statistically significant difference between TMS–HA and TNT–HA compared to TMS and TNT, respectively (Fig. 4 and ESI Fig. S3†). We can consider that nanoscale HA chemically deposited on the nanostructured surfaces slightly facilitates the growth of hMSC culture in 5 days of incubation.
To visualize the living hMSCs on the porous implant interfaces, confocal laser scanning microscopy was used after live cell staining with a fluorescent vital dye. Fig. 5 displays the phenotype characteristic indications of hMSCs on the porous implant interfaces. The confocal laser scanning microscopy images illustrate that the cells attached to the porous implant surface have a spindle-like shape of the cytoskeleton, which is typical for mesenchymal stem cells. The living hMSCs were observed with the vital dye, which stains cellular cytoplasm green. There was a visible process of cellular division on the porous implant surfaces. The confocal laser scanning microscopy results indicate the self-renewal of hMSCs on TNT, TMS, TNT–HA, and TMS–HA, which is consistent with the stem cell culture growth from the MTT assay data (Fig. 4a).
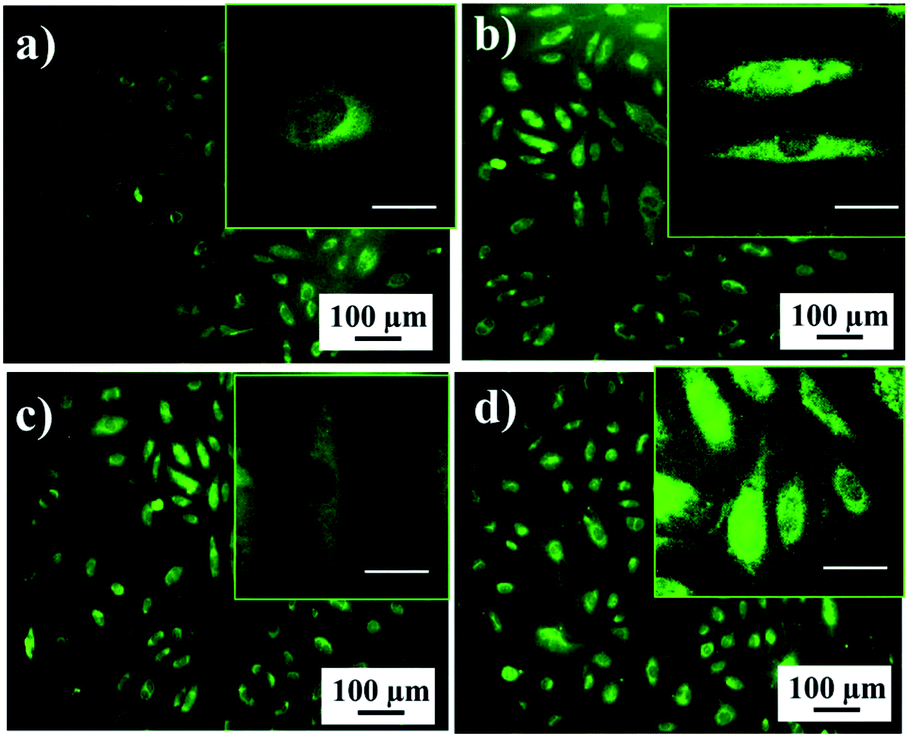 | ||
| Fig. 5 Live staining of the hMSCs on TMS (a), TNT (b), TMS–HA (c), and TNT–HA (d) after 5 days of incubation. The insets show the cell shape and morphology. The scale bar of the inset is 10 μm. Cytoplasm – green and nucleus – black. | ||
Although the amount of HA in the TNT pores was ca. 30 wt%, the proliferation and osteogenic differentiation of the hMSCs on TNT–HA did not significantly increase compared to TNT. The mass content of HA in the TNT film was calculated as the ratio of the mass of HA to the mass of TNT coating. The mass of HA was determined as follows. Previously, the Ca/P ratio was checked by EDS analysis, which is ca. 1.6. Then, the samples were immersed in a hydrochloric acid solution with a pH of 4.0 to dissolve the calcium phosphate. Neither titanium nor titanium dioxide dissolves in hydrochloric acid solution, unlike hydroxyapatite. The sample was kept in a solution of hydrochloric acid until a constant weight was achieved due to the complete dissolution of hydroxyapatite. Then an analytical solution containing Ca2+ was prepared and titrated to determine the proper concentration of Ca2+ (the accuracy of the method was determined by the accuracy of the microburette and determined up to 10 μmol L−1). The theoretical mass of hydroxyapatite based on its formula Ca10(PO4)6(OH)2 was calculated using the determined concentration of calcium cations. After dissolving HA, we removed the coating of titanium dioxide nanotubes using ultrasound treatment. The sample was sonicated to a constant weight. Then the ratio of the resulting masses was calculated. The same procedure was performed for TMS–HA. Thus, it can be concluded that the surface morphology of implants influences the proliferation and osteogenic differentiation hMSCs more than hydroxyapatite nanoparticles. This is also proven by the fact that the deposition of HA did not change the initial morphology of the sample. We highlight that the highly ordered surface morphology (TNT and TNT–HA) is preferable for proliferation, whereas a disordered morphology (TMS and HA–TMS) is better for the osteogenic differentiation of hMSCs.
We monitored the C-MYC expression to study the process of proliferation (ESI, Fig. S4†). The up-regulation of C-MYC enhances cellular self-renewal and proliferation, inhibits cellular differentiation, and contracts the focal adhesion of cells. On the contrary, the down-regulation of C-MYC leads to the inhibition of cellular self-renewal and proliferation, the stimulation of cellular differentiation, and the enlargement of focal adhesion of cells.42,43 On 3 day, Fig. S4† shows the increase of C-MYC expression inside the hMSCs cultured on the disordered TMS and TMS–HA compared to hMSCs grown on the smooth Ti. Based on the data, the proliferation of hMSCs on the disordered TMS and TMS–HA can be stimulated for 5 days, and then it can be inhibited. On the ordered TNT and TNT–HA, a sustained increase in the C-MYC expression inside the hMSCs was observed in 5 days. These dynamics of C-MYC gene expression indicate the proliferation of hMSCs on the ordered TNT and TNT–HA by the 5th day.
RUNX2 is another principal transcription factor for the osteogenic differentiation of stem cells. RUNX2 plays a regulatory role in passage from self-renewal to the osteogenic differentiation of stem cells.44–47 The same transcript level of RUNX2 inside hMSCs on the ordered TNT and TNT–HA and polished smooth Ti shows the absence of stem cell differentiation in the osteogenic direction (ESI, Fig. S5†). Compared to the smooth Ti, the gene expression of RUNX2 inside hMSCs on the disordered TMS and TMS–HA changed in a wave manner from 1 to 14 days. There was a significant increase in RUNX-2 on the 5th and 7th days. Thus, on the 5th day there was a decrease in C-MYC gene expression accompanied by an increase in RUNX2 in the cells cultivated on the disordered TMS and TMS–HA. Consequently, the osteogenic differentiation of hMSCs was triggered. The transitional point between the proliferation and osteogenic differentiation of hMSCs is 5th day. However, the upregulation of RUNX-2 was not stable and gradually declined to the transcript level, which is inside hMSCs on the smooth Ti. The alteration of RUNX2 gene expression in a temporally wave manner indicates that the impact of RUNX2 on the osteogenic transcription regulation depends on the stage of stem cell differentiation in the osteogenic direction. The upregulation of RUNX2 at the early stage of osteogenic differentiation is related to the increase in the expression of bone-tissue genes, in particular osteocalcin, alkaline phosphatase, osteopontin, and collagen I type, inside the hMSCs on the disordered TMS and TMS–HA at day 14 (ESI, Fig. S2†). On the other hand, the down-regulation of RUNX2 is consistent with the absence of bone-tissue gene induction inside the hMSCs on the ordered TNT and TNT–HA on the 14th day (ESI, Fig. S2†).
The MTT assay data (Fig. 4 and ESI Fig. S3†) corresponds to the C-MYC gene (ESI, Fig. S4†) and RUNX2 (ESI, Fig. S5†) analysis. Based on these results, we can conclude that the proliferation of hMSCs is higher on the ordered TNT and TNT–HA than on the disordered TMS and TMS–HA. This can be explained by the different cell behaviours on these samples. For example, the hMSCs only proliferated on the ordered TNT and TNT–HA. In contrast, the hMSCs on the disordered TMS and TMS–HA not only proliferated until the 5th day, but also differentiated in the osteogenic direction after 5 days. The observed increase in C-MYC gene expression inside the hMSCs on all the mesoporous interfaces (ESI, Fig. S4†) corresponds with the hMSC division process.
Our results shed some light on the focal adhesion interaction between mesenchymal stem cells and the ordered and disordered porous implant interfaces of titania and HA-modified titanium dioxide and its role in stem cell proliferation and osteogenic differentiation.
According to the literature analysis,15–18,34–48 we can assume that the mechanism of mechanotransduction for our type of coatings proceeds as follows (Fig. 6a and b). Fig. 6a and b show a scheme of the correlation between the proliferation and osteogenic differentiation of hMSCs through focal adhesion generated by the ordered morphology of TNT and TNT–HA and the disordered morphology of TMS and TMS–HA. The greater the amount of integrins between a cell and a substrate, the stronger the focal adhesion. Mechanotransduction clarifies how cells process mechanical information of a shape alteration into a response. The osteogenic differentiation of stem cells is accompanied with turning the spindle-like cytoskeletal shape of hMSCs into the star-like cytoskeletal shape of osteoblasts. Consequently, the change in the stem cell cytoskeletal shape on these interfaces in the absence of osteogenic inductors can indicate mechanotransduction processes. Here, we illustrate that the proliferating hMSCs remain the star-like (Fig. 6c) and spindle-like (Fig. 6d) shape of the cytoskeleton on the disordered morphology of TMS (Fig. 6c), and the differentiating spindle-like hMSCs become star-like osteoblasts on the ordered morphology of TNT (Fig. 6d).
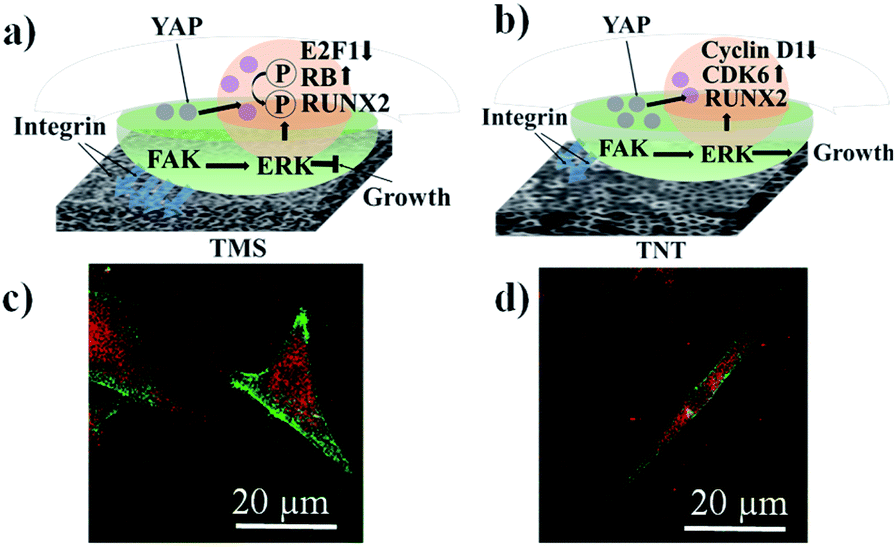 | ||
| Fig. 6 Scheme of mechanisms illustrating how self-renewal and osteogenic differentiation of hMSCs can be controlled by TMS (a and c) and TNT (b and d). Confocal laser scanning microscopy images of cells stained on TMS (c) and TNT (d) to visualize the focal adhesion: cytoskeleton – green and focal adhesion contacts – red. There is strong cell adhesion on the disordered TMS (left side) and weak cell adhesion on the ordered TNT (right side). The square of focal adhesion contacts is bigger on the disordered TMS than on the ordered TNT. Abbreviations: TNT – titania nanotubes; TMS – titania mesoporous surface; FAK – integrin-mediated focal adhesion kinase; ERK – extracellular signal-regulated kinase; RUNX2 – runt-related transcription factor 2; CDK6 – cyclin-dependent kinase 6; YAP – cytoplasmic-nuclear Yes-associated protein; RB – retinoblastoma-associated protein; and E2F1 – cell-cycle-related transcription factor. | ||
Direct (physical) mechanotransduction defines a cell as a mechanical unit rather than a biochemical unit. Focal adhesion creates a link between the matrix morphology and cytoskeleton by integrins. Changes in the matrix morphology trigger alterations in the tension of the cytoskeleton components in such a way that mechanical forces can be propagated from focal adhesion to the nuclei, directly resulting in a transformation of the nucleus shape, chromosomal arrangement, and gene expression involved in stem cell self-renewal and differentiation.49–55 Accordingly, mechanical forces are transmitted to filamentous F-actin, which is cross-linked by α-actinins and made tense by myosin II, creating pre-stress. F-actin is attached to microtubules (MTs) via actin-crosslinking factor 7 (ACF7) and to intermediate filaments (IFs) via plectin 1. Plectin 1 also binds IFs to MTs and IFs to nesprin 3 on the external nuclear membrane. F-actin is joined to internal nuclear membrane protein SUN1 by nesprin 1 and nesprin 2. Nesprin 3 links plectin 1 to SUN1 and SUN2.55–58
The SUN proteins are related to the lamins, which build the lamina and nuclear scaffold that connects to chromatin and DNA, e.g. through matrix attachment regions (MARs). Nuclear actin, myosin, and titin can participate in nuclear scaffold building, gene location guiding, and nuclear pre-stress propagation.20,35,59–63
Moreover, the changes in focal adhesion, which are caused by a matrix surface morphology stimulus, impact biochemical signaling, mediating the transcript-factor regulation of gene expression.
The conversion of biochemical signals derived from changes in intracellular tension to a phenotypical effect is described as indirect (biochemical) mechanotransduction. Diverse cellular responses are activated depending on the duration and magnitude of the signaling.15,20
The amount of integrin-related focal adhesion correlates with the units of cytoskeleton-mediated intracellular tension. The ordered porous morphology of TNT tunes the integrin–matrix interactions. As can be seen in Fig. 6c and d, the square of the focal adhesion contacts is bigger for the cells on the TMS sample.
The lower feedback magnitude of the FAK-dependent ERK1/2 signaling mediates cyclin D1 repression and CDK6 induction, which are involved in maintaining cellular growth. RUNX2 is still not induced. This weak cytoskeletal tension is conducive to the preservation of YAP balance. The spindle-like mesenchymal stem cells attached to the ordered porous morphology are stimulated to proliferate. The disordered porous morphology of TMS adjusts a lot of integrin–matrix adhesion. FAK-translated mechanical forces activate RUNX2 and RB phosphorylation through ERK1/2 signaling. Cellular growth is inhibited by RB accompanied by E2F1 attenuation. RUNX2 again activated by RB and cytoskeleton tension drives YAP translocation into the nucleus. Then, the spindle-like mesenchymal stem cells attached to the disordered porous morphology of TMS turn into star-like osteoblasts.41–44
The regulatory transcription genes such as PTK2 and ERK1/2 were analyzed using RT-qPCR after 5 day incubation of hMSCs on Ti, TNT, TNT–HA, TMS, and TMS–HA (ESI, Fig. S6†).
According to the obtained data, proliferating hMSCs weakly attached (Fig. 6d) to TNT or TNT–HA, giving rise to lower levels of integrin-mediated focal adhesion kinase (FAK)-triggered signaling pathways, which retained the extracellular signal-regulated kinase (ERK)1/2 levels such that the cells self-renewed but did not differentiate. Runt-related transcription factor 2 (RUNX2), a critical transcription factor for osteogenic differentiation, remained dormant. The proliferating hMSCs stayed longer in the G1 phase of the cell cycle (and spent less time in G2), which is chaperoned with the inhibition of cyclin D1, demanded for cell cycle progression, and the activation of cyclin-dependent kinase 6 (CDK6), decreasing receptivity to bone morphogenetic protein-2. The gene expression of cyclin D1 and CDK6 in hMSCs on the ordered and disordered titania morphology of the implant interfaces showed different PTK2, ERK1/2, E2F1, RB, CDK6, and cyclin D1 expression (ESI, Fig. S6 and S7†). Due to the low cytoskeletal tension, cytoplasmic-nuclear yes-associated protein (YAP) equilibrium was sustained. Mitogenic switches, notably ERK1/2, can guide the cell cycle to support cellular growth by shifting the cycle to prolonged G1 and reduced G2 phases, henceforth potentially suppressing osteogenic differentiation.49,53–57 Additionally, weaker focal adhesion, which is related to the smooth titanium surface, resulted in the lower proliferation of hMSCs.
The experimental data showed the strong focal adhesion for the TMS and TMS–HA samples (Fig. 6c), which changed the mitogenic equilibrium, diminished cellular growth and enhanced osteogenic differentiation. The integrin-mediated generation of focal adhesion through FAKs promotes the activation of ERK1/2, inhibiting cellular growth and the phosphorylation of RUNX2 (initiating osteogenic differentiation) and retinoblastoma-associated protein (RB).57–61 RB phosphorylation takes part in delaying progression to the S phase and triggering RUNX2. The down-regulation of the cell cycle-related transcription factor (E2F1) also represses the transition from the G1 to the S phase. Fig. S8 in the ESI† details the gene expression of RB and E2F1 in the hMSCs on the disordered morphology of the implant interfaces. High cytoskeletal tension directs the YAP translocation into the nucleus to induce osteogenic differentiation, once more activating RUNX2.61–63 Stem cells switch from proliferation, low activity of metabolism, to differentiation, a highly active metabolic state where more energy is required to produce the extracellular matrix.53
The diverse degree of osteogenic differentiation monitored between titanium with the osteogenic factors and TMS can be explained by the treatment flows from the changes in the cellular signaling pathways, which gave rise to altered multipotency, and therefore, the content of cells in the osteoblast culture. Thus, the porous morphology of implant interfaces can be used to regulate both the directed differentiation into osteoblasts and the proliferation of mesenchymal stem cells.
4. Conclusions
The influence of the titania surface morphology and hydroxyapatite on the proliferation and osteogenic differentiation of hMSCs was studied. In 5 days, the hMSC culture grew on TNT, TNT–HA, TMS, and TMS–HA. A higher proliferation of hMSCs was observed on the highly ordered TNT and TNT–HA, leading to an increase in the MTT assay absorbance by ca. 1.88-fold and ca. 2.09-fold compared to the smooth titanium, respectively. In 14 days, the differentiation of hMSCs in the osteogenic direction, chaperoned by an equal increase in gene expression of osteocalcin, alkaline phosphatase, osteopontin, and collagen type I, was driven by the disordered TMS and TMS–HA without osteogenic inductors. However, the highly ordered TNT–HA and disordered TMS–HA could serve as a source of calcium and phosphate ions for facilitated bone-tissue building in vivo. The diverse response of hMSCs to the ordered and disordered porous morphology of implants is explained by the different number of focal adhesion contacts between the cell and the matrix interface. By the mechanism of mechanotransduction, focal adhesion regulates the expression of genes determining stem cell self-renewal and osteogenic differentiation (RUNX2, C-MYC, PTK2, ERK1/2, E2F1, RB, CDK6, and cyclin D1). Weak focal adhesion is adjusted by the ordered morphology of TNT and TNT–HA, whereas strong focal adhesion is tuned by the disordered morphology of TMS and TMS–HA. The present concept enables the control of stem cell and tissue behaviour and the creation of new-generation bioconstruction based on mesenchymal stem cells and bone implants with a porous titanium dioxide-based interface to improve current implants for the replacement of bone injuries.Conflicts of interest
There are no conflicts to declare.Acknowledgements
The authors are thankful to Dr Natalya A. Belyasova (Belarusian State Technological University) for valuable advice and useful comments. HMSCs experiments were supported by the Research Program “Fundamental and Applied Sciences – Medicine” of Belarus (state registration no. 20170224). Authors acknowledge RSF grant no. 19-79-10244 for the financial support of the surface nanostructuring part. ITMO Fellowship and Professorship Program 08-08 is acknowledged for infrastructural support.References
- H. Shegarfi and O. Reikeras, Bone transplantation and immune response, J. Orthop. Surg., 2009, 17(2), 206–211 CrossRef.
- S. C. Manolagas, From estrogen-centric to aging and oxidative stress: a revised perspective of the pathogenesis of osteoporosis, Endocr. Rev., 2010, 31, 266–300 CrossRef CAS.
- S. R. K. Meka, V. Agarwal and K. Chatterjee, In situ preparation of multicomponent polymer composite nanofibrous scaffolds with enhanced osteogenic and angiogenic activities, Mater. Sci. Eng., 2019, 94, 565–579 CrossRef CAS.
- S. R. K. Meka, S. Kumar Verma, V. Agarwal and K. Chatterjee, In Situ Silication of Polymer Nanofibers to Engineer Multi-Biofunctional Composites, ChemistrySelect, 2018, 3(13), 3762–3773 CrossRef CAS.
- S. R. K. Meka, S. Jain and K. Chatterjee, Strontium eluting nanofibers augment stem cell osteogenesis for bone tissue regeneration, Colloids Surf., B, 2016, 146, 649–656 CrossRef CAS.
- D. Meng, S. N. Rath, N. Mordan, V. Salih, U. Kneser and A. R. Boccaccini, In vitro evaluation of 45S5 Bioglass®-derived glass-ceramic scaffolds coated with carbon nanotubes, J. Biomed. Mater. Res., Part A, 2011, 99, 435–444 CrossRef.
- M. J. Dalby, N. Gadegaard, R. Tare, A. Andar, M. O. Riehle, P. Herzyk, C. D. W. Wilkinson and R. O. C. Oreffo, The control of human mesenchymal cell differentiation using nanoscale symmetry and disorder, Nat. Mater., 2007, 6(12), 997–1003 CrossRef CAS.
- R. Passier, L. W. van Laake and C. L. Mummery, Stem-cell-based therapy and lessons from the heart, Nature, 2008, 453(7193), 322–329 CrossRef CAS.
- R. J. McMurray, N. Gadegaard, P. M. Tsimbouri, K. V. Burgess, L. E. McNamara, R. Tare, K. Murawski, E. Kingham, R. O. C. Oreffo and M. J. Dalby, Nanoscale surfaces for the long-term maintenance of mesenchymal stem cell phenotype and multipotency, Nat. Mater., 2011, 10(8), 637–644 CrossRef CAS.
- F. Guilak, D. M. Cohen, B. T. Estes, J. M. Gimble, W. Liedtke and C. S. Chen, Control of stem cell fate by physical interactions with the extracellular matrix, Cell Stem Cell, 2009, 5, 17–26 CrossRef CAS.
- W. Chen, Y. Shao, X. Li, G. Zhao and J. Fu, Nanotopographical surfaces for stem cell fate control: engineering mechanobiology from the bottom, Nano Today, 2014, 9(6), 759–784 CrossRef CAS.
- D. S. Benoit, M. P. Schwartz, A. R. Durney and K. S. Anseth, Small functional groups for controlled differentiation of hydrogel-encapsulated human mesenchymal stem cells, Nat. Mater., 2008, 7(10), 816–823 CrossRef CAS.
- T. E. Douglas, S. Kumari, K. Dziadek, M. Dziadek, A. Abalymov, P. Cools, G. Brackman, T. Coenye, R. Morent, M. K. Mohan and A. G. Skirtach, Titanium surface functionalization with coatings of chitosan and polyphenol-rich plant extracts, Mater. Lett., 2017, 196, 213–216 CrossRef CAS.
- J. H. Wen, L. G. Vincent, A. Fuhrmann, Y. S. Choi, K. C. Hribar, H. Taylor-Weiner and A. J. Engler, Interplay of matrix stiffness and protein tethering in stem cell differentiation, Nat. Mater., 2014, 13(10), 979–987 CrossRef CAS.
- M. J. Dalby, N. Gadegaard and R. O. C. Oreffo, Harnessing morphology and integrin–matrix interactions to influence stem cell fate, Nat. Mater., 2014, 13(6), 558–569 CrossRef CAS.
- X. Shen, Y. Yu, P. Ma, Z. Luo, Y. Hu, M. Li, Y. He, Y. Zhang, Z. Peng, G. Song and K. Cai, Titania nanotubes promote osteogenesis via mediating crosstalk between macrophages and MSCs under oxidative stress, Colloids Surf., B, 2019, 180, 39–48 CrossRef CAS.
- C. S. Chen, M. Mrksich, S. Huang, G. Whitesides and D. E. Ingber, Geometric control of cell life and death, Science, 1997, 276, 1425–1428 CrossRef CAS.
- K. A. Kilian, B. Bugarija, B. T. Lahn and M. Mrksich, Geometric cues for directing the differentiation of mesenchymal stem cells, Proc. Natl. Acad. Sci. U. S. A., 2010, 107(11), 4872–4877 CrossRef CAS.
- R. A. Surmenev, M. A. Surmeneva and A. A. Ivanova, Significance of calcium phosphate coatings for the enhancement of new bone osteogenesis–a review, Acta Biomater., 2014, 10(2), 557–579 CrossRef CAS.
- E. Kuvyrkov, N. Brezhneva, S. A. Ulasevich and E. V. Skorb, Sonochemical nanostructuring of titanium for regulation of human mesenchymal stem cells behavior for implant development, Ultrason. Sonochem., 2019, 52, 437–445 CrossRef CAS.
- S. A. Ulasevich, S. K. Poznyak, A. I. Kulak, S. A. Karpushenkov, A. D. Lisenkov and E. V. Skorb, Deposition of hydroxyapatite–incorporated TiO2 coating on titanium using plasma electrolytic oxidation coupled with electrophoretic deposition, RSC Adv., 2016, 6(67), 62540–62544 RSC.
- C. Ge, W. P. Cawthorn, Y. Li, G. Zhao, O. A. MacDougald and R. T. Franceschi, Reciprocal control of osteogenic and adipogenic differentiation by ERK/MAP kinase phosphorylation of Runx2 and PPARγ transcription factors, J. Cell. Physiol., 2016, 231(3), 587–596 CrossRef CAS.
- X. Yang, Y. Li, X. Liu, R. Zhang and Q. Feng, In vitro uptake of hydroxyapatite nanoparticles and their effect on osteogenic differentiation of human mesenchymal stem cells, Stem Cells Int., 2018, 2036176 Search PubMed.
- K. D. Patel, R. K. Singh, J. H. Lee and H. W. Kim, Electrophoretic coatings of hydroxyapatite with various nanocrystal shapes, Mater. Lett., 2019, 234, 148–154 CrossRef CAS.
- T. D. Schmittgen and K. J. Livak, Analyzing real-time PCR data by the comparative CT method, Nat. Protoc., 2008, 3, 1101 CrossRef CAS.
- Y. Zhukova, C. Hiepen, P. Knaus, M. Osterland, S. Prohaska, J. W. C. Dunlop, P. Fratzl and E. V. Skorb, The role of titanium surface nanostructuring on preosteoblast morphology, adhesion, and migration, Adv. Healthcare Mater., 2017, 6(15), 1601244 CrossRef.
- E. M. Mahdi, A. Shukor, M. Hamdi, M. Yusoff, M. Sulaiman and P. Wilfred, XRD and EDXRF analysis of anatase nano-TiO2 synthesized from mineral precursors, Adv. Mater. Res., 2013, 620, 179–185 Search PubMed.
- S. A. Ulasevich, S. K. Poznyak, A. I. Kulak, A. D. Lisenkov, M. Starykevich and E. V. Skorb, Photocatalytic deposition of hydroxyapatite onto a titanium dioxide nanotubular layer with fine tuning of layer nanoarchitecture, Langmuir, 2016, 32(16), 4016–4021 CrossRef CAS.
- W. E. Müller, E. Tolba, H. C. Schröder, R. Muñoz-Espí, B. Diehl-Seifert and X. Wang, Amorphous polyphosphate–hydroxyapatite: a morphogenetically active substrate for bone-related SaOS2- cells in vitro, Acta Biomater., 2016, 31, 358–367 CrossRef.
- M. Prekajski, M. Mirković, B. Todorović, A. Matković, M. Marinović-Cincović, J. Luković and B. Matović, Ouzo effect—New simple nanoemulsion method for synthesis of strontium hydroxyapatite nanospheres, J. Eur. Ceram. Soc., 2016, 36(5), 1293–1298 CrossRef CAS.
- M. F. Pittenger, A. M. Mackay, S. C. Beck, R. K. Jaiswal, R. Douglas, J. D. Mosca, M. A. Moorman, D. W. Simonetti, S. Craig and D. R. Marshak, Multilineage potential of adult human mesenchymal stem cells, Science, 1999, 284(5411), 143–147 CrossRef CAS.
- S. Kern, H. Eichler, J. Stoeve, H. Kluter and K. Bieback, Comparative analysis of mesenchymal stem cells from bone marrow, umbilical cord blood, or adipose tissue, Stem Cells, 2006, 24, 1294–1301 CrossRef CAS.
- K. Le Blanc and D. Mougiakakos, Multipotent mesenchymal stromal cells and the innate immune system, Nat. Rev. Immunol., 2012, 12(5), 383–396 CrossRef CAS.
- A. Aldahmash, M. Haack-Sørensen, M. Al-Nbaheen, L. Harkness, B. M. Abdallah and M. Kassem, Human serum is as efficient as fetal bovine serum in supporting proliferation and differentiation of human multipotent stromal (mesenchymal) stem cells in vitro and in vivo, Stem Cell Rev. Rep., 2011, 7(4), 860–868 CrossRef.
- K. Gelse, E. Poschl and T. Aigner, Collagens – structure, functions, and biosynthesis, Adv. Drug Delivery Rev., 2003, 55(12), 1531–1546 CrossRef CAS.
- B. Wildemann, M. Lubberstedt, N. P. Haas, M. Raschke and G. Schmidmaier, IGFI and TGF-beta 1 incorporated in a poly(D,L-lactide) implant coating maintain their activity over long-term storage cell culture studies on primary human osteoblast-like cells, Biomaterials, 2004, 25(17), 3639–3644 CrossRef CAS.
- H. M. Khandwala, S. Mumm and M. P. Whyte, Low serum alkaline phosphatase activity and pathologic fracture: case report and brief review of hypophosphatasia diagnosed in adulthood, Endocr. Pract., 2007, 12(6), 676–681 CrossRef.
- H. Orimo, The mechanism of mineralization and the role of alkaline phosphatase in health and disease, J. Nippon Med. Sch., 2010, 77(1), 4–12 CrossRef CAS.
- L. Malaval, F. Liu, P. Roche and J. E. Aubin, Kinetics of osteoprogenitor proliferation and osteoblast differentiation in vitro, J. Cell. Biochem., 1999, 74, 616–627 CrossRef CAS.
- N. K. Lee, Endocrine regulation of energy metabolism by the skeleton, Cell, 2007, 130(3), 456–459 CrossRef CAS.
- F. P. Reinholt, K. Hultenby, A. Oldberg and D. Heinegård, Osteopontin – a possible anchor of osteoclasts to bone, Proc. Natl. Acad. Sci. U. S. A., 2007, 87(12), 4473–4475 CrossRef.
- T. Aizawa, S. Kokubun, T. Kawamata, Y. Tanaka and H. I. Roach, c-Myc protein in the rabbit growth plate. Changes in immunolocalisation with age and possible roles from proliferation to apoptosis, J. Bone Jt. Surg., Br. Vol., 1999, 81(5), 921–925 CrossRef CAS.
- J. B. Lian and G. S. Stein, Concepts of osteoblast growth and differentiation: basis for modulation of bone cell development and tissue formation, Crit. Rev. Oral Biol. Med., 1992, 3(3), 269–305 CrossRef CAS.
- M. Galindo, J. Pratap, D. W. Young, H. Hovhannisyan, H. J. Im, J. Y. Choi, J. B. Lian, J. L. Stein, G. S. Stein and A. J. van Wijnen, The bone-specific expression of Runx 2 oscillates during the cell cycle to support a G1-related antiproliferative function in osteoblasts, J. Biol. Chem., 2005, 280(21), 20274–20285 CrossRef CAS.
- J. Pratap, A. Javed, L. R. Languino, A. J. van Wijnen, J. L. Stein, G. S. Stein and J. B. Lian, The Runx 2 osteogenic transcription factor regulates matrix metalloproteinase 9 in bone metastatic cancer cells and controls cell invasion, Mol. Cell. Biol., 2005, 25(19), 8581–8591 CrossRef CAS.
- D. M. Thomas, S. A. Johnson, N. A. Sims, M. K. Trivett, J. L. Slavin, B. P. Rubin, P. Waring, G. A. McArthur, C. R. Walkley, A. J. Holloway, D. Diyagama, J. E. Grim, B. E. Clurman, D. D. L. Bowtell, J.-S. Lee, G. M. Gutierrez, D. M. Piscopo, S. A. Carty and P. W. Hinds, Terminal osteoblast differentiation, mediated by Runx 2 and p27KIP1, is disrupted in osteosarcoma, J. Cell Biol., 2004, 167(5), 925–934 CrossRef CAS.
- J. J. Westendorf, S. K. Zaidi, J. E. Cascino, R. Kahler, A. J. van Wijnen, J. B. Lian, M. Yoshida, G. S. Stein and X. Li, Runx 2 (Cbfa1, AML-3) interacts with histone deacetylase 6 and represses the p21(CIP1/WAF1) promoter, Mol. Cell. Biol., 2002, 22(22), 7982–7992 CrossRef CAS.
- B. Geiger, A. Bershadsky, R. Pankov and K. M. Yamada, Transmembrane extracellular matrix-cytoskeleton crosstalk, Nat. Rev. Mol. Cell Biol., 2001, 2(11), 793–805 CrossRef CAS.
- L. Bian, M. Guvendiren, R. L. Mauck and J. A. Burdick, Hydrogels that mimic developmentally relevant matrix and N-cadherin interactions enhance MSC chondrogenesis, Proc. Natl. Acad. Sci. U. S. A., 2013, 110(25), 10117–10122 CrossRef CAS.
- C. Ge, G. Xiao, D. Jiang and R. T. Franceschi, Critical role of the extracellular signal–regulated kinase–MAPK pathway in osteoblast differentiation and skeletal development, J. Cell Biol., 2007, 176(5), 709–718 CrossRef CAS.
- P. M. Tsimbouri, R. J. McMurray, K. V. Burgess, E. V. Alakpa, P. M. Reynolds, K. Murawski, E. Kingham, R. O. Oreffo, N. Gadegaard and M. J. Dalby, Using morphology and metabolomics to identify biochemical effectors of multipotency, ACS Nano, 2012, 6(11), 10239–10249 CrossRef CAS.
- J. N. Roberts, J. K. Sahoo, L. E. McNamara, K. V. Burgess, J. Yang, E. V. Alakpa, H. J. Anderson, J. Hay, L. A. Turner, S. J. Yarwood, M. Zelzer, R. O. C. Oreffo, R. V. Ulijn and M. J. Dalby, Dynamic surfaces for the study of mesenchymal stem cell growth through adhesion regulation, ACS Nano, 2016, 10(7), 6667–6679 CrossRef CAS.
- L. C. Lee, N. Gadegaard, M. C. de Andrés, L. A. Turner, K. V. Burgess, S. J. Yarwood, J. Wells, M. Salmeron-Sanchez, D. Meek, R. O. Oreffo and M. J. Dalby, Morphology controls cell cycle changes involved with skeletal stem cell self-renewal and multipotency, Biomaterials, 2017, 116, 10–20 CrossRef CAS.
- T. Ogasawara, H. Kawaguchi, S. Jinno, K. Hoshi, K. Itaka, T. Takato, K. Nakamura and H. Okayama, Bone morphogenetic protein 2-induced osteoblast differentiation requires Smad-mediated down-regulation of Cdk6, Mol. Cell. Biol., 2004, 24(15), 6560–6568 CrossRef CAS.
- E. Laurenti, C. Frelin, S. Xie, R. Ferrari, C. F. Dunant, S. Zandi, A. Neumann, I. Plumb, S. Doulatov, J. Chen, C. April, J. B. Fan, N. Iscove and J. E. Dick, CDK6 levels regulate quiescence exit in human hematopoietic stem cells, Cell Stem Cell, 2015, 16(3), 302–313 CrossRef CAS.
- M. J. Biggs, R. G. Richards, N. Gadegaard, C. D. Wilkinson, R. O. Oreffo and M. J. Dalby, The use of nanoscale topography to modulate the dynamics of adhesion formation in primary osteoblasts and ERK/MAPK signalling in STRO-1+ enriched skeletal stem cells, Biomaterials, 2009, 30(28), 5094–5103 CrossRef CAS.
- C. Ge, W. P. Cawthorn, Y. Li, G. Zhao, O. A. Macdougald and R. T. Franceschi, Reciprocal control of osteogenic and adipogenic differentiation by ERK/MAP kinase phosphorylation of Runx2 and PPARγ transcription factors, J. Cell. Physiol., 2016, 231, 587–596 CrossRef CAS.
- M. J. Dalby, A. J. García and M. Salmeron-Sanchez, Receptor control in mesenchymal stem cell engineering, Nat. Rev. Mater., 2018, 3, 1–14 CrossRef.
- D. G. Johnson, J. K. Schwarz, W. D. Cress and J. R. Nevins, Expression of transcription factor E2F1 induces quiescent cells to enter S phase, Nature, 1993, 365, 349–352 CrossRef CAS.
- H. Donnelly, M. Salmeron-Sanchez and M. J. Dalby, Designing stem cell niches for differentiation and self-renewal, J. R. Soc., Interface, 2018, 15, 20180388 CrossRef.
- A. Elosegui-Artola, I. Andreu, A. E. M. Beedle, A. Lezamiz, M. Uroz, A. J. Kosmalska, R. Oria, J. Z. Kechagia, P. Rico-Lastres, A. L. Le Roux, C. M. Shanahan, X. Trepat, D. Navajas, S. Garcia-Manyes and P. Roca-Cusachs, Force triggers YAP nuclear entry by regulating transport across nuclear pores, Cell, 2017, 171, 1397–1410 CrossRef CAS.
- C. Yang, M. W. Tibbitt, L. Basta and K. S. Anseth, Mechanical memory and dosing influence stem cell fate, Nat. Mater., 2014, 13, 645–652 CrossRef CAS.
- N. Wang, J. D. Tytell and D. E. Ingber, Mechanotransduction at a distance: mechanically coupling the extracellular matrix with the nucleus, Nat. Rev. Mol. Cell Biol., 2009, 10, 75–82 CrossRef CAS.
Footnotes |
| † Electronic supplementary information (ESI) available. See DOI: 10.1039/d0ra08271f |
| ‡ Authors contributed equally. |
| This journal is © The Royal Society of Chemistry 2021 |