 Open Access Article
Synthesis and characterization of bipyridine cobalt(II) complex modified graphite screen printed electrode: an electrochemical sensor for simultaneous detection of acetaminophen and naproxen
Tahere Kondoria,
Somayeh Tajik*b,
Niloufar Akbarzadeh-T*a,
Hadi Beitollahi c,
Cloudia Graiff
 d,
Ho Won Jang
 *e and
Mohammadreza Shokouhimehr
 *e
*e
aDepartment of Chemistry, University of Sistan and Baluchestan, P.O. Box 98135-674, Zahedan, Iran. E-mail: n.akbarzadeh@chem.usb.ac.ir
bResearch Center of Tropical and Infectious Diseases, Kerman University of Medical Sciences, Kerman, Iran. E-mail: tajik_s1365@yahoo.com
cEnvironment Department, Institute of Science and High Technology and Environmental Sciences, Graduate University of Advanced Technology, Kerman, Iran
dDepartment of Chemistry, Life Sciences and Environmental Sustainability, University of Parma, Parco Area delleScienze 17/A, 43124 Parma, Italy
eDepartment of Materials Science and Engineering, Research Institute of Advanced Materias, Seoul National University, Seoul 08826, Republic of Korea. E-mail: hwjang@snu.ac.kr; mrsh2@snu.ac.kr
First published on 14th January 2021
Abstract
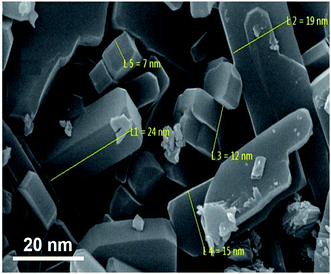
The new Co(II) compound [Co(5,5′-dmbpy)2(NCS)2] (a1) was prepared by reacting Co(NO3)2·6H2O, 5,5′-dimethyl-2,2′-bipyridine ligand, and Na(SCN). The nano-scale size of [Co(5,5′-dmbpy)2(NCS)2] (a1) was synthesized using sonochemical process. The size of the nanoparticles (a2) was ∼13 ± 2 nm. We have also provided a new platform of electrochemical sensing for simultaneous detection of acetaminophen and naproxen using (a2) surface modified graphite screen printed electrode (SPE) in 0.1 M phosphate buffer solution (PBS, pH 7.0). In contrast to bare SPE, the modified SPE could significantly improve the electrooxidation activity of acetaminophen along with the rise in the current of an anodic peak. The peak currents acquired using differential pulse voltammetry (DPV) raised linearly with the raising of acetaminophen concentration and the sensor had a detection range over the concentration range of 0.009–325.0 μM, with a detection limit of 5.0 nM (S/N = 3). In the case of naproxen peak, currents of naproxen oxidation at the modified SPE were linearly dependent on the naproxen amounts in the range of 1.0–500.0 μM. The detection limit (S/N = 3) was calculated to be 0.03 μM. The DPV responses show that the peaks of acetaminophen and naproxen oxidation were vividly separated from one other with a potential difference of 410 mV between them. The low detection limit, high sensitivity, and stability made the relevant electrode applicable for the analysis of acetaminophen and naproxen in real samples. Further, its practical applicability was reliable and desirable in the analysis of pharmaceutical compounds and biological fluids. The benefits of using this modified electrode for the determination of analytes are compared with other works in the manuscript.
1. Introduction
Pharmaceutical analysis plays an important role in human health.1 Notably, their administration to a living organism helps the body to stay healthy. In general, pharmaceutical compounds are used to cure the diagnosed illnesses with biological efficacy in the body of the patients. Analytical measurements are very necessary after administration to the patients for bioavailability testing and evaluating their effectiveness and investigation of the needed dosage of drug formulation.2 While different analytical methods including spectrophotometry, spectrofluorometer, chemiluminescence, capillary zone electrophoresis, and chromatography3–7 have been extended for this purpose, electrochemical techniques have been considered as sensitive and cost-efficient method that can be accurately and rapidly used for pharmaceutical tests.8–10 Compared to other analytical techniques, the electrochemical determination has been indicated to be very sensitive with less interference from non-electroactive compounds for the investigations of a wide range of pharmaceutical factors.2,11,12Acetaminophen has been widely used in pharmaceuticals and it is mostly demonstrated in treatments of analgesic and antipyretic.13 In addition, it has reliable properties for relieving pain associated with backache, headache, reducing fevers, and postoperative pain.14 Acetaminophen can be administered in different forms (e.g., tablets, capsules, and suspension).15 Furthermore, acetaminophen is a multipurpose drug that can be available with significant concentration in biological compounds, in water bodies including wastewater of manufactures and unit's pharmaceuticals, as well as, considerable attention is essential for the quantification and detection of acetaminophen.
Naproxen is a compound antipyretic and anti-inflammatory applied in the treatment of nonrheumatic inflammation, migraine, and gout. Also, this drug is effective in reducing the pain of muscle cramps, muscle stiffness, and orthopedic surgery. The naproxen drug should be given with precaution in elderly patients and patients with hemophilia, gastrointestinal bleeding, and platelet coagulation dysfunction.16 The combination of acetaminophen and naproxen their effect has been proven in the treatment of ache and has their clinical utilization validated.17 Moreover, therapy through a combination of acetaminophen and naproxen drugs for sufferers with rheumatoid arthritis.18,19 Consequently, developing a sensitive, selective, and simple technique for designation of acetaminophen and naproxen is required in formulations of pharmaceutical in biological fluids.
Because the electrochemical determination of biological and pharmaceutical compounds is not generally possible with conventional electrode due to overvoltage, the electrodes are modified with various compounds.20–23 In addition, simultaneous determination of pharmacological and biological compounds on the surface of conventional electrodes is not easily achievable due to the overlap of their peaks. Therefore, more attention for extending an electrochemical sensor has been paid to modification of the materials on the surface of the electrode.24–27
In recent years, nanocomplexes are shown to be very effective in catalyzing the electrochemical reactions, resulting in a decrease in overpotentials and an increase in peak currents. Complexes of transition metals are particularly interesting as modifiers to catalyze the electrooxidation of some chemical and biologically important compounds due to their electrocatalytic properties, simultaneously functioning as active sites to accelerate chemical transformations and electron transfer.28–31
A SPE is a good electrode due to its mass production, cheap and current of low background. It can dominate electrodes of carbon paste and electrodes of shortcomings of glassy carbon,32 containing effects of memory and operations of tedious cleaning. Moreover, the intrinsic disadvantages of SPEs including low sensitivity and repeatability decrease these electrodes' application and yet the surface of electrodes is prone to modify various sensing samples to achieve alright detection performance.33,34
In this work, [Co(5,5′-dmbpy)2(NCS)2] (a1) was synthesized and characterized by various techniques. The cobalt nanocomplex (a2) was prepared by the sonochemical process. The synthesized nanocomplex (a2) was used to surface modification of the SPE and employed in the simultaneous detection of acetaminophen and naproxen. The advantages of this modified electrode for the determination of analytes are compared with other works in the manuscript.
2. Experimental
2.1. Chemicals and characterization
The chemicals and solvents were used without further purifications from the company of Aldrich. The spectrum of FT-IR of complex (a1) was recorded as 1% dispersions by using a spectrometer of Shimadzu-470 by a disk of CsI and in the range of (4000–250 cm−1). The spectrum of UV-Vis has resulted in a spectrometer of Shimadzu 2100. X-ray powder diffraction (XRD) calculations were conducted via an X'pert diffractometer from Philips Co. The scanning electron microscopic (SEM) was applied to distinguish the samples. Results of X-ray diffraction for complex (a1) were obtained at 173 K on a diffractometer of Bruker Apex II single-crystal, working with Mo-Kα graphite monochromatic radiator (Kα = 0.71073 Å) and have an area detector. The result of the raw frame was carried out by software of SAINT, and the rectification for absorption was made by the program of SCALE implemented in the SAINT package to obtain the data file of reflection. The structure of the sample was obtained via direct techniques with SHELXS-97 and refined against F2 with SHELXL-2014/7 by parameters of anisotropic thermal for all non-hydrogen atoms. The atoms of hydrogen were placed in the positions of ideal geometrical positions. The results crystallographic for complex (a1) were verified with the Cambridge Crystallographic Data Center.The measurements of electrochemical were carried out with a device in the name of Autolabpotentiostat/galvanostat (PGSTAT 302N, Eco Chemie, the Netherlands). The conditions of the test under revenue control with a software of General Purpose Electrochemical System (GPES). The electrode of screen-printed (DropSend, DRP-110, Spain) contains three segments of importance, which consists of a silver pseudo-reference electrode, a graphite counter electrode, and a graphite working electrode. pH was measured by a Metrohm 710 pH meter. All experiments were performed in accordance with the guidelines Kerman University of Medical Sciences, Kerman, Iran. Informed consents were obtained from human participants of this study (Urine samples).
2.2. Synthesis of the compound (a1)
The value of 0.34 mmol of ligand 5,5′-dmbpy and 0.340 mmol of Na(SCN) was dissolved in a mixture of H2O-methanol, then added to the value of 0.170 mmol of a solution of Co(NO3)2·6H2O, and mixed up at 60 °C for 2 h. The final solution slowly evaporates and crystals of the synthesized compound have been obtained, yield: 58.8%.FT-IR (CsI): 3421w ν(O–H), 2920s ν(C–H) aliphatic, 2090m ν(C![[double bond, length as m-dash]](https://www.rsc.org/images/entities/char_e001.gif) N), 1631m ν(C
N), 1631m ν(C![[double bond, length as m-dash]](https://www.rsc.org/images/entities/char_e001.gif) C), ν(C
C), ν(C![[double bond, length as m-dash]](https://www.rsc.org/images/entities/char_e001.gif) N), 850m ν(C
N), 850m ν(C![[double bond, length as m-dash]](https://www.rsc.org/images/entities/char_e001.gif) S), 827s, 662 s δ(C
S), 827s, 662 s δ(C![[double bond, length as m-dash]](https://www.rsc.org/images/entities/char_e001.gif) C
C![[double bond, length as m-dash]](https://www.rsc.org/images/entities/char_e001.gif) C), δ(C
C), δ(C![[double bond, length as m-dash]](https://www.rsc.org/images/entities/char_e001.gif) C
C![[double bond, length as m-dash]](https://www.rsc.org/images/entities/char_e001.gif) N), 267m ν(Co–N).35,36 Anal. calc.: C, 57.00; H, 4.38; N, 15.33; found: C, 56.76; H,4.01; N, 15.81.
N), 267m ν(Co–N).35,36 Anal. calc.: C, 57.00; H, 4.38; N, 15.33; found: C, 56.76; H,4.01; N, 15.81.
2.3. Synthesis of nanocomplex (a2)
A high-density ultrasonic probe was immersed directly into a methanol solution (10 mL) of Co(NO3)2·6H2O (0.170 mmol), a proper volume of 5,5′-dmbpy (0.34 mmol) in methanol solution (20 mL) was added dropwise. The solution of NaSCN (0.34 mmol) in 10 mL methanol was added gradually. The solution was then irradiated for 20 min with a power of 100 W. The obtained precipitates were filtered and dried in the air. The nanocomplex (a2): yield, 67.3%. Anal. calc. C, 57.2; H, 4.21; N, 15.73. Found: C, 57.7; H, 4.47; N, 14.95. FT-IR (CsI, cm−1): 3401 (w), 3003 (s), 2085 (w), 1623(s), 842 (s), 818 (s), 657 (s), 260 (s).2.4. Surface modification of the screen printed electrodes
The SPEs were modified by being coated with nanocomplex (a2). The general procedure for this involved dispersing 1 mg of nanocomplex (a2) in water (1 mL) for 45 min under sonication. Next 5 μL of the mixture was added to the SPE and it was placed to dry in conditions of environmental.2.5. Preparation of real samples
Urine samples were stored in the refrigerator after collection. To start the analyses, typically, 10 mL of each compound was taken and then centrifuged at 2000 rpm for a quarter. The supernatant then passed through a 0.45 μm filter. Next various quantities of the treated urine samples were taken and placed in a flask (25 mL) and watery by a phosphate buffer solution (PBS) (pH = 7.0). To these compounds, different quantities of acetaminophen and naproxen were spiked.Five 325 mg acetaminophen tablets (Amin Co., Iran) were ground and homogenized. Next, 325 mg of this powder was dissolved in PBS (25 mL) under sonication, and various quantities of this solution were added to the 25 mL volumetric flask before dilution with PBS (pH = 7.0).
Five 250 mg naproxen tablets (Chemidarou Co., Iran) were ground and homogenized. Next, 250 mg of this powder was dissolved in 25 mL of PBS in condition sonication, and various quantities of this solution were added to the 25 mL volumetric flask before dilution with PBS (pH = 7.0).
3. Results and discussion
The reaction of ligands of 5,5′-dmbpy and Na(SCN) with a salt of Co(II) (with the ratio of 2![[thin space (1/6-em)]](https://www.rsc.org/images/entities/char_2009.gif) :
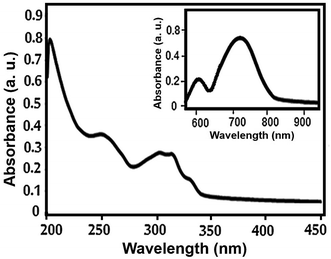
:![[thin space (1/6-em)]](https://www.rsc.org/images/entities/char_2009.gif) 2:1 molar for preparing compound (a1)) in H2O-methanol at 298 K made [Co(5,5′-dmbpy)2(NCS)2] (a1) complex. The compound (a1) was identified using spectroscopies of FT-IR, UV-Vis, and elemental analysis (CHN).
2:1 molar for preparing compound (a1)) in H2O-methanol at 298 K made [Co(5,5′-dmbpy)2(NCS)2] (a1) complex. The compound (a1) was identified using spectroscopies of FT-IR, UV-Vis, and elemental analysis (CHN).
3.1. Characterization of the synthesized complex
| Compound | a1 |
|---|---|
| Formula | C26H24CoN6S2 1/8H2O |
| Molecular weight | 545.81 |
| Crystal system | Triclinic |
| Space group | P![[1 with combining macron]](https://www.rsc.org/images/entities/char_0031_0304.gif) |
| a [Å] | 9.720(4) |
| b [Å] | 16.984(7) |
| c [Å] | 18.625(8) |
| V [Å3] | 2632.7(18) |
| Z | 4 |
| h,k,l max | 23,23,20 |
| μ [cm−1] | 0.837 |
| Refined parameters | 643 |
| R1 [I > 2σ(I)] | R1 = 0.0452 |
| wR2 = 0.1047 | |
| wR2 [all data] | R1 = 0.0862 |
| wR2 = 0.1249 | |
| GOF | 0.947 |
| CCDC | 1888105 |
| Bond length (Å) | Bond | Angle (°) | Bond angle |
|---|---|---|---|
| 1.339(4) | C1 N1 | 124.9 | N1 C1 C2 |
| 0.9300 | C1 H1 | 115.3(3) | C4 C2 C1 |
| 1.386(5) | C1 C2 | 109.5 | C2 C3 H3A |
| 1.625(4) | C25 S1 | 109.5 | H3A C3 H3 |
| 1.151(4) | C25 N5 | 124.3(3) | N4 C24C2 |
| 2.139(3) | N1 Co1 | 165.48(12) | N6 Co1 N3 |
| 2.078(3) | N5 Co1 | 96.15(13) | N11 Co2 N12 |
| 2.167(3) | N10 Co2 | 168.93(12) | N11 Co2 N8 |
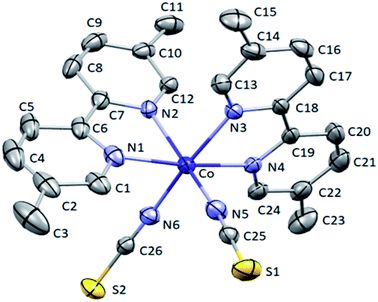
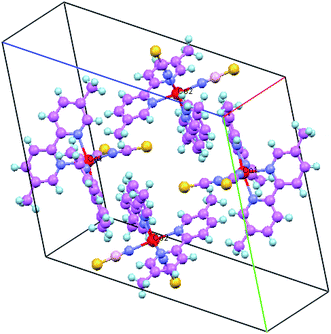
Oak Ridge Thermal Ellipsoid Plot (ORTEP) view and crystal packing related to complex (a1) are shown in Fig. 1 and 2, respectively. In this compound, Co(II) atoms are six-coordinated in distorted octahedral configurations by four N atoms from two 5,5′-dmbpy and two terminal N atoms from NCS ligands.
3.2. Characterization of the synthesized nanocomplex
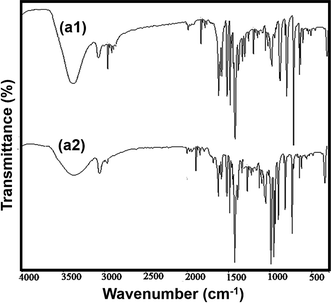
![[double bond, length as m-dash]](https://www.rsc.org/images/entities/char_e001.gif) N) and ν(C
N) and ν(C![[double bond, length as m-dash]](https://www.rsc.org/images/entities/char_e001.gif) C) vibrations. The medium to strong vibrational bands within the 1114 to 670 cm−1 region are accredited to malformation vibrations of δ(C
C) vibrations. The medium to strong vibrational bands within the 1114 to 670 cm−1 region are accredited to malformation vibrations of δ(C![[double bond, length as m-dash]](https://www.rsc.org/images/entities/char_e001.gif) C
C![[double bond, length as m-dash]](https://www.rsc.org/images/entities/char_e001.gif) N) and δ(C
N) and δ(C![[double bond, length as m-dash]](https://www.rsc.org/images/entities/char_e001.gif) C
C![[double bond, length as m-dash]](https://www.rsc.org/images/entities/char_e001.gif) C) in the phenyl and pyridine rings. The band at 850 cm−1 is atributad to ν(C
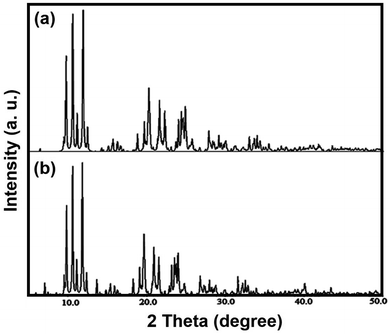
C) in the phenyl and pyridine rings. The band at 850 cm−1 is atributad to ν(C![[double bond, length as m-dash]](https://www.rsc.org/images/entities/char_e001.gif) S) vibration. The stretching vibration bond of Co–N was evident at 267 cm−1. According to the FT-IR spectrum of the complex (a1), the similarities to the FT-IR spectrum of single-crystalline substances are evident (Fig. 5).35,36
S) vibration. The stretching vibration bond of Co–N was evident at 267 cm−1. According to the FT-IR spectrum of the complex (a1), the similarities to the FT-IR spectrum of single-crystalline substances are evident (Fig. 5).35,36
3.3. Electrochemical analysis
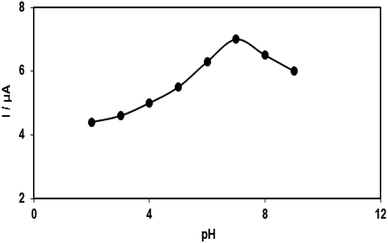 | ||
| Fig. 7 Plot of Ip vs. pH obtained from DPVs of modified SPE in a solution containing 100.0 μM acetaminophen in 0.1 PBS with different pHs (2.0, 3.0, 4.0, 5.0, 6.0, 7.0, 8.0 and 9.0). | ||
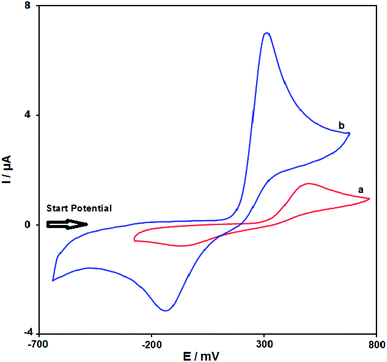
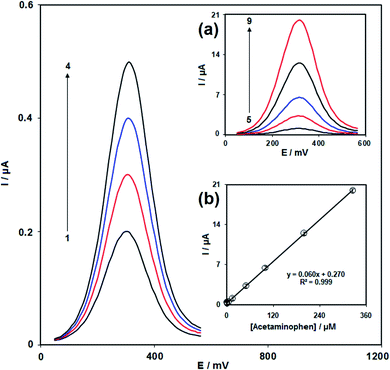
Fig. 8 illustrates the cyclic voltammograms recorded for 100.0 μM solution of acetaminophen using an unmodified SPE (curve a) and modified SPE (curve b). With the help of the modified electrode, the oxidation peak potential of acetaminophen was observed at 300 mV at a modified SPE, whereas the corresponding peak was observed at 500 mV at an unmodified SPE. The anodic peak current at the former is 460% higher than that at the latter, indicating a positive influence of modification.
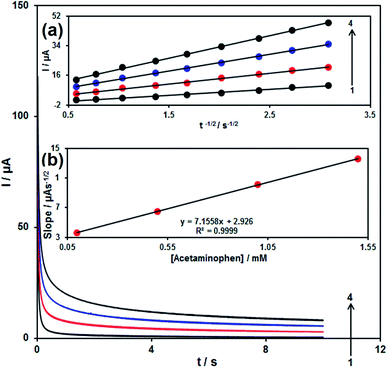
| I = nFAD1/2Cbπ−1/2t−1/2 | (1) |
| Limit of detection (μM) | Linear dynamic range (μM) | Modifier | Electrode | Ref. |
|---|---|---|---|---|
| 0.03 | 0.5–97 | BiO nanorods | Screen printed electrode | 42 |
| 0.051 | 0.09–7.0 and 16.4–1160 | CeO2 nanoparticles | Screen printed electrode | 43 |
| 3.3 × 10⁻⁵ | 10−4–20 | Electrodeposited graphene and zinc oxide nanocomposite | Glassy carbon electrode | 44 |
| 4.29 | 10–1000 | — | Graphite screen printed microelectrode arrays | 45 |
| 0.03 | 0.09–35.0 | Gold nanoparticles/multi-walled carbon nanotube | Glassy carbon electrode | 46 |
| 0.45 | 10–125 | Poly(4-amino-3-hydroxynaphthalene sulfonic acid) | Glassy carbon electrode | 47 |
| 1.45 | 7–400 | Graphene oxide-Y2O3 nanocomposite | Carbon paste electrode | 48 |
| 0.009 | 0.025–35 | Nitrogen-doped carbon nano-onions and gold nanoparticles | Glassy carbon electrode | 49 |
| 0.005 | 0.009–325.0 | Nanoparticle [Co(5,5′-dmbipy)2(NCS)2] | Screen printed electrode | This work |
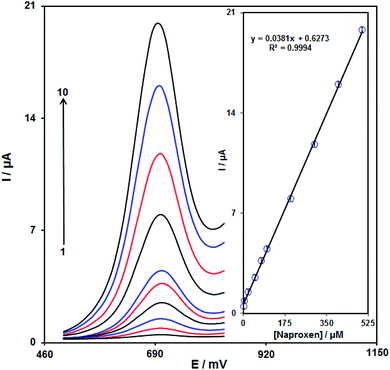
In the case of naproxen peak, currents of naproxen oxidation at the modified SPE (Fig. 12) were linearly dependent on the naproxen amounts, in the range of 1.0 × 10⁻⁶ to 5.0 × 10⁻⁴ M (with a value of correlation coefficient equal to 0.9994) (primary potential = 0.5 V, finish potential = 0.83 V, step potential = 0.002 V, modulation amplitude = 0.02505 V) and the limit of detection (3σ) was calculated 3.0 × 10⁻⁷ M.
To determine the antifouling characteristics of the modified SPE to the oxidation of acetaminophen and its oxidation products DPVs were obtained through the modified SPE in the presence of acetaminophen. The DPVs in the presence of acetaminophen sample was obtained after carrying out 15 cycles of potential at 50 mV s−1. Albeit the potentials of peak did not alter; the electrooxidation currents illustrate a 2.4% decrease. The data displayed that not only does the sensitivity of the electrode rise, but also fouling effected using its oxidation product or the analyte reduces.
| R.S.D. (%) | Recovery (%) | Found | Spiked | Sample | ||||
|---|---|---|---|---|---|---|---|---|
| NAP | AC | NAP | AC | NAP | AC | NAP | AC | |
| — | 3.2 | — | — | — | 4.0 | 0 | 0 | Acetaminophen tablet |
| 2.1 | 2.4 | 102.2 | 98.5 | 4.6 | 6.4 | 4.5 | 2.5 | |
| 1.8 | 2.7 | 101.8 | 97.3 | 5.6 | 7.3 | 5.5 | 3.5 | |
| 2.8 | 1.9 | 98.0 | 103.5 | 6.4 | 8.8 | 6.5 | 4.5 | |
| 3.4 | 2.4 | 98.7 | 98.9 | 7.4 | 9.4 | 7.5 | 5.5 | |
| 2.4 | — | — | — | 2.5 | — | 0 | 0 | Naproxen tablet |
| 3.5 | 1.7 | 101.5 | 98.0 | 6.6 | 4.9 | 4.0 | 5.0 | |
| 1.9 | 3.3 | 98.7 | 103.3 | 7.4 | 6.2 | 5.0 | 6.0 | |
| 2.5 | 2.2 | 97.6 | 102.8 | 8.3 | 7.2 | 6.0 | 7.0 | |
| 2.3 | 3.6 | 103.2 | 98.7 | 9.8 | 7.9 | 7.0 | 8.0 | |
| — | — | — | — | — | — | 0 | 0 | Urine |
| 2.4 | 3.2 | 98.0 | 102.5 | 4.9 | 4.1 | 5.0 | 4.0 | |
| 2.9 | 1.9 | 101.4 | 98.3 | 7.1 | 5.9 | 7.0 | 6.0 | |
| 3.4 | 2.7 | 103.3 | 97.5 | 9.3 | 7.8 | 9.0 | 8.0 | |
| 2.5 | 3.1 | 99.1 | 101.0 | 10.9 | 10.1 | 11.0 | 10.0 | |
4. Conclusions
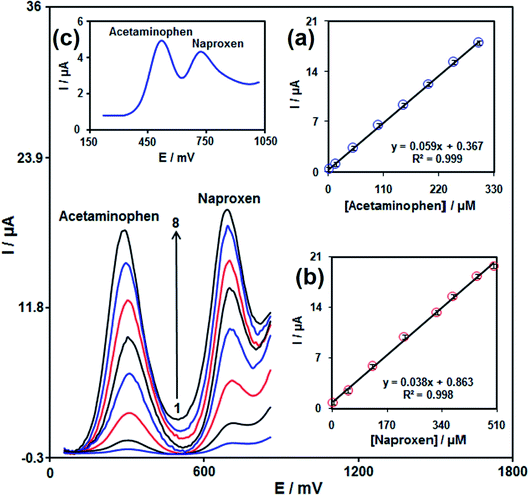
In this work, we have shown the preparation of a new Co(II) compound with the formula [Co(5,5′-dmbpy)2(NCS)2] (a1). The compound (a1) was identified using FT-IR, UV-Vis spectroscopic techniques and elemental analysis, and single-crystal X-ray diffraction. The nano-size of compound (a1), has been synthesized using a sonochemical process. Nano-compound was distinguish using FT-IR, XRD, and SEM methods. A rapid, inexpensive, sensitive, and selective method for the designation of acetaminophen was presented based on electrocatalytic oxidation of the presented analytes on the modified SPE. The electrooxidation of acetaminophen at the modified SPE takes place at 300 mV. In the present study, the use of the modified SPE for the measurement of acetaminophen and naproxen simultaneously was demonstrated. The potential differences of 410 mV between acetaminophen and naproxen were large enough to distinguish acetaminophen and naproxen simultaneously and individually. Finally, the presented sensor applied to the designation of acetaminophen and naproxen in acetaminophen tablet, naproxen tablet, and urine with satisfactory recovery results. The high stability, wide linear range, reproducibility, and low detection limit, show that this sensor is an attractive candidate as a transducer for practical applications.Conflicts of interest
The authors declare no competing interests.Acknowledgements
The financial support provided by University of Sistan and Baluchestan and Kerman University of Medical Sciences is appreciated. This research was supported by National Research Foundation of Korea (NRF) funded by the Ministry of Science and ICT (2020M2D8A206983011). Furthermore, the financial supports of the Basic Science Research Program (2017R1A2B3009135) through the National Research Foundation of Korea is appreciated.References
- M. Ghalkhani and F. Ghorbani-Bidkorbeh, Iran. J. Pharm. Res., 2019, 18, 658 CAS.
- M. R. Siddiqui, Z. A. AlOthman and N. Rahman, Arabian J. Chem., 2017, 10, S1409 CrossRef CAS.
- P. Mukherjee, A. Bagchi and A. Raha, Afr. J. Pharm. Pharmacol., 2015, 9, 834 CrossRef CAS.
- B. Kaur, R. Kumar, S. Chand, K. Singh and A. K. Malik, Spectrochim. Acta, Part A, 2019, 214, 261 CrossRef CAS.
- N. Memon, T. Qureshi, M. I. Bhanger and M. I. Malik, Curr. Anal. Chem., 2019, 15, 349 CrossRef CAS.
- M. W. Lago, M. L. Friedrich, G. D. Iop, T. B. de Souza, P. de Azevedo Mello and A. I. H. Adams, Talanta, 2018, 181, 182 CrossRef CAS.
- T. Hallaj, M. Amjadi, J. L. Manzoori and N. Azizi, J. Lumin., 2017, 32, 1174 CrossRef CAS.
- K. Zhang, T. H. Lee, H. Noh, O. K. Farha, H. W. Jang, J. W. Choi and M. Shokouhimehr, Cryst. Growth Des., 2020, 19, 7385 CrossRef.
- V. K. Gupta, R. Jain, K. Radhapyari, N. Jadon and S. Agarwal, Anal. Biochem., 2011, 408, 179 CrossRef CAS.
- S. Tajik, H. Beitollahi, F. Garkani Nejad, M. Safaei, K. Zhang, Q. V. Le, R. S. Varma, H. W. Jang and M. Shokouhimehr, RSC Adv., 2020, 10, 21561 RSC.
- S. Tajik, H. Beitollahi, S. Z. Mohammadi, M. Azimzadeh, K. Zhang, Q. V. Le, Y. Yamauchi, H. W. Jang and M. Shokouhimehr, RSC Adv., 2020, 10, 30481 RSC.
- N. A. El-Maali, Bioelectrochemistry, 2004, 64, 99 CrossRef.
- A. Sakthivel, A. Chandrasekaran, S. Jayakumar, P. Manickam and S. Alwarappan, J. Electrochem. Soc., 2019, 166, B1461 CrossRef CAS.
- R. Güzel, H. Ekşi, E. Dinç and A. O. Solak, J. Electrochem. Soc., 2013, 160, B119 CrossRef.
- M. A. Khandkar, D. V Parmar, M. Das and S. S. Katyare, J. Pharm. Pharmacol., 1996, 48, 437 CrossRef CAS.
- R. N. Brogden, R. C. Heel, T. M. Speight and G. S. Avery, Drugs, 1979, 18, 241 CrossRef CAS.
- H. F. Miranda, M. M. Puig, J. C. Prieto and G. Pinardi, Pain, 2006, 121, 22 CrossRef CAS.
- P. Seideman, P. Samuelson and G. Neander, Acta Orthop. Scand., 1993, 64, 285 CrossRef CAS.
- P. Seideman, Int. J. Rheumatol., 1993, 32, 1077 CAS.
- H. Mahmoudi-Moghaddam, H. Beitollahi, S. Tajik and H. Soltani, Electroanalysis, 2015, 27, 2620 CrossRef CAS.
- H. Beitollahi, H. Karimi-Maleh and H. Khabazzadeh, Anal. Chem., 2008, 80, 9848 CrossRef CAS.
- S. Tajik, H. Beitollahi, F. Sheikh Shoaie, M. A. Khalilzadeh, M. Shahedi Asl, Q. V. Le, K. Zhang, H. W. Jang and M. Shokouhimehr, RSC Adv., 2020, 10, 37834 RSC.
- S. F. Wang, F. Xie and R. F. Hu, Sens. Actuators, B, 2007, 123, 495 CrossRef CAS.
- M. M. Foroughi, H. Beitollahi, S. Tajik, M. Hamzavi and H. Parvan, Int. J. Electrochem. Sci., 2014, 9, 2955 Search PubMed.
- T. W. Chen, U. Rajaji, S. M. Chen, S. Chinnapaiyan and R. J. Ramalingam, Ultrason. Sonochem., 2019, 56, 430 CrossRef CAS.
- M. M. Foroughi, H. Beitollahi, S. Tajik, A. Akbari and R. Hosseinzadeh, Int. J. Electrochem. Sci., 2014, 9, 8407 Search PubMed.
- G. G. Gerent and A. Spinelli, J. Hazard. Mater., 2017, 330, 105 CrossRef CAS.
- M. Govindasamy, S. Sakthinathan, S. M. Chen, T. W. Chiu, A. Sathiyan and J. P. Merlin, Electroanalysis, 2017, 29, 1950 CrossRef CAS.
- A. Ourari, B. Ketfi, S. I. R. Malha and A. Amine, J. Electroanal. Chem., 2017, 797, 31 CrossRef CAS.
- S. G. Leonardi, D. Aloisio, N. Donato, S. Rathi, K. Ghosh and G. Neri, Mater, 2014, 133, 232 CAS.
- M. Amiri, Z. Pakdel, A. Bezaatpour and S. Shahrokhian, Bioelectrochemistry, 2011, 81, 81 CrossRef CAS.
- M. R. Ganjali, F. Garkani-Nejad, S. Tajik, H. Beitollahi, E. Pourbasheer and B. Larijanii, Int. J. Electrochem. Sci., 2017, 12, 9972 CrossRef CAS.
- H. Wang, Y. Duan, G. Zhao, Z. Wang and G. Liu, Int. J. Electrochem. Sci., 2015, 10, 8759 CAS.
- A. Economou, Sensors, 2018, 18, 1032 CrossRef.
- T. Kondori, O. Shahraki, N. Akbarzadeh-Torbati and Z. Aramesh-Boroujeni, J. Biomol. Struct. Dyn., 2020 DOI:10.1080/07391102.2020.1713893.
- T. Kondori, N. Akbarzadeh-Torbati, M. Dušek and V. Eigner, Chem. Pap., 2019, 73, 1639 CrossRef CAS.
- T. Kondori, N. Akbarzadeh-Torbati and C. Graiff, J. Iran. Chem. Soc., 2019, 16, 1827 CrossRef CAS.
- R. Alizadeh and V. Amani, J. Struct. Chem., 2013, 22, 1153 CrossRef.
- T. Kondori, N. Akbarzadeh-Torbati, K. Abdi, M. Dušek and V. Eigner, J. Biomol. Struct. Dyn., 2020, 38, 236–247 CrossRef CAS.
- M. Lalia-Kantouri, Ch. D. Papadopoulos, M. Quiros and A. G. Hatzidimitriou, Synth. React. Inorg., Met.-Org., Nano-Met. Chem., 2007, 26, 1292 CAS.
- A. J. Bard and L. R. Faulkner, Electrochemical Methods Fundamentals and Applications, Wiley, New York, 2nd edn, 2001 Search PubMed.
- B. G. Mahmoud, M. Khairy, F. A. Rashwan and C. E. Banks, Anal. Chem., 2017, 89, 2170 CrossRef CAS.
- M. Khairy, B. G. Mahmoud and C. E. Banks, Sens. Actuators, B, 2018, 259, 142 CrossRef CAS.
- L. Jiang, S. Gu, Y. Ding, F. Jiang and Z. Zhang, Nanoscale, 2014, 6, 207 RSC.
- F. Tan, J. P. Metters and C. E. Banks, Sens. Actuators, B, 2013, 181, 454 CrossRef CAS.
- T. Madrakian, E. Haghshenas and A. Afkhami, Sens. Actuators, B, 2014, 193, 451 CrossRef CAS.
- M. Tefera, A. Geto, M. Tessema and S. Admassie, Food Chem., 2016, 210, 156 CrossRef CAS.
- C. Martínez-Sánchez, F. Montiel-González and V. Rodríguez-González, J. Taiwan Inst. Chem. Eng., 2019, 96, 382 CrossRef.
- E. Sohouli, F. Shahdost-Fard, M. Rahimi-Nasrabadi, M. E. Plonska-Brzezinska and F. Ahmadi, J. Electroanal. Chem., 2020, 871, 114309 CrossRef CAS.
- S. Tajik, H. Beitollahi, F. Garkani Nejad, K. O. Kirlikovali, Q. V. Le, H. W. Jang, R. S. Varma, O. K. Farha and M. Shokouhimehr, Cryst. Growth Des., 2020, 20, 7034 CrossRef CAS.
| This journal is © The Royal Society of Chemistry 2021 |

