 Open Access Article
Bain and Nishiyama–Wassermann transition path separation in the martensitic transitions of Fe
L. H. Zhanga,
M. J. Chenga,
X. H. Shia,
J. W. Shuai a and
Z. Z. Zhu
 *ab
*ab
aDepartment of Physics, Xiamen University, Xiamen 361005, China. E-mail: zzhu@xmu.edu.cn
bFujian Provincial Key Laboratory of Theoretical and Computational Chemistry, Xiamen University, Xiamen 361005, China
First published on 14th January 2021
Abstract
The importance of martensitic transformations has led to tremendous efforts to explore the microscopic martensitic transition paths. There are five possible transformation paths (for γ → α transition) known for Fe at present, and at an arbitrary activation energy, any of the five paths might be followed. It then becomes considerably difficult to monitor the microscopic phase transition mechanism in experiments. Therefore, it is helpful to realize only one of the paths in a physical process. Based on first-principles calculations, we show that at suitable activation energies the Nishiyama–Wassermann (N–W) transformation path can be realized without the involvement of the Bain path, since the condition ENW(θ) < E < EBain can be satisfied by pure Fe. E is the activation energy of the system, and ENW(θ) and EBain are the energy barriers for the N–W and Bain transformations, respectively. In particular, the potential energy surface (PES) for the N–W transformation has been calculated as being four-dimensional, i.e., E = E(a,b,c,θ), where (a, b, c) are the lattice constants and θ is the shear angle involved in the shear distortion of the N–W path.
1. Introduction
Martensitic transformation (MT), a category of diffusionless or displacive structural phase transitions,1 occurs in various materials as a widespread phenomenon.2–4 Usually, macroscopic strain accompanies the MT, and in many cases, a displacive transformation involves a change in crystal symmetry. MT can be induced by temperature and pressure5–7 and is the foundation of the shape-memory effect and superelasticity.8 Due to their importance in many technological applications, martensitic transformations have been intensely studied.9–19The face-centered cubic (fcc) → body-centered cubic (bcc) phase transformation (i.e., γ → α transition) has been widely discussed as part of the family of martensitic transformations. Among various γ → α transformation paths in Fe, the Bain path (Bain in 1924 (ref. 20)) is the first model proposed to explain the martensitic transformation in steels. Since then, the fcc to bcc transition in pure Fe has been well studied by the Bain path.21–24 However, the Bain transformation could not be employed to explain all the distortions, such as those in high-carbon steels.25 On the basis of the observations made on nickel steels, Nishiyama and Wassermann (N–W) in 1933 and 1934 (ref. 26 and 27) proposed a model which is relatively more complicated with the shear deformation involved. The N–W path will be discussed in details in the present paper. Kurdjumow–Sachs (K–S) in 1930 (ref. 28) developed a new model which relates the compact planes of the fcc phase to those of the bcc phase as well as the compact directions of these planes. K–S is the most often reported orientational relationship (OR) between the parent (fcc) and martensite (bcc) phases and the most representative OR in steels.17 Generally, K–S and N–W models can describe the martensitic transitions in most steels,25 and K–S OR is 5.26° away from the N–W OR.29,30 Pitsch in 1959 (ref. 31) also proposed an OR for the martensitic transformation in Fe–Ni alloys. This relationship was observed between perlite, ferrite and cementite phases in steels. Moreover, Greninger–Troiano (G–T) in 1949 (ref. 32) presented a two-steps homogeneous shear mechanism for the fcc to bcc transformation. The first step undertakes the change in shape, and the second step completes the changes in the crystal structure without macroscopic consequences. The G–T model is used to represent the crystallographic relationship between austenite and granular bainite in some steels. Although several models have been proposed to explore the possible transformation pathways, the microscopic mechanism of the γ → α transition under various conditions is not completely clear. Since any of the five transformation paths might happen (e.g., for fcc → bcc paths for bulk Fe) at an arbitrary activation energy, there exist considerable difficulties in monitoring the microscopic phase transition mechanism in experiments. Therefore, it is helpful to establish conditions for realizing only one of the paths in a physical process.
The calculation of the potential energy surface (PES) is the key factor for studying the transition paths. In a recent molecular dynamics study on the N–W transformation path,15 the PES was only two-dimensional, i.e., E = E(θ,a ∼ b ∼ c), with (a, b, c) were supposed to change in equal proportions. Here, we consider that (a, b, c) can all be independent parameters in the PES calculations, leading to four-dimensional PES. Based on the calculated PES, we show that ENW(θ) < E < EBain can be satisfied by pure Fe, where E represents the activation energy of the system. The satisfied condition indicates that the N–W transformation can happen without the Bain path involved, for definite values of E. Furthermore, smaller changes of atomic volume during the N–W transformation, as compared with those of the Bain path, also suggest that N–W path can be more favored.
2. Theoretical method
The potential energy landscapes in the present work are calculated by using a first-principles method based on the density-functional theory, as implemented in the Vienna Ab initio Simulation Package (VASP).33 The VASP is based on the plane wave basis and the projector augmented wave (PAW) representation.34 The spin-polarized density functional theory and the Perdew–Burke–Ernzerhof (PBE) exchange–correlation energy functional within the generalized gradient approximation (GGA)35 were employed in our calculations. The plane-wave kinetic energy cutoff is 550 eV. The Brillouin-zone integrations are performed by using a k-point sampling mesh of 25 × 25 × 25 generated according to the Monkhorst–Pack method.36 The partial occupancies fnk are calculated by a Gaussian smearing method with a 0.01 eV that determines the width of the smearing. All the present results are based on first-principles calculations which corresponds to zero temperature.3. Results and discussion
3.1 Bain path and Nishiyama–Wassermann path
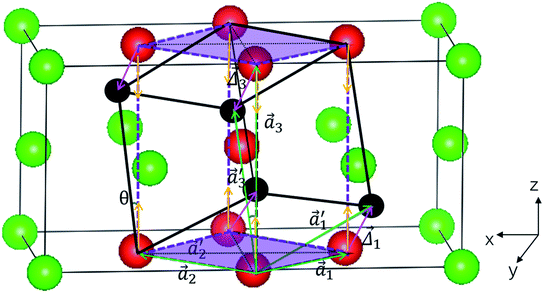
Fig. 1 illustrates the geometries for the Bain and N–W martensitic phase transition paths (fcc → bcc phase transformations) in Fe. For the Bain transformation, the unit cell is demonstrated by dash lines (and atoms in red). The basis vectors of the unit cell are represented by (a1, a2, a3), which gives a body-centered tetragonal (bct) structure. The Bain path, for the γ to α transition, is described by a simple tetragonal deformation along the 〈001〉 (i.e., the z-direction, the yellow arrows). When the γ to α transition along the Bain path is accomplished, the unit cell undergoes a compression about 20% along the z-axis and expansion of about 12% along the x- and y-axis.15,17 The orientation relationships (ORs) in the Bain path satisfy the (001)γ‖(001)α and [100]γ‖[110]α.For the N–W transformation path, the transformation starts with a shear angle θ = 0 and ends at the shear angle of θmax = 19°28′, as shown in Fig. 1. The N–W path is described by the rotation of shear angle θ in the [11![[2 with combining macron]](https://www.rsc.org/images/entities/char_0032_0304.gif) ] direction, which is illustrated by the atoms in red shifted to the positions of atoms in black (see Fig. 1). Such a rotation of the shear angle will produce a monoclinic unit cell in general. However, at θmax = 19°28′, the structure becomes orthogonal again. In other words, the N–W path undergoes the changes of the unit cells from orthogonal (at θ = 0) to monoclinic (0 < θ < 19°28′) and again to orthogonal (at θ = 19°28′) symmetry.
] direction, which is illustrated by the atoms in red shifted to the positions of atoms in black (see Fig. 1). Such a rotation of the shear angle will produce a monoclinic unit cell in general. However, at θmax = 19°28′, the structure becomes orthogonal again. In other words, the N–W path undergoes the changes of the unit cells from orthogonal (at θ = 0) to monoclinic (0 < θ < 19°28′) and again to orthogonal (at θ = 19°28′) symmetry.
The basis vectors of the unit cell during the rotation of θ in the N–W transformation are represented by the unit vectors of  (also see Fig. 1). We can deduce that:
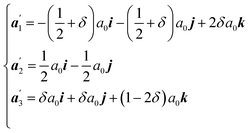 | (1) |
 is then determined by eqn (1). An explicit relationship between δ and θ is derived below.
The basis vectors  can be deduced from
 ,
,  and
and , with Δ1 = −(i + j − 2k)a0δ; Δ2 = 0 and Δ3 = (i + j − 2k)a0δ as required by the N–W transformations.15 (a1, a2, a3) are the basis vectors at θ = 0, which is:
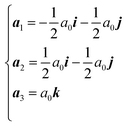 | (2) |
At θmax, the orthogonal symmetry of  indicates that
 ,
,  and
and , therefore, δ = 1/6. From
  , we obtain
 | (3) |
Substituting δ = 1/6 into eqn (3), we can prove that θmax = cos−1(22/3) ≈ 19°28′. In fact, at θ = 19°28′, the orthogonal structure should further relax to the bcc structure, in order to finish the martensitic transformation by the N–W path. The transformation ORs of the parent and product phases for the N–W transformation are (111)γ‖(011)α and [11![[2 with combining macron]](https://www.rsc.org/images/entities/char_0032_0304.gif) ]γ‖[01
]γ‖[01![[1 with combining macron]](https://www.rsc.org/images/entities/char_0031_0304.gif) ]α. Compared with the Bain path, the N–W path is relatively more intricate where a shear deformation is involved. It should be emphasized that Bain path is a special case of N–W path, when shear angle θ = 0.
]α. Compared with the Bain path, the N–W path is relatively more intricate where a shear deformation is involved. It should be emphasized that Bain path is a special case of N–W path, when shear angle θ = 0.
3.2 Martensitic transitions from γ to α: Bain and N–W paths
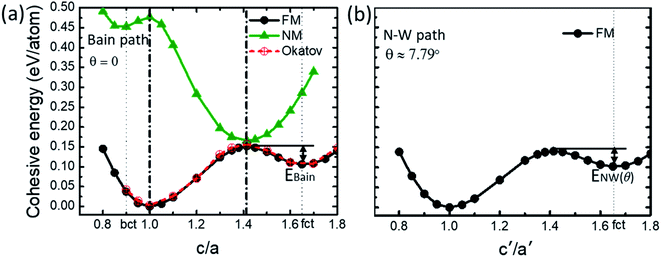
In order to discuss the martensitic transformations for both the Bain and N–W paths, potential energy surfaces (PESs) should be calculated. Since all the calculations in this work are based on first-principles method which accounts for only the physical properties at zero temperature, it is the “minimum energy” path which is decisive for the transformations discussed. For finite temperatures, the energy here can be easily replaced by the free energy, leading to “minimum free energy” path which is then decisive.We first present briefly our results on the Bain transformation. The minimum energy path (MEP) in the Bain transformation is the function of two lattice parameters, i.e., E = E(a = b, c), since the Bain path evolves along a tetragonal distortion of the lattice. In our calculations, we choose E = E(c/a, a = b). Apparently, c/a = 1.0 and  describe the bcc and fcc phases, respectively. Fig. 2a shows the minimum cohesive energies of Fe calculated as the function of c/a for the Bain transformation path for ferromagnetic (FM) and nonmagnetic (NM) states. Two stable structures are found for the Bain path, i.e., one with c/a = 1.0 which is the bcc structure, the other with c/a = 1.65 which is the face-centered tetragonal (fct) structure,22,37–39 for the FM state. It should be emphasized that fcc structure actually corresponds to a saddle point and fct phase corresponds to a minimum energy phase. The martensitic transition from fcc (γ) to bcc (α) phases should be regarded as the transition from fct to bcc (α) ones for the FM state (see Fig. 2a). The energy barriers, EBain, resulting from the Bain deformations are found to be 45 meV per atom for the fct to bcc transition at FM. Two energy minimum structures for the NM state are at c/a = 0.85 (bct) and
  (fcc), respectively. The present results agree very well with the calculations by Okatov et al.22 (also see Fig. 2a), indicating the rationality of the present methodology.
For the sake of clarity, in this paper, (a, b, c) represent the lattice constants when the basis vectors of the unit cell are orthogonal, while (a′, b′, c′) are the lattice constants when the three basis vectors are not orthogonal (for the N–W unit cells). At the shear angles of 0° and 19°28′, (c′, a′) are equivalent to (c, a). For 0° < θ < 19°28′ of the N–W transformation path, the structures of the system are monoclinic. Since the present monoclinic unit cells deviate from orthogonal ones only slightly, in this paper, the system with c′/a′ = 1.0 is named as bcc-like, the system with c′/a′ < 1.0 is named as bct-like. In the same way, fcc-like is for the structure with  and fct-like is for the structure of
  .22,37–39
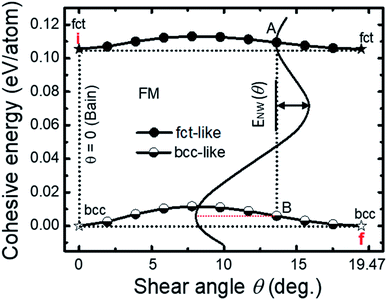
For the Bain transformation path, the MEP has been calculated by the formula E = E(a = b, c). For the N–W path, we calculate the MEP by using E = E(θ,a′,b′,c′), with one key parameter (i.e., shear angle θ) added to the MEP. Therefore, the potential energy landscape of the N–W path here depends on four independent parameters. We now describe how we calculate our potential energy landscape along the N–W path. For calculating E(θ,a′,b′,c′), we first fix the shear angle θ, the unit cell parameters (a′, b′, c′) are then fully relaxed (while the shear angle unchanged) in order to search for the stable structures for the fixed θ. The shear angle θ is then changed by a step of 10% of the total shear angle 19°28′ (i.e., with an increment of 1.947°), and the unit cells (a′, b′, c′) are also fully relaxed at each θ. Thus, the MEP are determined for the N–W transformation path. As an example, results for the cohesive energies E versus c′/a′ at a selected angle θ = 7.79° are shown in Fig. 2b for N–W path and FM state of Fe. It is extremely important to note that two structures with minimum energies can be found for each shear angle θ calculated. That is, for all the shear angles in between 0° ≤ θ ≤ 19°28′, there are two structures with minimum energies, one is bcc-like (i.e., a monoclinic structure with c′/a′ = 1.0), the other is fct-like (i.e., a monoclinic structure with  ). The cohesive energies of Fe for structures with minimum energies versus the shear angle θ are plotted in Fig. 3 for FM state, where two curves appeared (which is vital to the N–W path). Since there are two structures (bcc and fct) with energy minimum for the Bain path (i.e., θ = 0), it is easy to understand that there should also have two structures for θ ≠ 0, when θ deviates from 0° with a small amount.
Based on Fig. 3, we can now describe completely the entire N–W transformation path. For an N–W transformation pathway, the following paths should be undergone: (1) from the initial structure (point i, in Fig. 3) to the fct-like structure (point A); (2) from the fct-like (point A) structure to the bcc-like structure (point B); (3) finally from the bcc-like structure (point B) to the bcc structure (point f). Points A and B correspond to two structures with fct-like and bcc-like geometries, respectively, under the same shear angle θ. The transition from points A to B can be easily calculated by a monoclinic unit cell using the basis vectors shown in eqn (1) with a definite angle θ. For a definite martensitic phase transition, the angle θ where A to B transition happened (see Fig. 3) is determined by the external “forces” applied on the system (e.g., by the temperature and pressure). Results of the transition from points A → B have been shown in Fig. 2b, where an energy barrier ENW(θ) is defined for the N–W path. Here, ENW(θ) is now explicitly defined. A N–W transformation can be explicitly described based on Fig. 3. The N–W martensitic transition in pure Fe can then be calculated by using the first-principles method together with eqn (1).
We can now demonstrate/prove a condition for realizing the fct to bcc transition only by the N–W transformation path without the involvement of Bain path. The condition is ENW(θ) < E < EBain, where E is the activation energy of the system, EBain is the energy barrier for the transition from fct to bcc phases in the Bain path (see Fig. 2a), and ENW(θ) is the energy barrier in the N–W transition from fct-like to bcc-like transformation at the angle θ (see Fig. 2b). It is clear that the energy barrier ENW(θ) should be overcome (E > ENW(θ)) by the system in order to realize the N–W path (from point A to point B in Fig. 3). On the other hand, if E > EBain, both the Bain and N–W transformation pathways could be favored. If E < EBain, Bain path could not happen, while the N–W path could still be favored. In summary, the ENW(θ) < E < EBain is the condition for realizing a N–W transformation path without the Bain path. If no constraints for the activation energy of systems are present, no one can say which mechanism, e.g., Bain or N–W mechanism, is being taken by atoms during the martensitic transformations. That is why the activation energy of the system should be restricted in a region for realizing the N–W path with no Bain path involved. Furthermore, the condition can be written as FNW(θ) < F < FBain for finite temperatures, where F = E − TS represents the free energy.
The energy barriers in the N–W transformation path for Fe, shown as ENW(θ), are given in Fig. 4 as a function of the shear angle θ. The ENW(θ) are presented in relative to EBain, that is, the ENW(θ) − EBain are shown in the figure for each shear angle θ. As mentioned previously, the energy barrier ENW(θ) corresponds to a transition from fct-like to bcc-like structures (which are both monoclinic) at a definite angle θ. From Fig. 4, it is clear that ENW(θ) < E < EBain for realizing only the N–W transformation path without Bain one can be satisfied for Fe FM state. However, it should be emphasized that the relative values of EBain − ENW(θ) are merely of the order of several milli-electron Volt (meV) per atom. Therefore, the activation energy of the system should fall in a very small range (∼several meV), in order to realize only the N–W transformation with no Bain path. Under these circumstances, a proper temperature must be chosen in the experiments and for the molecular dynamics simulations, for achieving only the N–W path (with no Bain).
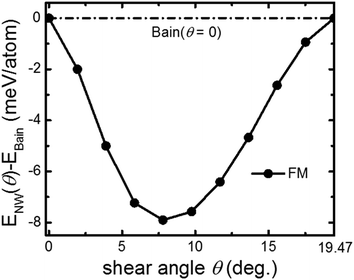 | ||
| Fig. 4 The energy barriers in the N–W path, ENW(θ), are given as a function of the shear angle θ. ENW(θ) are shown in relative to EBain which is marked by a horizontal dashed line. | ||
The evolution of the calculated atomic volumes versus the transformation paths (N–W and Bain paths) for Fe from fct to bcc transitions are shown in Fig. 5, for FM state. That is, Bain path here is described by c/a ratio from 1.65 (fct) to 1.0 (bcc), while the N–W path is described by shear angles θ from 0° to 19°28′. Distinct differences between the atomic volumes for the two paths are visible. Bain path shows significantly larger atomic volumes compared to those of N–W path. The larger changes of atomic volumes during the transformation mean that larger work is required to accomplish the phase transitions.
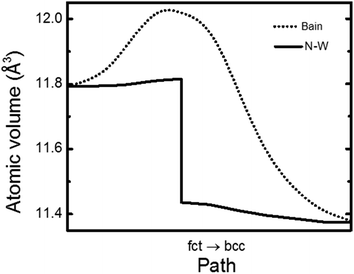 | ||
| Fig. 5 Evolution of the calculated atomic volumes versus the transformation paths (Bain and N–W), from fct to bcc transitions at FM state of Fe. | ||
4. Conclusions
To conclude, the Bain and Nishiyama–Wassermann (N–W) transformations in pure Fe have been calculated by the first-principles method. The potential energy surface for N–W transformation has now been calculated as four-dimensional, i.e., E = E(a,b,c,θ). At each θ, the energy barrier for the N–W transformation, ENW(θ), is determined between a fct-like and a bct-like structures. The present first-principles calculations on pure Fe show that ENW(θ) < E < EBain are satisfied for Fe FM state, suggesting the possibility of realizing only the N–W path without the involvement of Bain path. For the experimental study on a definite transition path, it is essential to realize only one of the possible paths in a single physical process. Although the present study could not separate one path out of all the five possible paths, it is still helpful for understanding of path separation in the martensitic transition of Fe.Conflicts of interest
There are no conflicts to declare.Acknowledgements
This study is supported by the National Natural Science Foundation of China (No. 21761132030) and National Key R&D Program of China under grant No. 2016YFA0202601.References
- X. S. Yang, S. Sun, X. L. Wu, E. Ma and T. Y. Zhang, Sci. Rep., 2014, 4, 6141 CrossRef CAS.
- D. R. Trinkle, R. G. Hennig, S. G. Srinivasan, D. M. Hatch, M. D. Jones, H. T. Stokes, R. C. Albers and J. W. Wilkins, Phys. Rev. Lett., 2003, 91, 025701 CrossRef CAS.
- K. Otsuka and X. Ren, Prog. Mater. Sci., 2005, 50, 511 CrossRef CAS.
- P. M. Kelly and L. R. F. Rose, Prog. Mater. Sci., 2002, 47, 463 CrossRef CAS.
- K. Kadau, T. C. Germann, P. S. Lomdahl and B. L. Holian, Science, 2002, 296, 1681 CrossRef CAS.
- L. Sandoval, H. M. Urbassek and P. Entel, Phys. Rev. B: Condens. Matter Mater. Phys., 2009, 80, 214108 CrossRef.
- J. B. Liu and D. D. Johnson, Phys. Rev. B: Condens. Matter Mater. Phys., 2009, 79, 134113 CrossRef.
- K. Otsuka and T. Kakeshita, MRS Bull., 2002, 27, 91 CrossRef.
- X. Moya, S. Kar-Narayan and N. D. Mathur, Nat. Mater., 2014, 13, 439 CrossRef CAS.
- S. Li, R. Zhu, I. Karaman and R. Arróyave, Acta Mater., 2012, 60, 6120 CrossRef CAS.
- S. Tateyama, Y. Shibuta and T. Suzuki, Scr. Mater., 2008, 59, 971 CrossRef CAS.
- J. Meiser and H. M. Urbassek, AIP Adv., 2016, 6, 085017 CrossRef.
- T. Suzuki, M. Shimono and S. Kajiwara, Mater. Sci. Eng., A, 2001, 312, 104 CrossRef.
- X. S. Yang, S. Sun and T. Y. Zhang, Acta Mater., 2015, 95, 264 CrossRef CAS.
- L. Sandoval, H. M. Urbassek and P. Entel, New J. Phys., 2009, 11, 103027 CrossRef.
- C. Cayron, Acta Mater., 2015, 96, 189 CrossRef CAS.
- C. Cayron, Acta Crystallogr., Sect. A: Found. Crystallogr., 2013, 69, 498 CrossRef CAS.
- L. Sandoval and H. M. Urbassek, Appl. Phys. Lett., 2009, 95, 191909 CrossRef.
- B. Wang and H. M. Urbassek, Phys. Rev. B: Condens. Matter Mater. Phys., 2013, 87, 104108 CrossRef.
- E. C. Bain, Trans. Am. Inst. Min., Metall. Pet. Eng., 1924, 70, 25 Search PubMed.
- I. K. Razumov, Y. N. Gornostyrev and M. I. Katsnelson, J. Phys.: Condens. Matter, 2013, 25, 135401 CrossRef CAS.
- S. V. Okatov, A. R. Kuznetsov, Y. N. Gornostyrev, V. N. Urtsev and M. I. Katsnelson, Phys. Rev. B: Condens. Matter Mater. Phys., 2009, 79, 094111 CrossRef.
- L. Tsetseris, Phys. Rev. B: Condens. Matter Mater. Phys., 2005, 72, 012411 CrossRef.
- K. Wang, S. L. Shang, Y. Wang, Z. K. Liu and F. Liu, Acta Mater., 2018, 147, 261 CrossRef CAS.
- J. M. Vallejos, C. E. Sobrero, M. Avalos, J. W. Signorelli and J. A. Malarría, J. Appl. Crystallogr., 2018, 51, 990 CrossRef CAS.
- Z. Nishiyama, Sci. Rep. Tohoku Univ., 1934, 23, 637 CAS.
- G. Wassermann, Uder den mechanismus der α-γ-umwandlung des eisens, Verl. Stahleisen, 1935, vol. 17, p. 149 Search PubMed.
- G. Kurdjumov and G. Sachs, Z. Phys., 1930, 64, 325 CrossRef.
- S. Tateyama, Y. Shibuta and T. Suzuki, ISIJ Int., 2010, 50, 1211 CrossRef CAS.
- Y. Gotoh and I. Arai, Jpn. J. Appl. Phys., 1986, 25, L583 CrossRef CAS.
- W. Pitsch, Philos. Mag., 1959, 4, 577 CrossRef.
- A. B. Greninger and A. R. Troiano, Metall. Trans., 1949, 185, 590 Search PubMed.
- G. Kresse and J. Furthmüller, Phys. Rev. B: Condens. Matter Mater. Phys., 1996, 54, 11169 CrossRef CAS.
- P. E. Blöchl, Phys. Rev. B: Condens. Matter Mater. Phys., 1994, 50, 17953 CrossRef.
- J. P. Perdew, K. Burke and M. Ernzerhof, Phys. Rev. Lett., 1996, 77, 3865 CrossRef CAS.
- H. J. Monkhorst and J. D. Pack, Phys. Rev. B: Solid State, 1976, 13, 5188 CrossRef.
- G. L. Krasko and G. B. Olson, Phys. Rev. B: Condens. Matter Mater. Phys., 1989, 40, 11536 CrossRef CAS.
- P. M. Marcus, V. L. Moruzzi and S.-L. Qiu, Phys. Rev. B: Condens. Matter Mater. Phys., 1999, 60, 369 CrossRef CAS.
- G. Grimvall, B. Magyari-Köpe, V. Ozoliņš and K. A. Persson, Rev. Mod. Phys., 2012, 84, 945 CrossRef CAS.
| This journal is © The Royal Society of Chemistry 2021 |

