
Exciting clusters, what does off-resonance actually mean?†
Goonay
Yousefalizadeh
,
Shideh
Ahmadi
 ,
Nicholas J.
Mosey
and
Kevin G.
Stamplecoskie
*
,
Nicholas J.
Mosey
and
Kevin G.
Stamplecoskie
*
Department of Chemistry, Queen's University, 90 Bader Lane, Kingston, Ontario K7L 3N6, Canada. E-mail: kevin.stamplecoskie@queensu.ca
First published on 19th November 2020
Abstract
Noble metal clusters have unique photophysical properties, especially as a new class of materials for multiphoton biomedical imaging. The previously studied Au25SR18 exhibits “giant” two-photon absorbance cross sections. Herein, we investigate the origins of the large two photon absorption for Au25SR18, as well as 10 other Au and Ag clusters using femtosecond pump/probe transient absorption spectroscopy (fsTAS). Excited state absorbance (ESA) ubiquitous to thiolated Au and Ag clusters is used herein as an optical signature of two-photon absorbances of the 11 different Au and Ag clusters, which does not require high quantum yields of emission. The large selection of clusters, studied with a single laser system, allows us to draw conclusions on the role of the particular metal, cluster size/structure, and the effects of the ligands on the ability to absorb multiple NIR photons. The use of a laser with a 1028 nm excitation also allows us to investigate the dramatic effect of excitation wavelength and explain why laser wavelength has led to large variances in the non-linear responses reported for clusters to date. We discuss the double resonance mechanism, responsible for giant two photon absorbance cross-sections, helping match properties of metal clusters with experimental conditions for maximizing signal/response in multiphoton applications.
Introduction
Atomically precise clusters, like the extensively studied Au25SR18− superatom, are a class of extremely small (<2 nm) metal nanomaterials. Clusters have exact numbers of metal atoms and structures have been determined completely by mass spectrometry and X-ray crystallography for a large and growing library of stable compounds. Owing to their extremely small size, metal clusters have unique optical and electronic properties that can be tuned broadly with even minor structural variation.1–5 These unique properties have made clusters an exciting new class of materials for solar energy harvesting, catalysis, photocatalysis, biomedical imaging and phototherapies.The X-ray structures of several clusters are shown in Fig. 1, including: Au18(CyHT)14, Au25(PET)18, Au38(PET)24 and Ag25(Me2PhS)18. The linear optical properties, and excited state behaviour of each of these clusters have been previously studied.6–10 Au18 clusters are known to adopt two different structures depending on the type of stabilizing ligands, where this minor variation leads to drastic differences in absorbance, emission, and excited state properties.9,11,12 Au18 clusters also have some of the highest emission quantum yields (QY) reported, with captopril stabilized Au18 having one of the highest known QY of any thiol stabilized gold cluster.13 Glutathione stabilized gold clusters are also well known to have relatively high emission QYs, and show good stability in vitro for imaging, and for this reason have been included in the present study.13–16
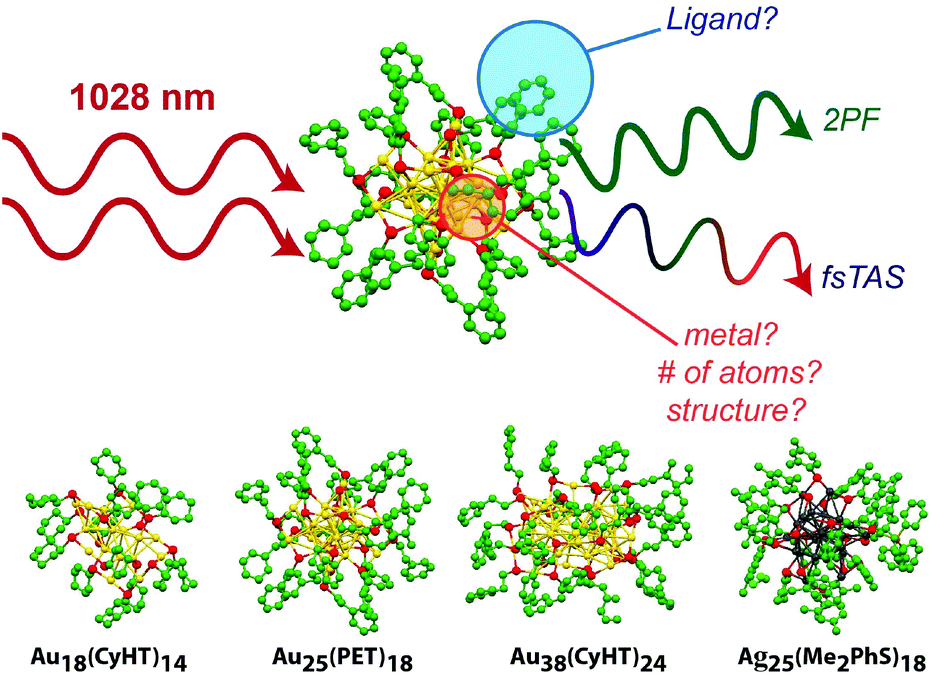 | ||
| Fig. 1 Illustration of non-linear optical properties of clusters and how they are affected by structure for Au18(SR)14, Au25(SR)18, Au38(SR)24, and Ag25(SR)18 adapted from ref. 6–10. | ||
Much larger nanostructures, like Au and Ag nanorods, wires, plates and spheres, with dimensions >2 nm, have been investigated extensively over the past two decades for biomedical imaging and phototherapy. That work has born major concerns, especially related to the size dependent toxicity of larger nanoparticles and inherent polydispersity in samples used, even in clinical trials.17 The atomic precision of metal clusters (polydispersity index = 1) makes them better treatment candidates, much like conventional drugs that have exact molecular compositions.
One of the most exciting and unique properties of thiol stabilized Au and Ag clusters is the giant two photon absorbance (2PA) cross sections that have been reported. The [Au25SR18]− superatom has been reported to have larger 2PA cross-sections (able to more effectively absorb low energy, near infrared light) than any organic dye molecule ever reported!18,19 While cluster research is very rapidly transitioning into biomedical imaging, the question arises of how their non-linear optical properties (NLOP) may be affected by size and composition. The reports of “giant” two photon cross sections vary by orders of magnitude. One of the major motivations for the present work is to directly compare a larger library of clusters with one laser system, allowing for more consistency of the optical measurements and a reliable comparison. Most reports on clusters to date focus on second harmonic generation (SHG), two photon fluorescence (2PF), and even higher order non-linear effects.18–20 For example, Au25(H13C6S)18 clusters have been reported with cross section of 2700 GM (see discussion on Goppert–Mayer units below) using 1290 nm excitation, and an amazing 427![[thin space (1/6-em)]](https://www.rsc.org/images/entities/char_2009.gif) 000 GM using 800 nm excitation, both reported from a 2PF technique.18 These high 2PA cross section materials are particularly attractive for non-linear excitation, enabling deep tissue penetration for biomedical imaging.18,21
000 GM using 800 nm excitation, both reported from a 2PF technique.18 These high 2PA cross section materials are particularly attractive for non-linear excitation, enabling deep tissue penetration for biomedical imaging.18,21
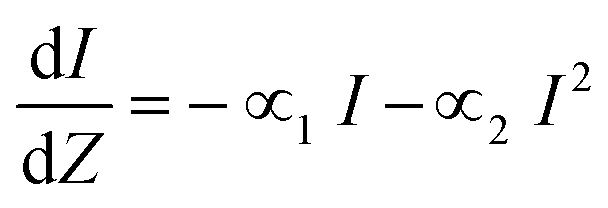
The high degree of tunability of linear optical properties of clusters begs the question; how does the structure of clusters affects other non-linear properties? 2PA is a third order optical susceptibility (χ3) process where two photons of equal energy are simultaneously absorbed, resulting in an excited state of energy equal to that of the sum of the two photons. Giant non-linear absorbances for clusters have been explained as a resonance effect, where electronic excitation is achieved through simultaneous absorbance of two photons that can be achieved by linear absorbance of photons of half the wavelength (twice the energy). For this mechanism it is important to ensure that the linear absorbance spectrum of clusters show significant absorbance at half of the wavelength of the laser used in non-linear excitation experiments. The common metric for evaluating the ability of a molecule to absorb two photons for non-resonant excitation is the ‘two-photon cross-section’ (δ2PA). In general, the propagation, of light of intensity I, through a material of thickness Z with 1PA and 2PA is written as:22
 | (1) |
Little work has been done to understand the effects of cluster size (i.e. number of Au atoms), choice of metal, or even the effects that ligands have on the non-linear optical properties of clusters.14,18,23 To this end, this work investigates the structure-dependent non-linear optical properties of a series of thiol stabilized gold and silver cluster (11 different clusters in total). We have used the transient absorption signature of clusters recorded with an ultrafast pump/probe spectrometer to determine the cross section for two photon absorption. This method allows one to monitor the excited state absorbance common to most clusters, which is directly proportional to concentration of the excited state and does not rely on a high emission quantum yield required for techniques like 2PF.
Some unexpected behavior is observed for clusters like Au18SR14, and most importantly, we are able to highlight some of the best candidates for biomedical imaging and suggest structural features to consider for future studies.
Results and discussion
Steady-state linear optical absorbance characteristics
Absorbance spectra for Au25(SR)18 clusters stabilized with phenylethane thiol, glutathione, captopril, and dimethyl benzenethiol are each shown in Fig. 2a. The absorbance features at ∼400–450 nm have been ascribed to ligand-to-metal charge transfer transitions and ∼680–700 nm are attributed to metal–metal electronic transitions of the core of these clusters.24 It is possible to synthesize Au25(SR)18 clusters with multiple different charge states. Negatively charged Au25(SR)18− is the most stable, closed-shell, superatom structure. A minor absorbance feature at ∼780 nm is indicative of clusters in the negative one charge state. Fig. 2a shows that all the synthesized Au25(SR)18 clusters in this study are negatively charged except Au25(GS)180, where the absence of the 780 nm absorbance feature indicates a neutral cluster.25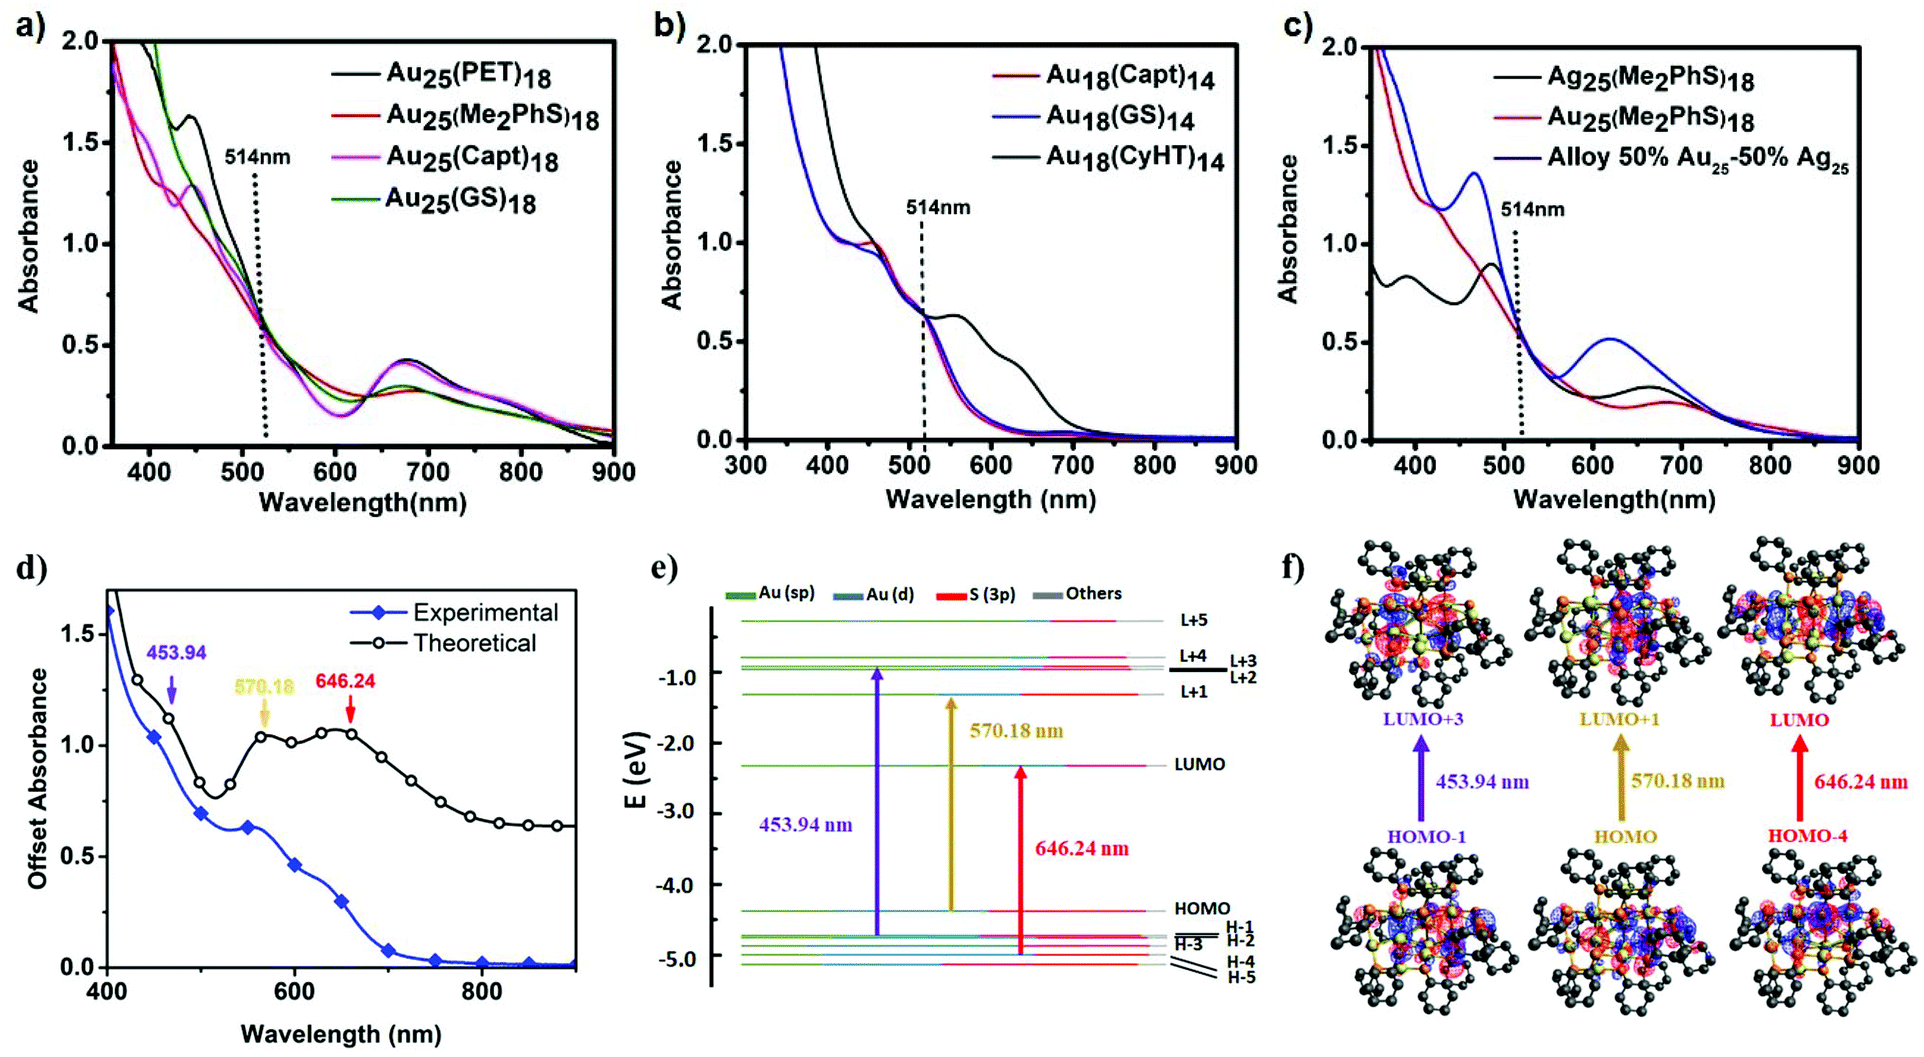 | ||
| Fig. 2 Absorbance spectra of (a) Au25 clusters, (b) Au18 clusters, and (c) Au25, Ag25, and alloyed clusters; each with matching absorbance at 514 nm for 2PA experiments. (d) Off-set simulated and experimental absorbance spectrum of Au18(CyHT)14 cluster, (e) Kohn–Sham orbital level diagram and components of each orbital for Au18(CyHT)14 clusters, and (f) frontier molecular orbitals for Au18(CyHT)14. | ||
The absorbance spectra for Au18(SR)14 clusters stabilized with glutathione, captopril and cyclohexanethiol are shown in Fig. 2b. The electronic absorbance features for Au18(GS)14 and Au18(Capt)14 are very similar (having two distinguishable peaks at ∼460 and ∼510 nm). However, when stabilized by cyclohexanethiol, the lowest-energy transitions for Au18(CyHT)14 is red-shifted by ∼100 nm. It has been theoretically shown that the dramatic difference in absorbance spectra of Au18SR14 clusters arises from differences in crystal structures.9,13,26 In order to support the experimental absorbance spectrum for this cluster, the frontier orbital energies of the cluster were calculated and used to simulate an absorbance spectrum (Fig. 2d–f). The simulated spectrum is an excellent match to experimental absorbance where the low energy transition (646 nm) is a HOMO−4 → LUMO transition, and has significant ligand contribution. A set of frontier orbitals and the molecular orbitals involved in the major electronic transitions are also provided.
In order to provide comparable optical densities for two photon excitation all clusters solutions were prepared with matched absorbance at 514 nm (2× the energy of the 1028 nm excitation). When comparing the non-linear response of similar clusters, i.e. Au25SR18 clusters, this also helps provide a better comparison with presumably similar excited states being generated by excitation.
Non-linear optical absorbance characteristics
The experimental set-up for 2PA measurements is shown in Scheme S1 in the ESI.† Several works have recently reported the 2PF of clusters and/or second harmonic generation (SHG),18,27–31 however, transient absorption as a measure of two photon excitation is far less common.18,28 Herein, using a pump–probe spectrometer, we are able to monitor 2PA of different sizes of clusters, to elucidate the 2PA cross sections and power thresholds; important factors in evaluating which clusters are optimal for biomedical imaging.Clusters were excited off resonance with 250 fs FWHM pulses of 1028 nm excitation, and the power dependences of induced absorbances (excited state absorbance spectra) were recorded. Importantly, the clusters herein do not have any appreciable linear absorption at wavelengths greater than 900 nm. However, matched absorbances at half of the incident photon wavelength (514 nm) for all samples were used in accordance with the resonance mechanism described above. Above the threshold for two-photon absorbance, characteristic excited state absorbance spectra and dynamics are observed. As an example, Fig. 3b illustrates the excited state absorbance behaviour for Au25(Me2PhS)18 including a broad induced absorbance spectrum overlapped with a bleach of the ground state absorbance typically observed for direct (linear) excitation of these clusters. The induced absorbance decays with a two component relaxation having characteristic lifetimes <5 ps and >200 ns, also typical of the excited state behaviour of 25 atom gold clusters.13,25,32–34 To illustrate that the same excited state is achieved through either low energy linear absorbance (514 nm excitation) or off-resonance 2PA, matching observed behaviour with 514 nm excitation is shown in the ESI.†
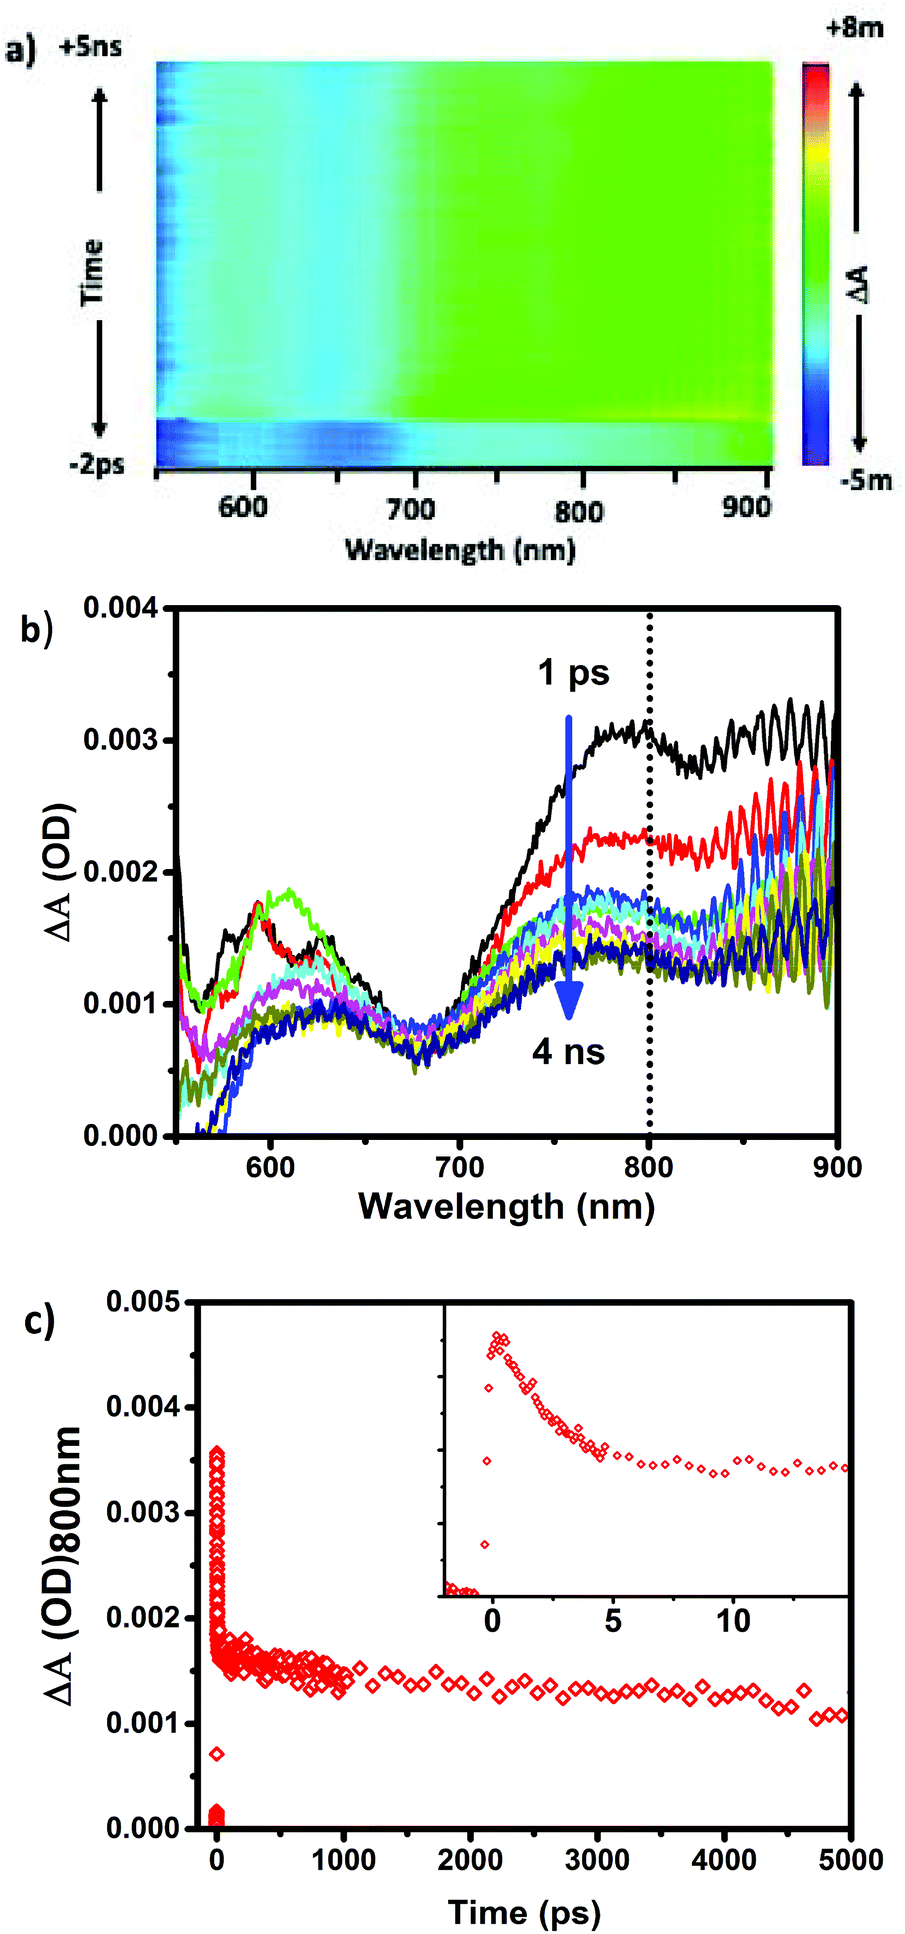 | ||
| Fig. 3 (a) 3D transient absorption surface for Au25(Me2PhS)18 obtained with 1.4 mJ per pulse of 1028 nm laser excitation, (b) Transient absorption spectra between 1 ps–5 ns following 2PA, and (c) kinetic trace for the induced absorbance at 800 nm (inset shows the same data over a shorter timescale to illustrate the short lifetime component). | ||
The excited state absorbance characteristics of additional clusters studied herein are described in detail in the ESI (Fig. S2 and S3†). Importantly, the optical absorbance features observed through non-linear excitation with 1028 nm light matches known behaviour for linear excitation of all of the clusters, including broad induced absorbance spectra spanning the visible region of the spectrum for each cluster sample. The ESA immediately (<1 ps) following 2PA femtosecond excitation was monitored. In other words, the excited state absorbance, which is directly proportional to the concentration of excited states, is used here to report on the relative excitation of each of the clusters and recorded for a range of laser powers. The ESA as a function of laser power for Au25SR18 clusters is presented as log–log plots in Fig. 4, where the slope of a linear fit in all cases is within experimental uncertainty equal to 2.0, indicative of two photon absorbance as the excitation mechanism.18,35–37 For all negatively charged Au25 clusters, Au25(SR)18−, a strong ESA signal is observed, (see Table 1 for δ2PA values). However, the δ2PA was much lower for neutral Au25(GS)180, making it challenging to even monitor the induced transient absorbance. Asymmetry is often an important factor for high cross-sections for two-photon absorbance.21 The single crystal X-ray structures of the anionic Au25 shows distortions as compared to neutral Au25.5,38,39
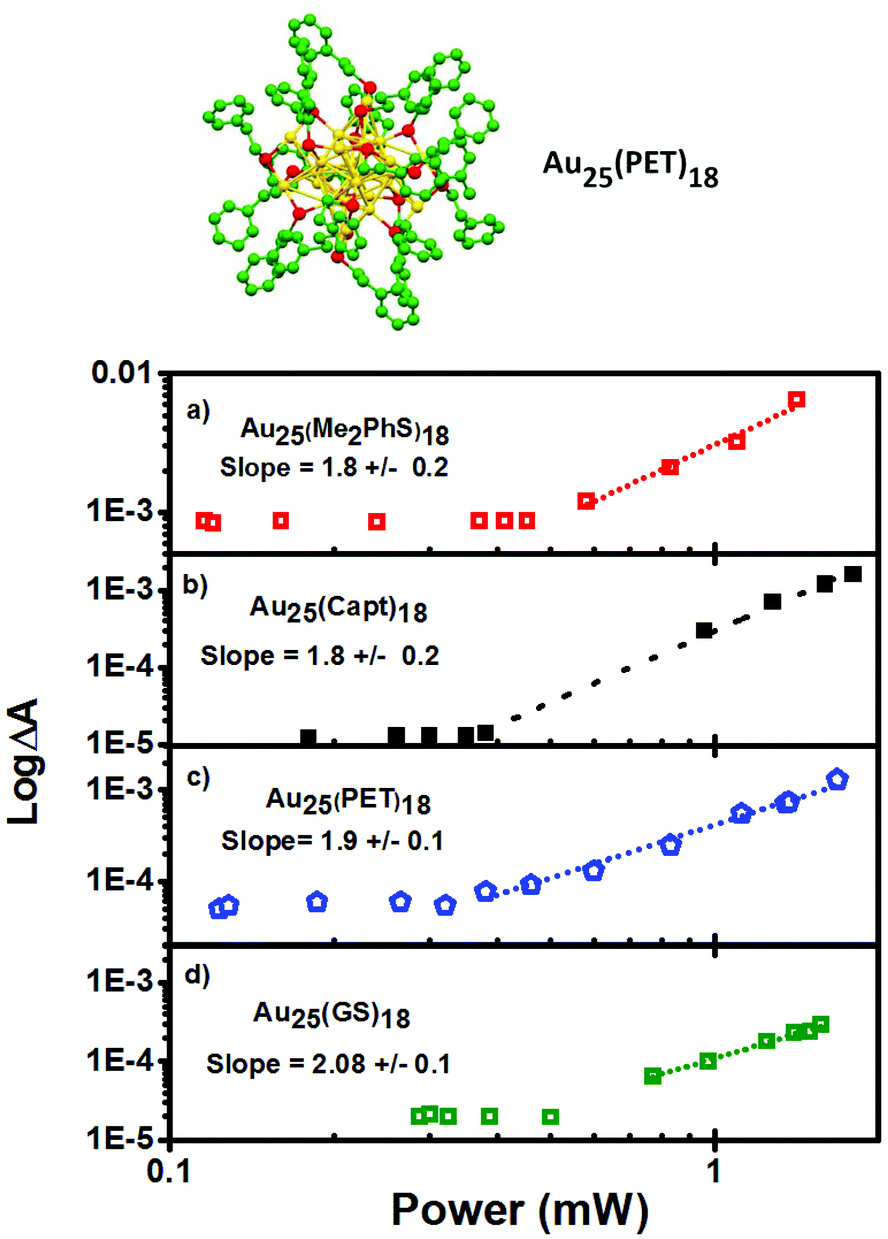 | ||
| Fig. 4 Crystal structure of Au25(PET)18 from 9. Two-photon absorption response of (a) Au25(Me2PhS)18, (b) Au25(Capt)18, (c) Au25(PET)18, and (d) Au25(GS)18 excited with 1028 nm pulsed laser light. The dotted lines show a slope of 2 that illustrates two photon absorption is happening. All samples have matched absorbances at 514 nm. | ||
| Cluster | Power threshold (10−5 mW cm−2) | δ 2PA (GM) |
|---|---|---|
| a Value obtained from ref. 18 and 20. b Value obtained from ref. 44. | ||
| Au25(Me2PhS)18 | 1.81 | 4520 |
| Au25(Capt)18 | 2.12 | 668 |
| Au25(PET)18 | 2.29 | 624 |
| Au25(GS)18 | 2.39 | 164 |
| Au18(CyHT)14 | 2.27 | 507 |
| Au18(GS)14 | 2.23 | 13.0 |
| Au18(Capt)14 | 2.71 | 92.2 |
| Ag25(Me2PhS)18 | 2.05 | 1300 |
| 50:50 Ag:Au Alloy |
1.91 | 2260 |
| Au38(PET)24 | 1.14 | 39300 |
| Au25 | — | 2700 427000a |
| Ag29 | — | >1000b |
A key feature of Au25(GS)180 is a center of inversion in the icosahedron structure and a high degree of symmetry, which is lost/distorted for Au25(RS)18−.40 Furthermore, the longest wavelength absorbance feature for negatively charged clusters, with a maximum at 780 nm, has a broad absorbance, tailing to the NIR and coming closer to resonance with the excitation wavelength for negatively charged clusters only. Therefore, we attribute the anomalously low δ2PA for Au25(GS)180 to the unique geometric and electronic structure as compared with negatively charged analogues.38 This finding highlights the role of ligand on δ2PA. Ligands not only affect the structure which influences the symmetry and subsequently the 2PA intensity but also the electronic structure, meaning there will be more charge-transfer character with the electron-donating ligands, an important factor in achieving high 2PA cross-sections.
Emission quantum yields for thiol stabilized AuxSRy with 18–25 Au atoms can be readily tuned between ∼0–6.8%, either with the number of metal atoms and/or by the choice of thiol ligand.12,41 Emission is one example of the high degree of tunability in properties that clusters offer through controlling structural compositions. Expanded to non-linear properties here, a goal of this work is to elucidate the effects of ligand type and cluster size on the δ2PA. Au18(SR)14 exhibit some of the highest emission quantum yields for gold clusters, especially Au18(Capt)14 with a record PLQY of 8.6%, 100 times brighter than the Au25 analogue!13 Therefore, the investigation of δ2PA for Au18(SR)14 clusters was performed, including Au18(GS)14, Au18(Capt)14, and Au18(CyHT)14, as they are some of the most promising candidates for bioimaging and therapeutic applications.
Similar to Au25 clusters, we are able to detect characteristic transient absorption signals for the Au18(SR)14 series. In the same fashion as Fig. 4, log–log plots of the power dependence on the excited state absorbance are presented for Au18(SR)14 clusters in Fig. 5, and the results are summarized in Table 1.
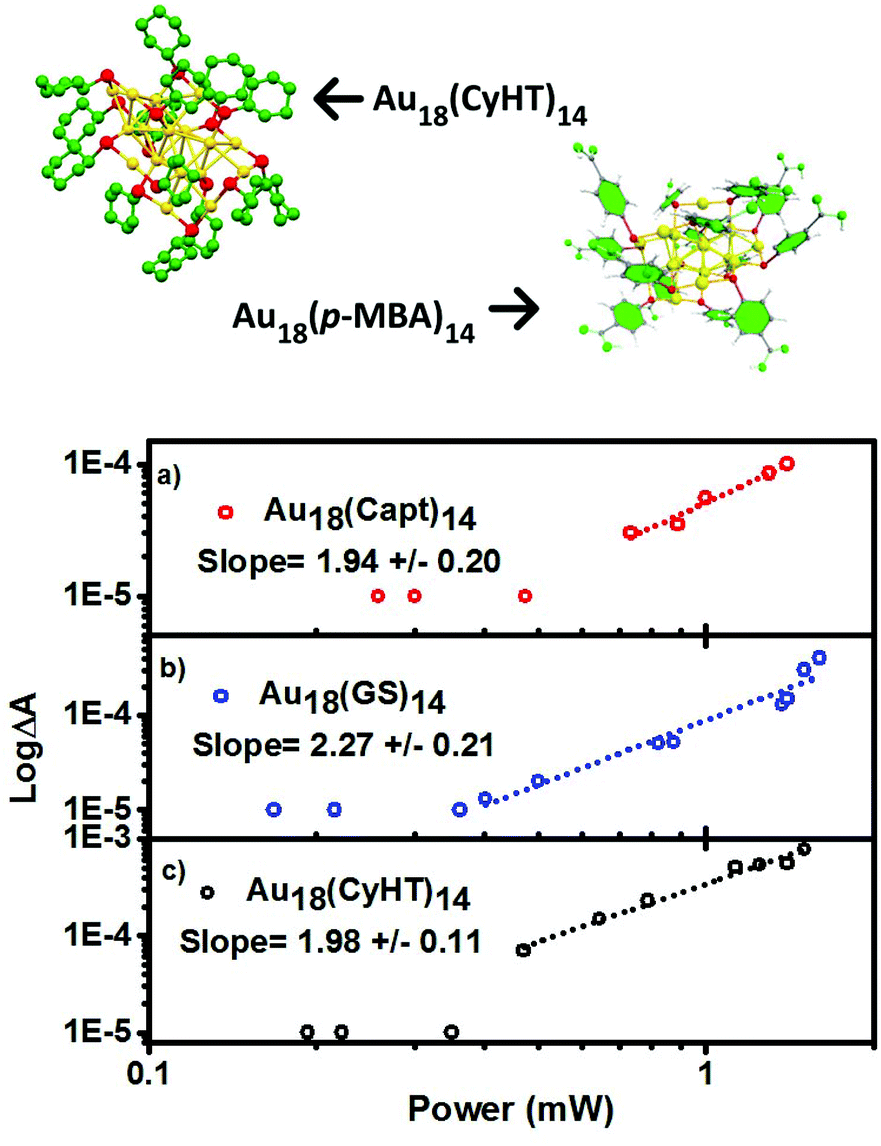 | ||
| Fig. 5 Top: Crystal structure of Au18(p-MBA)14 and Au18(CyHT)14 from 7. Two-photon absorption response of (a) Au18(Capt)14, (b) Au18(GS)14, and (c) Au18(CyHT)14 excited with 1028 nm pulsed laser light. All samples have matched absorbances at 514 nm. | ||
Au18(SR)14 is electronically and structurally very different than Au25SR18. For example, Au18(SR)14 is not a superatom, whereas Au25 is. The superatom theory is developed with spherical clusters which follow magic number rule:
| n* = NVA − M − z | (2) |
There are two reported structures for Au18(SR)14 that vary depending on the nature of the ligand used, neither of which is highly symmetrical.9,11,26 One might expect these clusters to have a large cross section for 2PA. However, based on non-linear absorbance alone Au18(SR)14 clusters are not among the best candidates for biomedical imaging by 2PA, especially for the aqueous soluble clusters with captopril and glutathione as stabilizing ligands; 1–2 orders of magnitude lower than the best Au25(Me2PhS)18. The origin of this large difference in two photon cross-sections is due to the double resonance mechanism that is discussed below. Of course, 2PA is only one factor in identifying the best candidates for fluorescence imaging (see discussion on ‘optimal clusters for biomedical imaging as well below).
Ag is approximately one order of magnitude more polarizeable than Au, as an atom, in bulk metallic form, and as a nanoparticle.29,31,43 These properties make silver a better light absorber and a great candidate for photonics applications like photocatalysis. To determine the effect of metal composition on 2PA cross section a series of M25SR18 clusters were subjected to the same investigations as Au25SR18 and Au18SR14 above. Included are Ag25(Me2PhS)18 and Au25(Me2PhS)18 and an alloy cluster comprised of a 50:50 ratio of the two metals. In order to rule out the effect of ligands dimethylbenzenethiol is the ligand in each case. The excited state absorbance spectra and dynamic behaviour is described in detail in the ESI (Fig. S4†), and log–log plots of ΔA vs. laser power are shown in Fig. 6. Cross sections for 2PA and thresholds for the onset of 2PA are also summarized in Table 1.
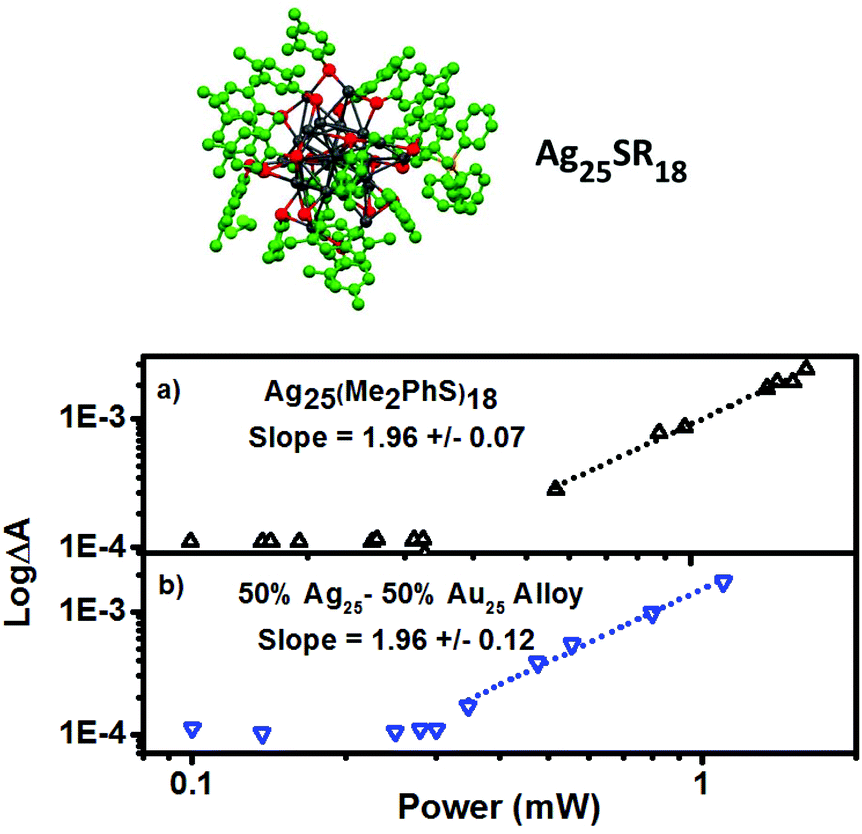 | ||
| Fig. 6 Top: Crystal structure of Ag25(Me2PhS)18 from 10. Two-photon absorption response of (a) Ag25(Me2PhS)18, and (b) 50:50 alloy of AuxAgy(Me2PhS)18 (x + y = 25) excited with 1028 nm pulsed laser light. All samples have matched absorbances at 514 nm. | ||
Surprisingly, the cross-section for 2PA for M25(SR)18 clusters shows a minor trend with a negative correlation with Ag content. The clusters in this series have some of the largest non-linear responses to 1028 nm excitation of the clusters studied, suggesting that the M25SR18 structure is great for achieving 2PA and that dimethylbenzenethiol is a good ligand for inducing non-linear response. Somewhat surprisingly, however, is that Ag does not lead to stronger non-linear response. Recent theoretical studies have confirmed that the δ2PA is proportional to the linear absorbance (twice the photon energy) and to the polarizability of the metal atoms.29,44 In fact, for clusters a correlation has been found where the δ2PA per metal atom is the same across clusters, and that it matches well with the per atom response in larger nanomaterials and bulk metal.18 Ag is approximately 8× more polarizable than gold, leading to larger extinction coefficients for linear absorbance for M25SR18 clusters and plasmon absorbances in metal nanoparticles. However, one of the most important finding here is that this trend is reversed for the non-linear response, where Au more readily absorbs two photons than Ag. The minor blue shift of the onset of absorbance maybe a contributing factor in the lower cross section for silver, as the HOMO–LUMO gap is farther from resonance with 1028 nm light. From the selection of clusters studied above, utilizing nonsymmetric clusters like the Au18 series, and using more polarizable metals like Ag, surprisingly does not lead to better two-photon absorbance for clusters under 1028 nm excitation. So, what then is the governing factor in achieving giant two-photon cross-sections? The giant δ2PA reported for Au25SR18 have been attributed to a ‘double resonance effect’,19,23,27,45 where two photon excitation is typically performed with 800 nm excitation (see Scheme 1).18 This effect is very similar to resonance enhanced multiphoton ionization (REMPI), which has been studied and used for decades to enhance analyte detection in mass spectrometry.46–48 For multi-photon excitation, ‘resonance enhanced’ can refer to either a real or virtual state with an electronic transition that is energetically on resonance with the excitation wavelength.45,48 In other words, a material that has no absorbance at the laser wavelength, but with an unoccupied electronic state above the HOMO that is close in energy to the laser wavelength, can show significantly enhanced two-photon absorbance. The “double resonance” effect reported for Au25 is illustrated in an energy level diagram in Scheme 1 for 800 nm excitation. In previous studies of multiphoton excitation of clusters, the exact laser wavelength is important because 800 nm corresponds to the band edge for linear excitation for a HOMO–LUMO transition in Au25SR18 (albeit to low probability transitions with small extinction coefficients at 800 nm).
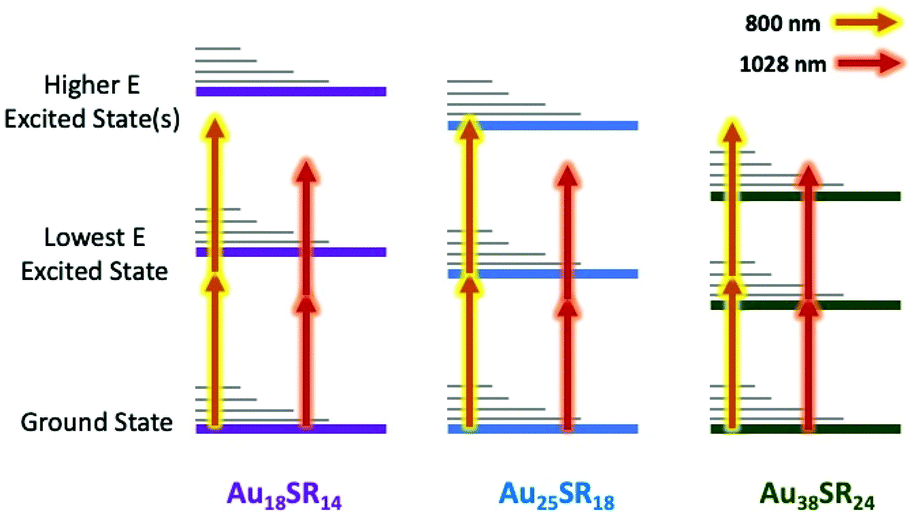 | ||
| Scheme 1 Illustration of the double resonance mechanism responsible for giant 2PA with 800 nm laser light for Au25SR18 and both 800 nm and 1028 nm laser light for Au38SR24. Au18SR14 cluster does not show giant 2PA with any of the excitations (800 nm and 1028 nm). | ||
In the present study, we use a 1028 nm excitation source, which is too low in energy to directly excite any of the clusters (except Au38 below), and therefore, completely eliminates the double resonance effect. This is the reason that we observe lower δ2PA than other reports for Au25(SR)18 and our frontier orbital calculations for Au18(SR)14 clusters show that there are not states that could provide real or virtual transitions at 800 nm, and certainly not at 1028 nm. It is further evidenced by the fact that we observe no ESA for any of the above clusters studied with laser fluences less than a threshold of excitation power required for 2PA. When considering the Au25/Ag25 and Au18 series, the exact electronic structure of the cluster is also very important. Ag25, alloys of Au/Ag, and Au18 all have significantly larger bandgaps than Au25. In other words, the HOMO–LUMO transitions are farther off-resonance for all of these clusters than Au25, explaining the anomalously low two-photon cross sections for these clusters, even with structural features that can help multiphoton interactions. These resonance and double resonance effects are illustrated in Scheme 1.
As further evidence of the importance of the double resonance effect on the δ2PA of cluster, we have also determined the linear, and non-linear responses of phenylethanthiol stabilized Au38(PET)24 under 1028 nm excitation. Fig. 7a shows the UV–Vis absorbance spectrum of this cluster with a characteristic series of absorbance features at 490, 510, 570, 620, 520 and 750 nm. Due to detector limitations of the spectrometer we were not able to monitor the absorbance at wavelengths greater than 1000 nm, however, this cluster is known to exhibit electronic transitions in the NIR with lower extinction values (centred at ∼1050 nm).8,49 At lower powers (below the required power threshold for 2PA, (1.15 × 10⁻⁵ mW cm−2 for Au38(PET)24), the observed ESA is a result of 1PA, and the slope of ∼1 for the logΔA vs. logP plot supports this observation. Above the threshold for 2PA, however the slope changes to ∼1.5, indicative of contributions from both 1PA and 2PA.
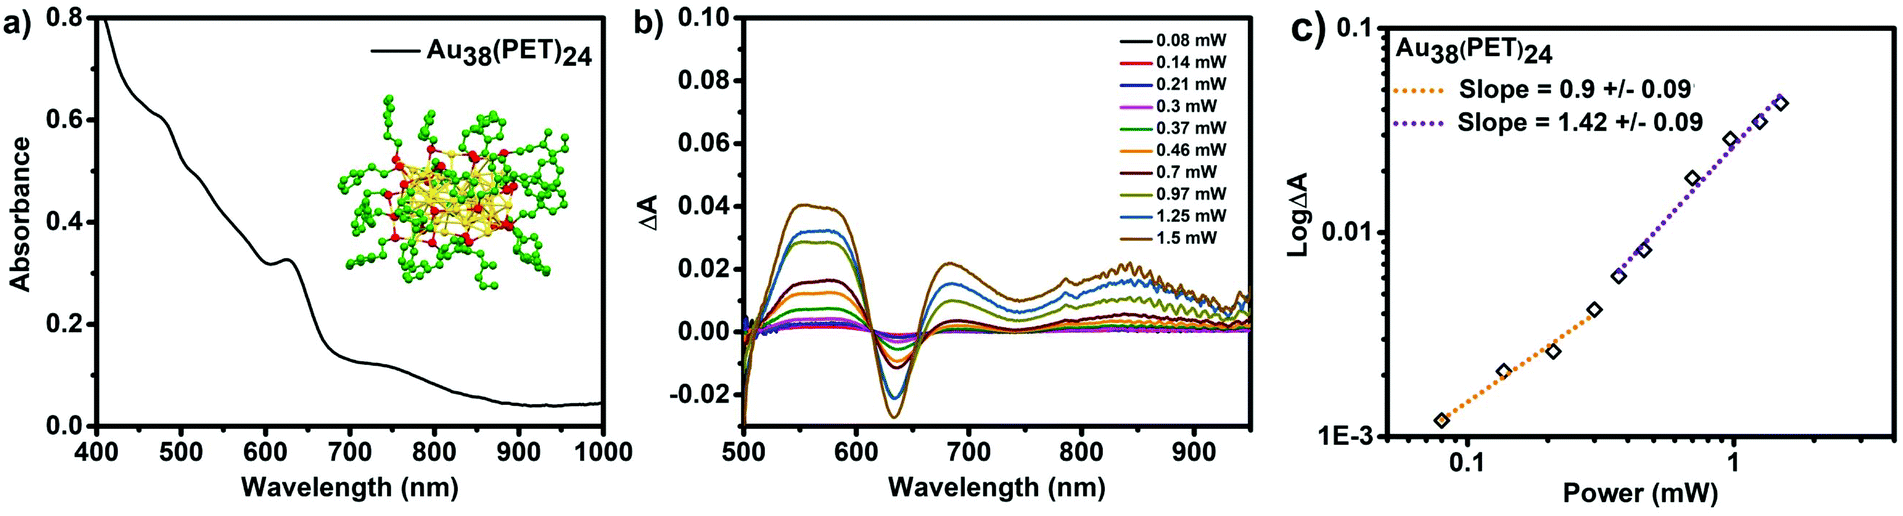 | ||
| Fig. 7 (a) Absorbance spectrum of Au38(PET)24 and crystal structure of Au38 adapted from 8, (b) transient absorbance spectra 1 ps after excitation, recorded at different laser powers as indicated, excited with 1028 nm pulsed laser light, and (c) dependence of the magnitude of ΔA as a function of laser power (dotted lines are linear fits above and below the two photon threshold of 1.15 × 10⁻⁵ mW cm−2. | ||
The δ2PA that is determined for Au38(PET)24 is 39300 GM, a δ2PA that is orders of magnitude higher than any other cluster studied herein. Only with this cluster that absorbs 1028 nm light are we able to observe a “giant” two photon absorbance. This result is in complete agreement with the double resonance mechanism because the cluster has a resonant electronic transition at the excitation wavelength.
Optimal cluster(s) for biomedical imaging
Thiol protected metal clusters have been proposed for biomedical imaging, with few preliminary reports using this emerging material in cell studies.14,50 The present study shows, regardless of the choice of ligands and metal/structure, that non-linear absorbance is a general feature of Ag and Au clusters. In fact, any of the clusters listed in Table 1 are potential candidates for non-linear photonics applications.What the present studies highlights is the importance of matching the electronic structure of clusters with the laser to be used in multiphoton excitation. An 800 nm laser is appropriate for clusters that have a resonant transition near that wavelength, such as Au25. However, Au18 clusters and alloys, which have higher emission quantum yields, should be matched with a laser of higher energy (i.e. a 633 nm HeNe laser), to obtain similarly high δ2PA. For clusters with very small HOMO/LUMO energy gaps, like Au38, a 1028 nm Yb laser is sufficient to elicit giant δ2PA.
From the power thresholds and cross-sections for 2PA alone, Au25(Me2PhS)18 might be considered a strongest candidate as a contrast agent for biomedical imaging. The story is of course more complicated; Au25(Me2PhS)18 is not water soluble, or compatible with biological media and does not have a relatively high emission quantum yield. In fact, emission quantum yield is a critical factor for biomedical imaging, and so the quantum yields of each of the clusters is also listed in Table 1. Au18 clusters are some of the most emissive clusters isolated to date. Despite the slightly lower response for 2PA, these clusters are much more emissive than the Au25 series. In fact, within the Au18 series, the non-linear response and quantum yields both follow the trend Au18(CyHT)14 < Au18(GS)14 < Au18(Capt)14 suggesting that Au18(Capt)14 is the most optimal candidate for biomedical imaging. The use of silver, or incorporation of silver provides higher emission quantum yields, but at the cost of non-linear response, at least for dimethylbenzenethiol stabilized clusters. Atomically precise clusters can provide an alternative to biomedical imaging with nanoparticles. They offer the advantage of exact composition, alleviating many of the concerns with the size dependent toxicity of nanoparticles.14,51,52 In order to realize an optimal material for imaging, clusters with the best optical properties will also need to be stable in biological media, able to target specific tissue, show favourable properties in toxicity studies, and much more. Furthermore, the field of biomedical imaging and therapy is progressing rapidly, the combination of these techniques which is at the cutting edge is referred to as Theranostics. Clusters are active as photocatalysts and may provide unique opportunities for therapies not attainable with other materials. The present study may serve as a starting point, or to provide insight when choosing clusters for biomedical imaging and other photonics applications.
Conclusion
Clusters are attracting attention as biomedical imaging agents since they show non-linear absorbance behaviors far exceeding that of organic dyes. We have demonstrated that transient absorption spectroscopy can be a useful tool to study 2PA of metal clusters, especially as it does not rely on large emission quantum yields. In this work, taking advantage of the structural dependence optical properties of clusters, we have studied the role of size, ligand and the metallic core on 2PA. Most importantly, from the large selection of clusters studied herein, it is shown that the electronic structure of clusters is extremely important in dictating the 2PA response and that a careful match between electronic structure and laser wavelength is critical to achieving giant 2PA.Experimental
Synthesis of Au25 clusters
AuHCl4·3H2O, phenylethanethiol, dodecanethiol, dimethylebenzenethiol, captopril and cyclohexanethiol were purchased from Sigma Aldrich and glutathione was purchased from Acros Chemical Co. These reagents were used without further purification. Omnirad 2959 (former irgacure 2959) was provided by IGM resins Co. Omnirad 2959 and was recrystallized before being used.Thiolated stabilized Au25(SR)18 clusters are synthesized using different methods, depending on the exact choice of ligand.53–55 Au25Glutathione18 clusters were synthesized using Omnirad 2959 as the photochemical reducing agent, according to our previously reported photochemically method.24 In a typical synthesis 3.8 × 10⁻³ M HAuCl4 and 9.5 × 10⁻³ M glutathione aqueous solutions were prepared. These two solutions were mixed by sonication and deoxygenated with N2 gas. The conversion of Au3+ to thiolate coordinated Au+ can be followed by colour changes from yellow to colourless.54 Next, 9.5 × 10⁻³ M Omnirad 2959 was added to the solution and the pH was adjusted to 11. The reaction was then irradiated for two hours using four UVA lamps. In our previous study the formation of Au25(GS)18 clusters, using the same method has been confirmed by mass spectrometric analysis; Fig. 2a (green trace) illustrates the absorbance spectrum of these clusters.24 In a previous work, the atomically precise synthesis of these clusters has been confirmed by mass spectrometric analysis.24
Au25 clusters protected by phenylethanethiol and dodecanethiol (Au25(PET)18 and Au25(DDT)18) were produced according to a previously reported method by Shivhare et al.55 They have confirmed the synthesis of these clusters by mass spectrometric analysis.55 0.55 mmol of HAuCl4·3H2O in 5 mL THF was mixed with 0.66 mmol of tetraoctylammonium bromide (TOAB) in 20 mL THF. Next, 2.75 mmol of the desired thiol (phenylethanethiol or dodecanethiol) was added to this solution and the solution was stirred until the conversion of Au3+ to Au+ is complete, (until the solution's yellow colour is completely lost). In order to fully reduce Au+ to Au (0), 5.5 mmol of NaBH4 in 5 mL of ice-cold water was added all at once to this clear solution under fast stirring and the progress of the reaction was monitored by UV–Vis spectroscopy. After the completion of the reaction and subsequent size focussing, which takes 4 days, the solvent was evaporated using a rotary evaporator and the reaction residue was washed with ethanol several times.55 Absorbance spectra of Au25(PET)18 and Au25(DDT)18 clusters with characteristic features are shown in Fig. 2a (black trace) and S12,† respectively.
Au25Captoprtil18 was synthesized according to a previously reported procedure.56 In this method, 0.20 mmol HAuCl4·3H2O and 0.23 mmol TOAB were first dissolved in 10 mL of methanol and vigorously stirred for 15 min. 1 mmol captopril was dissolved in 5 mL of methanol and was rapidly poured into the reaction mixture. The mixture was stirred for a further 30 min to allow complete formation of Au+ as indicated by the colour change from yellow to white. After 30 min, similar to other Au25 synthetic methods, 2 mmol NaBH4 dissolved in 5 mL of ice-cold water was rapidly added to the solution (the colour of the solution immediately changed to brown-black). The reaction was allowed to proceed for 6 h after which the mixture was centrifuged to remove the insoluble Au(I)-Capt polymer precursor. The supernatant containing Au25(Capt)18 clusters was collected and concentrated by rotary evaporation. The concentrated solution was then precipitated by adding ethanol. The precipitate was extracted several times with minimal amounts of methanol and dried under vacuum (an absorbance spectrum is shown in Fig. 2a – purple trace).
Au25Dimethylebenzenethiol18 (Au25(Me2PhS)18) was synthesised with inspiration from a previously reported procedure,10 but modified to obtain a purer product as estimated by absorbance measurements. In this method, 5 mg of the dry Au25(DDT)18 clusters were dissolved in 10 mL of DCM and purged with N2 gas for about 15 minutes. Excess ligand (340 μL of Me2PhSH) was added to ensure complete ligand exchange. The reaction mixture was allowed to stir for 36 hours under inert conditions. The exchange of outgoing DDT with the incoming ligand Me2PhSH was observed with absorption spectroscopy (Fig. S12a†). The ligand exchanged Au25 was concentrated by evaporating solvent and the cluster was washed several times with methanol to yield pure Au25(Me2PhS)18. The purity of the product was confirmed using NMR spectroscopy (Fig. S12b†).
Instrumentation
UV–Vis absorption spectra of the clusters were acquired with a Varian Cary 60 UV–Vis Spectrophotometer.Two-photon excitation was achieved with an excitation wavelength of 1028 nm delivered by a 5 W Carbide model Light Conversion Yb laser source (CB1-05-0085-10-AE0); delivering ∼250 fs pulses with 1 kHz repetition rate. Femtosecond transient absorption spectroscopy (TAS) measurements were performed on an Ultrafast Systems Helios spectrometer. With the exception of Au38(PET)24, none of the clusters investigated herein have appreciable extinction coefficients at 1028 nm light for linear absorption. Therefore, the induced absorbance characteristic of the excited state of each cluster was used to probe the two-photon excitation of cluster samples. In order to determine the cross-sections for two photon absorption, ΔA measurements at 2 ps delay times after excitation were used. Transient absorption spectra showing ΔA changes versus wavelength for each cluster at 2 ps delay time are illustrated throughout.
Synthesis of Au18 clusters
Au18Glutathione14 clusters (Au18(GS)14) were synthesized using a previously reported method.16 Briefly, 0.5 mmol of HAuCl4·3H2O in 1.2 mL of methanol was mixed with a solution of 1.1 mmol of glutathione and diluted in 1.8 mL of Milli-Q water. The mixture was sonicated and the initial reduction step which is the conversion of Au3+ to Au+ was indicated by the change in colour from yellow to colourless. The solution was then diluted to 96 mL by methanol and stirred for 10 min. Sodium cyanoborohydride is the reducing agent using in this method to slow down the reaction rate as compared to sodium borohydride reduction. Cyanoborohydride is milder reducing agent which provides a slow reduction of Au(I), allowing the reaction mixture to be sized-focused to form Au18(GS)14. Specifically, a 220 mM aqueous solution of NaBH3CN (4.5 ml) was prepared and added dropwise and the solution was left to stir vigorously for 30 min. The product was collected through centrifugal precipitation and washed repeatedly with acetonitrile and re-dissolved in Milli-Q water. Fig. 2b (blue trace) illustrates the characteristic absorbance features for Au18(GS)14.Au18Captopril14 clusters synthesis was performed via a ligand exchange.13 Au18(GS)14 (0.01 g) solutions are used as the starting cluster to which excess captopril (0.2 g) is added. The progress of the ligand exchange reaction was tracked using UV–Vis absorption. The optimal time needed for complete ligand exchange is 2 h after which extended exposure to high thiol concentrations causes the clusters to slowly degrade. Au18(Capt)14 was collected through centrifugal precipitation and washed repeatedly with acetonitrile and re-suspended in Milli-Q water (see Fig. 2b (red trace)). In a previous work, the atomically precise synthesis of these clusters has been confirmed by mass spectrometric analysis.13
Au18Cyclohexanethiol14 clusters (Au18(CyHT)14) were synthesized using a method reported by Jin et al.5 0.2 mmol of HAuCl4·3H2O was dissolved in 0.5 mL ethanol and added to a 10 mL of CH2Cl2 solution of 0.232 mmol TOAB. After 15 minutes of vigorously stirring a color change from yellow to dark reddish orange occurs. 125 mL of 1-cyclohexanethiol (excess) was then added to the mixture. The solution turned colorless in 15–20 min indicating the conversion of the red TOAB–Au3+ complex to thiolate–Au+ polymer. 0.5 mmol of NaBH4 dissolved in 1.5 mL of ethanol was then added dropwise to the solution under vigorous stirring. The mixture was further allowed to react for 5 h under stirring. The final green solution indicates the formation of Au18(CyHT)14. The clusters solution was then centrifuged to remove insoluble Au(I)-polymers. The supernatant was evaporated using rotary evaporation and the product was washed several times with methanol to remove excess reactants (see Fig. 2b (black trace) for the absorbance spectrum).5,57
Synthesis of Au38 clusters
Au38Phenylethanethiol24 (Au38(PET)24) clusters were synthesized according to a previously reported, two step procedure.58 The first step provides a polydisperse solution of Aun(GS)m clusters and the second step includes the ligand exchange process and the conversion of polydisperse Aun(GS)m to monodisperse Au38(PET)24. In the first step, 0.5 mmol HAuCl4·3H2O and 2.0 mmol glutathione powder were mixed in 20 mL of acetone at room temperature under vigorous stirring for 20 minutes. The yellowish cloudy suspension mixture was then cooled to 0 °C in an ice bath for 20 minutes and 5 mmol of NaBH4 in 6 mL of cold Milli-Q water was rapidly added to the suspension under vigorous stirring. The color of the solution immediately turned very dark, indicating the formation of Au clusters. After 20 min Aun(GS)m precipitated. The clear acetone solution was decanted and 6 mL of water was added to dissolve the Aun(GS)m clusters. The polydisperse solution of Aun(GS)m, was mixed with 0.3 mL of ethanol, 2 mL of toluene, and 2 mL of phenylethanethiol. The solution was heated to and maintained at 80 °C for 4 h. The Aun(GS)m clusters transferred from the aqueous phase to the organic phase and the Aun clusters were finally converted to monodisperse Au38(PET)24 clusters. The organic phase was thoroughly washed with ethanol to remove excess thiol. Pure Au38(PET)24 clusters were separated by extraction with dichloromethane or toluene (see Fig. 5a for the absorbance with characteristic features of Au38(PET)24 clusters).Synthesis of Ag25 clusters
Ag25Dimethylebenzenethiol18 clusters (Ag25(Me2PhS)18) were synthesized according to a report by Bakr et al.10 0.22 mmol of AgNO3 was dissolved in 2 mL of methanol with sonication and 0.66 mmol of 2,4-dimethylbenzenethiol (Me2PhSH) (90 μL) was added resulting in a bright yellow mixture. 17 mL of DCM was added to the vial and stirred in 0 °C for 20 minutes after which 0.014 mmol of a freshly prepared solution of PPh4Br in 0.5 mL methanol was added before the drop-wise addition of 0.4 mmol of ice-cold aqueous NaBH4 (0.5 mL). The reaction was allowed to proceed for 6 h and aged overnight in a freezer. Afterward, the dark solution was centrifuged and thus obtained supernatant was concentrated using a rotary evaporator. Ag25(Me2PhS)18 clusters were washed and precipitated using methanol. Fig. 2c (black trace) illustrates the absorbance spectrum.Synthesis of 50% Ag25(Me2PhS)18–50% Au25(Me2PhS)18
Alloying reaction between these clusters was carried out at room temperature by mixing a 1:1 equivalent ratio of Ag25(Me2PhS)18 and Au25(Me2PhS)18 clusters. To this purpose, 6.9 mg of Ag25(Me2PhS)18 was dissolved in 6 mL of DCM (0.134 mM) and 9.9 mg of Au25(Me2PhS)18 clusters were dissolved in 6 mL of DCM. The Au25(Me2PhS)18 solution was added to the Ag25(Me2PhS)18 solution under an inert environment. The reaction mixture was stirred, and the absorbance of the product was monitored to ensure a complete reaction (Fig. S13†). After 15 min the reaction was stopped, and the product precipitated and washed using methanol.
Theoretical work
Frontier orbital energies and absorbance spectra of the Au18(CyHT)14 cluster were calculated using time-dependent density functional theory (TD-DFT) methods, as implemented in the Gaussian16 software package.59 For the TD-DFT calculations, we employed the Perdew–Burke–Ernzerhof (PBE)60 functional and 6-31G** basis set for C, H, S and O and LANL2DZ61 (Los Alamos National Laboratory 2 Double-Zeta), which is a widely used effective core potential type basis set, was used to model the metal atoms. The GEN keyword in Gaussian16 created the mixed basis set. The PBE functional has been shows to accurately reproduce the ground states of Au clusters and the results are consistent with the experimental observation in this study. The geometry of the calculated structure was optimized for the ground state. The absorption spectra of the Au18(CyHT)14 cluster was obtained by employing a Gaussian broadening with 0.11 eV full width at half-maximum. 220 discrete transitions were calculated to obtain a spectrum that covers the range of 0.0–4.0 eV.Conflicts of interest
The authors declare no competing financial interests.Acknowledgements
Funding: The Natural Sciences and Engineering Research Council of Canada (NSERC) and the Canada Foundation for Innovation (CFI) are thanked for financial support of this work in terms of operating and equipment grants to KS. Compute Canada resources were used in producing the theoretical information for Au18 clusters.References
- H. Qian, D.-E. Jiang, G. Li, C. Gayathri, A. Das, R. R. Gil and R. Jin, J. Am. Chem. Soc., 2012, 134, 16159–16162 CrossRef CAS PubMed.
- J. Zheng, C. Zhang and R. M. Dickson, Phys. Rev. Lett., 2004, 93, 077402 CrossRef PubMed.
- R. Jin, Nanoscale, 2015, 7, 1549–1565 RSC.
- Y. Chen, C. Liu, Q. Tang, C. Zeng, T. Higaki, A. Das, D. Jiang, N. L. Rosi and R. Jin, J. Am. Chem. Soc., 2016, 138(5), 1482–1485 CrossRef CAS PubMed.
- M. Zhu, C. M. Aikens, F. J. Hollander, G. C. Schatz and R. Jin, J. Am. Chem. Soc., 2008, 130, 5883–5885 CrossRef CAS PubMed.
- C. R. Groom, I. J. Bruno, M. P. Lightfoot and S. C. Ward, Acta Crystallogr., Sect. B: Struct. Sci., Cryst. Eng. Mater., 2016, 72, 171–179 CrossRef CAS PubMed.
- A. Das, C. Liu, H. Y. Byun, K. Nobusada, S. Zhao, N. Rosi and R. Jin, Angew. Chem., 2015, 127, 3183–3187 CrossRef , 1521–3757.
- H. Qian, W. T. Eckenhoff, Y. Zhu, T. Pintauer and R. Jin, J. Am. Chem. Soc., 2010, 132, 8280–8281 CrossRef CAS PubMed.
- A. Tlahuice-Flores, R. L. Whetten and M. Jose-Yacaman, J. Phys. Chem. C, 2013, 117, 20867–20875 CrossRef CAS.
- C. P. Joshi, M. S. Bootharaju, M. J. Alhilaly and O. M. Bakr, J. Am. Chem. Soc., 2015, 137, 11578–11581 CrossRef CAS PubMed.
- A. Tlahuice-Flores, Phys. Chem. Chem. Phys., 2016, 18, 27738–27744 RSC.
- Z. Wu and R. Jin, Nano Lett., 2010, 10, 2568–2573 CrossRef CAS PubMed.
- G. Yousefalizadeh and K. G. Stamplecoskie, J. Phys. Chem. A, 2018, 122, 7014–7022 CrossRef CAS PubMed.
- L. Polavarapu, M. Manna and Q.-H. Xu, Nanoscale, 2011, 3, 429–434 RSC.
- K. G. Stamplecoskie, Y.-S. Chen and P. V. Kamat, J. Phys. Chem. C, 2014, 118, 1370–1376 CrossRef CAS.
- A. Ghosh, T. Udayabhaskararao and T. Pradeep, J. Phys. Chem. Lett., 2012, 3, 1997–2002 CrossRef CAS.
- A. M. Alkilany and C. J. Murphy, J. Nanopart. Res., 2010, 12, 2313–2333 CrossRef CAS PubMed.
- G. Ramakrishna, O. Varnavski, J. Kim, D. Lee and T. Goodson, J. Am. Chem. Soc., 2008, 130, 5032–5033 CrossRef CAS PubMed.
- Z. Hu and L. Jensen, Chem. Sci., 2017, 8, 4595–4601 RSC.
- R. Ho-Wu, S. H. Yau and T. Goodson III, ACS Nano, 2016, 10, 562–572 CrossRef CAS PubMed.
- I. Russier-Antoine, F. Bertorelle, N. Calin, Ž. Sanader, M. Krstić, C. Comby-Zerbino, P. Dugourd, P.-F. Brevet, V. Bonačić-Koutecký and R. Antoine, Nanoscale, 2017, 9, 1221–1228 RSC.
- O. V. Przhonska, S. Webster, L. A. Padilha, H. Hu, A. D. Kachkovski, D. J. Hagan and E. W. Van Stryland, in Advanced Fluorescence Reporters in Chemistry and Biology I, Springer, 2010, pp. 105–147 Search PubMed.
- P. N. Day, K. A. Nguyen and R. Pachter, J. Chem. Theory Comput., 2010, 6, 2809–2821 CrossRef CAS PubMed.
- G. Yousefalizadeh and K. G. Stamplecoskie, J. Photochem. Photobiol., A, 2018, 353, 251–254 CrossRef CAS.
- T. D. Green and K. L. Knappenberger, Nanoscale, 2012, 4, 4111–4118 RSC.
- A. Tlahuice and I. L. Garzón, Phys. Chem. Chem. Phys., 2012, 14, 3737–3740 RSC.
- I. Russier-Antoine, F. Bertorelle, N. Calin, Ž. Sanader, M. Krstić, C. Comby-Zerbino, P. Dugourd, P.-F. Brevet, V. Bonačić-Koutecký and R. Antoine, Nanoscale, 2017, 9, 1221–1228 RSC.
- S. Knoppe, H. Häkkinen and T. Verbiest, J. Phys. Chem. C, 2015, 119, 27676–27682 CrossRef CAS.
- H. H. Mai, V. E. Kaydashev, V. K. Tikhomirov, E. Janssens, M. V. Shestakov, M. Meledina, S. Turner, G. Van Tendeloo, V. V. Moshchalkov and P. Lievens, J. Phys. Chem. C, 2014, 118, 15995–16002 CrossRef CAS.
- Ž. Sanader, M. Krstić, I. Russier-Antoine, F. Bertorelle, P. Dugourd, P.-F. Brevet, R. Antoine and V. Bonačić-Koutecký, Phys. Chem. Chem. Phys., 2016, 18, 12404–12408 RSC.
- C. Yu, R. Schira, H. Brune, B. von Issendorff, F. Rabilloud and W. Harbich, Nanoscale, 2018, 10, 20821–20827 RSC.
- H. Qian, M. Y. Sfeir and R. Jin, J. Phys. Chem. C, 2010, 114, 19935–19940 CrossRef CAS.
- T. Stoll, E. Sgrò, J. W. Jarrett, J. Réhault, A. Oriana, L. Sala, F. Branchi, G. Cerullo and K. L. Knappenberger, J. Am. Chem. Soc., 2016, 138(6), 1788–1791 CrossRef CAS PubMed.
- C. Yi, H. Zheng, P. J. Herbert, Y. Chen, R. Jin and K. L. Knappenberger Jr., J. Phys. Chem. C, 2017, 121, 24894–24902 CrossRef CAS.
- R. Philip, P. Chantharasupawong, H. Qian, R. Jin and J. Thomas, Nano Lett., 2012, 12, 4661–4667 CrossRef CAS PubMed.
- C. Gautham, M. Steger, D. Snoke, K. West and L. Pfeiffer, Optica, 2017, 4, 118–123 CrossRef CAS.
- M. Yamanaka, K. Saito, N. I. Smith, Y. Arai, K. Uegaki, Y. Yonemaru, K. Mochizuki, S. Kawata, T. Nagai and K. Fujita, J. Biomed. Opt., 2015, 20, 101202 Search PubMed.
- S. Knoppe, M. Vanbel, S. Van Cleuvenbergen, L. Vanpraet, T. Bürgi and T. Verbiest, J. Phys. Chem. C, 2015, 119, 6221–6226 CrossRef CAS.
- Y. Song, J. Zhong, S. Yang, S. Wang, T. Cao, J. Zhang, P. Li, D. Hu, Y. Pei and M. Zhu, Nanoscale, 2014, 6, 13977–13985 RSC.
- M. Zhu, W. T. Eckenhoff, T. Pintauer and R. Jin, J. Phys. Chem. C, 2008, 112, 14221–14224 CrossRef CAS.
- S. Wang, X. Zhu, T. Cao and M. Zhu, Nanoscale, 2014, 6, 5777–5781 RSC.
- M. Walter, J. Akola, O. Lopez-Acevedo, P. D. Jadzinsky, G. Calero, C. J. Ackerson, R. L. Whetten, H. Grönbeck and H. Häkkinen, Proc. Natl. Acad. Sci. U. S. A., 2008, 105, 9157–9162 CrossRef CAS PubMed.
- A. Baksi, M. S. Bootharaju, X. Chen, H. Häkkinen and T. Pradeep, J. Phys. Chem. C, 2014, 118, 21722–21729 CrossRef CAS.
- I. Russier-Antoine, F. Bertorelle, R. Hamouda, D. Rayane, P. Dugourd, Ž. Sanader, V. Bonačić-Koutecký, P.-F. Brevet and R. Antoine, Nanoscale, 2016, 8, 2892–2898 RSC.
- K. D. Nanda and A. I. Krylov, J. Phys. Chem. Lett., 2017, 8, 3256–3265 CrossRef CAS PubMed.
- G. von Helden, D. van Heijnsbergen and G. Meijer, J. Phys. Chem. A, 2003, 107, 1671–1688 CrossRef CAS.
- J. W. Hudgens, T. DiGiuseppe and M.-C. Lin, J. Chem. Phys., 1983, 79, 571–582 CrossRef CAS.
- G. Hurst, M. Payne, S. Kramer and J. Young, Rev. Mod. Phys., 1979, 51, 767 CrossRef CAS.
- R. L. Donkers, D. Lee and R. W. Murray, Langmuir, 2004, 20, 1945–1952 CrossRef CAS.
- E. I. Alarcon, K. Udekwu, M. Skog, N. L. Pacioni, K. G. Stamplecoskie, M. González-Béjar, N. Polisetti, A. Wickham, A. Richter-Dahlfors, M. Griffith and J. C. Scaiano, Biomaterials, 2012, 33, 4947–4956 CrossRef CAS PubMed.
- E. I. Alarcon, M. Griffith and K. I. Udekwu, Silver Nanoparticle Applications: In the Fabrication and Design of Medical and Biosensing Devices, Springer, 2015, ISBN 978-3-319-11262-6 Search PubMed.
- J.-M. Nam, C. S. Thaxton and C. A. Mirkin, Science, 2003, 301, 1884–1886 CrossRef CAS PubMed.
- K. G. Stamplecoskie and P. V. Kamat, J. Am. Chem. Soc., 2014, 136, 11093–11099 CrossRef CAS PubMed.
- Y. Yu, X. Chen, Q. Yao, Y. Yu, N. Yan and J. Xie, Chem. Mater., 2013, 25, 946–952 CrossRef CAS.
- A. Shivhare, S. J. Ambrose, H. Zhang, R. W. Purves and R. W. Scott, Chem. Commun., 2013, 49, 276–278 RSC.
- S. Kumar and R. Jin, Nanoscale, 2012, 4, 4222–4227 RSC.
- S. Chen, S. Wang, J. Zhong, Y. Song, J. Zhang, H. Sheng, Y. Pei and M. Zhu, Angew. Chem., Int. Ed., 2015, 54, 3145–3149 CrossRef CAS PubMed.
- H. Qian, Y. Zhu and R. Jin, ACS Nano, 2009, 3, 3795–3803 CrossRef CAS PubMed.
- M. J. Frisch, G. W. Trucks, H. B. Schlegel, G. E. Scuseria, M. A. Robb, J. R. Cheeseman, G. Scalmani, V. Barone, G. A. Petersson, H. Nakatsuji, X. Li, M. Caricato, A. V. Marenich, J. Bloino, B. G. Janesko, R. Gomperts, B. Mennucci, H. P. Hratchian, J. V. Ortiz, A. F. Izmaylov, J. L. Sonnenberg, D. Williams, F. Ding, F. Lipparini, F. Egidi, J. Goings, B. Peng, A. Petrone, T. Henderson, D. Ranasinghe, V. G. Zakrzewski, J. Gao, N. Rega, G. Zheng, W. Liang, M. Hada, M. Ehara, K. Toyota, R. Fukuda, J. Hasegawa, M. Ishida, T. Nakajima, Y. Honda, O. Kitao, H. Nakai, T. Vreven, K. Throssell, J. A. Montgomery Jr., J. E. Peralta, F. Ogliaro, M. J. Bearpark, J. J. Heyd, E. N. Brothers, K. N. Kudin, V. N. Staroverov, T. A. Keith, R. Kobayashi, J. Normand, K. Raghavachari, A. P. Rendell, J. C. Burant, S. S. Iyengar, J. Tomasi, M. Cossi, J. M. Millam, M. Klene, C. Adamo, R. Cammi, J. W. Ochterski, R. L. Martin, K. Morokuma, O. Farkas, J. B. Foresman and D. J. Fox, Gaussian 16, Revision A.03, Gaussian, Inc., Wallingford CT, 2016, 121, 150–166 Search PubMed.
- J. P. Perdew, K. Burke and M. Ernzerhof, Phys. Rev. Lett., 1996, 77, 3865–3868 CrossRef CAS PubMed.
- P. J. Hay and W. R. Wadt, J. Chem. Phys., 1985, 82, 299–310 CrossRef CAS.
Footnote |
| † Electronic supplementary information (ESI) available. See DOI: 10.1039/d0nr06493a |
| This journal is © The Royal Society of Chemistry 2021 |