Optical thermometry of Er3+ in electrospun yttrium titanate nanobelts†
Zhe
Liu
a,
Lifan
Shen
b,
Xin
Zhao
a,
Edwin Yue-Bun
Pun
c and
Hai
Lin
 *ac
*ac
aSchool of Information Science and Engineering, Dalian Polytechnic University, Dalian, 116034, China. E-mail: lhai8686@yahoo.com
bCollege of Microelectronics and Key Laboratory of Optoelectronics Technology, Faculty of Information Technology, Beijing University of Technology, Beijing, 100124, China
cDepartment of Electrical Engineering and State Key Laboratory of Terahertz and Millimeter Waves, City University of Hong Kong, Tat Chee Avenue, Kowloon, Hong Kong, China
First published on 25th November 2020
Abstract
Er3+/Yb3+ co-doped Y2Ti2O7 (YTOEY) nanobelts with a thickness of ∼100 nm are synthesized by electrospinning, which exhibit a high sensitivity and rapid responsiveness in temperature sensing. The fluorescence intensity ratio of two green intense signals that originated from the transitions of Er3+ ions can be developed for non-contact temperature measurements. Moreover, the nanoscale dimensions, porous structures and large surface area of the prepared YTOEY nanobelts allow the photothermal signals to pass through them quickly. The maximum absolute sensitivity at 513 K and the extreme relative sensitivity at 303 K are calculated to be 0.37% K−1 and 1.17% K−1, respectively, indicating that the nanobelts have attractive optical temperature sensing characteristics. These extraordinary results demonstrate that YTOEY nanobelts are a promising candidate for accurate temperature monitoring in thermo-sensitive equipment.
1. Introduction
Non-contact optical thermometry has attracted widespread attention due to its wide operating temperature range, high spatial resolution and low dependence on the test environment, which can be applied to thermometry in electrical machinery, gas turbines, internal combustion engines and on-demand drug release.1–6 Compared with the traditional contact method, non-contact optical temperature measurement based on the fluorescence intensity ratio (FIR) of two thermal coupling energy levels has the advantages of non-invasiveness, high precision and fast response.7–11 Moreover, rare earth (RE) ion-doped materials have been widely applied in the field of non-contact optical thermometry because of their favorable temperature sensitivity, high upconversion efficiency, unique thermal stability, and excellent physicochemical stability.12–20 Non-contact optical thermometry relies on appropriate energy separation in thermally coupled levels of RE, avoiding the overlap or the weakness of two emissions used for thermometry when the energy gap is unsuited. Among different RE ions, Er3+ ions used in non-contact optical thermometric sensing have received widespread attention, owing to their opportune energy separation of ∼700 cm−1 between the thermally coupled levels 4S3/2 and 2H11/2.21–23 For instance, L. Liu et al. reported the dependence of optical temperature sensing and photo-thermal conversion in β-NaYF4:Yb3+,Er3+ nanoparticles, indicating that Er3+ ions have a promising future for application in temperature sensing.24 Y. Yang et al. synthesized Yb3+/Er3+ codoped La2O2S phosphor for optical thermometry based on upconversion fluorescence, which demonstrates that the energy gap between the 2H11/2 and 4S3/2 levels of Er3+ ions is important for the sensitivity of the sensor.25Different kinds of upconversion materials have been prepared and widely used in the field of non-contact optical thermometry, such as ceramics, glass, phosphor and nanoparticles.26–29 Compared with the abovementioned materials, one-dimensional (1D) nanobelt materials have attracted extensive attention due to their outstanding orientation, dimensional stability, large surface-to-volume ratio and high thermal sensitivity.30–35 However, nanobelt materials with a high thermal sensitivity and rapid responsiveness for non-contact temperature sensing are rarely reported. Hence, an upconversion luminescent (UCL) material with a nanobelt structure is desired to be obtained and applied in the field of non-contact optical thermometric sensing. Among the UCL materials, Y2Ti2O7 (YTO) with a pyrochlore structure has emerged as a bewitching matrix due to its relatively low phonon energy (∼712 cm−1), elevated temperature heat-resistance, unique optical properties and potential application in non-contact optical temperature sensing.36–39 Furthermore, electrospinning technology has been proved to be the most convenient and effective way to obtain blended materials.40–42 Considering the latest development of thermal feedback materials, the direct synthesis of Er3+/Yb3+ co-doped Y2Ti2O7 (YTOEY) nanobelts with excellent UCL and optical thermal sensitivity using the electrospinning method is very attractive.43
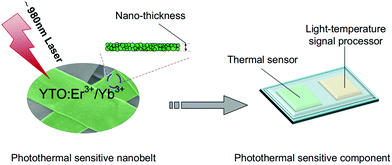
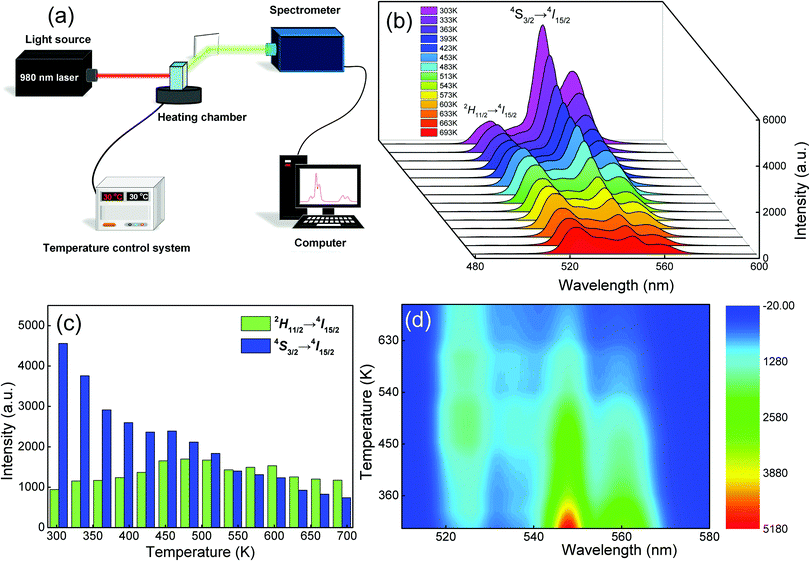
In this paper, a series of Er3+/Yb3+ co-doped YTOEY nanobelts as promising optical temperature sensing materials are prepared via the electrospinning method, and the thickness of nanobelts is determined to be ∼100 nm. Besides, the upconversion emission spectra are analyzed and the possible mechanism of UCL is elucidated through power dependence. For the non-contact temperature sensing application, as the temperature can be determined according to the FIR of the two thermally coupled energy levels 2H11/2 and 4S3/2 emission originated from Er3+ ions, the thermal sensing characteristics of YTOEY nanobelts were analyzed in the temperature range of 303 K to 693 K. Fig. 1 indicates the potential application of YTOEY nanobelts as heat source monitors which can be easily integrated into multifunctional nanochips for high-sensitivity and high-speed non-contact temperature sensing.
2. Experimental
2.1 Fabrication of (Y1−x−yErxYby)2Ti2O7 nanobelts
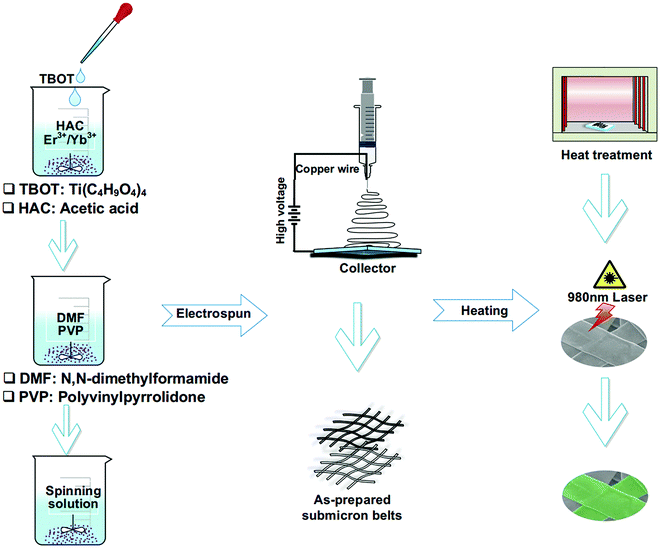
Er3+/Yb3+ co-doped Y2Ti2O7 nanobelts were synthesized using an electrospinning technique.44,45 High-purity powders of Y2O3 (4N), Er2O3 (4N), and Yb2O3 (4N) were used as the raw materials. First of all, Y2O3, Yb2O3 and Er2O3 powders were weighed, dissolved in concentrated HNO3 (AR), and transformed into nitrate Ln(NO3)3·6H2O (Ln3+ = Y3+, Yb3+, and Er3+) by evaporation crystallization. Different from [Y0.918(Ho, Yb)0.082]2Ti2O7 adopted in ref. 46, a lower concentration of rare earth was used to reduce the formation of the miscellaneous phase considering the effectiveness of Er3+ luminescence. The chemical formula of nanobelts is (Y1−x−yErxYby)2Ti2O7, where x = 0.0182m, y = 0.00182n, and (m, n) = (0, 0), (1, 0),(2, 0), (4, 0), and (10, 0) for Er3+ single-doping and (m, n) = (2, 2) and (2, 6) for Er3+ and Yb3+ co-doping cases labelled as YTOEmYn. For a better representation, the corresponding micron-belt samples are abbreviated as YTOE0Y0, YTOE1Y0, YTOE2Y0, YTOE4Y0, YTOE10Y0, YTOE2Y2, and YTOE2Y6. In specific experiments, Ln(NO3)3·6H2O (Ln3+ = Y3+, Yb3+, and Er3+) with a total amount of 2.74 mmol was slowly dissolved in a completely mixed solution composed of 0.85 mL Ti(C4H9O)4 (TBOT) (CP) and 2 mL acetic acid (HAC) (AR), which was marked as 1#. At the same time, 0.48 g of polyvinylpyrrolidone (PVP, Mw = 1![[thin space (1/6-em)]](https://www.rsc.org/images/entities/char_2009.gif) 300
300![[thin space (1/6-em)]](https://www.rsc.org/images/entities/char_2009.gif) 000) was fully mixed with 3.6 mL of N,N-dimethylformamide (DMF) (AR) and thoroughly stirred for 3 h, which was labeled as 2#. Shortly, the abovementioned 1# and 2# solutions were mixed and the spinning solution was obtained under strong magnetic stirring for 12 hours. In the whole electrospinning process, the working voltage was 9 kV DC, the pushing speed was always kept at 0.3 mL h−1 and the distance between the receiving plate and the spinneret was 15 cm. In the end, the as-spun belts were dried in a desiccator at room temperature for 12 h, then heated from room temperature to 800 °C in a muffle furnace at a rate of 1 °C min−1, kept at 800 °C for 8 h and finally cooled down to room temperature at the same rate for other characterization studies. The preparation process of the YTOEY nanobelts is illustrated in Fig. 2.
000) was fully mixed with 3.6 mL of N,N-dimethylformamide (DMF) (AR) and thoroughly stirred for 3 h, which was labeled as 2#. Shortly, the abovementioned 1# and 2# solutions were mixed and the spinning solution was obtained under strong magnetic stirring for 12 hours. In the whole electrospinning process, the working voltage was 9 kV DC, the pushing speed was always kept at 0.3 mL h−1 and the distance between the receiving plate and the spinneret was 15 cm. In the end, the as-spun belts were dried in a desiccator at room temperature for 12 h, then heated from room temperature to 800 °C in a muffle furnace at a rate of 1 °C min−1, kept at 800 °C for 8 h and finally cooled down to room temperature at the same rate for other characterization studies. The preparation process of the YTOEY nanobelts is illustrated in Fig. 2.
2.2 Measurements and characterization
The X-ray diffraction pattern of the nanobelts was examined using a Shimadzu XRD-7000 X-ray diffractometer using Cu Kα radiation (λ = 1.5406 Å) with a step-by-step scanning method over the 2θ range from 10° to 80°. The elemental and morphological analyses of the as-synthesized nanobelts were performed using an energy dispersive spectrometer (EDS) and a scanning electron microscope (JEOL JSM-7800F SEM), respectively. The upconversion spectra at room temperature were recorded using a Hitachi F-7000 spectrophotometer equipped with a 977 nm fiber-pigtailed multimode diode laser. The upconversion luminescence spectra at different temperatures were obtained by using a Hitachi F-4600 spectrophotometer excited by a 980 nm fiber-pigtailed diode laser (MW-GX-980/5000 mW). The temperature control system was used to control (DMU-TC450) the test temperature of the sample in the range of 303 to 693 K.3. Results and discussion
3.1 Structure and morphology
Powder XRD was adopted to identify the crystal structures of the prepared samples. As illustrated in Fig. 3(a), a series of characteristic crystal surface indices (hkl) were recorded for different samples, which are consistent with the reference YTO with a face-centered cubic pyrochlore structure (JCPDS file number: 42-0413), indicating that the samples contain a pure crystalline phase.47–50Fig. 3(b) shows a partially enlarged image of the diffraction position of the 2θ shifting in the (222) crystal plane corresponding to Fig. 3(a). It can be seen that the position of the main peak slightly shifts to the right when introducing the doping of Er3+ and Yb3+ ions. The reason for this phenomenon is that part of the Y3+ ions (r = 1.155 Å) with a larger crystal radius are replaced by Er3+ (r = 1.14 Å) and Yb3+ (r = 1.12 Å) with smaller crystal radii, which leads to lattice shrinkage.51,52 Meanwhile, the slight shift proves that two RE ions partially replace Y3+ ions in the matrix lattice successfully.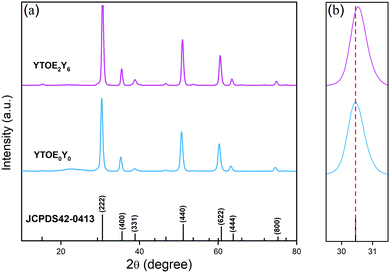 | ||
| Fig. 3 (a) XRD patterns of YTOE2Y6 and YTOE0Y0 nanobelts after heat treatment. (b) Local amplification of XRD patterns on the (222) plane. | ||
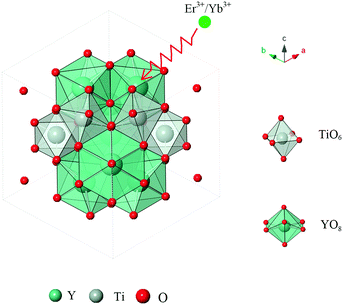
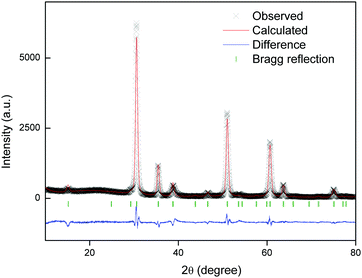
The schematic diagram of the crystal structure of a single Y2Ti2O7 cell is illustrated in Fig. 4. In the cubic pyrochlore structure of Y2Ti2O7 (A2B2O7), the larger cation is 8-coordinated at the A (16d) position and the smaller cation is 6-coordinated at the B (16c) position. Besides, the oxygen atoms occupy different crystal axes: 48f(O1), 8b(O2) and 8a(O3). The 48f(O1) site is coordinated with two Y and two Ti ions, the 8b(O2) site is coordinated with four Y ions, and the third anionic site in the united cell, 8a(O3), is coordinated with four Ti cations, which is usually found to be an empty and incomplete ordered pyrochlore lattice. Furthermore, owing to the similar crystal radii of Yb3+, Er3+ and Y3+, some Y3+ ions in the lattice are gradually replaced by Er3+ or Yb3+ ions. Rietveld refinement of the YTOE2Y6 sample was performed, and the subtle crystal microstructure details are depicted in Fig. 5. In addition, accurate lattice parameters and the results of Rietveld refinement are listed in Table 1 for the YTOE2Y6 sample. Accordingly, it can be further testified that the synthesized samples have phase purity using Rietveld refinement.
| Formula | YTOE2Y6 |
|---|---|
| Space group |
Fd![[3 with combining macron]](https://www.rsc.org/images/entities/char_0033_0304.gif) m m |
| a = b = c (Å) | 10.1244 |
| α = β = γ (°) | 90° |
| Z | 8 |
| V (Å3) | 1029.87 |
| R p (%) | 8.69 |
| R wp (%) | 11.99 |
| χ 2 | 3.762 |
The surface morphologies of YTOE2Y6 nanobelts and dimension information were observed using FE-SEM, as shown in Fig. 6. After heat treatment at 800 °C for 8 h, the length, width and thickness of the sample were found to be ∼40 μm, ∼4 μm and ∼100 nm, respectively, as presented in Fig. 6. Therefore, the photothermal signal can completely pass through the belts due to the nanometer-sized thickness, and the larger superficial area using in temperature detection can synchronously respond to the thermal field in the region because nanobelts are composed of only a few tiers of precipitated YTOEY crystal particles. At the same time, it can be observed that the surface of the YTOE2Y6 nanobelts has a porous structure, which is caused by the decomposition of PVP during high-temperature heat treatment. As illustrated in Fig. 7, considering YTOE2Y6 nanobelts as an example, the elemental composition was investigated using EDS. Herein, Er, Yb, Y, Ti and O elements were observed and were distributed uniformly in the scanning region. The results of the above discussion are also consistent with the results of the XRD analysis, indicating that YTOEY nanobelts can be successfully synthesized using the electrospinning method.
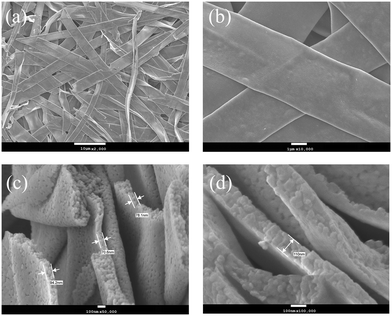 | ||
| Fig. 6 (a) SEM micrographs of YTOE2Y6 nanobelts after heat treatment. (b) Frontal morphology of the nanobelts. (c and d) Cross-sectional morphology of the nanobelts. | ||
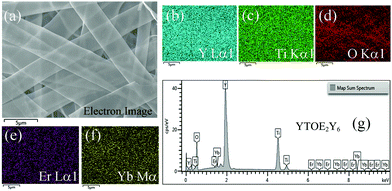 | ||
| Fig. 7 (a) Electron image of YTOE2Y6 nanobelts. (b–f) EDS spectra of elements. (g) EDS spectrum of YTOE2Y6 nanobelts. | ||
3.2 Upconversion luminescence
To further comprehend the mechanism of UCL, the upconversion emission spectra of YTO nanobelts doped with different concentrations of RE ions were measured using a 977 nm near-infrared pump laser. As illustrated in Fig. 8, UCL was recorded by using a 977 nm laser with a 630 mW pump power to excite the belts with different doping concentrations after heat treatment, confirming that YTOEY nanobelts are highly efficient upconversion materials. The spectra of UCL exhibit two green (∼524 nm and ∼546 nm) emission bands and one red (∼656 nm) emission band when excited using a 977 nm laser. The two green emission bands originated from the 2H11/2 → 4I15/2 and 4S3/2 → 4I15/2 transitions and the red band is attributed to the combination of 4F9/2 → 4I15/2 transitions.53–55 The bimodal phenomena of green and red emission bands were caused by the Stark splitting of erbium degenerated energy levels.56 The relationship between the UCL intensities and the different concentrations of Er3+ ions is illustrated in the inset of Fig. 8. Meanwhile, the upconversion emission intensity shows an increasing trend first and then a decreasing trend with the gradual increase of the Er3+ ion doping ratio and the optimal doping ratio is YTOE2Y0. Furthermore, the co-doping ratio of Yb3+ and Er3+ ions has a strong effect on the UCL intensity of the nanobelts. In the absence of Yb3+ ions, the photon energy of the 977 nm laser cannot effectively excite the energy level of Er3+ ions, so the intensity of UCL is relatively weak. However, bright green UCL emissions located at ∼524 and ∼546 nm can be clearly observed when Yb3+ ions are doped into the YTO nanobelts as shown in Fig. 8, which indicates that there is a more effective energy transfer between Er3+ and Yb3+ under 977 nm laser excitation.57–60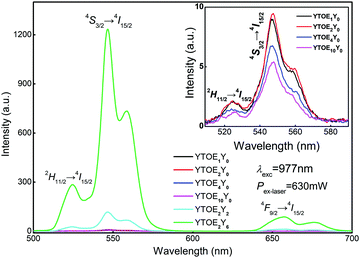 | ||
| Fig. 8 UCL spectra of YTOEY nanobelts with different doping ratios. Inset: Partially enlarged upconversion spectra of YTO nanobelts doped with different Er3+ concentrations. | ||
As shown in Fig. 9, to further elucidate the mechanism of UCL in YTOEY nanobelts, the relationship between pump power and the upconversion emission intensity of the belts was investigated. In the experimental range of 160 to 630 mW, the intensity of the main emission peak (∼546 nm) increases rapidly with a slow increase in pump power. The pump power dependence of the two green (∼524 and ∼546 nm) luminescence bands and one red (∼656 nm) luminescence band is shown in the inset of Fig. 9. Furthermore, for the UCL process, the intensity of emitted radiation (I) is proportional to the exponent (n) of pump power (P), and their relationship can be described using the well-known formula I ∝ Pn, where n is the number of near-infrared photons absorbed by the sensitizer-activator coupling during the excitation.61 The inset of Fig. 9 demonstrates the fitting line and experimental data of YTOE2Y6 nanobelts and indicates that the fitted n values are 1.89, 1.91 and 1.78 for the two green emission band and one red emission band, respectively. These fitting values are close to 2, revealing that all three UCL emission bands mentioned above are two-photon processes. Meanwhile, the fitting values are slightly less than 2, indicating that somehow a quenching process originated from the thermal effect in the process of UCL emission.62
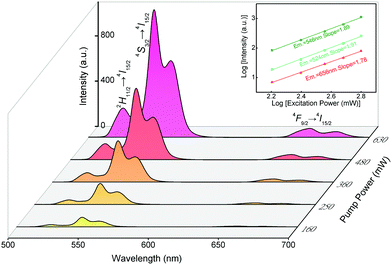 | ||
| Fig. 9 UCL spectra of YTOE2Y6 nanobelts under excitation using a 977 nm laser. Inset: Dependence of UCL emission intensities on pump powers in YTOE2Y6 nanobelts. | ||
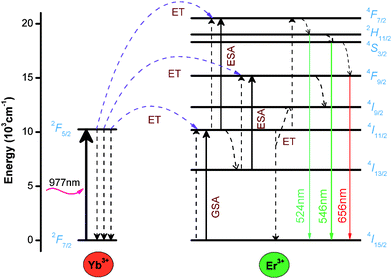
The schematic energy level diagram of UCL emission in YTOEY nanobelts under 977 nm laser excitation is illustrated in Fig. 10 and energy transfer (ET), excited-state absorption (ESA) and ground-state absorption (GSA) can be observed intuitively. As mentioned above, Yb3+ ions have a broader and larger absorption cross-section than Er3+ ions, and there is a perfect resonance between the 4I11/2 level of Er3+ ions and the 2F5/2 level of Yb3+ ions. Consequently, there will be an effective resonance energy transfer from Yb3+ to Er3+ ions.63 First of all, the electrons of the 4I15/2 level of Er3+ ions are excited to the 4I11/2 level via ET or GSA of the adjacent Yb3+ ions. Part of the excited electrons in the 4I11/2 level relax to the 4I13/2 level. The rest of the excited electrons in the 4I11/2 level are further excited to the 4F7/2 level via ESA absorption of the exciting photon energy. Subsequently, the excited electrons at the 4F7/2 level relax to the 2H11/2 and 4S3/2 levels through non-radiation, and then electrons at the 2H11/2 and 4S3/2 levels transfer to the ground state level 4I15/2 through radiation and emit green UCL at ∼524 nm and ∼546 nm, respectively. Meanwhile, the ions excited to the 4I13/2 level also absorb the photon energy from outside and further excite to the 4F9/2 level. Then, the radiation transition from 4F9/2 to 4I15/2 produces a weak red UCL at ∼656 nm. Therefore, according to the above description, it can be concluded that each emission process at ∼524, ∼546 and ∼656 nm is a two-photon process in this work.
3.3 Temperature sensing behavior of YTOEY nanobelts
The application of Er3+-doped materials for non-contact temperature measurement is one of their most representative applications. Hence, the non-contact optical temperature-sensitive behavior of YTOE2Y6 nanobelts was investigated using a mature FIR system under 980 nm laser excitation at a 650 mW power. For this purpose, the up-conversion emission spectra of the YTOE2Y6 nanobelts with temperature ranging from 303 to 693 K are also examined as exhibited in Fig. 11, and a schematic illustration of the optical temperature sensing test is shown in Fig. 11(a). In Fig. 11 (b–d), as the test temperature increases slowly, the upconversion emission intensity at ∼546 nm (4S3/2 → 4I15/2) shows an overall downward trend with a slight upward trend at 450 K; nevertheless, the emission intensity located at ∼524 nm (2H11/2 → 4I15/2) presents trifling continuous fluctuations. Changes of the emission intensity from 2H11/2 and 4S3/2 levels show a nearly opposite trend with temperature increase, which originated from the evolution of the population redistribution.The thermal sensitivity of YTOE2Y6 nanobelts was examined by using the FIR technique with two thermally coupled levels of Er3+ ions. Typically, the small energy gap between 2H11/2 and 4S3/2 levels allows the thermalized population of the upper 2H11/2 level at the expense of the lower 4S3/2 level. Thus, the populations of the two close levels, 2H11/2 and 4S3/2, follow Boltzmann distribution, which can be determined by using the following equation:64
 | (1) |
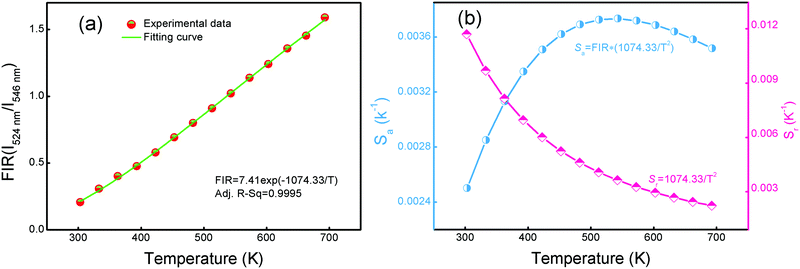 | ||
Fig. 12 FIR of (I524![[thin space (1/6-em)]](https://www.rsc.org/images/entities/char_2009.gif) nm/I546 nm/I546![[thin space (1/6-em)]](https://www.rsc.org/images/entities/char_2009.gif) nm) (a) and absolute sensitivity Sa and relative sensitivity Sr (b) of YTOE2Y6 nanobelts in the measurement temperature range of 303–693 K. nm) (a) and absolute sensitivity Sa and relative sensitivity Sr (b) of YTOE2Y6 nanobelts in the measurement temperature range of 303–693 K. | ||
In a practical application of temperature measurement, absolute sensitivity (Sa) and relative sensitivity (Sr) are two important indexes to evaluate the performance of the optical thermometric sensor. Sa can be defined as follows:65
 | (2) |
Meanwhile, Sr assesses the non-contact optical thermometric sensing performance, which can be expressed using the following equation:
 | (3) |
Fig. 12(b) shows the calculated plots of Sa and Srversus temperature in the range from 303 to 693 K. The maximum Sa value is about 0.37% K−1 at 513 K and the maximum Sr value is about 1.17% K−1 at 303 K. Furthermore, the maximum Sa and Sr values of several reported RE-doped materials are listed in Table 2. Compared with other Er3+/Yb3+ ion doped materials, YTOE2Y6 nanobelts have both a wider response range and a higher sensitivity. Moreover, the prominent Sa and Sr values of YTOEY nanobelts indicate that they have great potential to be used as non-contact optical thermometric sensors.
| Host lattice: Er3+/Yb3+ ions | Temperature range (K) | S r (K−1) | S a (%K−1) | Ref. | |||
|---|---|---|---|---|---|---|---|
| Al(PO3)3-BaF2-SrF2: Er3+/Yb3+ | 100–280 | 542/T2 | 0.15 | 66 | |||
| Ba5Gd8Zn4O21: Er3+/Yb3+ | 298–573 | 629.69/T2 | 0.24 | 67 | |||
| TeO2–WO3 glass: Er3+/Yb3+ | 300–690 | 976.89/T2 | 0.28 | 29 | |||
| Silicate glass: Er3+/Yb3+ | 296–723 | 592.6/T2 | 0.33 | 68 | |||
| Na0.5Bi0.5TiO3: Er3+/Yb3+ | 163–613 | 827.26/T2 | 0.31 | 69 | |||
| Y2Ti2O7: Er3+/Yb3+ | 303–693 | 1074.33/T2 | 0.37 | This work | |||
| β-NaYF4: Er3+/Yb3+ | 293–753 | 1113/T2 | 0.39 | 70 | |||
| Y2O3: Er3+/Yb3+ | 93–613 | 868.08/T2 | 0.44 | 71 | |||
| BCZT ceramics: Er3+/Yb3+ | 173–573 | 1234.2/T2 | 0.68 | 26 | |||
| Ba0.5Sr0.5TiO3: Er3+/Yb3+ | 288–538 | 1240.3/T2 | 0.76 | 72 | |||
| Bi4Ti3O12: Er3+/Yb3+ | 293–523 | 959.33/T2 | 1.02 | 73 | |||
4. Conclusions
YTOEY nanobelts with a thickness of ∼100 nm were fabricated by electrospinning, which were investigated for their spectral characteristics and temperature sensing behavior. Two intense green emission bands located at ∼524 and ∼546 nm were attributed to the 2H11/2 → 4I15/2 and 4S3/2 → 4I15/2 transitions of Er3+ ions under excitation using a 977 nm laser, which is conducive to the non-contact temperature sensing application. Furthermore, the maximum of absolute sensitivity Sa was calculated to be 0.37% K−1 at 513 K and a relative sensitivity Sr value of 1.17% K−1 is obtained at 303 K, indicating the promising application of YTOEY nanobelts in non-contact optical thermometric sensing. Therefore, the excellent sensitivity and rapid responsiveness of optical temperature sensing demonstrate the potential of YTOEY nanobelts to be used as optical thermosensitive materials in non-contact temperature monitoring.Conflicts of interest
There are no conflicts of interest to declare.Acknowledgements
The research work was supported by the Scientific Research Funding Project from the Educational Department of Liaoning Province, China (Grant No. J2020047) and the Research Grants Council of the Hong Kong Special Administrative Region, China (Grant No. CityU 11219819).References
- D. Wawrzynczyk, A. Bednarkiewicz, M. Nyk, W. Strek and M. Samoc, Neodymium(III) doped fluoride nanoparticles as non-contact optical temperature sensors, Nanoscale, 2012, 4, 6959–6961 RSC.
- Y. Liu, G. Bai, E. Pan, Y. Hua, L. Chen and S. Xu, Upconversion fluorescence property of Er3+/Yb3+ codoped lanthanum titanate microcrystals for optical thermometry, J. Alloys Compd., 2020, 822, 153449 CrossRef CAS.
- M. Aldén, A. Omrane, M. Richter and G. Särner, Thermographic phosphors for thermometry: a survey of combustion applications, Prog. Energy Combust. Sci., 2011, 37, 422–461 CrossRef.
- H. Wu, Z. Hao, L. Zhang, X. Zhang, Y. Xiao, G.-H. Pan, H. Wu, Y. Luo, L. Zhang and J. Zhang, Er3+/Yb3+ codoped phosphor Ba3Y4O9 with intense red upconversion emission and optical temperature sensing behavior, J. Mater. Chem. C, 2018, 6, 3459–3467 RSC.
- S. A. Wade, S. F. Collins and G. W. Baxter, Fluorescence intensity ratio technique for optical fiber point temperature sensing, J. Appl. Phys., 2003, 94, 4743–4756 CrossRef CAS.
- X. Li, Z. H. Chu, H. L. Wang, L. Cai, Z. G. Tu, H. Q. Liu, C. Y. Zhu, H. F. Shi, D. H. Pan, J. Pan and X. Fei, Electrostatically Assembled Multilayered Films of Biopolymer Enhanced Nanocapsules for on-Demand Drug Release, ACS Appl. Bio Mater., 2019, 2(8), 3429–3438 CrossRef.
- A. Sedlmeier, D. E. Achatz, L. H. Fischer, H. H. Gorris and O. S. Wolfbeis, Photon upconverting nanoparticles for luminescent sensing of temperature, Nanoscale, 2012, 4, 7090–7096 RSC.
- B. Dong, S. Xu, J. Sun, S. Bi, D. Li, X. Bai, Y. Wang, L. Wang and H. Song, Multifunctional NaYF4:Yb3+, Er3+@ Ag core/shell nanocomposites: integration of upconversion imaging and photothermal therapy, J. Mater. Chem., 2011, 21, 6193–6200 RSC.
- L. H. Fischer, G. S. Harms and O. S. Wolfbeis, Upconverting nanoparticles for nanoscale thermometry, Angew. Chem. Int. Ed., 2011, 50, 4546–4551 CrossRef CAS.
- S. Wang, H. Zhou, X. Wang and A. Pan, Up-conversion luminescence and optical temperature-sensing properties of Er3+-doped perovskite Na0. 5Bi0. 5TiO3 nanocrystals, J. Phys. Chem. Solids, 2016, 98, 28–31 CrossRef CAS.
- V. Nagirnyi, E. Feldbach, L. Jönsson, M. Kirm, A. Kotlov, A. Lushchik, V. Nefedov and B. Zadneprovski, Energy transfer in ZnWO4 and CdWO4 scintillators, Nucl. Instrum. Methods Phys. Res., Sect. B, 2002, 486, 395–398 CrossRef CAS.
- A. Maurya, A. Bahadur, A. Dwivedi, A. Choudhary, T. Yadav, P. Vishwakarma and S. Rai, Optical properties of Er3+, Yb3+ co-doped calcium zirconate phosphor and temperature sensing efficiency: effect of alkali ions (Li+, Na+ and K+), J. Phys. Chem. Solids, 2018, 119, 228–237 CrossRef CAS.
- S. Zheng, W. Chen, D. Tan, J. Zhou, Q. Guo, W. Jiang, C. Xu, X. Liu and J. Qiu, Lanthanide-doped NaGdF4 core–shell nanoparticles for non-contact self-referencing temperature sensors, Nanoscale, 2014, 6, 5675–5679 RSC.
- R. Balda, N. Hakmeh, M. Barredo-Zuriarrain, O. Merdrignac-Conanec, S. García-Revilla, M. Arriandiaga and J. Fernández, Influence of upconversion processes in the optically-induced inhomogeneous thermal behavior of erbium-doped lanthanum oxysulfide powders, Materials, 2016, 9, 353 CrossRef.
- F. Huang, Y. Gao, J. Zhou, J. Xu and Y. Wang, Yb3+/Er3+ co-doped CaMoO4: a promising green upconversion phosphor for optical temperature sensing, J. Alloys Compd., 2015, 639, 325–329 CrossRef CAS.
- R. Shi, L. Ning, Y. Huang, Y. Tao, L. Zheng, Z. Li and H. Liang, Li4SrCa(SiO4)2:Eu2+: a potential temperature sensor with unique optical thermometric properties, ACS Appl. Mater. Interfaces, 2019, 11, 9691–9695 CrossRef CAS.
- M. Runowski, N. Stopikowska, D. Szeremeta, S. Goderski, M. Skwierczyńska and S. Lis, Upconverting Lanthanide Fluoride Core@Shell Nanorods for Luminescent Thermometry in the First and Second Biological Windows: β-NaYF4: Yb3+–Er3+@SiO2 Temperature Sensor, ACS Appl. Mater. Interfaces, 2019, 11, 13389–13396 CrossRef CAS.
- S. Goderski, M. Runowski and P. Woźny, et al., Lanthanide upconverted luminescence for simultaneous contactless optical thermometry and manometry-sensing under extreme conditions of pressure and temperature, ACS Appl. Mater. Interfaces, 2020, 12(36), 40475–40485 CrossRef CAS.
- P. Du, L. Luo, W. Li, Q. Yue and H. Chen, Optical temperature sensor based on upconversion emission in Er-doped ferroelectric 0.5Ba(Zr0.2Ti0.8)O3−0.5(Ba0.7Ca0.3)TiO3 ceramic, Appl. Phys. Lett., 2014, 104, 152902 CrossRef.
- M. Vranje, J. K. Jakovljevi and M. Miloevi, et al., Hydrothermal synthesis of Mn2+ doped titanate nanotubes: Investigation of their structure and room temperature ferromagnetic behavior, Solid State Sci., 2019, 94, 155–161 CrossRef.
- E. Viesca-Villanueva, J. Oliva, D. Chávez, C. Lopez-Badillo, C. G. Solís, A. Mtz-Enriquez and C. Garcia, Effect of Yb3+ codopant on the upconversion and thermoluminescent emission of Sr2CeO4: Er3+, Yb3+ phosphors, J. Phys. Chem. Solids, 2020, 109547 CrossRef CAS.
- S. Sinha, K. Mahata and K. Kumar, Enhancing the upconversion luminescence properties of Er3+–Yb3+ doped yttrium molybdate through Mg2+ incorporation: effect of laser excitation power on temperature sensing and heat generation, New J. Chem., 2019, 43(15), 5960–5971 RSC.
- M. Jia, G. Liu, Z. Sun, Z. Fu and W. Xu, Investigation on two forms of temperature-sensing parameters for fluorescence intensity ratio thermometry based on thermal coupled theory, Inorg. Chem., 2018, 57, 1213–1219 CrossRef CAS.
- L. Liu, L. Cheng, B. Chen, J. Shang, X. Qi, Y. Zhu and R. Hua, Dependence of optical temperature sensing and photo-thermal conversion on particle size and excitation wavelength in β-NaYF4:Yb3+, Er3+ nanoparticles, J. Alloys Compd., 2018, 741, 927–936 CrossRef CAS.
- Y. Yang, C. Mi, F. Yu, X. Su, C. Guo, G. Li, J. Zhang, L. Liu, Y. Liu and X. Li, Optical thermometry based on the upconversion fluorescence from Yb3+/Er3+ codoped La2O2S phosphor, Ceram. Int., 2014, 40, 9875–9880 CrossRef CAS.
- Q. Zuo, L. Luo and Y. Yao, The electrical, upconversion emission, and temperature sensing properties of Er3+/Yb3+-codoped Ba(Zr0.2Ti0.8)O3-(Ba0.7Ca0.3)TiO3 ferroelectric ceramic, J. Alloys Compd., 2016, 632, 711–716 CrossRef.
- S. F. León-Luis, U. R. Rodríguez-Mendoza, E. Lalla and V. Lavín, Temperature sensor based on the Er3+ green upconverted emission in a fluorotellurite glass, Sens. Actuators, B, 2011, 158, 208–213 CrossRef.
- B. Zhou, B. Shi, D. Jin and X. Liu, Controlling upconversion nanocrystals for emerging applications, Nat. Nanotechnol., 2015, 10, 924 CrossRef CAS.
- A. Pandey, S. Som, V. Kumar, V. Kumar, K. Kumar, V. K. Rai and H. Swart, Enhanced upconversion and temperature sensing study of Er3+–Yb3+ codoped tungsten–tellurite glass, Sens. Actuators, B, 2014, 202, 1305–1312 CrossRef CAS.
- G. Dong, X. Xiao, Y. Chi, B. Qian, X. Liu, Z. Ma, S. Ye, E. Wu, H. Zeng and D. Chen, Polarized luminescence properties of TiO2:Sm3+ microfibers and microbelts prepared by electrospinning, J. Phys. Chem. C, 2009, 113, 9595–9600 CrossRef CAS.
- G. Li, Z. Hou, C. Peng, W. Wang, Z. Cheng, C. Li, H. Lian and J. Lin, Electrospinning derived one-dimensional LaOCl:Ln3+ (Ln= Eu/Sm, Tb, Tm) nanofibers, nanotubes and microbelts with multicolor-tunable emission properties, Adv. Funct. Mater., 2010, 20, 3446–3456 CrossRef CAS.
- H. Yu, H. Zhao, Y. Wu, B. Chen and J. Sun, Electrospun ZnCo2O4/C composite nanofibers with superior electrochemical performance for supercapacitor, J. Phys. Chem. Solids, 2020, 140, 109385 CrossRef CAS.
- W. Ge, J. Shi, M. Xu, X. Chen and J. Zhu, Red upconversion luminescence (UCL) properties in one-dimensional Yb2Ti2O7:Er nanofibers via an electrospinning route, J. Alloys Compd., 2019, 788, 993–999 CrossRef CAS.
- D. Li, X. Dong, W. Yu, J. Wang and G. Liu, Synthesis and upconversion luminescence properties of YF3: Yb3+/Er3+ hollow nanofibers derived from Y2O3: Yb3+/Er3+ hollow nanofibers, J. Nanopart. Res., 2013, 15, 1704 CrossRef.
- L. L. Wang, X. M. Liu and Z. Y. Hou, et al., Electrospinning Synthesis and Luminescence Properties of One-Dimensional Zn2SiO4:Mn2+ Microtibers and Microbelts, J. Phys. Chem. C, 2008, 112(48), 18882–18888 CrossRef CAS.
- B. P. Singh, A. K. Parchur, R. S. Ningthoujam, P. V. Ramakrishna, S. Singh, P. Singh, S. B. Rai and R. Maalej, Enhanced up-conversion and temperature-sensing behaviour of Er3+ and Yb3+ co-doped Y2Ti2O7 by incorporation of Li+ ions, Phys. Chem. Chem. Phys., 2014, 16, 22665–22676 RSC.
- R. Lei, X. Luo, Z. Yuan, H. Wang, F. Huang, D. Deng and S. Xu, Ultrahigh-sensitive optical temperature sensing in Pr3+:Y2Ti2O7 based on diverse thermal response from trap emission and Pr3+ red luminescence, J. Lumin., 2019, 205, 440–445 CrossRef CAS.
- M. F. H. Schuurmans and J. M. F. V. Dijk, On radiative and non-radiative decay times in the weak coupling limit, Physica B+C, 1984, 123, 131–155 CrossRef CAS.
- P. Vishwakarma, P. Shahi, S. Rai and A. Bahadur, Low temperature optical sensor based on non-thermally coupled level of Ho3+ and defect level of Zn2+ in Yb3+: Y2Ti2O7 phosphor, J. Phys. Chem. Solids, 2020, 109445 CrossRef CAS.
- J. Chen, Y. Song, D. Li, Q. Ma, X. Dong, W. Yu, X. Wang, Y. Yang, J. Wang and G. Liu, Investigating efficient energy transfer in novel strategy-obtained Gd2O2S:Dy3+, Eu3+ nanofibers endowed with white emitting and magnetic dual-functionality, J. Lumin., 2019, 206, 509–517 CrossRef CAS.
- Z. Dong, S. J. Kennedy and Y. Wu, Electrospinning materials for energy-related applications and devices, J. Power Sources, 2011, 196, 4886–4904 CrossRef CAS.
- Z. Yu, L. Shen, D. Li, E. Pun, J. Guo and H. Lin, Differentiation of photon generation depended on electrospun configuration in Eu3+/Tb3+ doped polyacrylonitrile nanofibers, J. Alloys Compd., 2019, 786, 1040–1050 CrossRef CAS.
- P. Jenouvrier, G. Boccardi and J. Fick, et al., Up-conversion emission in rare earth-doped Y2Ti2O7 sol-gel thin films, J. Lumin., 2005, 113, 291–300 CrossRef CAS.
- S.-H. Lee, B.-C. Ku, X. Wang, L. Samuelson and J. Kumar, Design, synthesis and electrospinning of a novel fluorescent polymer for optical sensor applications, MRS Proc., 2001, 708, BB10.45 CrossRef.
- A. Urrutia, J. Goicoechea, P. J. Rivero, I. R. Matías and F. J. Arregui, Electrospun nanofiber mats for evanescent optical fiber sensors, Sens. Actuators, B, 2013, 176, 569–576 CrossRef CAS.
- E. Hu, P. Lin, E. Y.-B. Pun, J. Yuan, H. Lin and X. Zhao, Fluorescent Thermal Feedback in Ho3+/Yb3+ Doped Y2Ti2O7 Electrospun Nanofibers, J. Electrochem. Soc., 2020, 167, 027510 CrossRef CAS.
- P. Dai, X. Zhang, M. Zhou, X. Li, J. Yang, P. Sun, C. Xu and Y. Liu, Thermally Stable Pyrochlore Y2Ti2O7:Eu3+ Orange-Red Emitting Phosphors, J. Am. Ceram. Soc., 2012, 95, 658–662 CrossRef CAS.
- P. Jenouvrier, J. Fick, M. Audier and M. Langlet, Microstructure and photoluminescence properties of sol-gel Y2−xErxTi2O7 thin films, Opt. Mater., 2004, 27(2), 131–137 CrossRef CAS.
- Z. Chen, M. Wang, H. Wang, Z. Le, G. Huang, L. Zou, Z. Liu, D. Wang, Q. Wang and W. Gong, Fabrication of Y2Ti2O7:Yb3+, Ho3+ nanoparticles by a gel-combustion approach and upconverting luminescent properties, J. Alloys Compd., 2014, 608, 165–169 CrossRef CAS.
- C.-C. Ting, Y.-S. Chiu, C.-W. Chang and L.-C. Chuang, Visible and infrared luminescence properties of Er3+-doped Y2Ti2O7 nanocrystals, J. Solid State Chem., 2011, 184, 563–571 CrossRef CAS.
- R. D. Shannon and C. T. Prewitt, Effective ionic radii in oxides and fluorides, Acta Crystallogr., 1969, 25, 925–946 CrossRef CAS.
- B. D. Pelatt, J. F. Wager and D. A. Keszler, Elucidation of bonding trends from variability in Atomic Solid State Energies, J. Solid State Chem., 2019, 274, 337–351 CrossRef CAS.
- F. Auzel, Upconversion and Anti-Stokes Processes With f and d Ions in Solids, Chem. Rev., 2004, 104, 139–173 CrossRef CAS.
- F. Auzel, Compteur quantique par transfert d'energie entre deux ions de terres rares dans un tungstate mixte et dans un verre, C. R. Acad. Sci. Paris, 1966, 262, 1016–1019 Search PubMed.
- V. V. Ovsyankin and P. P. Feofilov, Cooperative Sensitization of Luminescence in Crystals Activated with Rare Earth Ions, Sov. Phys. JETP Lett., 1966, 4, 317–318 Search PubMed.
- E. Desurvire and J. R. Simpson, Evaluation of 4I15/2 and 4I13/2 Stark-level energies in erbium-doped aluminosilicate glass fibers, Opt. Lett., 1990, 15, 547–549 CrossRef CAS.
- C. Strohhöfer and A. Polman, Absorption and emission spectroscopy in Er3+–Yb3+ doped aluminum oxide waveguides, Opt. Mater., 2003, 21, 705–712 CrossRef.
- K. Zheng, L. Wang, D. Zhang, D. Zhao and W. Qin, Power switched multiphoton upconversion emissions of Er3+ in Yb3+/Er3+ codoped β-NaYF4 microcrystals induced by 980 nm excitation, Opt. Express, 2010, 18, 2934–2939 CrossRef CAS.
- F. Vetrone, J. C. Boyer, J. A. Capobianco, A. Speghini and M. Bettinelli, Effect of Yb3+ codoping on the upconversion emission in nanocrystalline Y2O3:Er3+, J. Phys. Chem. B, 2003, 107, 1107–1112 CrossRef CAS.
- A. Zhou, F. Song, Y. Han, F. Song, D. Ju, K. Adnan, L. Liu and M. Feng, Color-tunable emission by adjusting sensitizer (Yb3+) and excitation power of 980 nm in NaGdTiO4:Yb3+/Tm3+/Er3+ phosphors for light emitting diodes, J. Lumin., 2018, 194, 225–230 CrossRef CAS.
- I. Leonidov, V. Zubkov, A. Tyutyunnik, N. V. Tarakina, L. Surat, O. Koryakova and E. Vovkotrub, Upconversion luminescence in Er3+/Yb3+ codoped Y2CaGe4O12, J. Alloys Compd., 2011, 509, 1339–1346 CrossRef CAS.
- X. Bai, H. Song, G. Pan, Y. Lei, T. Wang, X. Ren, S. Lu, B. Dong, Q. Dai and L. Fan, Size-dependent upconversion luminescence in Er3+/Yb3+-codoped nanocrystalline yttria: saturation and thermal effects, J. Phys. Chem. C, 2007, 111, 13611–13617 CrossRef CAS.
- S. Sinha, M. K. Mahata, K. Kumar and V. K. Rai, Dualistic temperature sensing in Er3+/Yb3+ doped CaMoO4 upconversion phosphor, Spectrochim. Acta, Part A, 2016, 173, 369–375 CrossRef.
- B. Dong, B. Cao, Y. He, Z. Liu, Z. Li and Z. Feng, Temperature sensing and in vivo imaging by molybdenum sensitized visible upconversion luminescence of rare − earth oxides, Adv. Mater., 2012, 24, 1987–1993 CrossRef CAS.
- C. D. Brites, P. P. Lima, N. J. Silva, A. Millán, V. S. Amaral, F. Palacio and L. D. Carlos, Thermometry at the nanoscale, Nanoscale, 2012, 4, 4799–4829 RSC.
- K. Linganna, G. Agawane, J.-H. In, J. Park and J. H. Choi, Spectroscopic properties of Er3+/Yb3+ co-doped fluorophosphate glasses for NIR luminescence and optical temperature sensor applications, J. Ind. Eng. Chem., 2018, 67, 236–243 CrossRef CAS.
- B. Tian, B. Chen, Y. Tian, X. Li, J. Zhang, J. Sun, S. Fu, H. Zhong, X. Zhang and H. Yu, Intense red upconversion emission and temperature sensing in Er3+/Yb3+ co-doped Ba5Gd8Zn4O21 phosphor, Mater. Express, 2013, 3, 241–246 CrossRef CAS.
- C. Li, B. Dong, S. Li and C. Song, Er3+–Yb3+ co-doped silicate glass for optical temperature sensor, Chem. Phys. Lett., 2007, 443, 426–429 CrossRef CAS.
- P. Du, L. Luo, W. Li and Q. Yue, Upconversion emission in Er-doped and Er/Yb-codoped ferroelectric Na0. 5Bi0. 5TiO3 and its temperature sensing application, J. Appl. Phys., 2014, 116, 014102 CrossRef.
- S. Fan, G. Gao, S. Sun, S. Fan, H. Sun and L. Hu, Absolute up-conversion quantum efficiency reaching 4% in β-NaYF4: Yb3+, Er3+ micro-cylinders achieved by Li+/Na+ ion-exchange, J. Mater. Chem. C, 2018, 6, 5453–5461 RSC.
- P. Du, L. Luo, Q. Yue and W. Li, The simultaneous realization of high-and low-temperature thermometry in Er3+/Yb3+-codoped Y2O3 nanoparticles, Mater. Lett., 2015, 143, 209–211 CrossRef CAS.
- D. Chen, W. Xu, Y. Zhou, Y. Zhou and Y. Chen, Lanthanide doped BaTiO3-SrTiO3 solid-solution phosphors: Structure, optical spectroscopy and upconverted temperature sensing behavior, J. Alloys Compd., 2019, 676, 215–223 CrossRef.
- R. Bokolia, M. Mondal, V. K. Rai and K. Sreenivas, Enhanced infrared-to-visible up-conversion emission and temperature sensitivity in (Er3+,Yb3+, and W6+) tri-doped Bi4Ti3O12 ferroelectric oxide, J. Appl. Phys., 2017, 121, 5029–5037 CrossRef.
Footnote |
| † Electronic supplementary information (ESI) available. See DOI: 10.1039/d0nj05478j |
| This journal is © The Royal Society of Chemistry and the Centre National de la Recherche Scientifique 2021 |

