Selective synthesis of epichlorohydrin via liquid-phase allyl chloride epoxidation over a modified Ti-MWW zeolite in a continuous slurry bed reactor†
Luoyi
Ding
,
Jinpeng
Yin
,
Wen
Tong
,
Rusi
Peng
 ,
Jingang
Jiang
,
Hao
Xu
* and
Peng
Wu
,
Jingang
Jiang
,
Hao
Xu
* and
Peng
Wu
 *
*
Shanghai Key Laboratory of Green Chemistry and Chemical Processes, School of Chemistry and Molecular Engineering, East China Normal University, North Zhongshan Road 3663, Shanghai 200062, China. E-mail: hxu@chem.ecnu.edu.cn; pwu@chem.ecnu.edu.cn
First published on 26th November 2020
Abstract
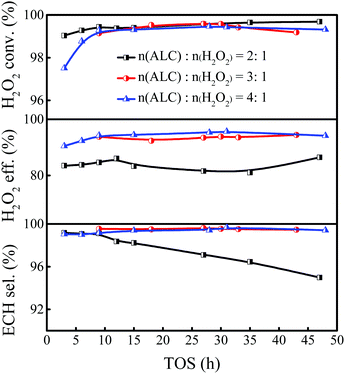
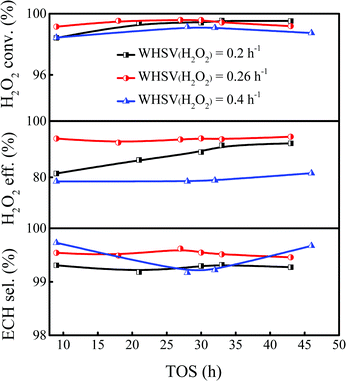
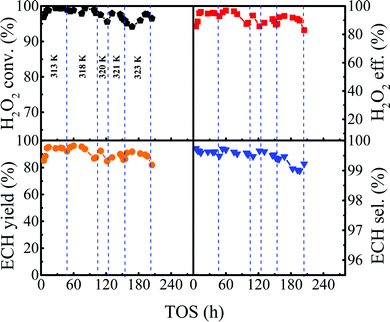
The epoxidation of allyl chloride (ALC) to epichlorohydrin (ECH) with H2O2 using a piperidine (PI)-modified Ti-MWW catalyst (Ti-MWW-PI) in a continuous slurry reactor was investigated to develop an efficient reaction system for the corresponding industrial process. The reaction parameters, including solvent, reaction temperature, t-butanol/ALC mass ratio, ALC/H2O2 molar ratio, weight hourly space velocity of H2O2, and the addition amount of ammonia, were studied in detail to pursue high H2O2 conversion and ECH selectivity. A long catalytic lifetime of 244 h was achieved at high H2O2 conversion (>97.0%) and ECH selectivity (>99.8%) under optimized reaction conditions. The crystallinity was well maintained for the deactivated Ti-MWW-PI catalyst, which was regenerated by a combination of calcination and piperidine treatment.
1 Introduction
Epichlorohydrin (ECH) is an important organic raw material, which is mainly used in the production of epoxy resins, glycerol, and chlorohydrin rubbers.1–3 Annually, the production of epichlorohydrin increases at a constant rate. Industrially, the main methods to produce epichlorohydrin are the chlorination of propylene at high-temperature, the allyl alcohol method, and the glycerol method.4,5 However, they all have certain disadvantages, such as the equipment corrosion caused by chlorine gas, high cost, complicated processes, and the low atomic economy due to technical shortcomings. In addition, the above methods would produce by-product calcium chloride or chlorine-containing wastewater, which caused serious environmental pollution. Therefore, the development of an environmentally friendly industrial process for producing ECH has a great practical significance.Zeolites, having uniform pore structures, good thermal and hydrothermal stability, and unique selectivity, are widely used as catalysts and adsorbents in petrochemical industries, environmental protection, bioengineering, food industries, and pharmaceutical fields.6–8 As catalysts, the catalytic active sites originate from both the traditional framework Al atoms and the later developed transition metal atoms introduced into the zeolite framework, such as Ti,9 Sn,10 and Fe.11 Titanium-substituted silicalite-1 (TS-1) with MFI topology was first synthesized by Taramasso and co-workers in 1983.12 It shows unique catalytic properties by using hydrogen peroxide as the oxidant in liquid-phase selective oxidation reactions, including phenol hydroxylation, cyclohexanone ammoximation, olefin epoxidation, etc., which aroused research interests due to the advantages of mild reaction conditions and yielding only water as the main by-product.13–16 As a second-generation Ti-zeolite, Ti-MWW possesses two independent sinusoidal 10-membered ring (MR) channels, as well as 12-MR supercages and side pockets.17–19 With a unique pore structure, Ti-MWW is superior to TS-1 in a series of catalytic oxidation reactions, such as the ammoxidation of aldehydes and ketones,20,21 the epoxidation of olefins22,23 and the oxidative desulfurization of thioethers.24
In recent decades, numerous post-treatments on Ti-MWW have been carried out to further improve the catalytic performance. The strategies of adjusting the pore structure were proposed to enhance the diffusion of substrates and the accessibility of Ti-active sites, such as the interlayer-expanded IEZ-Ti-MWW25 and the delaminated Del-Ti-MWW.26 Modifying the micro-environment of the Ti-active sites could also achieve the purpose of improving the catalytic activity and product selectivity. For instance, the epoxidation performance of olefins could be improved by embedding fluorine into the Ti-MWW framework due to the electron-pulling effect of fluorine atoms on adjacent Ti ions.27 In addition, it is widely recognized that the framework Ti species with higher coordination number have better catalytic performance in olefin epoxidation reactions.28,29 Numerous studies have been done on the construction of the hexa-coordinated Ti species for the purpose of high activity. Xu et al. synthesized TS-1 with highly catalytically active hexa-coordinated Ti species, which exhibited a turnover number nearly 70% higher than that of the conventional TS-1 in the epoxidation of 1-hexene.30 The structural rearrangement of Ti-MWW in aqueous piperidine (PI) solution, producing a two-dimensional organic–inorganic miscellaneous MWW-type titanosilicate, fabricated hexa-coordinated Ti species with PI molecules as the ligand, exhibiting high activity in the cyclopentene epoxidation reaction.31 Considering the appealing catalytic performance of Ti-MWW in the alkene epoxidation reactions and its modifiable structure and micro-environment of Ti-active sites, it has high potential to serve as an active catalyst in producing epichlorohydrin via the epoxidation of allyl chloride.
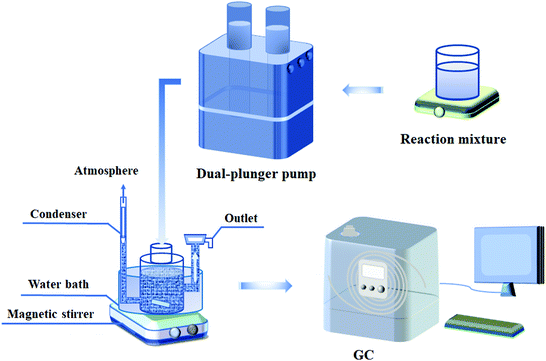
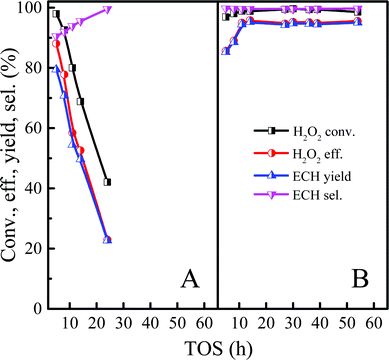
In our previous work, Ti-MWW was proved to be an effective catalyst in the batchwise ALC epoxidation reaction.32 In the present study, we tried to fabricate an effective reaction system based on the modified Ti-MWW catalyst and the slurry bed reactor, which simulates the industrial process. Three different titanosilicates were first compared in the ALC epoxidation reaction, and the Ti-MWW/H2O2/t-butanol catalytic system demonstrated a high catalytic activity. After the structural rearrangement assisted by PI, the obtained Ti-MWW-PI exhibited higher catalytic activity and ECH selectivity than those of Ti-MWW. The reaction parameters including solvent, reaction temperature, mass ratio of t-butanol/ALC, molar ratio of ALC/H2O2, and weight hourly space velocity (WHSV) of H2O2 were studied in detail in a slurry bed reactor, and the stability of the catalyst was also evaluated under the optimized conditions. The reasons for the catalyst deactivation were explored, and accordingly a certain amount of ammonia was added into the reaction system to inhibit the epichlorohydrin hydrolysis reaction and prolong the lifetime of the catalyst. Meanwhile, the deactivated catalyst could be regenerated by a combination of calcination and piperidine treatment.
2 Experimental
2.1 Preparation of catalysts
![[thin space (1/6-em)]](https://www.rsc.org/images/entities/char_2009.gif) :
:![[thin space (1/6-em)]](https://www.rsc.org/images/entities/char_2009.gif) 30, and it was dried at 373 K for 12 h after a thorough washing with distilled water. Finally, the sample was calcinated at 823 K for 6 h to obtain the Ti-MWW catalyst.
30, and it was dried at 373 K for 12 h after a thorough washing with distilled water. Finally, the sample was calcinated at 823 K for 6 h to obtain the Ti-MWW catalyst.
2.2 Characterization methods
The structure and crystallinity of the samples were analyzed using a Rigaku ultima IV X-ray powder diffractometer with a Cu-Kα ray source (λ = 0.1541 nm) and a nickel filter. The working voltage and current were 35 kV and 25 mA, respectively. Using BaSO4 as the reference, the UV-Vis spectra were obtained on a Shimadzu UV-2700 spectrophotometer. SEM images were taken using a Hitachi S-4800 scanning electron microscope with an acceleration voltage of 3 kV and an acceleration current of 10 μA. The XPS spectra were collected using an Axis Ultra Imaging Photoelectron spectrometer (Kratos Analytical Ltd). An inductively coupled plasma-atomic emission spectrometer (ICP-AES) was used to determine the amounts of Ti and Si in the zeolites on an IRIS Intrepid II XSP after the samples were dissolved in HF solution. A BELSORP® instrument was used to determine the surface and pore volume of the samples by N2 physical sorption at 77 K after being dehydrated in a vacuum at 573 K for 6 h. The specific surface area was calculated by the Brunauer–Emmett–Teller (BET) method, and the pore volume and external specific surface area were calculated by the t-plot method. Netzsch Sta 4049 F3 apparatus was used to determine the content of organic species in the zeolites in the air with a heating rate of 10 K min−1 in the temperature range of 298–1073 K. A Varian VNMRS-400 MB NMR spectrometer was used to record the 29Si MAS NMR spectra at a frequency and spinning rate of 100.54 MHz and 3 KHz, respectively. The chemical shift was referred to the standard of [(CH3)3SiO]8SiO12.2.3 Catalytic reaction
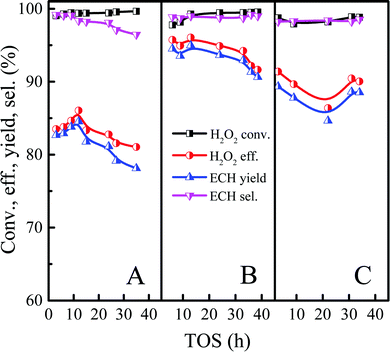
The  and nH2O2 refer to the initial and final molar amounts, respectively. nECH and nCPDL stand for the molar amounts of ECH and 3-chloro-1,2-propanediol (CPDL), respectively. The H2O2 conv., H2O2 eff., ECH yield, and ECH sel., represent the conversion of H2O2, the utilization efficiency of H2O2, the yield of ECH, and the selectivity of ECH, respectively.
3 Results and discussions
3.1 Screening of the titanosilicate catalysts and solvents
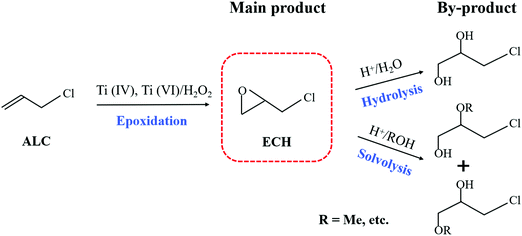
Since the crystal morphology, pore structure and solvent have crucial influence on the reaction performance, we first screened the types of titanosilicates and solvents for the ALC epoxidation reaction. The XRD patterns of TS-1, Ti-MOR, Ti-MWW and Ti-MWW-PI are displayed in Fig. S1 (ESI†). All these Ti-zeolites showed well-resolved characteristic diffraction peaks indicating high crystallinity. In addition, the XRD pattern of Ti-MWW-PI showed the layer-related 001 and 002 diffraction peaks at 2θ = 3–7°, indicating that piperidine molecules were inserted into MWW zeolite and the 3-dimensional (3D) MWW structure was transformed to a 2D one.31 The coordination states of Ti species are shown in Fig. S2 (ESI†). The four titanosilicates showed a dominant band at about 210 nm, which illustrated that Ti species mainly tetrahedrally coordinated in the framework.35 Generally, the bands in the range of 260–290 nm are ascribed to hexa-coordinated Ti species.28 Ti-MWW-PI showed a shoulder peak at 280 nm in addition to the main absorption peak at 210 nm, indicating the presence of hexa-coordinated Ti species in Ti-MWW-PI. The crystal morphologies of these titanosilicates were revealed by SEM images, as shown in Fig. S3 (ESI†). Ti-MWW was composed of nano-sheets with a thickness of ∼100 nm (Fig. S3a, ESI†). After piperidine treatment, the crystal morphology was well maintained (Fig. S3b, ESI†). TS-1 showed uniform nanoparticle crystals with the size of 0.2–0.4 μm (Fig. S3c, ESI†), and Ti-MOR showed irregular crystals with the size of about 0.2–0.5 μm (Fig. S3d, ESI†). The N2 adsorption–desorption isotherms showed that these four titanosilicates have the characteristics of microporous structures (Fig. S4, ESI†). The specific surface areas (SSAs) of TS-1, Ti-MOR and Ti-MWW were similar (440–461 m2 g−1), and they also exhibited very close micropore volumes of 0.146–0.159 cm3 g−1. The SSA of Ti-MWW-PI decreased from 461 m2 g−1 to 79 m2 g−1 after piperidine treatment, due to the pore-filling effect of piperidine in the Ti-MWW framework. In addition, the Si/Ti ratio of Ti-MWW-PI was maintained after piperidine treatment (Table S1, ESI†).For the titanosilicate/H2O2 catalytic systems, the participation of solvents is indispensable, because it not only homogenized the reaction system, but also interacted with the reactants in various ways. The proper solvent can significantly accelerate the main reaction and simultaneously effectively suppress the occurrence of side reactions. In addition, the optimal solvents for titanosilicates with distinct topological structures are very different.36 Therefore, the effects of the zeolite structure and solvents on the epoxidation of ALC to ECH were investigated in a batchwise reactor. Table 1 summarizes the reaction results of the epoxidation of ALC over different titanosilicates in various solvents. In this reaction system (Scheme 2), the main product was ECH, and the 3-chloro-1,2-propanediol (CPDL) was the main by-product, which was produced by hydrolyzing ECH at the weak acid sites (Ti–OH and Si–OH) of Ti-zeolite. ECH may undergo further solvolysis to produce high-boiling by-product hydroxyethers if methanol was used as a solvent.32 Ti-MOR with a one-dimensional straight channel structure exhibited the lowest ALC conversion and ECH selectivity for the epoxidation of ALC, no matter in which solvent. Furthermre, previous reports also proved that it was not a suitable candidate for catalyzing the alkene epoxidation.37 On the contrary, it shows extremely high catalytic performance in the ammoximation reactions.38,39 Generally, TS-1 could achieve high alkene conversion in methanol for the alkene epoxidation reaction. However, the TS-1/MeOH catalytic system showed a moderate catalytic activity for the epoxidation of ALC with a conversion of 53.9%. Moreover, the solvent reaction between methanol and ECH resulted in a low ECH selectivity of 94.2%, consistent with previous studies.40 In general, for the alkene epoxidation, the suitable solvent for Ti-MWW was acetonitrile.32 With t-butanol (TBA) as the solvent, Ti-MWW showed the highest ALC conversion of 90.3%, but a relatively low ECH selectivity of 93.3%. Acetone was also a good solvent for Ti-MWW in the epoxidation of ALC to ECH, but a previous study proposed that acetone was toxic.41 After the modification of PI molecules, the ALC conversion was increased to 91.4%, and the ECH selectivity was up to 99.5% with TBA as the solvent. Ti-MWW-PI could still maintain the high ALC conversion when the amount of catalyst and reaction time were halved. Moreover, no matter which solvent was used, the selectivity of ECH with Ti-MWW-PI as a catalyst was more than 99.5%, and it was much higher than that of Ti-MWW. However, when we directly added piperidine with the same amount as that occluded in Ti-MWW-PI to the reaction system, the ALC and H2O2 conversion were decreased from 71.8% and 79.6% to 11.7% and 30.2%, respectively (Table S3, ESI†). It indicated that the introduction of PI directly in the reaction system suppressed the reaction activity, and the PI molecules might need to be embedded in the Ti-MWW framework to improve the catalytic performance. As has been proved in our previous study,31 the alkaline PI molecules not only coordinated with a Ti atom to enhance the catalytic activity, but also neutralized the weak acidity and prohibited the occurrence of ring-opening side reactions. In summary, the system of Ti-MWW-PI/H2O2/TBA was the most suitable for the epoxidation of ALC to ECH.
| Catalyst | Solvent | ALC conv. (%) | ECH sel. (%) | H2O2 (%) | |
|---|---|---|---|---|---|
| Conv. | Eff. | ||||
| a Reaction conditions: catalyst, 0.1 g; allyl chloride, 10 mmol; H2O2 (30 wt%), 10 mmol; solvent, 5 mL; temp., 333 K; time, 2 h. b The amount of catalyst and reaction time were halved and other conditions remained unchanged. | |||||
| TS-1 | MeCN | 23.4 | 97.8 | 49.5 | 47.3 |
| MeOH | 53.9 | 94.2 | 95.3 | 56.5 | |
| TBA | 36.6 | 93.5 | 58.9 | 62.0 | |
| Acetone | 86.2 | 97.9 | 94.3 | 91.3 | |
| Ti-MOR | MeCN | 0.2 | 41.5 | 13.2 | 1.6 |
| MeOH | 1.3 | 93.2 | 4.8 | 27.8 | |
| TBA | 0.1 | 89.2 | 9.3 | 0.5 | |
| Acetone | 2.9 | 95.0 | 38.8 | 7.3 | |
| Ti-MWW | MeCN | 59.2 | 99.7 | 85.4 | 69.3 |
| MeOH | 14.9 | 98.6 | 43.1 | 34.5 | |
| TBA | 90.3 | 93.3 | 92.1 | 98.1 | |
| TBAb | 71.8 | 99.0 | 79.6 | 90.2 | |
| Acetone | 82.2 | 96.5 | 94.0 | 87.4 | |
| Ti-MWW-PI | MeCN | 66.1 | 99.7 | 94.6 | 69.9 |
| MeOH | 84.5 | 98.9 | 89.6 | 94.3 | |
| TBA | 91.4 | 99.5 | 92.0 | 99.4 | |
| TBAb | 90.0 | 99.8 | 92.0 | 97.8 | |
| Acetone | 90.5 | 99.9 | 93.0 | 97.3 | |
3.2 Effects of the reaction conditions on continuous epoxidation of ALC over Ti-MWW-PI
3.3 Catalyst regeneration
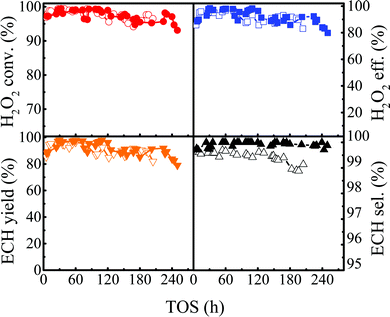
Generally, the main reasons for the deactivation of zeolite catalysts are structural collapse, loss or poisoning of active components, which is the irreversible deactivation, while the coke deposition belongs to reversible deactivation. The physicochemical properties of the used Ti-MWW-PI in the continuous reaction as shown in Fig. 6 were characterized to explore the deactivation reason and then perform corresponding regeneration. As shown in Fig. 7c, the intensity of the layer-related 001 and 002 diffraction peaks decreased significantly for the deactivated Ti-MWW-PI, probably due to the coke deposition and the loss of some piperidine molecules in the epoxidation reaction of ALC to ECH. The peak intensity for the regenerated Ti-MWW-PI could be recovered obviously by a combination of calcination and treatment with piperidine (Fig. 7d). Additionally, the SEM images showed that the morphology and thickness of all the samples were not changed obviously, before and after the deactivation (Fig. S5, ESI†). Thus, the loss of piperidine molecules might be one of the reasons for catalyst deactivation.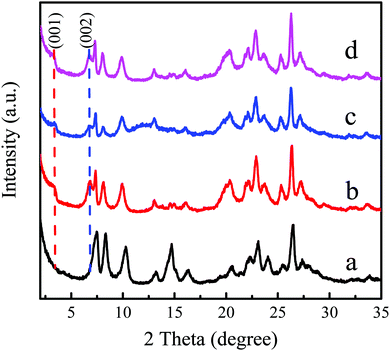 | ||
| Fig. 7 XRD patterns of Ti-MWW (a), fresh Ti-MWW-PI (b), deactivated Ti-MWW-PI (c), and regenerated Ti-MWW-PI (d). | ||
To further explain that the loss of PI during the catalytic reaction was one of the reasons of deactivation, the 29Si MAS NMR spectra were collected. Ti-MWW showed a resonance band at −98.1 ppm, attributed to the Q3 silanol groups. Compared with the Ti-MWW, the resonance bands of fresh Ti-MWW-PI at −102.6 ppm (Q3 groups) and −94.8 ppm (Q2 groups) were very intense, indicating that there were more hydroxyl groups due to the transformation of the 3D MWW structure to a 2D lamellar one as well as the dissolution of MWW layers caused by PI molecules. After deactivation, the amounts of Q2 and Q3 groups significantly decreased, probably because the 2D structure was transformed back into the 3D structure due to the loss of PI molecules during the reaction process, in agreement with the results of the XRD patterns. After calcination and piperidine treatment, the amounts of Q2 and Q3 groups were obviously restored.
The variation of the coordination state of Ti-active sites before and after the reaction was monitored by the UV-Vis spectra (Fig. 9). The Ti-MWW related samples all showed a dominant band at ∼210 nm, indicating that the Ti species mainly existed in the tetra-coordinated state.35 After rearrangement of Ti-MWW, a shoulder peak appeared at 280 nm of Ti-MWW-PI displaying the presence of hexa-coordinated Ti species.28 The band at 260 nm appeared after the catalyst was deactivated, probably due to the leaching of Ti species from the framework to form an extra-framework Ti species in the catalytic reaction.44 And the band at 330 nm in the UV-Vis spectrum of the deactivated catalyst could be attributed to the TiO2 species33 and the coke deposition.31 The 330 nm band almost disappeared after regeneration, indicating the removal of coke deposition upon calcination. However, the extremely small amount of TiO2 species, originating from the migration of framework Ti to the external surface in the reaction, still existed after regeneration, which contributed to the minor adsorption band at 330 nm in the regenerated sample. And the band at 280 nm corresponding to the hexa-coordinated Ti species was recovered because of the piperidine treatment. The Si/Ti ratio of the used Ti-MWW-PI (49.0) was increased compared to the fresh Ti-MWW-PI (39.5) as shown in Table 2, indicative of the leaching of Ti-active sites in the reaction, which would accelerate the deactivation of the catalyst. In addition, the Si/Ti ratio was maintained in the regeneration process.
| Catalyst | Si/Tia | SSAb (m2 g−1) | Pore volume (cm3 g−1) | Weight lossh (wt%) | ||||
|---|---|---|---|---|---|---|---|---|
| Total | Internal | Totalc | Micro.d | Step 1 | Step 2 | Total | ||
| a Determined by ICP analysis. b SSA: specific surface area, determined by N2 adsorption isotherms. c Total pore volume, given by N2 adsorption at p/p0 = 0.99. d Micropore volume given by t-plot method. e Piperidine treatment at 443 K for 24 h. f Fresh Ti-MWW-PI after being used in the continuous ALC epoxidation for 204 h as shown in Fig. 6. g Regenerated by a combination of calcination at 823 K for 6 h and piperidine treatment at 443 K for 24 h. h Given by TG analysis, step 1, 423–573 K, and step 2, 573–1073 K. | ||||||||
| Ti-MWW | 39.1 | 461 | 375 | 0.636 | 0.152 | — | — | — |
| Fresh Ti-MWW-PIe | 39.5 | 79 | 14 | 0.427 | 0.010 | 9.0 | 5.6 | 14.6 |
| Deactivated Ti-MWW-PIf | 49.0 | 69 | 5 | 0.512 | 0.001 | — | — | 39.3 |
| Regenerated Ti-MWW-PIg | 48.2 | 103 | 16 | 0.662 | 0.008 | 8.3 | 5.1 | 13.4 |
To further investigate the coordination environment of titanium species, the state of Ti species were characterized by X-photoelectron spectroscopy (XPS). As shown in Fig. 10b, after piperidine treatment, the Ti 2p3/2 peak shifted from 460.3 and 459.3 eV to 459.7 and 458.9 eV, respectively, indicating that the density of the electron cloud around the Ti species increased and the coordinated state of the Ti species became more negatively charged, which implied the presence of hexa-coordinated Ti species with piperidine (PI) as the ligand, consistent with the previous report.31 For the deactivated Ti-MWW-PI, the binding energy of the Ti 2p peak was increased (Fig. 10c), mainly due to the loss of PI during the reaction, in good agreement with the XRD pattern (Fig. 7c) and the 29Si MAS NMR spectra (Fig. 8c). After the calcination and piperidine treatment, the binding energy of regenerated Ti-MWW-PI was restored to the state of fresh Ti-MWW-PI (Fig. 10d).
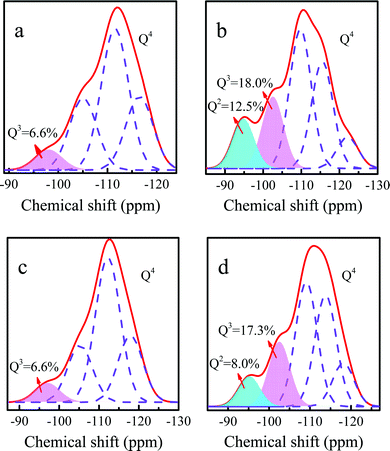 | ||
| Fig. 8 29Si MAS NMR spectra of Ti-MWW (a), fresh Ti-MWW-PI (b), deactivated Ti-MWW-PI (c), and regenerated Ti-MWW-PI (d). | ||
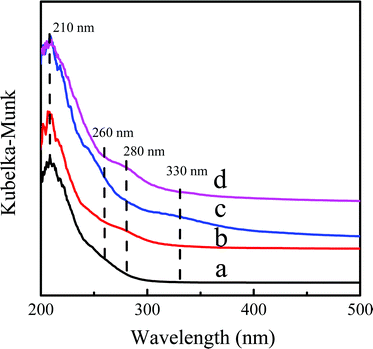 | ||
| Fig. 9 UV-Vis spectra of Ti-MWW (a), fresh Ti-MWW-PI (b), deactivated Ti-MWW-PI (c), and regenerated Ti-MWW-PI (d). | ||
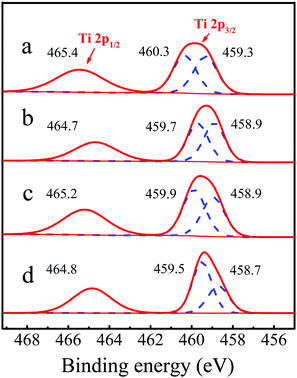 | ||
| Fig. 10 Ti 2p XPS spectra of Ti-MWW (a), fresh Ti-MWW-PI (b), deactivated Ti-MWW-PI (c), and regenerated Ti-MWW-PI (d). | ||
The thermogravimetric curves of Ti-MWW, fresh Ti-MWW-PI, deactivated Ti-MWW-PI, and regenerated Ti-MWW-PI are shown in Fig. 11. Generally, the weight loss below 423 K is attributed to physically adsorbed water. After the structural rearrangement of Ti-MWW assisted by PI molecules, there were two peaks in the temperature ranges of 423–573 K and 573–1073 K, attributed to the thermal decomposition of piperidine between and within the MWW layers, respectively. Meanwhile, a small part of weight loss at high temperature could also be contributed by the condensation of Si–OH groups. The deactivated Ti-MWW-PI showed three weight loss peaks in the temperature range of 298–1073 K (Fig. 11c), with the two weight losses above 423 K attributed to the piperidine molecules and coke deposition. Furthermore, the total organic species accounted for ∼39.3%, implying the coke deposition was the main reason of the deactivation of the catalyst. Thus, reducing the formation of by-product would be effective to extend the lifetime of the catalyst by suppressing the coke deposition.32 The TG curve of the regenerated Ti-MWW-PI was similar to the fresh Ti-MWW-PI, meaning that it could be restored after a combination of calcination and piperidine treatment (Fig. 11b and d). Part of the introduced piperidine molecules coordinated with the Ti atoms by N atoms, and the remaining piperidine molecules filled in the pore channels, because the amount of piperidine molecules was more than that of Ti species in Ti-MWW-PI.45 Therefore, it could be speculated that the amount of PI was related to the amount of Ti species. The CHN elemental analysis showed that the amount of N in the regenerated Ti-MWW-PI (1.77%) decreased slightly compared with the fresh sample (1.95%). According to ICP analysis, it could be observed that the Ti leaching occurred in the epoxidation process, and combining the TG analysis, the specific amount of Ti species could be determined. By calculating the Ti/PI ratio, it could be determined that the Ti/PI ratio of fresh Ti-MWW-PI (0.24) and regenerated Ti-MWW-PI (0.23) were almost unchanged (Table 3). Thus, the decrease of piperidine content after regeneration was highly related to the leaching of Ti species.
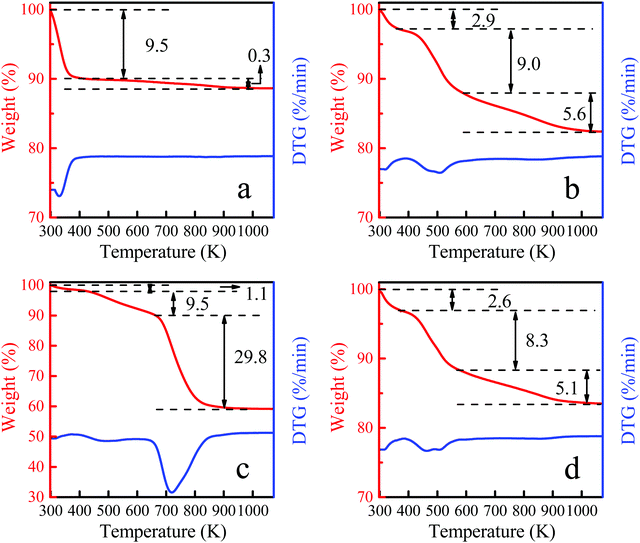 | ||
| Fig. 11 TG curves of Ti-MWW (a), fresh Ti-MWW-PI (b), deactivated Ti-MWW-PI (c), and regenerated Ti-MWW-PI (d). | ||
| Catalyst | N amountb (wt%) | ALC conv. (%) | ECH sel. (%) | H2O2 conv. (%) | H2O2 eff. (%) |
|---|---|---|---|---|---|
| a Reaction conditions: catalyst, 0.05 g; allyl chloride, 10 mmol; H2O2 (30 wt%), 10 mmol; TBA, 5 mL; temp., 333 K; time, 1 h. b Determined by CHN analysis. c Deactivated Ti-MWW-PI after being used in the continuous ALC epoxidation for 204 h as shown in Fig. 6. d Regenerated by a combination of calcination and piperidine treatment. | |||||
| Fresh Ti-MWW-PI | 1.95 | 90.0 | 99.8 | 92.0 | 97.8 |
| Deactivated Ti-MWW-PIc | — | 11.0 | 40.1 | 18.7 | 59.2 |
| Regenerated Ti-MWW-PId | 1.77 | 78.7 | 99.7 | 90.9 | 86.6 |
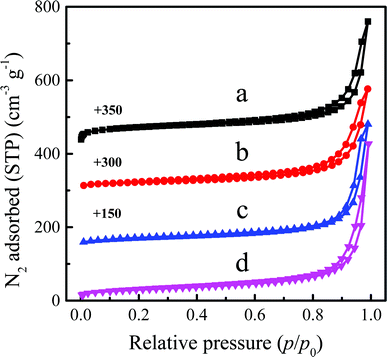 | ||
| Fig. 12 N2 adsorption–desorption isotherms of Ti-MWW (a), fresh Ti-MWW-PI (b), deactivated Ti-MWW-PI (c), and regenerated Ti-MWW-PI (d). | ||
After the rearrangement of the structure, the piperidine molecules entered the intralayer pores and interlayer spaces of Ti-MWW, decreasing the specific surface area and micropore volume of the fresh Ti-MWW-PI. The specific surface area and micropore volume further decreased for deactivated Ti-MWW-PI, due to the coke deposition during the reaction process (Table 2). The specific surface area and micropore volume of the catalyst can be recovered well after regeneration (Fig. 12). However, the total surface area (103 m2 g−1) of the regenerated Ti-MWW-PI was larger than that of the fresh Ti-MWW-PI (79 m2 g−1), because the amount of piperidine entering the MWW framework was reduced due to the leaching of Ti species, which had been revealed above. The catalytic performance of the fresh Ti-MWW-PI, deactivated Ti-MWW-PI, and regenerated Ti-MWW-PI for the epoxidation of ALC was evaluated in a batchwise reactor (Table 3). After deactivation, the ALC conversion and ECH selectivity significantly decreased from 90.0% and 99.8% to 11.0% and 40.1%, respectively. And the ALC conversion and ECH selectivity of regenerated Ti-MWW-PI recovered to 78.7% and 99.7%, respectively. The catalytic performance could only be partially restored due to the leaching of Ti-active sites and gradual variation of Ti coordination sites.
3.4 Extending the lifetime of a catalyst
4 Conclusions
Herein, the slurry bed reaction process of ALC epoxidation to ECH was systematacially investigated with the Ti-MWW-PI/H2O2/TBA catalytic system. Under optimized conditions, the lifetime of the Ti-MWW-PI catalyst achieved 244 h with a high ECH selectivity (>99.8%) and a high H2O2 conversion (>97.0%). The Ti-MWW-PI/H2O2/TBA system catalyzed the epoxidation of ALC displaying that the main reason for the deactivation of the catalyst was coke deposition. Meanwhile, the loss of PI molecules and Ti species during the reaction process would also accelerate the deactivation of the catalyst. After a combination of calcination and piperidine treatment, the catalytic performance of the deactivated catalyst could only be partially restored due to the leaching of part of the Ti species during the reaction process. In addition, the employment of a slurry bed continuous reactor increased the contact area between the catalyst and the liquid-phase reaction mixture to promote the catalytic activity of reaction, which also facilitated the separation of the catalyst. This work might provide a potential way for the green industrialization of the epoxidation of ALC to ECH.Conflicts of interest
There are no conflicts to declare.Acknowledgements
This study is financially supported by the National Natural Science Foundation of China (Grant No. 21872052, 21533002, and 21972044), the Ministry of Science and Technology of the People's Republic of China (2016YFA0202804) and the Fundamental Research Funds for the Central Universities.References
- M. Wang, J. C. Zhou, G. Y. Mao and X. L. Zheng, Ind. Eng. Chem. Res., 2012, 51, 12730–12738 CrossRef CAS.
- A. M. Krzyżanowska, E. Milchert and W. M. Paździoch, Ind. Eng. Chem. Res., 2013, 52, 10890–10895 CrossRef.
- Q. F. Wang, Z. T. Mi, Y. Q. Wang and L. Wang, J. Mol. Catal. A: Chem., 2005, 229, 71–75 CrossRef CAS.
- A. Almena and M. Martín, Ind. Eng. Chem. Res., 2016, 55, 3226–3238 CrossRef CAS.
- J. Li, G. Zhao, S. Gao, Y. Lv, J. Li and Z. Xi, Org. Process Res. Dev., 2006, 10, 876–880 CrossRef CAS.
- A. Corma, Chem. Rev., 1997, 97, 2373–2419 CrossRef CAS.
- C. Perego, A. Carati, P. Ingallina, M. A. Mantegazza and G. Bellussi, Appl. Catal., A, 2001, 221, 63–72 CrossRef CAS.
- Q. H. Zhao, F. Wu, K. Xie, R. Singh, J. H. Zhao, P. Xiao and P. A. Webley, Chem. Eng. J., 2018, 336, 659–668 CrossRef CAS.
- P. Wu and T. Tatsumi, Chem. Commun., 2002, 1026–1027 RSC.
- M. Renz, T. Blasco, A. Corma, V. Fornés, R. Jensen and L. Nemeth, Chem. – Eur. J., 2002, 8, 4708–4717 CrossRef CAS.
- G. I. Panov, G. A. Sheveleva, A. S. Kharitonov, V. N. Romannikov and L. A. Vostrikova, Appl. Catal., A, 1992, 82, 31–36 CrossRef CAS.
- M. Taramasso, G. Perego and B. Notari, US Pat., 4410501, 1983 Search PubMed.
- W. Y. Jiao, Y. He and J. F. Li, Appl. Catal., A, 2015, 491, 78–85 CrossRef CAS.
- A. Bhaumik, P. Mukherjee and R. Kumar, J. Catal., 1998, 178, 101–107 CrossRef CAS.
- R. Kumar, P. Mukherjee and A. Bhaumik, Catal. Today, 1999, 49, 185–191 CrossRef CAS.
- Z. Li, R. Chen and W. Xing, Ind. Eng. Chem. Res., 2010, 49, 6309–6316 CrossRef CAS.
- P. Wu, T. Tatsumi, T. Komatsu and T. Yashima, Chem. Lett., 2000, 774–775 CrossRef CAS.
- P. Wu, T. Tatsumi, T. Komatsu and T. Yashima, J. Catal., 2001, 202, 245–255 CrossRef CAS.
- P. Wu and T. Tatsumi, J. Phys. Chem. B, 2002, 106, 748–753 CrossRef CAS.
- F. Song, Y. M. Liu and H. H. Wu, J. Catal., 2006, 237, 359–367 CrossRef CAS.
- J. H. Ding, L. Xu, Y. J. Yu, H. H. Wu, S. J. Huang, Y. L. Yang, J. Wu and P. Wu, Catal. Sci. Technol., 2013, 3, 2587–2595 RSC.
- P. Wu and T. Tatsumi, J. Catal., 2003, 214, 317–326 CrossRef CAS.
- P. Wu, Y. M. Liu, M. Y. He and T. Tatsumi, J. Catal., 2004, 228, 183–191 CAS.
- G. H. Gao, S. F. Cheng and Y. An, ChemCatChem, 2010, 2, 459–466 CrossRef CAS.
- P. Wu, J. F. Ruan, L. L. Wang, L. L. Wu, Y. Wang, Y. M. Liu, W. B. Fan, M. Y. He, O. Terasaki and T. Tatsumi, J. Am. Chem. Soc., 2008, 130, 8178–8187 CrossRef CAS.
- P. Wu, D. Nuntasri, J. F. Ruan, Y. M. Liu, M. Y. He, W. B. Fan, O. Terasaki and T. Tatsumi, J. Phys. Chem. B, 2004, 108, 19126–19131 CrossRef CAS.
- X. Q. Fang, Q. Wang, A. M. Zheng, Y. M. Liu, L. F. Lin, H. H. Wu, F. Deng, M. Y. He and P. Wu, Phys. Chem. Chem. Phys., 2013, 15, 4930–4938 RSC.
- L. Z. Wu, X. J. Deng, S. F. Zhao, H. M. Yin, Z. X. Zhuo, X. Q. Fang, Y. M. Liu and M. Y. He, Chem. Commun., 2016, 52, 8679–8682 RSC.
- Q. Guo, K. J. Sun, Z. C. Feng, G. N. Li, M. L. Guo, F. T. Fan and C. Li, Chem. – Eur. J., 2012, 18, 13854–13860 CrossRef CAS.
- W. J. Xu, T. J. Zhang, R. S. Bai, P. Zhang and J. H. Yu, J. Mater. Chem. A, 2020, 8, 9677–9683 RSC.
- L. Xu, D. D. Huang, C. G. Li, X. Y. Ji, S. Q. Jin, Z. C. Feng, F. Xia, X. H. Li, F. T. Fan, C. Li and P. Wu, Chem. Commun., 2015, 51, 9010–9013 RSC.
- L. L. Wang, Y. M. Liu, W. Xie, H. J. Zhang, H. H. Wu, Y. W. Jiang, M. Y. He and P. Wu, J. Catal., 2007, 246, 205–214 CrossRef CAS.
- P. Wu, T. Tatsumi, T. Komatsu and T. Yashima, J. Phys. Chem. B, 2001, 105, 2897–2905 CrossRef CAS.
- Y. L. Yang, J. H. Ding, B. S. Wang, J. Wu, C. Zhao, G. H. Gao and P. Wu, J. Catal., 2014, 320, 160–169 CrossRef CAS.
- G. Bellussi and M. S. Rigguto, Stud. Surf. Sci. Catal., 2001, 137, 911–955 CrossRef CAS.
- W. B. Fan, P. Wu and T. Tatsumi, J. Catal., 2008, 256, 62–73 CrossRef CAS.
- X. Q. Lu, W. J. Zhou, H. H. Wu, A. Liebens and P. Wu, Appl. Catal., A, 2016, 515, 51–59 CrossRef CAS.
- H. Xu, Y. T. Zhang, H. H. Wu, Y. M. Liu, X. H. Li, J. G. Jiang, M. Y. He and P. Wu, J. Catal., 2011, 281, 263–272 CrossRef CAS.
- Y. L. Yang, J. H. Ding, C. H. Xu, W. D. Zhu and P. Wu, J. Catal., 2015, 325, 101–110 CrossRef CAS.
- H. X. Gao, G. X. Lu, J. S. Suo and S. B. Li, Appl. Catal., A, 1996, 138, 27–38 CrossRef CAS.
- D. D. Dietz, J. R. Leininger, E. J. Rauckman, M. B. Thompson, R. E. Chapin, R. L. Morryssey and B. S. Levine, Fundam. Appl. Toxicol., 1991, 17, 347–360 CrossRef CAS.
- M. K. Yao, J. X. Yang, S. Zhao, Y. M. Liu and P. Wu, Chin. J. Catal., 2009, 30, 590–594 CAS.
- Y. K. Yu, Z. M. Tang, J. Wang, R. Wang, Z. Chen, H. X. Liu, K. X. Shen, X. Huang, Y. M. Liu and M. Y. He, J. Catal., 2020, 381, 96–107 CrossRef CAS.
- Z. X. Deng, Y. L. Yang, X. Q. Lu, J. H. Ding, M. Y. He and P. Wu, Catal. Sci. Technol., 2016, 6, 2605–2615 RSC.
- J. P. Yin, H. Xu, B. W. Wang, W. W. Tian, J. Y. Yin, J. G. Jiang and P. Wu, Catal. Sci. Technol., 2020, 10, 6050–6064 RSC.
- X. Q. Lu, H. H. Wu, J. G. Jiang, M. Y. He and P. Wu, J. Catal., 2016, 342, 173–183 CrossRef CAS.
- L. Z. Wu, S. F. Zhao, L. F. Lin, X. Q. Fang, Y. M. Liu and M. Y. He, J. Catal., 2016, 337, 248–259 CrossRef CAS.
- H. Li, Q. Lei, X. M. Zhang and J. S. Suo, Microporous Mesoporous Mater., 2012, 147, 110–116 CrossRef.
- X. J. Deng, S. Zhang, B. S. Wang, Y. N. Wang, H. H. Wu, Y. M. Liu and M. Y. He, Chem. Commun., 2013, 49, 7504–7506 RSC.
Footnote |
| † Electronic supplementary information (ESI) available. See DOI: 10.1039/d0nj04491a |
| This journal is © The Royal Society of Chemistry and the Centre National de la Recherche Scientifique 2021 |

