Intercalation of a manganese(II)-thiacalixarene luminescent complex in layered double hydroxides: synthesis and photophysical characterization†
Niall
O’Toole
a,
Constance
Lecourt
a,
Yan
Suffren
b,
François
Toche
a,
Rodica
Chiriac
a,
Nicole
Gilon
c,
François
Bessueille
c,
Arnaud
Brioude
a,
Erwann
Jeanneau
a,
Dominique
Luneau
 a and
Cédric
Desroches
 *a
*a
aLaboratoire des Multimatériaux et Interfaces (UMR 5615), Université Claude Bernard de Lyon 1, Campus de la Doua, 69622 Villeurbanne, France. E-mail: cedric.desroches@univ-lyon1.fr
bUniv Rennes, INSA Rennes, CNRS, ISCR “Institut des Sciences Chimiques de Rennes”, F-35000 Rennes, France
cInstitut des Sciences Analytiques, UMR5280 Université Lyon 1-CNRS, Université de Lyon, 69622, Villeurbanne, Cedex, France
First published on 7th December 2020
Abstract
Utilizing the osmotic swelling of Layered Double Hydroxides (LDHs, [Mg1−xAlx(OH)2]x+(NO3−)x) in formamide, the anionic luminescent complex [(ThiaSO2)2(MnII)4F]− (ThiaSO2 = p-tert-butylsulfonylcalixarene) is introduced between the positive layers, leading to doping of LDH. In the recovered LDH layers, the hexagonal prism morphology of the precursor is well retained. The formula of the resulting compound (Mg0.71Al0.29(OH)2(NO3)0.288((ThiaSO2)2(Mn)4F)0.002(H2O)0.5) (1) was determined by elemental and thermogravimetric analysis. The low doping rate is attributed to the low negative charge density (e Å−2) of the complex. The basal spacing of 12.02 Å indicates that [(ThiaSO2)2(MnII)4F]− is sandwiched across the width by positive LDH layers. The photophysical properties of compound 1 were studied in the solid state. 1 presents luminescence properties upon UV excitation, with the emission maximum centered at 630 nm and 650 nm in the presence and the absence of atmospheric O2, respectively. Photophysical studies have been carried out under different atmospheres and using various excitation wavelengths. The relationship of the extinction of emission with the presence of molecular oxygen is reported, and demonstrates the very high sensitivity of this compound to oxygen. Finally, incorporation of the luminescent complex within the LDH host allows the O2-sensitivity to remain similar to that observed in solution whilst avoiding photo-degradation, thereby opening perspectives for use in oxygen sensing or singlet oxygen generation.
Introduction
Harnessing energy, and in particular energy of the electromagnetic spectrum, is of enormous societal and scientific significance, and methods of incorporating photoactive species into functional materials must be studied and optimised. There are numerous ways and means for the creation of this type of functional material. One of them is the preparation of so-called hybrid materials composed of an organic part and an inorganic part, each with a specific functionality.1For several years we have been working on the coordination chemistry of thiacalixarene.2 One major result has been the discovery of the strong luminescence, emitted at approximately 600 nm (excitation at 350 nm), shown by tetra-nuclear clusters of MnII ions sandwiched between two p-tert-butylsulfonylcalixarene macrocycles (ThiaSO2), of formula [(ThiaSO2)2(MnII)4F]K. The ThiaSO2 ligands were found to play the role of antennae in inducing this luminescence. Spectroscopic studies have demonstrated that interactions between the cation and the anionic cluster [(ThiaSO2)2(MnII)4F]− have an influence on the luminescence quenching by energy transfer from the excited complex to O2. These studies have shown that when the anion–cation separation distance increases such that the coordination interaction disappears, the molecular system becomes extremely sensitive to oxygen.2b To further study and exploit this phenomenon, we envision the intercalation of the luminescent [(ThiaSO2)2(MnII)4F]− anionic complex into the interlayer space of inorganic positively charged layered double hydroxide (LDH) materials.3 Layered double hydroxides (LDHs) are composed of positively charged metal hydroxide layers containing divalent and trivalent cations such as Mg2+ and Al3+ and interlayer anions. The general formula is [M1−xM′x(OH)2]x+(Am−)x/m·nH2O, where M is the divalent metal, M′ is the trivalent metal, x is the degree of substitution, A is an anion of charge m, and n is the number of interstitial water molecules found in the cell. LDHs are unusual in that most materials of this structural type contain negatively charged layers.4 The practical applications of LDHs are as varied as the potential components of the material. [Mg1−xAlx(OH)2]x+(Am−)x/m·nH2O are ideal candidates for the inorganic matrix to host functional anions such as this luminescent manganese-thiacalixarene cluster anion (Fig. 1). The anionic nature of this luminescent species allows it to act as the interlayer anion in an LDH, offering a simple route towards the creation of a luminescent hybrid material.
 | ||
| Fig. 1 Schematic representation of the ThiaSO2/MnII system intercalated in a layered double hydroxide. | ||
The concept of photo-functional materials supported on host materials has gained considerable interest as a means of obtaining controllable optical properties for application in the next generation of light emitting materials and sensors.5 Insertion of the [(ThiaSO2)2(Mn)4(F)]− anion between the positively charged hydroxide layers would allow us to evaluate the luminescence and oxygen sensibility shown by our system within such a matrix. The luminescence of these hybrid materials could also be modulated via various stimuli, such as pressure resulting from interlayer spacing and host–guest interactions. Insertion between the inorganic layers may also give rise to an ordered assemblage of the luminescent anions, allowing for materials demonstrating polarized photoemission properties.
In this paper, we report the synthesis and photophysical properties of LDH materials doped with intercalated [(ThiaSO2)2(MnII)4F]− of formula Mg0.71Al0.29(OH)2(NO3)0.288((ThiaSO2)2(Mn)4F)0.0021. A red-orange luminescence is observed for compound 1 and has been attributed to the luminescence of the complex sandwiched within the LDH, originating from the 4T1(t2g4eg1) → 6A1(t2g3eg2) d–d transition of the manganese(II) ions. We show the acute sensitivity of this luminescence to the presence of O2, and conversely demonstrate that it remains stable to photo-oxidation, opening perspectives for its application in oxygen sensing or singlet oxygen generation.
Results and discussion
Synthesis
There are many different synthetic methods towards LDHs, in part due to the incredible variety which is possible for this structural family. Hydrothermal synthesis seemed to us to be the most efficient. The reaction mixture consists of a salt, usually nitrate, of each desired metal (here Mg(NO3)2 and Al(NO3)3) and an amine which acts as an ammonia precursor compound.7 The principle is that as the temperature increases, the amine is hydrolysed releasing ammonia into the solution thus raising the pH and bringing about the precipitation of the product. This method works better when the trivalent ion involved is aluminium; the amphoteric nature of the Al3+ ion makes it an effective centre for precipitation of the product in the fluctuating pH solution.8 Thus, LDH hydrotalcite (Mg–Al–CO3 LDH) was synthesized by the hydrothermal reaction of magnesium nitrate hexahydrate Mg(NO3)2·6H2O and aluminium nitrate nonahydrate Al(NO3)3·9H2O, in the presence of hexamethylenetetramine (HMT, C6H12N4), maintained at a temperature of 140 °C for 24 hours. The resulting precipitate was recovered by centrifugation and washed with deionised water at least three times. Because of the strength of the attraction between the carbonate ion and the interlayer space of the LDH, this species is substituted with nitrate anions before the complex intercalation takes place.9 To this end, the LDH–carbonate is suspended in an aqueous acid – salt solution of concentration 0.005 mol L−1 NaNO3 and 1 mol L−1 HNO3 under a neutral atmosphere (Ar or N2). After stirring for 16 hours at room temperature, the product is recovered by centrifugation and washed with degassed water. From the nitrate material direct anion exchange with the anionic [(ThiaSO2)2(Mn)4F]− cluster can be carried out. This entire process is done under an inert atmosphere to avoid contamination with CO2 from the surroundings, which would form carbonate anions within the LDH layers. First the LDH–nitrate is suspended in formamide (0.02 g in 50 cm3 of formamide). The osmotic pressure of the formamide molecules pushes apart the LDH layers causing exfoliation, eventually leading to total dissociation. The resulting suspension shows Tyndall scattering when a beam of light is shone through it. A dimethylformamide solution of the luminescent complex (0.025 mol L−1) is added to the LDH suspension, which immediately becomes cloudy as the hydroxide nano-sheets reform around the luminescent centres. Generally, for this type of procedure, the guest anion is dissolved in formamide. Unfortunately, our complex is insoluble in formamide; solubility has thus far only been observed in DMF or DMSO. Moreover, the solvent DMF on its own induces a tightening of the hydroxide layers. For these reasons a solution of the complex in a minimum of DMF is prepared and added slowly. The intercalated product is removed from suspension by centrifugation, washed with DMF and water several times and obtained as off-white micro-powder. Variations of temperature, agitation, order of addition and so on were attempted for this reaction, to optimise the conditions. The following is a generalised synthesis for these compounds derived from this optimisation: 24 h stirring time at 25 °C seems to be the most effective parameter.
The formula Mg0.71Al0.29(OH)2(NO3)0.288((ThiaSO2)2(Mn)4F)0.002 of 1 was obtained by elemental analysis and indicates that only a small amount of complex is embedded in LDH. Thus, we can consider the anionic layers of these materials to be composed of mostly nitrate ions, with comparatively few anionic [(ThiaSO2)2(Mn)4F]− clusters. LDHs exhibit a high positive charge density on the main layers. For example, a ratio of trivalent to divalent metals of x = 1/3 corresponds to one charge per 50 Å2 on each side of the layer, leading to one charge for each 25 Å2 in the inter-lamellar domains.10 Our cluster complex represents one negative charge for each 170 Å2. Thus, it is difficult to achieve electroneutrality with only these complexes inside the interlayer space. In the literature, the majority of calixarene derivatives inserted in LDH systems are sulfonated, with four negative charges per macrocycle.11 Therefore, they have a higher negative charge density and can fully substitute nitrate ions. A similar case in the literature deals with a sulfonated thiacalixarene complex complexed with an Ag+ ion. In this case, despite a head to tail arrangement of the macrocycles to increase the charge density per unit volume, the macrocycle layer is still supplemented by carbonate anions.12
On the basis of the charge density of the LDH layers and the molecular dimensions of [(ThiaSO2)2(MnII)4F]−, we believe that the extent of intercalation is limited by the size of the complex and not by the LDH anion-exchange capacity. This phenomenon has already been encountered with low charge density molecular systems such as ruthenium-based complexes.13
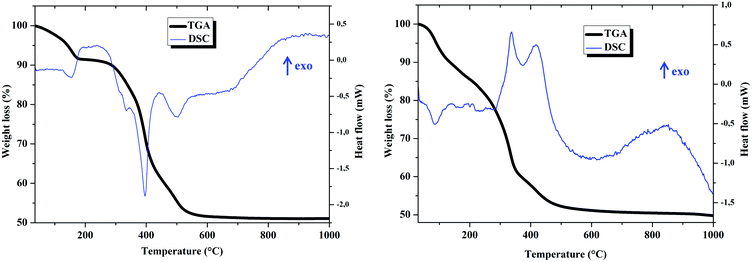
The calculation of the mass losses from the TGA curves is in agreement with formulae Mg0.72Al0.28(OH)2(NO3)0.28(H2O)0.36 for Mg–Al–NO3 LDH and Mg0.71Al0.29(OH)2(NO3)0.288((ThiaSO2)2(Mn)4F)0.002(H2O)0.5 for compound 1, and is consistent with the formulae obtained from the elementary analysis (see Fig. S1–S4 in the ESI†).
Regarding the TGA curves, decomposition of LDHs occurred in three consequent steps. In Fig. 2, the first step observed in the range of 50–200 °C corresponds to solvent loss from internal gallery surfaces and the external non gallery surfaces. For Mg–Al–NO3 LDH, the second step in the range of 200–400 °C is mainly attributed to the dehydroxylation and the third step, observed above 400 °C, arises due to the elimination of NO3− from the LDH interlayer space.14 For 1, the second and third steps resemble those of Mg–Al–NO3 LDH and it is difficult to identify the loss of mass specifically due to the complex.
The DSC for Mg–Al–NO3 LDH and compound 1 show three major peaks, the positions of which fit remarkably well with those in the DTG curve, indicating that they correspond to mass-loss processes. For Mg–Al–NO3 LDH all peaks are endothermic, contrarily to the exothermic peaks of compound 1 which are attributed to decomposition (between 300 and 500 °C). The complex has a basic formula of C82H96FMn4O26S8, leading to a general formula for compound 1 of Mg0.71Al0.29(OH)2(NO3)0.288C0.16H0.19F0.002Mn0.008O0.05S0.016. The oxidation of the organic part of the compound is very exothermic and explains the exothermicity of the peaks observed on the DSC curve for compound 1.
X-ray diffraction characterization
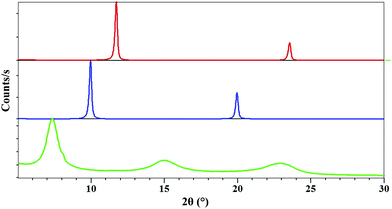
Fig. 3 shows the powder X-ray diffraction diagram of the intercalate material compared with the diagrams for carbonate and nitrate Mg–Al layered double hydroxides. The X-ray diffraction patterns of compounds Mg–Al–CO3 (red curve) and Mg–Al–NO3 (blue curve) show that for each compound, the products were obtained in a pure phase. These patterns correspond to those described in the literature.3,6b We would expect to see peaks corresponding to the (003) and (006) planes as with the carbonate and nitrate forms, shifted to a lower 2θ value as a result of the larger size of the complex anion creating a larger interlayer space. For the sample intercalated product 1 (Fig. 3, green curve), the diagram shows a succession of three broad peaks positioned at 7.34° (d = 12.02 Å), 14.96° (d = 5.91 Å) and 29.91 (d = 3.89 Å).The three peaks observed for compound 1 could not be indexed. The expected numerical relationships between d values are not exactly appropriate to make analogy with the inter-reticular distance indices d003, d006 and d009 obtained for Mg–Al–NO3 or Mg–Al–CO3 systems. For example, we would expect the largest d value to correspond to the (003) plane, which would mean that the smaller distances would be exact divisions of this; 12.02/2 = 6.01 Å for the (006) plane, 12.02/3 = 4.00 Å for (009). This is evidently not exactly the case. The peak forms are less sharp, with broader, less intense peaks than those seen for the nitrate and carbonate LDHs. This could be explained by the disorder introduced by the anion distribution within the LDH layers and/or by the size of fundamental crystallization domains. The crystal packing of [(ThiaSO2)2(Mn)4F]K shows that [(ThiaSO2)2(Mn)4F]− anions are linked through the coordinated potassium ion and sulphonyl group, making [(ThiaSO2)2(Mn)4F]K a one-dimensional network with a distance between two cations of 12.1 Å (Fig. 4). The charge balancing cation is found near the sulfonyl groups, in the plane formed by the four manganese ions, indicating that the negative charge is concentrated in this region. The width of complex 1 is between 7.5 and 10.5 Å (see Fig. S5 in the ESI†) and a layer of Mg–Al hydroxide has a width of 4.8 Å.15 The first observed distance derived from the X-ray diagram, which is equal to 12.02 Å, could therefore correspond to the hypothesis presented in Fig. 4 for which the anion [(ThiaSO2)2(Mn)4F]− is sandwiched lengthwise by positive LDH layers.
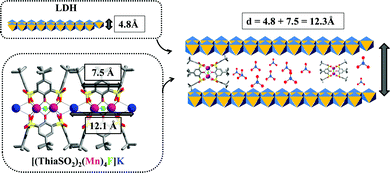 | ||
| Fig. 4 Schematic of hypothesised potential phases formed by the intercalation of luminescent aggregates into Mg–Al LDH. | ||
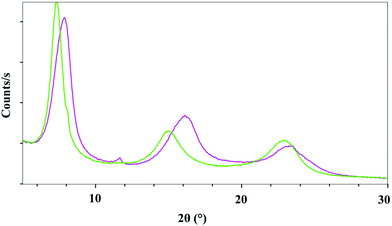
Fig. 5 shows a comparison of the X-ray diffraction data obtained for the LDH hybrid product obtained after a stirring time of 24 h (product 1, green curve), and after a stirring time of 72 h (product 2, violet curve). While their X-ray diffraction diagrams are similar, the elementary analysis and spectroscopy characterization show that these two compounds are different.
Elemental analysis has been run on LDH–NO3 and the two compounds LDH-[(ThiaSO2)2(Mn)4F]. The formulae found are Mg0.72Al0.28(OH)2(NO3)0.28 for LDH-NO3, Mg0.71Al0.29(OH)2(NO3)0.288((ThiaSO2)2(Mn)4F)0.002 for compound 1 and Mg0.57Al0.43(OH)2(NO3)0.425((ThiaSO2)2(Mn)4F)0.005 for compound 2. The ratio Mg/Al is the same for LDH–NO3 and compound 1, but differs for compound 2. It has been suggested that ion-exchange reactions at relatively low pH favour leaching of MII ions from the layers, thus giving rise to higher values of x. It seems therefore that for compound 2, and for all compounds which are subjected to long stirring duration with [(ThiaSO2)2(Mn)4F]−, the reaction conditions lead to leaching of Mg2+. A possible hypothesis to explain this is a competition between the three metal ions, Mg2+, Mn2+ and Al3+, for complexation with ThiaSO2. It appears that under these synthesis conditions, the ThiaSO2 ligands extricate Mg2+ ions from the inorganic hydroxide layers. Thus, the excess Al3+ seen in compound 2 is likely in the form of oxo–hydroxide which is most probably amorphous and therefore not detected by XRD. To try to understand this hypothesis, we introduced into a DMF solution of a salt of either Mg2+ or Al3+ the [(ThiaSO2)2(Mn)4F]K complex.
In the case of Al3+ the reaction between [(ThiaSO2)2(Mn)4F]K and aluminium(III) nitrate nonahydrate in DMF at room temperature yielded white rectangular block crystals, which were studied by single crystal X-ray diffraction. Fig. 6 shows the structure obtained from this analysis (see Fig. S6 and crystallographic data in Tables S1–S3 in the ESI†). The metal core consists of four Al3+ ions in an approximate square planar arrangement, linked by μ2-hydroxide ligands lying in this metal plane. Most generally clusters with four aluminium ions, bridged by hydroxide ions, adopt a cubane-type structure. Here, the aluminium cluster architecture obtained for the [Al4(ThiaSO2)2] complex is uncommon, especially for aluminium ions displaying an octahedral coordination geometry.16 Each metal centre shows identical pseudo-octahedral coordination geometry, with two bonds to hydroxide ligands, two bonds to phenolic oxygen from the thiacalixarene and one to a sulfonyl oxygen, with a molecule of DMF completing the coordination sphere.
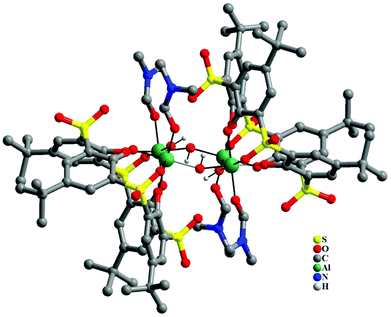 | ||
| Fig. 6 Structure of the tetra-aluminium complex of Al4(ThiaSO2)2. Color key: C = grey capped sticks, Al = green, S = yellow, O = red, N = blue. | ||
Each ThiaSO2 macrocycle coordinates two aluminium ions, in a rare hexadentate pinched cone conformation fashion, such that the angle formed by O–Al–O is approximately 90° for all coordinating oxygen atoms.
Scanning electron microscopy
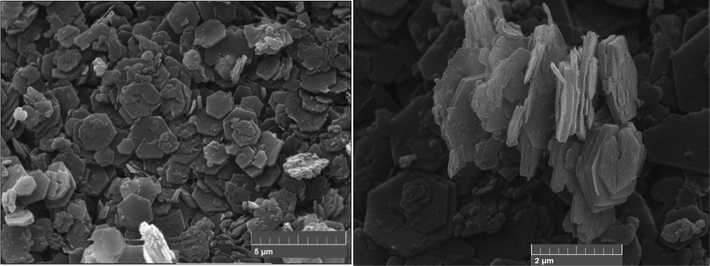
Hydrotalcite and its nitrate derivative both crystallize in the trigonal–rhombohedral (R![[3 with combining macron]](https://www.rsc.org/images/entities/char_0033_0304.gif) m, no 166) lattice system. The symmetry arising from this crystalline class results in a hexagonal form of the particles. Fig. S7 (in the ESI†) shows SEM images of the crystalline form of the nitrated material, proving that there has been no (or minimal) deformation during the acid-salt treatment (LDHs can be vulnerable to attack by strong acid). Fig. 7 shows the hexagonal crystalline form because intercalated LDH 1 remains unchanged. We can therefore say that no major changes in terms of morphology (and by association therefore, perhaps in terms of the symmetry class) have occurred.
m, no 166) lattice system. The symmetry arising from this crystalline class results in a hexagonal form of the particles. Fig. S7 (in the ESI†) shows SEM images of the crystalline form of the nitrated material, proving that there has been no (or minimal) deformation during the acid-salt treatment (LDHs can be vulnerable to attack by strong acid). Fig. 7 shows the hexagonal crystalline form because intercalated LDH 1 remains unchanged. We can therefore say that no major changes in terms of morphology (and by association therefore, perhaps in terms of the symmetry class) have occurred.
Photophysical characterization of compound 1
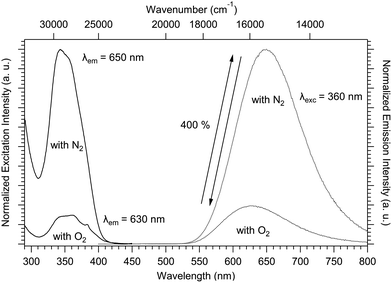
The solid-state luminescence spectra have been recorded for compound 1 in the presence and absence of atmospheric O2 (O2 or N2 atmosphere, respectively). Fig. 8 shows the evolution of the excitation and emission spectra with respect to the atmosphere. The solid-state excitation spectrum shows a UV band above 25![[thin space (1/6-em)]](https://www.rsc.org/images/entities/char_2009.gif) 000 cm−1 (below 400 nm) arising from the ligand-centered-absorption (π–π* transitions). To avoid quenching by oxygen (O2), the luminescence was measured under a N2 atmosphere. The emission band maximum increased by around 400% and redshifted by −490 cm−1 (+20 nm) from 15
000 cm−1 (below 400 nm) arising from the ligand-centered-absorption (π–π* transitions). To avoid quenching by oxygen (O2), the luminescence was measured under a N2 atmosphere. The emission band maximum increased by around 400% and redshifted by −490 cm−1 (+20 nm) from 15![[thin space (1/6-em)]](https://www.rsc.org/images/entities/char_2009.gif) 870 cm−1 (630 nm) to 15
870 cm−1 (630 nm) to 15![[thin space (1/6-em)]](https://www.rsc.org/images/entities/char_2009.gif) 380 cm−1 (650 nm) as shown in Fig. 8. Successive emission measurements by changing atmospheres (N2 and O2) have revealed that the variation in luminescence intensity is reversible (schematized by the double arrow in Fig. 8). The study of this reversibility was again carried out on compound 1 after aging for one year under an ambient atmosphere (Fig. S8, ESI†). The same emission profile was observed, demonstrating the stability of this phenomenon over time.
380 cm−1 (650 nm) as shown in Fig. 8. Successive emission measurements by changing atmospheres (N2 and O2) have revealed that the variation in luminescence intensity is reversible (schematized by the double arrow in Fig. 8). The study of this reversibility was again carried out on compound 1 after aging for one year under an ambient atmosphere (Fig. S8, ESI†). The same emission profile was observed, demonstrating the stability of this phenomenon over time.
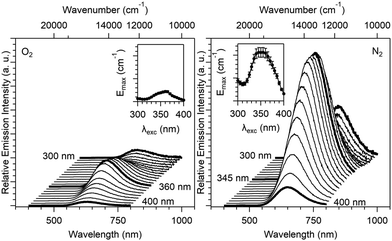
The emission spectra (λem = 25![[thin space (1/6-em)]](https://www.rsc.org/images/entities/char_2009.gif) 000–12
000–12![[thin space (1/6-em)]](https://www.rsc.org/images/entities/char_2009.gif) 500 cm−1 or 400–800 nm) have been measured at variable excitation wavelengths ranging between 33
500 cm−1 or 400–800 nm) have been measured at variable excitation wavelengths ranging between 33![[thin space (1/6-em)]](https://www.rsc.org/images/entities/char_2009.gif) 333 and 25
333 and 25![[thin space (1/6-em)]](https://www.rsc.org/images/entities/char_2009.gif) 000 cm−1 (λexc = 300–400 nm, Fig. 9) under different atmospheres (N2 and O2). Under a N2 atmosphere, the emission spectra show a maximum band centered at 15380 cm−1 (650 nm), where spectra measured under an excitation at 340–365 nm showed the strongest emission intensity. Under an O2 atmosphere, emission spectra show a maximum band centered at 15
000 cm−1 (λexc = 300–400 nm, Fig. 9) under different atmospheres (N2 and O2). Under a N2 atmosphere, the emission spectra show a maximum band centered at 15380 cm−1 (650 nm), where spectra measured under an excitation at 340–365 nm showed the strongest emission intensity. Under an O2 atmosphere, emission spectra show a maximum band centered at 15![[thin space (1/6-em)]](https://www.rsc.org/images/entities/char_2009.gif) 870 cm−1 (630 nm), and the excitation range corresponding to the most intense emission spectra was between 355 and 365 nm. For the two sets of atmospheric parameters (N2 and O2), the emission band shows two maxima, one for an excitation lower than 300 nm (this maximum cannot be precisely determined on our experimental setup) and a second one around 360 nm.
870 cm−1 (630 nm), and the excitation range corresponding to the most intense emission spectra was between 355 and 365 nm. For the two sets of atmospheric parameters (N2 and O2), the emission band shows two maxima, one for an excitation lower than 300 nm (this maximum cannot be precisely determined on our experimental setup) and a second one around 360 nm.
The photophysical properties of 1 have been also studied at variable temperature between 77 K and 293 K (Fig. S9 and S10, ESI†), and the excitation and emission spectra were found to be slightly sensitive to changes in the temperature. In this temperature range, a weak redshift of the energy band maximum Emax of −340 cm−1 (+14 nm) from 15![[thin space (1/6-em)]](https://www.rsc.org/images/entities/char_2009.gif) 720 cm−1 to 15
720 cm−1 to 15![[thin space (1/6-em)]](https://www.rsc.org/images/entities/char_2009.gif) 380 cm−1 (636–650 nm) and an increase of the bandwidth at half height FWHM of +330 cm−1 from 2350 cm−1 to 2680 cm−1 (+18 nm from 96 nm to 114 nm) of the broad band were observed. Vibronic intensity gains lead to the broadening of the luminescence band, a trend which is typical of d–d (metal centered) luminescence transitions such as for Mn2+.2b The lifetime under a N2 atmosphere at 77 K has been estimated to be 1.51(1) ms compared to 1.02(2) ms at 293 K. This increase of 50% is due to a reduction of the non-radiative effects as the temperature decreases.
380 cm−1 (636–650 nm) and an increase of the bandwidth at half height FWHM of +330 cm−1 from 2350 cm−1 to 2680 cm−1 (+18 nm from 96 nm to 114 nm) of the broad band were observed. Vibronic intensity gains lead to the broadening of the luminescence band, a trend which is typical of d–d (metal centered) luminescence transitions such as for Mn2+.2b The lifetime under a N2 atmosphere at 77 K has been estimated to be 1.51(1) ms compared to 1.02(2) ms at 293 K. This increase of 50% is due to a reduction of the non-radiative effects as the temperature decreases.
Previous spectroscopic studies have demonstrated that an influence is exerted on this luminescence quenching (energy transfers from the excited complex to O2) by interaction between the cation and the anionic cluster. These studies show that an extreme sensitivity to the presence of oxygen in the molecular system can be attained by increasing the anion–cation separation distance, and/or by removing the coordination interactions. Among the different molecular homologues studied in our previous work, compound 1 displays the greatest sensitivity to O2 in the solid-state. We have previously demonstrated that in solution this complex can be converted into a mononuclear compound of Mn3+, via a process of electron transfer between the complex and molecular oxygen. This reaction is characterized by a color change from colorless to intense violet. In contrast, when compound 1 is dispersed in DMF and irradiated at 360 nm, we do not observe appearance of any purple color characteristic of the photo-bleaching of the inserted complex. Furthermore, when 1 is illuminated in DMF solution in the presence of triphenylphosphine, the latter compound is rapidly converted to triphenylphosphine oxide as followed by GCMS. These observations are in agreement with the production of singlet oxygen under light by compound 1. Then, compound 1 can be recovered by centrifugation and recycled for a new photo-reaction. The high sensitivity of compound 1 to oxygen could render it useful as a sensitizer, in oxygen sensing devices or in singlet oxygen generation reactions following type II photo-oxygenation mechanisms.
Conclusions
The strong luminescence, emitted at 600 nm (excitation at 360 nm) by the previously published tetra-nuclear clusters of MnII ions and two ThiaSO2 macrocycles (ThiaSO2 = p-tert-butylsulfonylcalixarene), of formula [(ThiaSO2)2(MnII)4F]−, motivates us to try to define the full potential of this molecular system. In this context we were interested in the sensitivity of the luminescence emission of this system to oxygen. Previous work has led to the conclusion that the interaction of the cation with the anionic complex is of paramount importance. To exploit this phenomenon, we have carried out intercalation of the luminescent [(ThiaSO2)2(Mn)4F]− anionic complex into the interlayer space of inorganic positively charged layers of layered double hydroxide (LDH) materials. Utilizing the osmotic swelling of layered double hydroxides (LDHs, [Mg1−xAlx(OH)2]x+(NO3−)x) in formamide, the anionic luminescent [(ThiaSO2)2(MnII)4F]− complex has been introduced between the positive layers of LDHs, leading to the doping of LDH. In the recovered LDH layers the hexagonal prism morphology of the precursor is well retained. The formula of the resulting compound 1 (Mg0.71Al0.29(OH)2(NO3)0.288((ThiaSO2)2(Mn)4F)0.002(H2O)0.5) was determined by elemental and thermogravimetric analysis. The low doping rate is attributed to the low negative charge density (e Å−2) of the complex. The basal spacing of 12.02 Å indicates that [(ThiaSO2)2(Mn)4F]− is sandwiched across the interlamellar width by positive LDH layers. The photophysical properties of compound 1 were studied in the solid-state. Compound 1 presents luminescence properties at UV excitation wavelength, with emission maxima centered at 630 nm under an O2 atmosphere. These photophysical studies have been carried out under different gaseous atmospheres using a range of excitation wavelengths. Extinction of emission in the presence of oxygen is reported, demonstrating the very high sensitivity of this compound to O2. The LDH host matrix allows for the O2-sensitivity to remain similar to that observed in solution whilst avoiding photo-degradation, thereby opening perspectives for use in oxygen sensing or singlet oxygen generation.Experimental
Reagents and materials
All chemicals and solvents were used as received (solvents and chemicals: Aldrich). The [(ThiaSO2)2(MnII)4F]K compound was synthesized by the published procedure.2aUnder an inert atmosphere (Ar) the nitrated form Mg–Al–NO3 LDH (0.02 g, 0.24 mmol i.e. 0.067 mmol of NO3−) is added to formamide (50 cm3) and allowed to form a homogenous dispersion such that the suspension becomes translucent and demonstrates Tyndall light scattering. 0.2 g (0.1 mmol) of [(ThiaSO2)2(Mn)4F]K dissolved in 4 cm3 DMF is added dropwise to the solution of LDH with stirring. This mixture is agitated under an inert atmosphere for 24 h. The suspension is then centrifuged (13![[thin space (1/6-em)]](https://www.rsc.org/images/entities/char_2009.gif) 000 rpm, 5 min). The collected solid is washed with DMF (3 × 24 cm3), degassed H2O (3 × 24 cm3) and ethanol (1 × 24 cm3). Product 1 is dried at 50 °C under reduced pressure, and collected as a pale yellow luminescent powder (0.019 g, yield = 88%). P-XRD (2θ in °): 7.34°, 14.96° and 29.91. Elemental analysis (mass %): [Al] = 16.6%; [Mg] = 36.5%; [Mn] = 0.74%. Formula was supported by TGA analysis (see Fig. S2 in the ESI†).
000 rpm, 5 min). The collected solid is washed with DMF (3 × 24 cm3), degassed H2O (3 × 24 cm3) and ethanol (1 × 24 cm3). Product 1 is dried at 50 °C under reduced pressure, and collected as a pale yellow luminescent powder (0.019 g, yield = 88%). P-XRD (2θ in °): 7.34°, 14.96° and 29.91. Elemental analysis (mass %): [Al] = 16.6%; [Mg] = 36.5%; [Mn] = 0.74%. Formula was supported by TGA analysis (see Fig. S2 in the ESI†).
Characterization
Scanning Electron Microscopy (SEM) was performed on a Vega Tescan SEM microscope.Elemental analysis was performed by ICP-OES (ICAP 6000 Thermo Fisher Scientific) for Al and Mg, and ICP-HRMS (ElementXR, Thermo Fisher Scientific) for trace Mn determination. Quantitative measurements were obtained after a wet acid digestion (HNO3/HF mixture) of the powder.
Powder X-Ray Diffraction (P-XRD) was performed on a PANalytical XpertPro MRD diffractometer with Cu Kα1 radiation (λ = 1.54060 Å) used with 40 kV and 30 mA settings in the θ/θ mode, reflection geometry.
For Single Crystal X-Ray Diffraction (SC-XRD), suitable crystals were selected and mounted on an Xcalibur kappa geometry diffractometer (Rigaku OD, 2015) equipped with an Atlas CCD detector and using Mo radiation (λ = 0.71073 Å). Intensities were collected at 150 K by means of the CrysalisPro software.17 Reflection indexing, unit cell parameter refinement, Lorentz polarisation correction, peak integration and background determination were carried out with the CrysalisPro software. An analytical absorption correction was applied using the modelled faces of the crystal.18 The structures were solved by direct methods with SIR97 and the least square refinement on F2 was achieved with the Crystalis software. All non-hydrogen atoms were refined anisotropically. The hydrogen atoms were all located in a difference map, but those attached to carbon atoms were repositioned geometrically. The H atoms were initially refined with soft restraints on the bond lengths and angles to regularize their geometry (C–H in the range 0.93–0.98 Å, and Uiso(H) in the range 1.2–1.5 times Ueq of the parent atom), after which the positions were refined with riding constraints. For the experimental details see the ESI. CCDC 2010107.†
Solid-state excitation and emission spectra were recorded with a commercial fluorimeter Fluorolog 3 from Horiba Jobin Yvon Co, equipped with a Xe lamp 450 W, and a UV-visible photomultiplier (Hamamatsu R928, sensitivity 185–900 nm). The excitation/emission spectra were realized on powder samples pasted directly onto copper plates using conductive silver glue. For the measurements realized at variable temperature (77 K–300 K), the samples were introduced into an OptistatCF liquid nitrogen cooled cryostat from Oxford Instruments Co. The emission spectra were corrected for the instrumental response function. Appropriate filters were utilized to remove the laser light, the Rayleigh scattered light and associated harmonics from the emission spectra. Luminescence lifetime (τ > 10 μs) has also been measured using this apparatus with a xenon flash lamp (phosphorescence mode) Lifetimes were averages of 2 or 3 independent determinations. The air pressure dependent solid-state luminescence spectra have been realized in a cryostat equipped with a primary pump.
For illumination experiments, LEDs of various wavelengths 360 and 400 nm were used. The LEDs were purchased from LED ENGINE Co and calibrated with a flame spectrometer from Ocean Optic with a nominal flux of 430 and 586 mW cm−2, respectively, at a working distance between the source and the sample of d = 10 mm.
Conflicts of interest
There are no conflicts to declare.References
- P. Gomez-Romero and C. Sanchez, Functional hybrid materials, Wiley-VCH, 2004 Search PubMed.
- (a) M. Lamouchi, E. Jeanneau, A. Pillonnet, A. Brioude, M. Martini, O. Stéphan, F. Meganem, G. Novitchi, D. Luneau and C. Desroches, Dalton Trans., 2012, 41, 2707 RSC; (b) Y. Suffren, N. O’Toole, A. Hauser, E. Jeanneau, A. Brioude and C. Desroches, Dalton Trans., 2015, 44, 7991 RSC; (c) N. O’Toole, C. Lecourt, Y. Suffren, A. Hauser, L. Khrouz, E. Jeanneau, A. Brioude, D. Luneau and C. Desroches, Eur. J. Inorg. Chem., 2019, 73 CrossRef.
- V. Rives, Layered double hydroxides present and future, Nova Science Publishers, Inc. 2001 Search PubMed.
- D. Xue and D. G. Evans, Layered Double Hydroxides, Springer Science & Business Media, 2006 Search PubMed.
- D. P. Yan, J. Lu, M. Wei, D. G. Evans and X. Duan, J. Mater. Chem., 2011, 21, 13128 RSC.
- (a) T. Hibino, Chem. Mater., 2004, 16, 5482 CrossRef CAS; (b) G. L. Huang, S. L. Ma, X. H. Zhao, X. J. Yang and K. T. Ooi, Chem. Commun., 2009, 331 RSC.
- K. Okamoto, N. Iyi and T. Sasaki, Appl. Clay Sci., 2007, 37, 23 CrossRef CAS.
- R. Z. Ma and T. Sasaki, Adv. Mater., 2010, 22, 5082 CrossRef CAS.
- K. L. Xu, G. M. Chen and J. Q. Shen, RSC Adv., 2014, 4, 8686 RSC.
- Z. P. Xu and H. C. Zeng, J. Phys. Chem. B, 2001, 105, 1743 CrossRef CAS.
- (a) S. Satoru, A. Sumio, H. Hidetoshi, S. Akira and N. Eiichi, Chem. Lett., 2004, 33, 790 CrossRef; (b) S. Satoru, A. Sumio, H. Hidetoshi, S. Akira, H. Nakayama and N. Eiichi, J. Solid State Chem., 2006, 179, 1129 CrossRef.
- G. Huang, S. Ma, X. Zhao, X. Yang and K. Ooi, Chem. Mater., 2010, 22, 1870 CrossRef CAS.
- E. P. Giannelis, D. G. Nocera and T. J. Pinnavaia, Inorg. Chem., 1987, 26, 203 CrossRef CAS.
- K. Nejati, A. Mokhtari, F. Khodam and Z. Rezvani, Can. J. Chem., 2016, 94, 66 CrossRef CAS.
- S. Miyata, Clays Clay Miner., 1975, 23, 369 CrossRef CAS.
- M. Veith, M. Jarczyk and V. Huch, Angew. Chem., Int. Ed., 1998, 37, 105 CrossRef CAS.
- Rigaku Oxford Diffraction, 2018, CrysAlisPro Software system, version 1.171., Rigaku Corporation, Oxford, UK.
- R. C. Clark and J. S. Reid, Acta Crystallogr., Sect. A: Found. Crystallogr., 1995, 51, 887 CrossRef.
Footnote |
| † Electronic supplementary information (ESI) available. CCDC 2010107. For ESI and crystallographic data in CIF or other electronic format see DOI: 10.1039/d0nj04890a |
| This journal is © The Royal Society of Chemistry and the Centre National de la Recherche Scientifique 2021 |

