Preparation of microsphere-added aerogels and exploration of their adsorption properties†
Dandan
Gao
,
Xueying
Wang
,
Hao
Liu
,
Yuxue
Dai
,
Yuanling
Sun
,
Xiaodong
Zhu
,
Rui
Han
and
Chuannan
Luo
 *
*
Key Laboratory of Interfacial Reaction & Sensing Analysis in Universities of Shandong, School of Chemistry and Chemical Engineering, University of Jinan, Jinan 250022, P. R. China. E-mail: chm_yfl518@163.com
First published on 10th November 2020
Abstract
The wastewater from industries contributes largely to water pollution, and its treatment is always complicated, expensive and inefficient. In this study, polyaniline/silica microsphere/graphene aerogels (PANI/SiO2/GA) were prepared in situ by polymerization, and the nanocomposites were utilized as effective adsorbents to eliminate dyes and oils. The structure, morphology and composition of the nanocomposites were characterized by X-ray diffraction (XRD), scanning electron microscopy (SEM), Fourier transform infrared (FTIR) spectroscopy and transmission electron microscopy (TEM). The adsorption capability of PANI/SiO2/GA to methylene blue (MB) and malachite green (MG) was studied using various experimental parameters such as the initial concentration of dyes, contact time, pH and adsorbent dosage. The results indicate that the adsorption process is relatively rapid, which takes only a few minutes, the adsorption capacity of MB and MG is as high as 140 mg g−1 and 160 mg g−1, respectively, and most kinds of the cationic dyes could be adsorbed from water. In the oil absorption experiment, PANI/SiO2/GA could adsorb many kinds of oils, as it has excellent adsorption capacity; it is easy to perform adsorption–desorption, and the times of adsorbent reuse to adsorption is more than 7 times.
Introduction
Nowadays, water pollution is a major concern of environmentalists.1 It is mainly caused by the discharge of wastewater from industries, and its treatment is always complicated, expensive and inefficient.2 Dyes as common organic pollutants are used as color agents in the industrial production of textiles, printing, leather, pigments and others.3–6 According to reports, the amount of dyes discharged per year is as high as 7 × 10⁵ tons.7 In addition, oils can also cause extensive pollution of water, and it is difficult to deal with these kinds of pollutants. Hence, it is urgent to find effective methods to remove pollutants from water, and now many technologies and methods such as flocculation, membrane filtration, ion exchange, oxidation, photochemical, degradation by biological and adsorption method are applied to achieve this process.8–12 Among them, adsorption is a widely used treatment because of its simple operation, economic advantage, environmental safety, and high efficiency.13Adsorbents play an important role in adsorption. There are many widely used adsorbents such as activated carbon, zeolite, biological materials,14 nanoparticles, and polymers. As we all know, carbon-based adsorbent materials are widely used to adsorb pollutants in water due to their large specific surface area, stable performance, low cost and easy availability.15 Among them, graphene oxide (GO) is an excellent adsorbent for water treatment due to the presence of a large number of hydrophilic groups on its surface.16,17 Besides, the shape of the adsorbent plays an important role in practical applications. The powder adsorbents may cause secondary pollution, and hence, they are difficult to recycle and reuse. Aerogels are a class of porous materials,18 which have been widely used in food,19 life activities,20,21 catalysis,22 environment,23etc. Guan et al. synthesized hemicellulose-based magnetic aerogels for the removal of congo red in water, and the maximum absorption capacity of congo red dye was 137.74 mg g−1.24 Lei et al. prepared metal–organic framework@cellulose aerogels for the removal of heavy metal ions in water. These aerogels could efficiently remove Pb(II) and the maximum absorption capacity was up to 89.40 mg g−1.25 Chen et al. fabricated cotton-derived carbonaceous aerogels, which are favorable adsorbents for the removal of organic pollutants and heavy metal ions from aqueous solutions.26 Polyaniline (PANI) exhibits great development potential in enriching pollutants,27 but PANI has weak solubility and mechanical properties.28 Nano-silica microspheres (SiO2) are amorphous white powder that is non-toxic, odorless, and non-polluting. It has excellent stability, reinforcement and mechanical properties,29–31 and often used as carriers in different fields. In this work, the prepared graphene aerogel material shows higher adsorption performance by applying PANI to modify GO; SiO2 was used to embed graphene oxide sheets to prevent the collapse of GO in water and enhance the mechanical properties of the aerogel. Therefore, the introduction of PANI and SiO2 into the graphene aerogel (GA) may enhance the aerogels’ adsorption capacity to dyes.
In this work, silica microspheres and polyaniline were modified on the surface of graphene oxide, and the aerogel was prepared by freeze-drying. The prepared polyaniline/silica microspheres/graphene oxide (PANI/SiO2/GA) shows satisfactory adsorption performance, and the adsorption rate is fast, which takes only less than 10 min, and the applicable pH range is wide. The recyclability of the adsorbent is considerable; not only could it be eluted by eluents and reused, but it could also be reused by simple extrusion with a tweezer in terms of oil absorption. It is possible to make the adsorbent be used repeatedly up to 7 times for most oils by squeezing, which still shows considerable adsorption performance.
Experimental
Materials and methods
Synthesis of PANI/SiO2
Silica microspheres were prepared by the Stöber sol–gel method and the specific amination process is shown in ESI.†The as-prepared NH2–SiO2 microspheres were used to synthesize polyaniline/silica microspheres (PANI/SiO2), and the operation steps are as follows: 0.2 g NH2–SiO2 was suspended in 60 mL of 1 M hydrochloric acid solution and sonicated for 30 min. Then, the solution was placed in an ice-water bath, and 0.2 mL aniline was added and stirred for 6 h. Following this, 0.5 g ammonium persulfate was dissolved in 40 mL of 1 M hydrochloric acid solution, and the solution was added dropwise into the above mixed solution, in which aniline and NH2–SiO2 were well mixed and stirred for 6 h. Then, the obtained solution was filtrated and washed with ethyl alcohol (95%) and 1 M hydrochloric acid solution. Finally, PANI/SiO2 was obtained by vacuum-drying in an oven for 12 h.
Synthesis of PANI/SiO2/GA
Graphene oxide (GO) was prepared by modified Hummers’ method. GO was carboxylated with EDC HCl and NHS to combine with more silica microspheres. Then, 0.15 g carboxylated GO was dissolved in 10 mL ultrapure water and sonicated for 30 min. Then, the same amount of the as-prepared PANI/SiO2 was added, and the mixed solution was stirred at room temperature for 24 h. Finally, the obtained product (PANI/SiO2/GO) was washed three times with ultrapure water and absolute ethanol, and dispersed in 10 mL ultrapure water for use. After this, 0.05 g polyvinyl alcohol was dissolved in 17 mL ultrapure water and heated in an oil bath at 90 °C until it was completely dissolved. The PANI/SiO2/GO suspension was dropped into the PVA solution and stirred 40 min. After that, the mixed liquid was freeze-dried to obtain the product (PANI/SiO2/GA). The schematic of synthesis is shown in Fig. 1.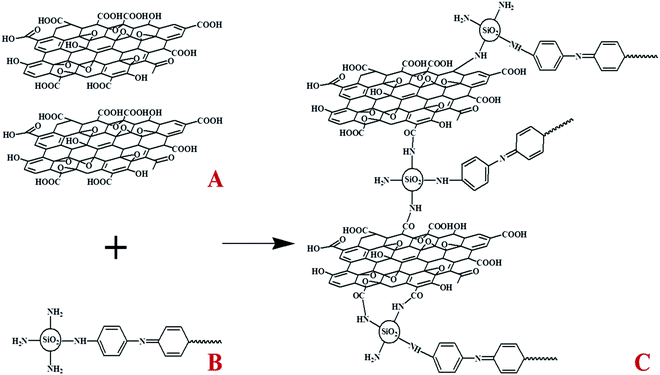 | ||
| Fig. 1 Fabrication of PANI/SiO2/GA: (A) carboxylated graphene oxide, (B) PANI/SiO2, and (C) PANI/SiO2/GA. | ||
Adsorption experiments
In this work, different concentrations of methylene blue (MB) and malachite green (MG) were selected as the contaminated dye solution, where the solvent is ordinary tap water in the laboratory.Adsorption experiment is a batch process. The batch process was carried out on a horizontal bench shaker with a shaking speed of 120 rpm. First, 75 mg adsorbent was added to a 50 mL beaker containing different concentrations of dyes. After the adsorption reached equilibrium, the concentration of residual dye was determined using a UV-visible spectrophotometer. The relationship between the absorbance and concentration of dyes at their maximum absorption wavelengths is shown in Fig. S1(A and B) (ESI†). The adsorption capacity (qe) and the removal percentage (rate) were calculated using the following equation:
 | (1) |
 | (2) |
At the same time, the effects of pH of the solution and the amount of adsorbent were studied. In addition, adsorption kinetics, adsorption thermodynamics and the regeneration performance of adsorbents were also studied. The pH of the solution was adjusted with 0.1 M HCl and 0.1 M NaOH. The effect of adsorbent dosage on dye removal was also investigated by adding different amounts of adsorbents to the same concentration of dye solution. Four different solutions were used as eluents to regenerate the adsorbent: 0.1 M HCl, 0.1 M NaOH, absolute ethanol and glacial acetic acid. The elution process is as follows: the dye-adsorbed PANI/SiO2/GA was immersed in an eluent solution for 10 min. Then, the adsorbent was squeezed using a tweezer to remove the eluent. Finally, the adsorbent was rinsed with ultrapure water and put to dry at room temperature for reuse.
In order to explore the application potential of the adsorbent, the adsorbent was also used for oil absorption. Five different oils were simply adsorbed, and the adsorption capacity was calculated by weighing the mass of the aerogel before and after adsorption.
Results and discussion
Characterization of the adsorbent
The XRD patterns of GO, PANI/SiO2, and PANI/SiO2/GA are shown in Fig. 2(A). From the curve of GO, an intense and sharp peak located at 9.72° is observed clearly,32 which corresponds to the (001) crystal plane of GO. It indicated that the graphite crystal form was destroyed, which is because the surface of GO is modified with a variety of oxygen-containing functional groups such as carboxyl, hydroxyl, and carbonyl groups after strong chemical oxidation. In the XRD pattern of PANI/SiO2, the broad peak contains two peaks of 20.16° and 25.88° corresponding to the (020) and (200) crystal planes of PANI, respectively. In the XRD pattern of PANI/SiO2/GO, the polymer has both characteristic peaks of GO and PANI/SiO2; it shows that the two ingredients are simultaneously present in the prepared aerogel.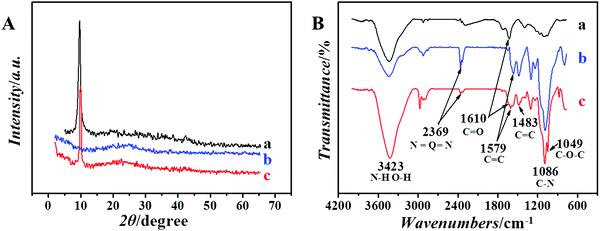 | ||
| Fig. 2 (A) X-ray diffraction spectra and (B) FTIR spectra of the prepared materials, (a) GO, (b) PANI/SiO2, and (c) PANI/SiO2/GA. | ||
The FTIR spectra of the materials are shown in Fig. 2(B). According to the FTIR spectra, PANI/SiO2 and PANI/SiO2/GA show characteristic peaks at 1579 cm−1 and 1483 cm−1, which are related to the absorption peaks of quinone (Q) and benzene ring (B), respectively. During the preparation of PANI/SiO2, the part of aniline and amino groups on aminated silica react and form the C–N bond with the catalysis of ammonium persulfate. The infrared peak at 1086 cm−1 is attributed to the tensile vibration peak of the C–N bond in the amine.33 The peak at 2369.3 cm−1 is attributed to the stretching vibration absorption peak of N![[double bond, length as m-dash]](https://www.rsc.org/images/entities/char_e001.gif) Q
Q![[double bond, length as m-dash]](https://www.rsc.org/images/entities/char_e001.gif) N, where Q represents the quinoid ring, which proves that PANI/SiO2 exists in the PANI/SiO2/GO aerogel. The absorption peak at 1610 cm−1 is assigned to the tensile vibration peak of the carbonyl group in the amide, indicating that the condensation reaction occurred between the carboxyl group on GO and the amino group on PANI/SiO2, and PANI/SiO2 was successfully modified on GO. For Fig. 2(B), the peak at 3423 cm−1 in the spectra of GO is assigned to the tensile vibration of O–H. However, its intensity in PANI/SiO2/GA is higher than that of GO and PANI/SiO2, which is related to the N–H tensile vibration. For PANI/SiO2, the peak strength at 3423 cm−1 is weak. However, the peak becomes strong after the condensation reaction of GO and PANI/SiO2, which proves that PANI/SiO2 was combined with GO successfully.
N, where Q represents the quinoid ring, which proves that PANI/SiO2 exists in the PANI/SiO2/GO aerogel. The absorption peak at 1610 cm−1 is assigned to the tensile vibration peak of the carbonyl group in the amide, indicating that the condensation reaction occurred between the carboxyl group on GO and the amino group on PANI/SiO2, and PANI/SiO2 was successfully modified on GO. For Fig. 2(B), the peak at 3423 cm−1 in the spectra of GO is assigned to the tensile vibration of O–H. However, its intensity in PANI/SiO2/GA is higher than that of GO and PANI/SiO2, which is related to the N–H tensile vibration. For PANI/SiO2, the peak strength at 3423 cm−1 is weak. However, the peak becomes strong after the condensation reaction of GO and PANI/SiO2, which proves that PANI/SiO2 was combined with GO successfully.
Fig. 3 shows the surface morphology of graphene oxide aerogel (GA), PANI/SiO2, PANI/SiO2/GO and PANI/SiO2/GA. Fig. 3(A) is the photo of GA, which shows its light weight. Fig. 3(B and C) are the SEM images of PANI/SiO2/GO and PANI/SiO2, and it shows that film-like PANI covers SiO2 microspheres fully after the addition of GO. Fig. 3(D) and (E) show the porous network structure of PANI/SiO2/GA and GA, respectively. In Fig. 3(D), the microspheres are connected to each other on the surface of the sheet layers of GO, and they have no obvious structure of microspheres, which may be due to SiO2 wrapped with polyvinyl alcohol during the cross-linking process and only a few microspheres are exposed. The phenomenon plays a supporting role in the formation of the aerogel, which prevents the structure collapse of GA. Therefore, the prepared aerogel has better mechanical properties (Fig. S2, ESI†), and the aerogel exists stably in water for a long time. Fig. 3(F) is the outside surface of GO, which shows many bumps on the layered surface of GO, and which are more conducive to the polymerization of PANI/SiO2 to the GO surface as much as possible. The TEM image (Fig. S3, ESI†) further proves that polyaniline was successfully attached to the silica microspheres.
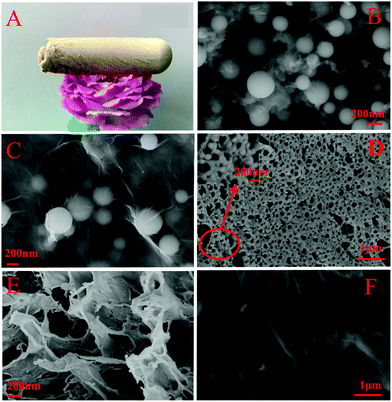 | ||
| Fig. 3 Photo of (A) GA. The SEM images of (B) PANI/SiO2/GO, (C) PANI/SiO2, and (D) PANI/SiO2/GA. (E) Cross-section of GA. (F) Outside surface of GO. | ||
The BET specific surface area test was carried out, and the results are shown in Fig. S4 (ESI†). According to the N2 adsorption–desorption curve and pore size distribution curve of PANI/SiO2/GA, the specific surface area is ∼80.5 m2 g−1, and most of the pore sizes are within 80–150 nm. The specific surface area of PANI/SiO2/GA is larger than GA, and the specific surface area of GA is only 32.1 m2 g−1.
Adsorption properties
Due to the electrostatic effect, PANI/SiO2/GA can adsorb cationic organic dyes with positive charges in aqueous solutions. Methylene blue (MB) and malachite green (MG) were used as representative cationic dyes in this work. The molecular structures of MB and MG are shown in Fig. S5 (ESI†).Effects of initial dye concentration and adsorption temperature
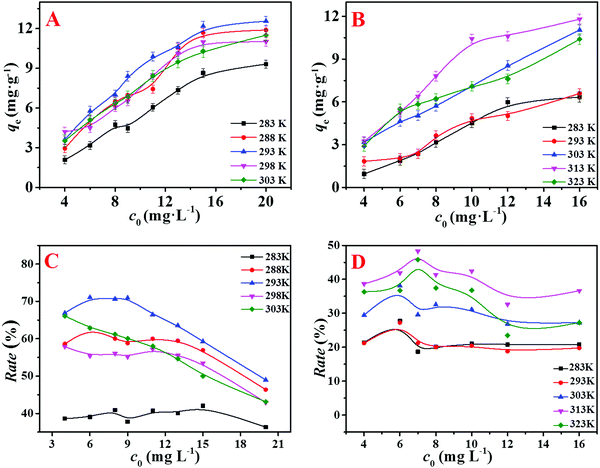
The initial concentration of the dyes can affect the adsorption amount of the adsorbent. In order to improve the utilization rate of the adsorbent and obtain the highest removal efficiency, the effects of different initial dye concentrations on adsorption were studied. The mass of the adsorbent added into the solution was consistent to ensure the same number of adsorption sites. As shown in Fig. 4, the removal rate of the adsorbent was higher when the initial concentration was lower, and the removal rate decreased with the increase in the initial concentration, which is because that the adsorption amount (qe) increases and the adsorption sites are saturated with the progress of adsorption. Fig. 4(C and D) show that the removal rate of the adsorbent decreased at high concentrations, but the adsorbent had good adsorption capacity on the dyes. According to Fig. 4, when the temperature of MB and MG dyes are less than 293 K and 303 K respectively, the adsorption is mainly dominated by physical processes such as electrostatic attraction. The molecular motion and adsorption performance is improved as the temperature increases. According to Van’t Hoff equation curves (Fig. S6, ESI†), it shows that when the ambient temperature is greater than 293 K and 303 K, ΔG = ΔH − TΔS < 0, the adsorption reaction is exothermic, which leads to a decrease in the adsorption performance as the temperature increases. Therefore, the optimal removal efficiency of the adsorbent is obtained when the initial concentrations of MB and MG are 9 mg L−1 and 8 mg L−1, and the adsorption temperatures of MB and MG are 293 K and 303 K, respectively.Effect of pH
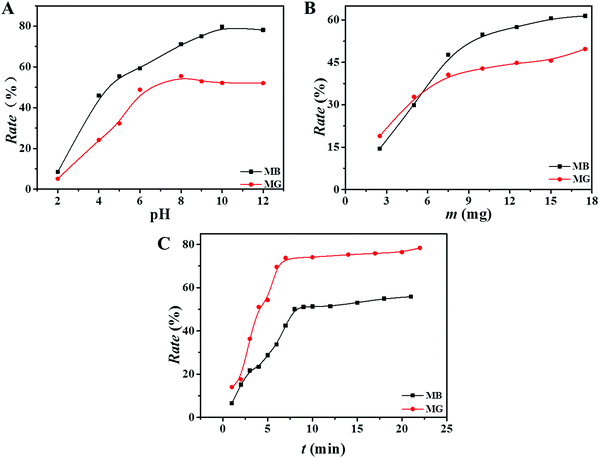
The pH of the dye solution has a great influence on the adsorption capacity of the adsorbent. When the pH was low, H+ in the solution can compete with the dye molecules, which affects the binding ability of the dye molecules to the adsorbent. An experiment on the effect of pH on the adsorption performance was carried out, and the specific steps are as follows: the pH of the dye solution was from 2 to 12, while the constant initial concentration of the dye solution was 9.0 mg L−1, and adsorption time was 8 min. It was concluded from Fig. 5(A) that the adsorbent had good adsorption effect on two dyes under appropriate pH conditions. The removal efficiency of the dyes at a pH value greater than 7 was higher than that at a pH value less than 7. It was because both dye molecules of MB and MG have positive charges on their surface. Under alkaline conditions, the surface cations of the adsorbent are reduced, and the number of corresponding anions is increased. The adsorption amount is increased due to the electrostatic attraction. However, the higher pH does not mean better adsorption effects. If the pH of the solution is too high, the amide group in the adsorbent will be hydrolyzed, and an overly alkaline environment is not conducive to the stability of the adsorbent. It is reported that when the pH of the solution is above 13, MB dye will be partially degraded into two molecules of methylene violet and azure B.34 In order to avoid the influence of other factors, the pH value is controlled below 12 in this experiment. As shown in Fig. 5(A), the suitable pH for the adsorption of MB and MG is 10 and 8, respectively.Effect of adsorbent mass
With the increase in the adsorbent mass, the number of adsorption sites increases, and the amount of adsorbed dye increases, but the adsorption efficiency is not always improving. Therefore, the effect of the mass of adsorbent on the removal rate was investigated, and the optimal amount of adsorption was determined. The curves of removal rate of MB and MG as a function of adsorbent mass are shown in Fig. 5(B). It is known that when the amount of the adsorbent was 10 mg and 8 mg, the adsorption rates reached the best corresponding to the initial concentration of 9 mg L−1 MB and 8 mg L−1 MG, respectively. As the mass of adsorbent increased, the dye removal rate curves were gradually flat. It could be because that the surface adsorption is saturated, and the later adsorption process is mainly attributed to the diffusion of dyes into the adsorbent, resulting in a lower adsorption rate. Therefore, the optimal adsorbent mass for MB and MG was 10 mg and 8 mg, respectively.Effect of adsorption time
The relationship between the adsorption time of the adsorbent and the dye removal rate was studied to ensure the optimal conditions for the adsorption of MB and MG, and the results are shown in Fig. 5(C). It was observed that the dye removal rate increased rapidly at the initial time period. Then, the adsorption rate gradually became slower and reached a balance after about 10 minutes. This was because that there were many adsorption sites on the outer surface of the adsorbent for adsorbing dyes at the beginning. However, the adsorption site reached saturation as the time increased, so the removal rate tended to be stable.Kinetics of adsorption
Adsorption kinetic experiments on the adsorbent to MG and MB were performed to determine the specific adsorption process, and the results are shown in Fig. S7 (ESI†). The initial dye concentrations of MG and MB were 9 mg L−1 and 8 mg L−1, respectively. The adsorption kinetic models are shown in ESI.†The curves and related parameters of the three models were established, and they are shown in Fig. S7, S8 (ESI†) and Table 1. It showed that the adsorption process of PANI/SiO2/GA to MG and MB conformed to the pseudo-secondary kinetic process and belonged to the chemical adsorption process. For the curve of qt ∼ t1/2, both the curves did not pass the origin, indicating that the adsorption process of MB and MG was not controlled by a single rate.
| Kinetic model | Parameters | MB | MG |
|---|---|---|---|
| Pseudo-first-order equation | K 1 (min−1) | 0.1429 | 0.1474 |
| q e (mg g−1) | 6.8055 | 5.4787 | |
| R 2 | 0.8883 | 0.8183 | |
| Pseudo-second-order equation | K 2 (min−1) | −0.1194 | −0.2348 |
| q e (mg g−1) | 5.6240 | 2.3346 | |
| R 2 | 0.9942 | 0.9920 | |
Adsorption isotherms
Adsorption isotherm model35–37 is often used to measure the adsorption performance of adsorbents, and hence, it is necessary to establish the isotherm model in the adsorption work.In this work, four isotherm models were established, as shown in Fig. S9 and S10 (ESI†). The Langmuir,36,37 Freundlich, Henry and Temkin equations were used to study the interaction mechanism between the dye molecules (MG and MB) and the adsorbent at different experimental temperatures, and other information affecting the adsorption process and the surface adsorption characteristics of the adsorbent were further obtained. More specific information is shown in ESI.†
Table 2 shows the data for isotherm models of the adsorbent. It was concluded that PANI/SiO2/GA showed different behaviors for the adsorption of MG and MB. The R2 values of these four models were calculated. The Langmuir model was suitable for explaining the adsorption equilibrium of MB on adsorbents; the R2 value is 0.9941 and higher than other models. Therefore, the adsorption of MB on PANI/SiO2/GA was mainly monolayer adsorption, and there was no interaction among the adsorbed molecules. The adsorption process of MG was consistent with the Freundlich model, and the R2 value is 0.9980. The value of n is 1.202 and greater than 1, which indicates that the adsorption process is physical adsorption. As cationic dyes, MB and MG have different adsorption mechanisms; the reason is as follows: MB molecules are smaller than MG molecules, and under the same conditions, smaller molecules may occupy the adsorption sites more effectively and attach to the adsorbent; MB has more surface heterogeneous adsorption, so that more adsorption capacity is related to the dye ion concentration at equilibrium.
| Isotherm model | Parameters | MB | MG |
|---|---|---|---|
| Langmuir | q (mg g−1) | 160.91 | 140.44 |
| b (L mg−1) | 0.1976 | 0.0323 | |
| R 2 | 0.9941 | 0.8899 | |
| Freundlich | K F | 3.23 | 1.46 |
| n | 1.756 | 1.202 | |
| R 2 | 0.9678 | 0.9980 | |
| Henry | K | 0.7817 | 0.8900 |
| R 2 | 0.8734 | 0.9974 | |
| Temkin | b T | 628.24 | 554.05 |
| A T | 1.70 | 0.81 | |
| R 2 | 0.9907 | 0.8358 | |
Thermodynamic study
In this work, the effect of temperature on the adsorption performance was expressed by the Van der Hoff equation. The thermodynamic parameters such as Gibbs free energy (ΔG), enthalpy (ΔH) and entropy (ΔS) were calculated using the following equations:ΔG = −RT![[thin space (1/6-em)]](https://www.rsc.org/images/entities/char_2009.gif) ln ln![[thin space (1/6-em)]](https://www.rsc.org/images/entities/char_2009.gif) K0 K0 | (3) |
ln![[thin space (1/6-em)]](https://www.rsc.org/images/entities/char_2009.gif) K0 = ΔS/R − ΔH/(RT) K0 = ΔS/R − ΔH/(RT) | (4) |
 | (5) |
 | (6) |
ΔH and ΔS were calculated according to the slope and intercept of van’t Hoff plots of ln(K0) versus 1/T. Fig. S6 (ESI†) is Van der Hough curves of MB and MG. The values of ΔH, ΔS, and ΔG are shown in Table 3.
| T = 298 K | ΔG (kJ mol−1) | ΔH (kJ mol−1) | ΔS (J mol−1 K−1) |
|---|---|---|---|
| MB | −0.9494 | 18.8789 | 66.5378 |
| MG | −0.3313 | 29.2327 | 96.9845 |
The ΔH values in Table 3 were greater than 0, which indicated that both adsorption reactions were endothermic reactions. When the temperature was 298 K, the values of ΔG were less than 0, which indicated that the adsorption process can proceed spontaneously.
Regeneration study
The recycling performance of the adsorbent is an important indicator to assess the quality of the adsorbent. In this work, PANI/SiO2/GA was immersed in four different desorption solutions to study its recycling performance, and then the adsorbent was simply squeezed by pressing using a tweezer and reused. The effects of different eluents on the regeneration of PANI/SiO2/GA are shown in Fig. 6. It was concluded that the adsorbent had the best reusability when 0.1 M NaOH was used as the eluent. By comparing the elution effects of the four eluents, it shows that the basic eluent has a better elution effect. The elution effect gradually weakens as the acidity of the eluent increases. This may be because MB and MG are both cationic dyes, which are prone to protonation in water; hence, it can be considered that the elution of NaOH is a deprotonation process. For MB, the adsorbent still maintained a good adsorption effect after 6 times of adsorption–desorption process, and the times for MG reached more than 10 times.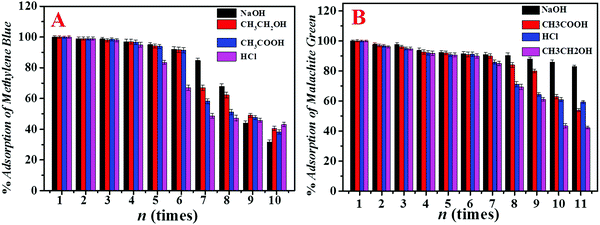 | ||
| Fig. 6 Effects of different eluents on the regeneration of PANI/SiO2/GA adsorbents that adsorb MB (A) and MG (B). | ||
Adsorption in different water matrices
To assess whether 0.1 M NaOH could be used to the desorption solutions of MB and MG from adsorbent under physical truth conditions, MB and MG were adsorbed in different aqueous matrices and then eluted by 0.1 M NaOH. The different aqueous matrices are lake water and rainwater collected in our school. The initial concentrations of MB and MG dyes are 9.0 mg L−1 and 8.0 mg L−1, respectively. The reaction is performed at room temperature for 10 min, and the elution effect is shown in Fig. S11 (ESI†). It shows that the elution efficiency of 0.1 M NaOH in rainwater is similar to that in tap water, while the elution effect in lake water is slightly worse. This is because the environment in the lake water is complex, and the adsorbent may be occupied by other substances that cannot be eluted by NaOH.Comparison of adsorption capacities based on literature data
The maximum adsorption capacities of adsorbents prepared in this work and the other reported to dyes were compared, and the results are shown in Table 4. By comparing with some adsorbents, it is obvious that PANI/SiO2/GA has better adsorption performance. The adsorption performance of PANI/SiO2/GA for the adsorption of MG is higher than that of GO and reduced graphene oxide (RGO).| Adsorbent | MB qm (mg g−1) | MG qm (mg g−1) | Ref. |
|---|---|---|---|
| Polydopamine (PDA) microspheres | 90.7 | 38 | |
| GPS/AA-MWCNTs-NCs | 10.3 | 39 | |
| Halloysite nanotubes | 84.32 | 40 | |
| ZnCo2O4 microspheres | 79.1 | 41 | |
| Palm Kernel fiber | 95.4 | 42 | |
| Ni(OH)2-NPs-AC | 76.92 | 43 | |
| Graphene oxide | 27.16 | 44 | |
| Reduced graphene oxide | 13.52 | 44 | |
| PANI/SiO 2 /GA | 160.91 | 140.44 | This work |
The photo of adsorption performance comparison
It is known that PANI has excellent adsorption properties,45 but its solubility and mechanical properties are weak, while GO has good mechanical properties, but the adsorption performance needs to be improved, and hence, we modified PANI on GO to improve the performance of the adsorbent. As shown in Fig. S12 (ESI†), under the same adsorption conditions, PANI/SiO2/GA has better adsorption capacity than GA due to the addition of PANI. Although the addition of PANI occupies the adsorption sites of GO, it improves the overall adsorption capacity of the adsorbent.Oil absorption experiment
In this work, oil absorption performance of the adsorbent was also tested. The adsorbents were put into beakers filled with different oils until reaching saturation absorption. Then, the adsorbent was taken out using a tweezer, and the mass was weighed before and after absorption. The oil absorption performance of the adsorbent was calculated. The oil absorption percentage (Q%) of the adsorbent was obtained using the following formula:| Q% = (W2 − W1)/W1 × 100% | (7) |
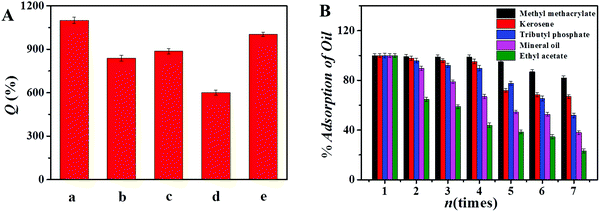
First, 0.01 g adsorbent adsorbed 50 μL of Sudan II dyed aniline within 3 s (Fig. S13, ESI†), which indicated that the adsorbent had an excellent adsorption rate and adsorption capacity to oil. Fig. 7(A) shows the absorption performance of the adsorbent for other organic substances. It shows that each gram of the adsorbent can adsorb oils 6 to 14 times its own weight, and the result is very close to delignified wood/epoxy (15 g g−1) and wood aerogels (20 g g−1),46,47 and hence, the oil absorption capacity of the adsorbent was excellent. Fig. 7(B) shows the reuse times of the adsorbent in oils. For most oils, the adsorbent can be reused more than 7 times.
In this part, the sponge-like properties of aerogels were used to absorb oil by simple physical absorption. The experimental results show that the absorption has achieved considerable results, as the aerogel has many voids and good mechanical properties.
Conclusions
In summary, PANI/SiO2/GA has been successfully prepared and used to adsorb dyes in water. When it was used to adsorb MB and MG and absorb oils, the adsorbent showed fast adsorption speed and high adsorption capacity. The isothermal and kinetic models were tested. The adsorption process of PANI/SiO2/GA to MB and MG were all conformed to the pseudo second-order kinetic model (adsorption kinetic model). The correlation coefficient indicated that the adsorption process of MB and MG was conformed to the Langmuir isotherm model and Freundlich model, respectively (adsorption isotherm model). The adsorbent can be reused more than 10 times when 0.1 M NaOH is an eluent and showed good recyclability. In addition, PANI/SiO2/GA can adsorb some common oils, which showed high recovery efficiency. Therefore, the adsorbent has great application potential in adsorbing harmful substances from water.Conflicts of interest
There are no conflicts to declare.Acknowledgements
This work was supported by the National Science Foundation for Young Scientists of China (No. 21605094), Shandong Province Natural Science Institute Joint Fund (No. ZR2015YL006), Shandong Provincial Natural Science Foundation of China (No. ZR2016BM01), Horizontal Scientific Research Project of China (No. W15077) and the Youth Science Fund of Shandong Academy of Sciences (No. 2017QN006).References
- M. Rouhi, M. M. Lakouraj, H. Tashakkorian and V. Hasantabar, New J. Chem., 2019, 43, 2400–2410 RSC.
- D. Robati, B. Mirza, M. Rajabi, O. Moradi and V. K. Gupta, Chem. Eng. J., 2016, 284, 687–697 CrossRef CAS.
- S. Ameen, H. K. Seo, M. S. Akhtar and H. S. Shin, Chem. Eng. J., 2012, 210, 220–228 CrossRef CAS.
- R. Bhattacharyya and S. K. Ray, Chem. Eng. J., 2015, 260, 269–283 CrossRef CAS.
- M. Roosta, M. Ghaedi, N. Shokri, A. Daneshfar and R. Sahraei, Spectrochim. Acta, Part A, 2014, 118, 55–65 CrossRef CAS.
- Y. Liu, Y. Kang, B. Mu and A. Wang, Chem. Eng. J., 2014, 237, 403–410 CrossRef CAS.
- D. Robati, B. Mirza, M. Rajabi, O. Moradi and V. K. Gupta, Chem. Eng. J., 2016, 284, 687–697 CrossRef CAS.
- S. Mishra and P. Kumar, J. Adv. Res., 2014, 1, 36–40 Search PubMed.
- S. W. Zhang, H. C. Yang, H. Y. Huang, H. H. Gao, X. X. Wang, R. Y. Cao, J. X. Li, X. J. Xu and X. K. Wang, J. Mater. Chem. A, 2017, 5, 15913–15922 RSC.
- R. T. Carneiro, T. B. Taketa, R. J. Gomes Neto, J. L. Oliveira, E. V. Campos, M. A. De Moraes, C. M. Da Silva, M. M. Beppu and L. F. Fraceto, J. Environ. Manage., 2015, 151, 353–360 CrossRef CAS.
- H. C. Lan, W. J. He, A. M. Wang, R. P. Liu, H. J. Liu, J. H. Qu and C. P. Huang, Water Res., 2016, 105, 575–582 CrossRef CAS.
- E. Karadag, O. Barıs and U. Zum, Polym. Bull., 2012, 68, 1357–1368 CrossRef CAS.
- B. D. Bhole, B. Ganguly, A. Madhuram, D. Deshpande and J. Joshi, Curr. Sci., 2004, 86(12), 1641–1645 CAS.
- V. K. Gupta, A. Mittal, V. Gajbe and J. Mittal, J. Colloid Interface Sci., 2008, 319(1), 30–39 CrossRef CAS.
- Y. Yan, H. P. Sun, P. P. Yao, S. Z. Kang and J. Mu, Appl. Surf. Sci., 2011, 257, 3620–3626 CrossRef CAS.
- J. P. Zhao, W. C. Ren and H. M. Cheng, J. Mater. Chem., 2012, 22, 20197–20202 RSC.
- M. S. D. Luna, C. Ascione and C. Santillo, Carbohydr. Polym., 2019, 211, 195–203 CrossRef.
- K. S. Mikkonen, K. Parikka, A. Ghafar and M. Tenkanen, Trends Food Sci. Technol., 2013, 34, 124–136 CrossRef CAS.
- W. Wan, R. Zhang, M. Ma and Y. Zhou, J. Mater. Chem. A, 2018, 6, 754–775 RSC.
- U. Berardi, Energy Build., 2018, 159, 370–381 CrossRef.
- A. Shaid, L. J. Wang, S. M. Fergusson and R. Padhye, Cloth. Text. Res. J., 2018, 36(3), 151–164 CrossRef.
- H. Maleki, Chem. Eng. J., 2016, 300, 98–118 CrossRef CAS.
- J. M. González-Domínguez, M. González, A. Ansón-Casaos, A. M. Díez-Pascual, M. A. Gómez and M. T. Martínez, J. Phys. Chem. C, 2011, 115, 7238–7248 CrossRef.
- Y. Guan, J. Rao and Y. L. Wu, Int. J. Biol. Macromol., 2020, 155, 369–375 CrossRef CAS.
- C. Lei, J. K. Gao, W. J. Ren, Y. B. Xie, S. Y. H. Abdalkarim, S. L. Wang, Q. Q. Ni and J. M. Yao, Carbohydr. Polym., 2019, 205, 35–41 CrossRef CAS.
- H. Chen, X. X. Wang, J. X. Li and X. K. Wang, J. Mater. Chem. A, 2015, 3, 6073–6081 RSC.
- Z. Wang, E. Liu, D. Gu and Y. Wang, Thin Solid Films, 2011, 519, 5280–5284 CrossRef CAS.
- N. A. Kumar, H. J. Choi, Y. R. Shin, D. W. Chang, L. Dai and J. B. Baek, ACS Nano, 2012, 6, 1715–1723 CrossRef CAS.
- D. Y. Xia, Z. Ku and D. Li, Chem. Mater., 2008, 20, 1847–1854 CrossRef CAS.
- D. Y. Xia, D. Li and Z. Ku, Langmuir, 2007, 23, 5377–5385 CrossRef CAS.
- C. Zhu, J. Zhai, D. Wen and S. Dong, J. Mater. Chem., 2012, 22(13), 6300–6306 RSC.
- M. Rouhi, M. Mansour Lakouraj, M. Baghayeri and V. Hasantabar, Int. J. Polym. Mater. Polym. Biomater., 2017, 66(1), 12–19 CrossRef CAS.
- H. Liu, X. Y. Wang and C. F. Ding, Environ. Chem., 2020, 17, 6–16 CrossRef CAS.
- X. Song, J. An, C. He, J. Zhou, Y. Xu, H. Ji, L. Yang, J. Yin, W. Zhao and C. Zhao, J. Mater. Chem. A, 2019, 7, 21386–21403 RSC.
- F. Hemmati, R. Norouzbeigi, F. Sarbisheh and H. Shayesteh, J. Taiwan Inst. Chem. Eng., 2016, 58, 482–489 CrossRef CAS.
- A. Mohd, N. Ahmad and O. Ahmad, Appl. Water Sci., 2015, 5, 407–423 CrossRef.
- E. Altıntıg, H. Altundag, M. Tuzen and A. Sarı, Chem. Eng. Res. Des., 2017, 122, 151–163 CrossRef.
- J. Fu, Z. Chen, M. Wang, S. Liu, J. Zhang, J. Zhang, R. Hanand and Q. Xu, Chem. Eng. J., 2015, 259, 53–61 CrossRef CAS.
- S. Mallakpour and S. Rashidimoghadam, Ultrason. Sonochem., 2018, 40(part A), 419–432 CrossRef CAS.
- M. F. Zhao and P. Liu, Microporous Mesoporous Mater., 2008, 112, 419–424 CrossRef CAS.
- H. X. Guo, J. H. Chen, W. Weng, Q. X. Wang and S. X. Li, Chem. Eng. J., 2014, 239, 192–199 CrossRef CAS.
- G. O. EI-Sayed, Desalination, 2011, 272, 225–232 CrossRef.
- F. Nekouei, H. Kargarzadeh, S. Nekouei, I. Tyagi, S. Agarwal and V. K. Gupta, Process Saf. Environ. Prot., 2016, 102, 85–97 CrossRef.
- D. Robati, M. Rajabi, O. Moradi, F. Najafi, I. Tyagi, S. Agarwal and V. K. Gupta, J. Mol. Liq., 2016, 214, 259–263 CrossRef CAS.
- X. H. Liu, C. Cheng and C. J. Xiao, et al. , Appl. Surf. Sci., 2017, 411, 371–377 Search PubMed.
- Q. Fu, F. Ansari, Q. Zhou and L. A. Berglund, ACS Nano, 2018, 12, 2222–2230 CrossRef CAS.
- K. Wang, X. Liu, Y. Tan, W. Zhang, S. Zhang and J. Li, Chem. Eng. J., 2019, 371, 769–780 CrossRef CAS.
Footnote |
| † Electronic supplementary information (ESI) available. See DOI: 10.1039/d0nj04398b |
| This journal is © The Royal Society of Chemistry and the Centre National de la Recherche Scientifique 2021 |

