Solid state emissive azo-Schiff base ligands and their Zn(II) complexes: acidochromism and photoswitching behaviour†
Yogesh
Kumar
,
Vishwa Deepak
Singh
,
Bhupendra Kumar
Dwivedi
,
Nikhil Kumar
Singh
and
Daya Shankar
Pandey
 *
*
Department of Chemistry, Institute of Science, Banaras Hindu University, Varanasi – 221 005, U.P., India. E-mail: dspbhu@bhu.ac.in; Fax: +91 542 2368174; Tel: +91 542 6702480
First published on 3rd November 2020
Abstract
The synthesis of Zn(II) complexes (C1–C2) based on azo-Schiff base ligands 2-((E)-(phenyl-imino)methyl)-4-((E)-(2-(phenylthio)phenyl)diazenyl)phenol (L1) and 4-((E)-(2-(phenyl-thio)phenyl)diazenyl)-2-((E)-(p-tolylimino)methyl)phenol (L2) has been described. These have been thoroughly characterized by spectroscopic studies (IR, 1H, 13C, ESI-MS, electronic absorption, emission) and the structures of C1 and C2 have been determined by X-ray single crystal analyses. The ligands L1 and L2 exhibit reversible acid/base induced “ON–OFF–ON” switching in solution and solid state. Upon exposure to UV light (λ, 365 nm) C1 and C2 display cis–trans photoisomerisation and after removal of light they transform to more stable trans-form. Electronic absorption and 1H NMR studies on C1 and C2 revealed rather rapid (1.27 × 10⁻¹ s−1) photoisomerization for C2 relative to C1 (2.7 × 10⁻² s−1) which has also been supported by theoretical studies (DFT). The rather fast photoisomerization for C2 compared to C1 may be related to a small energy gap between HOMO and LUMO levels for the respective isomers.
Introduction
Stimulus active functional organic materials have attracted immense current interest within the scientific community.1,2 The physical or chemical properties of such materials are altered by exposure to external stimuli, e.g., light, heat, electric/magnetic field, mechanical stress, and chemical stimuli.3–7 Amongst these solid state emissive organic luminogens are ubiquitous and find wide application in the selective detection of explosives, organic amines, acidic gases, metal ions, etc.8–13 On the other hand, reports dealing with solid state emissive azobenzene based Schiff base complexes are rather scarce.14 Usually these are weakly or non-emissive in solution and solid state due to the active rotation and strong electron withdrawing nature of the –N![[double bond, length as m-dash]](https://www.rsc.org/images/entities/char_e001.gif) N– linkage.15 Solid state emissive azobenzene based Schiff base ligands are attractive because of their extensive synthetic chemistry and ease of structural modifications. Further, functional dyes capable of displaying appreciable changes in their absorption and emission characteristics readily by acid-base stimuli have attracted huge attention due to their potential use in diverse areas.16
N– linkage.15 Solid state emissive azobenzene based Schiff base ligands are attractive because of their extensive synthetic chemistry and ease of structural modifications. Further, functional dyes capable of displaying appreciable changes in their absorption and emission characteristics readily by acid-base stimuli have attracted huge attention due to their potential use in diverse areas.16
In addition, azobenzene based Schiff base ligands displaying high chelation ability toward metal ions are indispensable in coordination and supramolecular chemistry.17–19 These alter photoinduced electron transfer (PET) characteristics of metal complexes and bestow them with distinct photophysical and electrochemical properties.20 In this regard, Zn(II) based complexes have been attractive because of their wide application as electroluminescent materials for high performance OLEDs.21–23 Further, metal complexes based on luminescent azobenzene and azophenol derivatives have fascinated many research groups due to their great promise in different areas.24–30 These display diverse colours and are popular as photochromic dyes due to the presence of a large number of vibronic states at each energy level.31–33 Upon irradiation with UV light or when subjected to mechanical stress or electrostatic stimulation causing sizeable changes in the geometry and polarity of the molecules through azo (–N![[double bond, length as m-dash]](https://www.rsc.org/images/entities/char_e001.gif) N–) linkage these also exhibit cis–trans isomerisation. Usually the trans-form for such systems is thermodynamically more stable and coloured relative to the cis-isomer. UV/vis induced reversible trans–cis and cis–trans isomerization for azobenzene based systems involves π–π* and n–π* transitions.34–36 It has been studied at length and utilized in areas like synthesis of photo-responsive hybrid materials and layers, supramolecular assemblies, photoswitches, catalysts, and coordination chemistry of transition metal cations.37
N–) linkage these also exhibit cis–trans isomerisation. Usually the trans-form for such systems is thermodynamically more stable and coloured relative to the cis-isomer. UV/vis induced reversible trans–cis and cis–trans isomerization for azobenzene based systems involves π–π* and n–π* transitions.34–36 It has been studied at length and utilized in areas like synthesis of photo-responsive hybrid materials and layers, supramolecular assemblies, photoswitches, catalysts, and coordination chemistry of transition metal cations.37
Considering these points through this work two novel azo-based Schiff base ligands 2((E)-(phenylimino)methyl)-4-((E)-(2-(phenylthio)phenyl)diazenyl)-phenol (L1) and 4-((E)-(2-(phenylthio)phenyl)diazenyl)-2-((E)-(p-tolylimino)methyl)-phenol (L2) and Zn(II) complexes containing these ligands [Zn(L1)2](C1) and [Zn(L2)2](C2) have been synthesized. To offer better electron cloud on the N^O-chelating site –H in (C1) has been replaced by an electron donor group, –CH3 (C2). Owing to apt tuning C1 and C2 display excellent photoswitching. Through this contribution we describe the synthesis, thorough characterization and photophysical prosperities of the azo-Schiff base based ligands L1 and L2 and their Zn(II) complexes C1 and C2. To the best of our knowledge this study presents the first report dealing with acidochromism in solid state emissive azo-Schiff base ligands (L1–L2).
Experimental section
Reagents
All the synthetic manipulations have been performed under an inert atmosphere. Common reagents and solvents were purchased from commercial sources (Sigma Aldrich, Avra and sd fine Chem. Ltd) and used as received. Solvents were dried and distilled prior to use following literature procedures.38General methods
Photophysical studies on the ligands and complexes have been made using spectroscopic grade solvents. Electronic absorption and fluorescence spectra have been acquired on Shimadzu UV-1800 and PerkinElmer LS 55 Fluorescence spectrometers at room temperature. 1H (500 MHz) and 13C (125 MHz) NMR spectra at room temperature have been acquired on a JEOL AL500 FT-NMR spectrometer using tetramethylsilane [Si–(CH3)4] as an internal reference. Electrospray ionization mass spectrometric (ESI-MS) measurements have been made on a Bruker Daltonics Amazon SL ion trap and Agilent Q-TOF LC/MS mass spectrometer.Syntheses
X-ray crystallography
Crystals suitable for X-ray single crystal analyses for C1 and C2 were obtained by slow diffusion of methanol over a solution of respective complexes in dichloromethane. Data collection was made on a Bruker APEX-II CCD diffractometer equipped with a graphite monochromator using Mo-Kα (λ = 0.71073 Å) radiation at 296 K (C1) and 273 K (C2) in φ and ω scan mode. The structures were refined by direct methods (SHELXS 97) followed by full-matrix least squares on F2 (SHELX 14) within the OLEX2 environment.39 Non-H atoms were treated anisotropically and H-atoms attached to carbon were included as fixed contribution calculated geometrically and refined using the SHELX riding model. The computer program PLATON was used for analyzing the interaction and stacking distances.40 CCDC deposition No. 1974291 (C1) and 1974292 (C2).†Photochemical studies
Stock solutions for photochemical studies on ligands and complexes were prepared in dichloromethane. trans–cis photoswitching was investigated by irradiating the samples with UV light (365 nm) in a closed chamber using a GeNei UV lamp. Solid state fluorescence for the ligands and “ON–OFF–ON” switching behaviour were studied by treating the ligands with trifluoroacetic acid (TFA) and triethylamine (TEA).Theoretical studies
The GAUSSIAN 09 program package41 has been used for density functional theory (DFT) calculations42,43 at Becke's three parameter functional and Lee–Yang–Parr hybrid functional (B3LYP)44 level of calculation. The structures of L1–L2 were designed using Chem-Bio Draw Ultra software and their 3D views optimized by minimizing the energy of the molecules in MM2 mode using the same software. The initial geometry for C1 and C2 was taken from single crystal X-ray data and subjected to optimization. For the ligands (L1–L2) 6-31G**![[thin space (1/6-em)]](https://www.rsc.org/images/entities/char_2009.gif) 45–47 has been used as the basis set for non-metal atoms (C, H, N, S, O) for ground state geometry optimization and conformational stability in gaseous state while the metal center (Zn) has been described by the LANL2DZ48 effective core potential (ECP) basis set for C1–C2.
45–47 has been used as the basis set for non-metal atoms (C, H, N, S, O) for ground state geometry optimization and conformational stability in gaseous state while the metal center (Zn) has been described by the LANL2DZ48 effective core potential (ECP) basis set for C1–C2.
Results and discussion
Synthesis and characterization
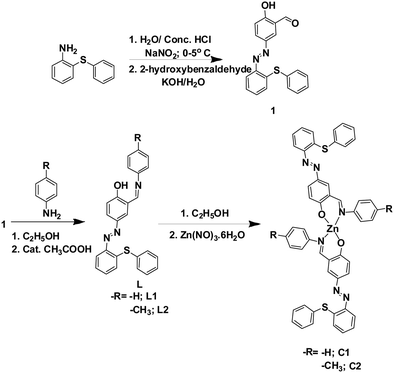
2-Hydroxy-5-((2-(phenylthio)phenyl)diazenyl)benzaldehyde was prepared following the literature procedure with slight modifications.49–51 Ligands (L1–L2) were synthesized in good yield (70 and 75%) by condensation of azo-aldehyde with amine in 1![[thin space (1/6-em)]](https://www.rsc.org/images/entities/char_2009.gif) :
:![[thin space (1/6-em)]](https://www.rsc.org/images/entities/char_2009.gif) 1 molar ratio in the presence of catalytic amounts of acetic acid. The zinc complexes (C1 and C2) were prepared by dropwise addition of Zn(NO3)2·6H2O to a deprotonated methanolic solution of respective ligands at room temperature. A simple scheme showing the syntheses of L1–L2 and complexes C1–C2 is shown in Scheme 1.
1 molar ratio in the presence of catalytic amounts of acetic acid. The zinc complexes (C1 and C2) were prepared by dropwise addition of Zn(NO3)2·6H2O to a deprotonated methanolic solution of respective ligands at room temperature. A simple scheme showing the syntheses of L1–L2 and complexes C1–C2 is shown in Scheme 1.
The ligands and complexes under study are insensitive to air and moisture, and show good solubility in common organic solvents such as dichloromethane, dimethylsulfoxide, tetrahydrofuran, acetonitrile, acetone, and chloroform and are insoluble in water, methanol, ethanol, hexane and petroleum ether. The synthesized ligands and complexes were thoroughly characterized by spectroscopic studies (IR, 1H and 13C NMR, UV/vis, emission, ESI-MS) and the structures of C1 and C2 were determined by X-ray single crystal analyses. In their IR spectra ligands (L1 and L2) displayed vibrations due to the C![[double bond, length as m-dash]](https://www.rsc.org/images/entities/char_e001.gif) N moiety at 1614 and 1617 cm−1, respectively, while N
N moiety at 1614 and 1617 cm−1, respectively, while N![[double bond, length as m-dash]](https://www.rsc.org/images/entities/char_e001.gif) N vibrated at 1469 and 1470 cm−1. After complexation with Zn(II) the stretching frequency for the aldimine moiety went down to 1608 and 1610 cm−1 for C1 and C2.52
N vibrated at 1469 and 1470 cm−1. After complexation with Zn(II) the stretching frequency for the aldimine moiety went down to 1608 and 1610 cm−1 for C1 and C2.52
The formation and purity of ligands and complexes were affirmed by 1H and 13C NMR spectral studies in CDCl3 at room temperature. The resulting data are summarized in the experimental section along with other characterization data and spectra shown in Fig. S1–S10 (ESI†). The 1H spectrum of azo-aldehyde showed sharp singlets at δ 11.35 and 10.02 ppm due to phenolic –OH and –CHO protons in the downfield region relative to aromatic protons. The 1H spectrum of L1–L2 showed loss of the signal due to –CHO and the emergence of new sharp singlets for the aldimine proton at δ 8.76 and 8.74 ppm. As well, the phenolic –OH proton displayed downfield shifting (δ 13.93, L1; 14.07 ppm, L2). The phenolic –OH proton for L2 resonated at a slightly high δ value relative to L1 due to an increase in donor ability caused by the presence of the (–CH3) group. The aldimine proton resonances for L1 and L2 showed insignificant upfield shifting (0.25, C1; 0.24 ppm, C2) after complexation with Zn(II) probably due to the moderate donor ability of the substituents –H and –CH3. Further, the signal due to the phenolic –OH proton disappeared advocating complexation of the respective ligand with the metal through N^O chelating sites. The –CH3 protons of L2 (2.39 ppm) upfield shifted to 2.31 ppm in C2 after complexation with the metal centre. The position of signals for various protons and their integrated intensity strongly support formation of the complexes. 13C NMR spectroscopic data for L1–L2 and the complexes (C1–C2) summarised in the experimental section along with other characterization data strongly support formation and formulation of these compounds.
ESI-MS strongly supported formation of the ligands and complexes. In their mass spectra the ligands and complexes displayed molecular ion peaks at m/z [M + H]+: 410.1353 (L1) (calcd m/z 409.1249), [M + H]+: 424.1540 (L2) (calcd m/z 423.1405), [M + Na]+: 903.1932 (C1) (calcd m/z 903.1530) and [M + H]+: 909.2125 (C2) (calcd m/z 909.2024) (Fig. S11 and S12, ESI†). The overall fragmentation pattern strongly suggested their respective formulations.
Single crystal structures
The structures of both C1 and C2 were determined by X-ray single crystal analyses. Details about the data collection, solution and refinement are gathered in Table 1, and their pertinent views in Fig. 1 The geometrical parameters are presented in Table S1 (ESI†). Complex C1 crystallizes in the monoclinic system with the space group P121/n1s while C2 crystallizes in the triclinic system with the space group P![[1 with combining macron]](https://www.rsc.org/images/entities/char_0031_0304.gif) . The Zn(II) centre in C1 and C2 adopted a distorted tetrahedral (Td) geometry with coordination sites occupied by phenolate oxygen and imine nitrogen. Various Zn–N, Zn–O and aldimine C–N bond lengths N–Zn–N and O–Zn–O bond angles for both C1 and C2 are normal and comparable to other reported systems.53
. The Zn(II) centre in C1 and C2 adopted a distorted tetrahedral (Td) geometry with coordination sites occupied by phenolate oxygen and imine nitrogen. Various Zn–N, Zn–O and aldimine C–N bond lengths N–Zn–N and O–Zn–O bond angles for both C1 and C2 are normal and comparable to other reported systems.53
| Crystal parameters | C1 | C2 |
|---|---|---|
| Empirical formula | C50H36N6O2S2Zn | C52H40N6O2S2Zn |
| Formula weight | 40.57 | 91.05 |
| Crystal system | Monoclinic | Triclinic |
| Space group | P121/n1 |
P![[1 with combining macron]](https://www.rsc.org/images/entities/char_0031_0304.gif) |
| a (Å) | 19.902(5) | 10.8345(2) |
| b (Å) | 9.306(2) | 14.111(2) |
| c (Å) | 25.052(5) | 16.086(3) |
| α (deg) | 90.00 | 109.261(6) |
| β (deg) | 110.827(7) | 107.479(5) |
| γ (deg) | 90.00 | 91.516(6) |
| V (Å3) | 4336.5(17) | 2192.7(6) |
| Color and habit | Red, needle | Red, needle |
| Z | 4 | 2 |
| d cal (g cm−3) | 1.352 | 1.379 |
| Temperature (K) | 273(2) | 273(2) |
| Wavelength (Å) | 0.71073 | 0.71073 |
| μ (mm−1) | 0.711 | 0.705 |
| GOOF on F2 | 0.8767 | 1.0293 |
| R indices (all data) | R 1 = 0.1053, wR2 = 0.1765 | R 1 = 0.0750, wR2 = 0.1751 |
| Final R indices [I > 2σ(I)] | R 1 = 0.0651, wR2 = 0.1581 | R 1 = 0.0510, wR2 = 0.1519 |
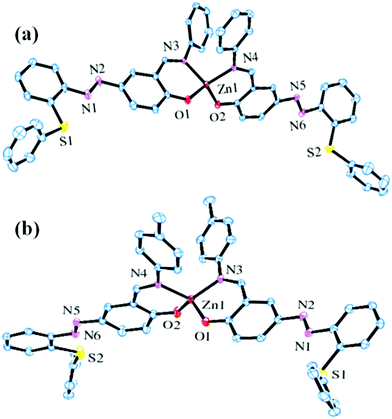 | ||
| Fig. 1 ORTEP views of C1 (a) and C2 (b) at 50% thermal ellipsoid probability (H atoms are omitted for clarity). | ||
Photophysical studies
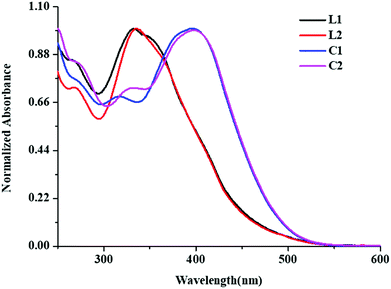
Electronic absorption spectra of L1 and L2 were acquired in dichloromethane at room temperature. These exhibited absorption bands at 332 (L1) and 335 nm (L2) due to π–π* transition. Further, Zn(II) complexes (C1 and C2) showed red shifted absorption relative to the ligands due to π–π* transitions at 391 nm and 395 nm, respectively with weak n–π* transitions (Fig. 2).54Acid–base titration
The basic nitrogen atom of the azo chromophore in conjugation with the aldimine moiety of the ligands L1 and L2 may act as a good proton acceptor. The pale yellow colour of the CH2Cl2 solution of ligands (c, 50 μM) upon gradual addition of trifluoroacetic acid (TFA) turned dark red and reverted back to original colour after the addition of triethylamine (TEA). The reversible acidochromic behaviour of L1 and L2 was investigated by absorption spectral studies under the stimulation of TFA and TEA. As depicted in Fig. 3, upon addition of TFA the main absorption band for L2 showed hyperchromism (332 nm) with the concurrent emergence of a new band at 541 nm.55,56 The bathochromic band may arise due to the electron withdrawing nature of the newly formed protonated intermediate species which promotes intramolecular charge transfer, and in turn, the colour of the solution became green from pale yellow. Treatment with TEA neutralized the acidic solution causing the red shifted absorbance at 541 nm to gradually diminish with restoration of the original band at 332 nm and recovery of pale yellow colour; in an analogous manner L1 too showed the reversible acidochromic behaviour (Fig. S13, ESI†).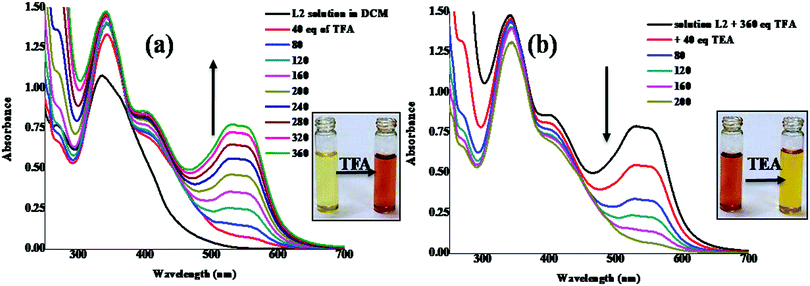 | ||
| Fig. 3 UV/vis absorption spectra of L2 (in DCM) showing changes upon gradual addition of (a) TFA and neutralization with TEA (b). | ||
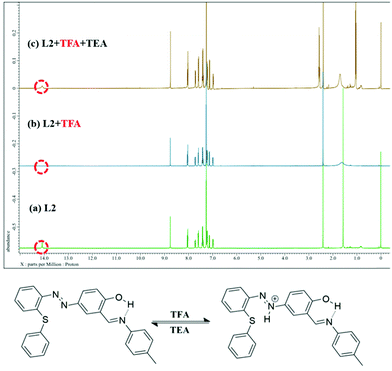
To validate the reversibility of L2 in the presence of acid and base 1H NMR titration studies were performed. The phenolic –OH resonance for L2 at δ 14.07 ppm vanished (Fig. 4) upon addition of 50 eq. of TFA. It may be associated with phenolic –OH without an intramolecular hydrogen bond. In turn, on addition of 50 eq. of TEA the downfield peak at δ 14.07 recurred at its original position advocating reversibility of the system.57,58
Similar experiments were performed under the stimulation of TFA and TEA vapours in solid-state. The ligands (L1 and L2) showed “ON–OFF–ON” type emission under acid/base fumigation (Fig. 5b). Upon excitation at ∼335 nm these showed a broad band (550–660 nm) with the maxima cantered at 616 (L1) (Fig. S14, ESI†) and 622 nm (L2) (Fig. 5(a)). Notably, L2 showed red shifted emission relative to L1 due to the inclusion of a substituent with enhanced electron donor ability (–CH3). As shown in Fig. 5(c), emission intensity for ligands quenched ∼7 and 8 times upon exposure to TFA fumes. The orange colour rapidly turned dark red and an appreciable quenching of emission was observed. However, the ligands regained their original emission band upon exposure to TEA fumes.59,60
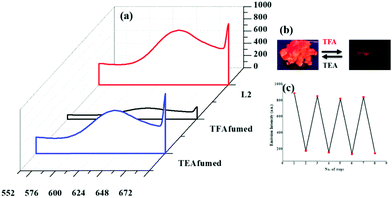 | ||
| Fig. 5 Emission spectrum (solid-state) showing changes for L2 upon exposure to TFA fumes and TEA fumes (a), and (b) emission switch cycle upon exposure to TFA and TEA (c). | ||
Photoisomerization
The ligands (L1 and L2) with the azobenzene chromophore do not show photoisomerization (trans–cis and cis–trans) upon exposure to UV light due to the presence of the p-phenolic group enabling the tautomerization of the system (Fig. S16, ESI†).61 On the other hand, after complexation with the metal center wherein the phenolic group gets involved in the interaction with the metal (Fig. S19, ESI†) the resulting complexes display trans–cis isomerization and revert back to cis–trans after withdrawal of the light for a short time (20 s, C1; 16 s, C2). Their electronic absorption spectra exhibited an absorption band due to π–π* transition at 391 (ε, 4.30 × 10⁴ M−1 cm−1, C1) and 395 nm (ε, 3.80 × 10⁴ M−1 cm−1, C2). Upon exposure to UV light (365 nm) at regular intervals (5 s, C1; 4 s, C2), the π–π* band for trans- to cis-isomerisation of C1 and C2 showed a hypso- as well as hyper-chromic shift and appeared at 340 (ε, 4.96 × 10⁴ M−1 cm−1) and 342 nm (ε, 4.60 × 10⁴ M−1 cm−1), respectively (Fig. 6 and Fig. S17, ESI†). The steric hindrance of the ortho-SPh group destabilises the trans-isomer and prevents the phenyl ring from lying co-planar with the rest of the molecule. Loss of planarity in the trans-isomer can be inferred by its blue shifted absorption bands. The trans–cis isomerisation attained a photostationary state (PSS) within 20 s (C1) and 16 s (C2), and irradiation of light (up to 1 h) did not cause any change in the absorption spectra of cis-C1 and C2. However, cis–trans isomerization was induced by irradiation of visible light. The complexes upon exposure to visible light (450 nm) for six hours completely transformed into the trans-form from the cis-form. The conversion from cis- to trans-form was also monitored by UV/vis spectral studies wherein both the complexes showed bathochromic and hypochromic shift after exposure to visible light (10 min interval).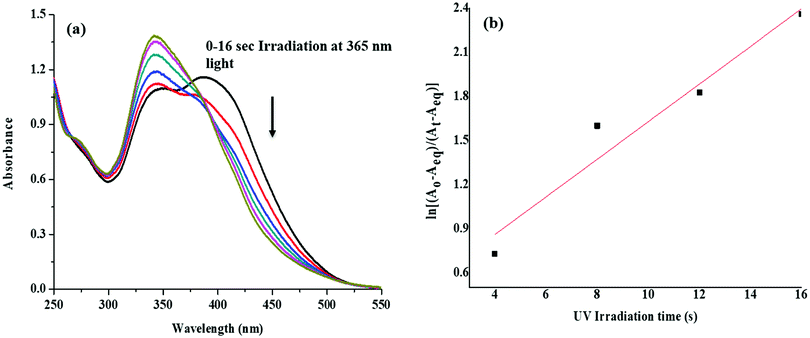 | ||
| Fig. 6 Changes in the UV/vis absorption spectra upon photoirradiation with UV light of 365 nm for 16 s (a), and photoisomerization kinetics for the complex C2 (b). | ||
The complexes C1 and C2 displayed reversible first-order kinetics with rate constants (k) of 2.7 × 10⁻² and 1.27 × 10⁻¹ s−1, respectively, in CH2Cl2 solution (Fig. 6 and Fig. S17, ESI†). The observed changes in UV/vis spectral features were validated by 1H NMR spectroscopy. The 1H NMR spectrum of C2 in CDCl3 shows a broad multiplet due to aromatic protons in the range δ 8.09–6.94 ppm and a sharp imine singlet at δ 8.48 ppm advocating the occurrence of only the trans-form. After exposing the sample to UV light before acquiring the NMR spectrum and repeating the process until a photo stationary state (PSS) was reached (Fig. S17, ESI†), marked changes were observed. Irradiation of the sample with UV light led to the emergence of a new set of signals assignable to cis-C2 (marked red, Fig. S18, ESI†). The configurational changes involved in the transformation from trans- to the cis-state caused significant upfield shifts for both the imine and azobenzene protons.62–65
Density functional theory
Geometry optimization for the complexes under study was carried out using Gaussian 09 at the B3LYP level of theory. The metal centre Zn(II) was described by the LANL2DZ effective core potential (ECP) basis set, whereas non-metal atoms were described by the 6-31G** basis set. Notably, HOMO energy levels for L1–L2 dominated over orbitals of the azo moiety, while LUMOs mainly distributed over aldimine units. The band gap between HOMO (−5.75, L1; −5.49, L2) and LUMO (−2.09, L1; −1.97, L2) for ligands is 3.66 and 3.52 eV respectively (Fig. 7). On the other hand, HOMO and LUMO for the complexes are mainly distributed over azo and phenyl units. Complexes C1–C2 showed almost the same HOMO (−5.36, C1; −5.31, C2) and LUMO level (−2.07, C1; −2.02, C2) and the theoretical HOMO–LUMO gap for C1 and C2 was worked out to be 3.29 eV. Further, trans–cis isomerization of complexes was also supported by geometry optimization and energy calculations using DFT. The HOMOs in the cis-form are distributed over the azobenzene ring and salen moieties at −5.24 (C1) and −5.19 eV (C2) while the LUMOs are distributed on salen and phenyl units [−2.11, C1; −2.01 eV, C2]. The frontier orbitals and energy level for HOMO and LUMO for cis isomers of complexes are depicted in Fig. S24 (ESI†). Energy gaps between HOMO and LUMO are 3.13 eV (cis-C1) and 3.29 eV (trans-C1) and 3.18 eV (cis-C2) and 3.29 eV (trans-C2). The energy difference for trans- and cis- for C2 (0.11 eV) is lower relative to C1 (0.16 eV) which facilitates rapid trans–cis isomerization for the former compared to the latter.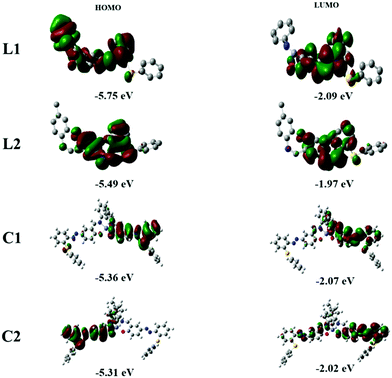 | ||
| Fig. 7 Frontier molecular orbitals of ligands L1 and L2 and complexes C1 and C2 obtained from the DFT calculations. | ||
Conclusion
In summary, this work deals with the synthesis and thorough characterization of two novel azo based Schiff base functionalized ligands (L1–L2) and their Zn(II) complexes (C1–C2). The ligands displayed solid state emission and were utilised in the sensing of acidic fumes based on reversible emission changes and they may potentially serve as solid-state fluorescent sensors for acidic vapours. It has been further demonstrated that upon exposure to UV light both the complexes undergo trans–cis photoisomerization. Comparative photoswitching studies on C1 and C2 revealed that trans–cis isomerization in C2 is faster (k = 1.27 × 10⁻¹ s−1) relative to C1 (k = 2.70 × 10⁻² s−1) and this was supported by electronic absorption, 1H NMR, and theoretical studies.Conflicts of interest
The authors declare no competing financial interest.Acknowledgements
The authors gratefully acknowledge the Science and Engineering Research Board (SERB), New Delhi, India, for providing financial assistance through the scheme EMR/2015/001535 and also UGC, New Delhi, India, for the award of a Senior Research Fellowship to Y. K. (Chem./2016-17/RET Ex.-2/March-17/Sem.-1/2100). We are also thankful to the Head, Department of Chemistry, Institute of Science, Banaras Hindu University, Varanasi (U.P.), India, for extending laboratory facilities and Dr Boomi Shankar, IISER Pune, Maharashtra, India, for providing single-crystal X-ray data.References
- W. A. Jeevadason, K. K. Murugavel and M. A. Neelakantan, Renewable Sustainable Energy Rev., 2014, 36, 220–227 CrossRef.
- M. Dong, A. Babalhavaej, S. Samanta, A. A. Beharry and A. G. Woolley, Acc. Chem. Res., 2015, 48, 2662–2670 CrossRef CAS.
- A. N. Simeth, S. Crespi, M. Fagnoni and B. König, J. Am. Chem. Soc., 2018, 140, 2940–2946 CrossRef.
- G. J. Amorós and D. Velasco, Beilstein J. Org. Chem., 2012, 8, 1003–1017 CrossRef.
- K. S. Surampudi, R. H. Patel, G. Nagarjuna and D. Venkataraman, Chem. Commun., 2013, 49, 7519–7521 RSC.
- L. Y. Hsu, S. Maity, Y. Matsunaga, Y. F. Hsu, Y. H. Liu, M. S. Peng and T. Shinmyozua, Chem. Sci., 2018, 9, 8990–9001 RSC.
- J. Wen, Z. Tian and J. Ma, J. Phys. Chem. C, 2013, 39, 19934–19944 CrossRef.
- B. Shao, M. Baroncini, H. Qian, L. Bussotti, M. D. Donato, A. Credi and I. Aprahamian, J. Am. Chem. Soc., 2018, 39, 12323–12327 CrossRef.
- S. Chaudhary, P. Sonkusre, K. K. Bhasin, P. Sabherwal and C. R. Suri, Biosens. Bioelectron., 2019, 126, 590–595 CrossRef CAS.
- G. Dhaka, N. Kaur and J. Singh, Inorg. Chim. Acta., 2017, 464, 18–22 CrossRef CAS.
- Y. Li, X. Han and Y. Song, RSC Adv., 2017, 7, 20537–20541 RSC.
- W. Piao, S. Tsuda, Y. Tanaka, S. Maeda and F. Liu, Angew. Chem., Int. Ed., 2013, 52, 13028–13032 CrossRef CAS.
- A. Panja and K. Ghosh, Mater. Chem. Front., 2018, 2, 1866–1875 RSC.
- R. Dianaa, B. Panunzia, R. Shiklerb and S. Nabhab, Inorg. Chem. Commun., 2019, 104, 186–189 CrossRef.
- A. Kumar, R. Pandey, R. K. Gupta, V. Mishra, S. M. Mobin and D. S. Pandey, Dalton Trans., 2014, 43, 6365–6376 RSC.
- I. Aprahamian, Chem. Commun., 2017, 53, 6663–6802 RSC.
- M. Tunçel and S. Serin, Synth. React. Inorg., Met.-Org., Nano-Met. Chem., 2005, 35, 203–212 CrossRef.
- F. Purtasa, K. Sayin, G. Ceyhan, M. Kose and M. Kurtoglu, J. Mol. Struct., 2017, 1137, 461–475 CrossRef.
- S. Slassi, A. Fix-Tailler, G. Larcher, A. Amine and A. El-Ghayoury, Heteroat. Chem., 2019, 2018, 1–8 CrossRef.
- J. C. Qin, L. Fan and Z. Y. Yang, Sens. Actuators, B, 2016, 228, 156–161 CrossRef CAS.
- L. S. Sapochak, F. E. Benincasa, R. S. Schofield, J. L. Baker, K. K. C. Riccio, D. Fogarty, H. Kohlmann, K. F. Ferris and P. E. Burrows, J. Am. Chem. Soc., 2002, 21, 6119–6125 CrossRef.
- X. Xu, Y. Liao, G. Yu, H. You, C. Di, Z. Su, D. Ma, Q. Wang, S. Li, S. Wang, J. Ye and Y. Liu, Chem. Mater., 2007, 7, 1740–1748 CrossRef.
- A. S. Burlova, V. G. Vlasenkob, Y. V. Koshchienkoa, N. I. Makarovaa, A. A. Zubenkoc, Y. D. Drobinc, L. N. Fetisovc, A. A. Kolodinaa, Y. V. Zubavichusd, A. L. Trigubd, S. I. Levchenkove and D. A. Garnovskii, Polyhedron, 2018, 154, 65–76 CrossRef.
- S. Miao, H. Li, Q. Xu, N. Li, J. Zheng, R. Sun, J. Lu and C. M. Li, J. Mater. Chem., 2012, 22, 16582–16589 RSC.
- J. M. Mativetsky, G. Pace, M. Elbing, M. A. Rampi, M. Mayor and P. Samorì, J. Am. Chem. Soc., 2008, 130, 9192–9193 CrossRef CAS.
- E. Merino and M. Ribagorda, J. Org. Chem., 2012, 8, 1071–1090 CAS.
- B. Kulyk, D. Guichaoua, A. Ayadi, A. E. Ghayoury and B. Sahraoui, Dyes Pigm., 2017, 145, 256–262 CrossRef CAS.
- R. Diana, B. Panunzi, R. Shikler, S. Nabha and U. Caruso, Inorg. Chem. Commun., 2019, 104, 186–189 CrossRef CAS.
- S. Dutta, S. M. Peng and S. Bhattacharya, J. Chem. Soc., Dalton Trans., 2000, 4623–4627 RSC.
- S. Halder, R. Acharyya, S. Peng, G. Lee, M. G. B. Drew and S. Bhattacharya, Inorg. Chem., 2006, 45, 9654–9663 CrossRef CAS.
- E. M. M. Tan, S. Amirjalayer, S. Smolarek, A. Vdovin, F. Zerbetto and W. J. Buma, Nat. Commun., 2015, 6, 5860–5866 CrossRef.
- H. M. D. Bandara and S. C. Burdette, Chem. Soc. Rev., 2012, 41, 1809–1825 RSC.
- J. Vapaavuori, C. G. Bazuin and A. Priimagi, J. Mater. Chem. C, 2018, 8, 2168–2188 RSC.
- L. H. Urner, B. N. S. Thota, O. Nachtigall, S. Warnke, G. V. Helden, R. Haag and K. Pagel, Chem. Commun., 2015, 51, 8801–8804 RSC.
- Y. Yang, R. P. Hughes and I. Aprahamian, J. Am. Chem. Soc., 2012, 134, 15221–15224 CrossRef CAS.
- S. Chen, L. Bao, E. Ou, C. Peng, W. Wang and W. A. Xu, Nanoscale, 2015, 7, 19673–19686 RSC.
- Y. Deng, Y. Liu, Y. Qian, W. Zhang and X. Qiu, ACS Sustainable Chem. Eng., 2015, 6, 1111–1116 CrossRef.
- D. D. Perrin, W. L. F. Armango and D. R. Perrin, Purification of Laboratory Chemicals, Pergamon: Oxford, UK, 1986 Search PubMed.
- G. M. Sheldrick, SHELXL-97: Program for X-rayCrystal Structure Refinement, Gottingen University, Gottingen, Germany, 1997 Search PubMed.
- A. L. Spek, Acta Crystallogr., Sect. A: Found. Crystallogr., 1990, 46, 31–34 Search PubMed.
- M. J. Frisch, G. W. Trucks, H. B. Schlegel, G. E. Scuseria, M. A. Robb, J. R. Cheeseman, G. Scalmani, V. Barone, B. Mennucci, G. A. Petersson, H. Nakatsuji, M. Caricato, X. Li, H. P. Hratchian, A. F. Izmaylov, J. Bloino, G. Zheng, J. L. Sonnenberg, M. Hada, M. Ehara, K. Toyota, R. Fukuda, J. Hasegawa, M. Ishida, T. Nakajima, Y. Honda, O. Kitao, H. Nakai, T. Vreven, J. A. Montgomery, Jr., J. E. Peralta, F. Ogliaro, M. Bearpark, J. J. Heyd, E. Brothers, K. N. Kudin, V. N. Staroverov, R. Kobayashi, J. Normand, K. Raghavachari, A. Rendell, J. C. Burant, S. S. Iyengar, J. Tomasi, M. Cossi, N. Rega, J. M. Millam, M. Klene, J. E. Knox, J. B. Cross, V. Bakken, C. Adamo, J. Jaramillo, R. Gomperts, R. E. Stratmann, O. Yazyev, A. J. Austin, R. Cammi, C. Pomelli, J. W. Ochterski, R. L. Martin, K. Morokuma, V. G. Zakrzewski, A. Voth, P. Salvador, J. J. Dannenberg, S. Dapprich, A. D. Daniels, Ö. Farkas, J. B. Foresman, J. V. Ortiz, J. Cioslowski and D. J. Fox, Gaussian 09, revision A.1, Gaussian, Inc., Wallingford, CT, 2009 Search PubMed.
- W. Kohn and L. Sham, Phys. Rev., 1965, 140, 1133–1138 CrossRef.
- A. D. Becke, J. Chem. Phys., 1992, 97, 9173–9177 CrossRef CAS.
- R. Ditchfield, W. J. Hehre and J. A. Pople, J. Chem. Phys., 1971, 54, 724–728 CrossRef CAS.
- P. C. Hariharan and J. A. Pople, Mol. Phys., 1974, 27, 209–214 CrossRef CAS.
- P. C. Hariharan and J. A. Pople, Theor. Chim. Acta, 1973, 28, 213–222 CrossRef CAS.
- M. M. Francl, W. J. Pietro, W. J. Hehre, J. S. Binkley, M. S. Gordon, D. J. DeFrees and J. A. Pople, J. Chem. Phys., 1982, 77, 3654–3665 CrossRef CAS.
- V. A. Rassolov, J. A. Pople, M. A. Ratner and T. L. Windus, J. Chem. Phys., 1998, 109, 1223–1229 CrossRef CAS.
- P. J. Hay and W. R. Wadt, J. Chem. Phys., 1985, 82, 299–310 CrossRef CAS.
- A. Kumar, R. S. Singh, A. Kumar, A. Ali, A. Biswas and D. S. Pandey, Chem. – Eur. J., 2016, 22, 13799–13804 CrossRef CAS.
- R. P. Paitandi, R. S. Singh, B. K. Dwivedi, V. D. Singh and D. S. Pandey, Dalton Trans., 2018, 47, 3785–3795 RSC.
- R. Pandey, P. Kumar, A. K. Singh, M. Shahid, P. Li, S. K. Singh, Q. Xu, A. Misra and D. S. Pandey, Inorg. Chem., 2011, 50, 3189–3197 CrossRef CAS.
- H. Kandori, M. Belenky and J. Herzfeld, Biochemistry, 2002, 41, 6026–6031 CrossRef CAS.
- H. M. D. Bandara and S. C. Burdette, Chem. Soc. Rev., 2012, 41, 1809–1825 RSC.
- M. Đkiz, E. Đspir, E. Aytar, S. Karabuğa, M. Aslantaş, Ö. Çelik and M. Ulusoy, New J. Chem., 2015, 39, 7786–7796 RSC.
- X. Cao, Y. Li, Y. Yu, S. Fu, A. Gao and X. A. Chang, Nanoscale, 2019, 11, 10911–10920 RSC.
- P. Singh, A. Baheti and K. R. J. Thomas, J. Org. Chem., 2011, 15, 6134–6145 CrossRef.
- G. Shen, F. Gou, J. Cheng, X. Zhang, X. Zhou and H. Xiang, RSC Adv., 2017, 7, 40640–40649 RSC.
- C. Sravani and A. Sivaramakrishna, ChemistrySelect, 2017, 2, 5688–5694 CrossRef CAS.
- Y. Chen, B. Bai, Q. Chai, M. Zhang, J. Wei, H. Wang and M. A. Li, Soft Matter, 2019, 15, 6690–6695 RSC.
- P. Smitha and S. K. Asha, J. Phys. Chem. B, 2007, 111, 6364–6373 CrossRef CAS.
- M. Wang, L. Qian, Y. Guo, H. Wu, M. Liu, W. Gao, G. Li, J. Ding and X. Huang, Dyes Pigm., 2019, 160, 378–385 CrossRef CAS.
- K. Yamaguchi, S. Kume, K. Namiki, M. Murata, N. Tamai and H. Nishihara, Inorg. Chem., 2005, 44, 9056–9067 CrossRef CAS.
- G. Markiewicz, A. Walczak, F. Perlitius, M. Piasecka, J. M. Harrowfield and A. R. Stefankiewicz, Dalton Trans., 2018, 47, 14254–14262 RSC.
- A. A. Beharry and G. A. Woolley, Chem. Soc. Rev., 2011, 40, 4422–4437 RSC.
Footnote |
| † Electronic supplementary information (ESI) available: Characterization data, UV/vis and fluorescence spectra related to this work, and crystal data file in CIF format. CCDC 1974291 and 1974292 for complexes C1 and C2 respectively. For ESI and crystallographic data in CIF or other electronic format see DOI: 10.1039/d0nj03401k |
| This journal is © The Royal Society of Chemistry and the Centre National de la Recherche Scientifique 2021 |

