Fabrication of a novel ternary heterojunction composite Ag2MoO4/Ag2S/MoS2 with significantly enhanced photocatalytic performance†
Luqiu
Li
a,
Dongguang
Yin
 *a,
Linlin
Deng
a,
Songtao
Xiao
*b,
Yinggen
Ouyan
*b,
Kyu Kyu
Khaing
a,
Xiandi
Guo
a,
Jun
Wang
a and
Zhaoyue
Luo
a
aSchool of Environmental and Chemical Engineering, Shanghai University, Shanghai, 200444, China. E-mail: ydg@shu.edu.cn
bChina Institute of Atomic Energy, P. O. Box 275-26, Beijing, 102413, China
First published on 18th November 2020
Abstract
In this work, a novel ternary heterojunction composite Ag2MoO4/Ag2S/MoS2 was successfully fabricated via a facile two-step method for the first time. The results of the photocatalytic experiments toward degradation of RhB and TC showed that the as-prepared ternary composite exhibited outstanding catalytic efficiency. Compared to the photocatalytic degradation rate for Ag2MoO4 and Ag2MoO4/Ag2S, the rate for RhB was 5 and 2 times higher and for TC was 12 and 2 times higher, respectively. The significantly enhanced catalytic efficiency can be ascribed to the formation of a ternary heterojunction with well-matched band positions, which facilitates the charge mobility and transfer, restrains the recombination of charge carriers, and increases light absorption and specific surface area. This study reveals that the photocatalytic performance of the fabricated ternary heterojunction is superior to that of a binary heterojunction, and artful integration of semiconductors to form a ternary heterojunction is an effective strategy to remarkably improve the photocatalytic performance of semiconductors. The as-prepared products present a potential application for environmental remediation.
1. Introduction
Recently, molybdate matrix materials have caught wide attention due to their vast applications in wide fields such as antibacterial materials,1–3 photocatalysis,4–8 photoluminescence,9–12 lasers,13–15 and up-conversion.16,17 As a typical molybdate matrix material, silver molybdate (Ag2MoO4) has been widely studied in many different areas owing to its excellent properties such as high electrical conductivity,18,19 excellent antimicrobial activity,20,21 and environmentally friendly nature.22 However, due to its wide energy band (Eg = 3.0 eV) with narrow sunlight absorption and fast recombination of charge carriers, its application in photocatalysis is limited.23 There have been numerous attempts to improve its photocatalytic activity, such as morphology and structural mediation,24–27 element doping,28 and heterojunction construction.29–31 Among these modification strategies, heterojunction construction has proven to be an effective method to restrain recombination of charge carriers and increase light absorption, resulting in a significant improvement of photocatalytic activity.32–38Ag2S is a narrow bandgap semiconductor (Eg ≈ 1.0 eV) with a broad and strong light absorption in the entire solar spectrum.39 It has received great attention as a promising photocatalyst or photosensitizer for photocatalysis.40 However, the photocatalytic performance of pristine Ag2S is far from meeting the demands of real applications due to its photocorrosion and the fast recombination ratio of photoinduced charge carriers.39 In order to restrain the photocorrosion and recombination of the charge carriers, construction of heterojunctions with wide bandgap semiconductors is an efficient strategy. It can not only restrain the photocorrosion and recombination of the charge carriers for Ag2S, but also modify wide bandgap materials by broadening their light absorption ranges.41,42 For example, Ag3PO4/Ag2S, BiVO4/Ag2S and TiO2/Ag2S have been constructed and they show much improved photocatalytic performances for both Ag2S and wide bandgap semiconductors.43–46
MoS2 is a typical two-dimensional (2D) structure semiconductor with a narrow band gap (1.2–1.9 eV), excellent electrical carrier mobility, high chemical reactivity and good optical properties.47–49 It has been widely investigated as an effective catalyst for H2 evolution and degradation of pollutants. Notably, as an effective co-catalyst for H2 evolution, it can be considered as a promising alternative to the noble metal Pt.50–52 Nevertheless, the high recombination ratio of electron–hole pairs limited its wide application in photocatalysis.53 Various methods have been applied to increase the separation efficiency of charge carriers for MoS2.54,55 Among them, combining with other semiconductors to form a heterojunction has proven to be an effective strategy. For example, MoS2/Ag2S, MoS2/g-C3N4 and MoS2/COF have been reported. The results show that these constructed heterojunctions have highly improved separation efficiency of charge carriers and photocatalytic activity.51,56–58
Although the binary heterojunctions Ag2MoO4/Ag2S and MoS2/Ag2S have been studied and have shown improved photocatalytic performance in contrast to their pristine monomers, their wide application with higher photocatalytic activity is still limited.51,59 Moreover, they still suffer from structural instability issues in aqueous solution.60 Thus, determining how to further improve their photocatalytic performances remains a challenge.
If a molybdate-based binary heterojunction is further integrated into a ternary heterojunction, whether its photocatalytic performance can be improved is worth studying. Interestingly, previous studies revealed that the photocatalytic performances of some ternary heterojunctions were superior to that of their binary heterojunctions.53,56 Inspired by this, in the present work, we rationally integrated Ag2MoO4, Ag2S and MoS2 together to form a novel ternary heterojunction photocatalyst by a facile two-step method. The assembled composite, consisting of rod-like Ag2MoO4, nanoparticle-like Ag2S and flower-like MoS2, exhibited an outstanding photocatalytic activity for degradation of rhodamine B (RhB) and tetracycline (TC) under simulated sunlight irradiation. The greatly enhanced photocatalytic activity compared with the pristine monomers, binary composites, and previous reported molybdate-based and sulfide-based catalysts,30,42 can be ascribed to the rationally assembled ternary heterojunction with intimate interface contact and well-matched energy bandgaps, which not only promote the transfer and separation of the charge carriers, but also increase light absorption and specific surface area. To the best of our knowledge, this is the first time the ternary heterojunction composite Ag2MoO4/Ag2S/MoS2 has been fabricated and its photocatalytic performances have been studied in detail. The constructed ternary heterojunction exhibits advantages in photocatalytic performance, implying its potential application in environmental protection and energy conversion fields. This work provides a new strategy to highly improve photocatalytic performance of metal molybdate and sulfide for environmental remediation and energy conversion.
2. Experimental
2.1 Materials
Silver nitrate (AgNO3), ammonium molybdate tetrahydrate ((NH4)6Mo7O24·4H2O), thioacetamide (TAA), thiourea (CN2H4S), polyvinyl pyrrolidone (PVP, k-30), rhodamine B (RhB), methylene blue trihydrate (MB), polyvinylidene fluoride (PVDF), sodium sulfate (Na2SO4), p-benzoquinone (BQ), triethanolamine (TEOA), and isopropanol (IPA) were obtained from Sinopharm Chemical Reagent Corp. (P.R. China). Milli-Q water was used in all of the experiments.2.2 Synthesis of flower-like MoS2
Flower-like MoS2 was synthesized by a facile hydrothermal method.51 In a typical experiment, (NH4)6Mo7O24·4H2O (0.210 g) and CN2H4S (0.456 g) were dissolved in water (30 mL) with magnetic stirring for 10 min. Then, PVP (0.1 g) was slowly added into the above solution with stirring for 20 min. A clear solution was obtained, which was transferred into a 50 mL Teflon lined stainless steel autoclave, heated to 200 °C in an oven and maintained at this temperature for 10 h. After the autoclave was cooled down to room temperature naturally, the resulting product was collected by centrifugation and washed with water and ethanol respectively several times. Finally, the obtained sample was dried at 60 °C overnight.2.3 Synthesis of the Ag2MoO4/Ag2S/MoS2 ternary composite
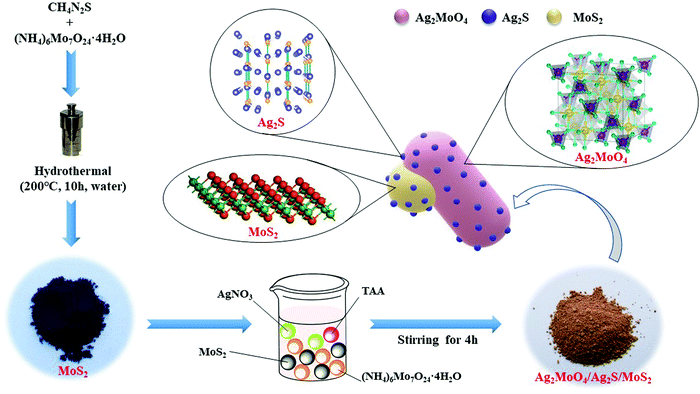
As shown in Scheme 1, the Ag2MoO4/Ag2S/MoS2 ternary composite was prepared by a one-pot approach with two steps. In a typical procedure, a specific amount of MoS2, AgNO3 (0.5096 g) and PVP (0.5 g) were dispersed in 30 mL water with sonication for 20 min. Then, (NH4)6Mo7O24·4H2O (0.2648 g) in 20 ml water and TAA (5.6 mg) in 5 ml water were added to the above solution, respectively. The solution was magnetically stirred for 4 h. The resulting precipitate was washed several times with water and ethanol, respectively. Finally, the obtained product was dried at 60 °C overnight (Scheme 1).The binary composite Ag2MoO4/Ag2S was prepared using the same procedure except for the addition of MoS2. The as-prepared Ag2MoO4/Ag2S with different mole ratios of Ag2S (1%, 5% and 8%, respectively) are denoted as Ag2MoO4/Ag2S-X (X = 1, 5, and 8, respectively). Ag2MoO4/Ag2S-5 was used as a representative to be characterized and as a reagent to prepare Ag2MoO4/Ag2S/MoS2. Ag2MoO4/Ag2S/MoS2 with different mole ratios of MoS2 (0.1%, 0.5%, 1%, and 10%, respectively) were denoted as Ag2MoO4/Ag2S-Y (Y = 0.1, 0.5, 1, and 10, respectively). Ag2MoO4/Ag2S/MoS2-0.5 is used as a representative to be characterized.
2.4 Characterizations
The powder X-ray diffraction (XRD) patterns were measured by a Rigaku D/max-2500 X-ray diffractometer using Cu-Kα radiation. The transmission electron microscopy (TEM) measurements were performed on an HT7700 electron microscope (HITACHI, Japan). The scanning electron microscopy (SEM) and the energy dispersive spectroscopy (EDS) were carried out on a Phenom ProX (PHENOM, Netherland). X-ray photoelectron spectra (XPS) were recorded on a Thermo ESCALAB 250XI (ThermoFisher Scientific, America). UV-vis-NIR diffuse reflectance spectra (DRS) were measured on a Cary 5000 spectrophotometer (Agilent, China). N2 adsorption–desorption curves and pore size analysis (BET) were conducted by ASAP2460 (ASAP2020, America). The photoluminescence (PL) spectra were obtained using an FS5 fluorescence spectrophotometer (Edinburgh Instruments, UK) with an excitation wavelength of 280 nm.2.5 Photocatalytic experiments
The photocatalytic experiments were performed on an SGY-IB multifunction photochemical reactor (Nanjing Sidongke Electric Co. Ltd) with a 300 W Xe lamp (PL-X500D) as the light source. In a typical experiment, 10 mg of the photocatalyst was suspended in a quartz cuvette containing 20 mL of RhB aqueous solution (20 mg L−1). The suspension was stirred in the dark for 30 min to establish an adsorption–desorption equilibrium between the photocatalyst and the target contaminants before irradiation. The photoreaction vessels were then exposed to Xe lamp irradiation. At regular time intervals, the photoreacted solutions were analyzed by recording the variation of the absorption band maximum (554 nm) of RhB in the UV-vis spectrum.2.6 Photoelectrochemical and Electrochemical Measurements
The photoelectrochemical properties of Ag2MoO4/Ag2S/MoS2 were studied on a CHI 660E electrochemical workstation using a standard three-electrode system. The working electrode was prepared according to the following procedure. Ag2MoO4/Ag2S/MoS2 (8 mg) was ground in a mixture of N-methyl pyrrolidone (NMP) (300 μL) and polyvinylidene fluoride (PVDF) solution (2.5%, 200 μL) for 30 min to produce a slurry. The as-obtained slurry was spread onto the conductive surface of the ITO glass (10 × 20 mm2) to form a film and dried in a 60 °C oven to obtain the Ag2MoO4/Ag2S/MoS2/FTO working electrode. Na2SO4 solution (0.1 M) was used as the electrolyte, and platinum tablets and a saturated calomel electrode (SCE) served as the counter electrode and the reference electrode, respectively. The photocurrent responses were measured in 0.1 M Na2SO4 solution (20 mL) in the presence of O2 (1 atm) at room temperature under the irradiation of a 300 W Xe lamp. Amperometric I–t curves were obtained at a basic 0.0 V (vs. SCE electrode) with light on–off switches of 30 s.61 The Nyquist plots were determined over the frequency range of 100–106 Hz with an ac amplitude of 10 mV at the open circuit.3. Results and discussion
3.1 Characterizations
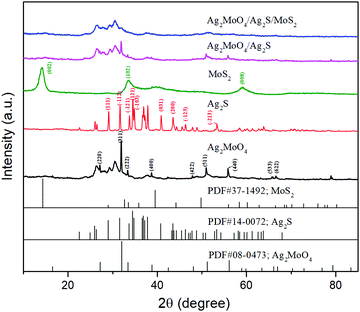
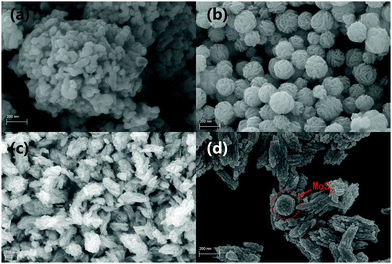
The crystal phases of the as-products were obtained by X-ray diffraction (XRD) analysis. As shown in Fig. 1, bare cubic-phase Ag2MoO4 showed characteristic XRD peaks at 27.06°, 31.84°, 33.29°, 38.63°, 47.83°, 50.91°, 55.80°, 65.70° and 66.56°, corresponding to the (220), (311), (222), (400), (422), (511), (440), (533), and (622) lattice planes (JPCDS No. 08-0473), respectively.5,30,38 The diffraction peaks (2θ) of Ag2S appeared at 2θ values of 28.9°, 31.5°, 34.3°, 36.8°, 37.7°, 40.7°, 43.4°, 46.2° and 53.2°, corresponding to the (111), (−112), (−121), (121), (−103), (031), (200), (−123) and (−213) planes of monoclinic phase Ag2S (JCPDS No. 14-0072), respectively.39,62 The pure MoS2 displayed characteristic XRD peaks at 14.47°, 32.93°, 33.94° and 58.28°, corresponding to the (002), (102) and (008) planes of hexagonal MoS2 (JCPDS No. 37-1492), respectively.51 The composite of Ag2MoO4/Ag2S/MoS2 did not show the peaks of Ag2S and MoS2 due to their low contents and high dispersity. However, as shown in Fig. S1 (ESI), the peaks of Ag2S and MoS2 can be observed with the increase of their contents. This validates that the ternary heterojunction composite is successfully prepared.The morphologies of the samples were analyzed by TEM images (Fig. 2). As shown in Fig. 2, pure Ag2MoO4 and MoS2 exhibit irregular rhombic polyhedron-like and flower-like morphologies, respectively. Ag2S is small sphere nanoparticles anchored on the surface of Ag2MoO4 and MoS2. Fig. 2d shows that the assembled heterojunction composite with an intimate-contact interface does not change the morphologies of its constituent monomers. The high-resolution TEM (HR-TEM) image (Fig. 2e) of Ag2MoO4/Ag2S/MoS2 reveals the highly crystalline nature of the products. The lattice spacings of 0.20 and 0.14 nm correspond to the (102) and (232) monoclinic phase Ag2S nanoparticles. The lattice spacings of 0.239 and 0.27 nm correspond to the (320) crystallographic planes of cubic Ag2MoO4 and the (100) crystallographic planes of hexagonal MoS2, respectively.7,63–65 The results of the SEM images are shown in Fig. 3, which are consistent with the results of the TEM images. The HRTEM and SEM images further confirm the successful synthesis of the ternary heterojunction.
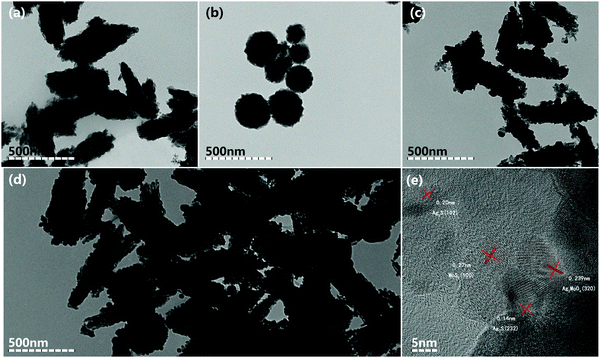 | ||
| Fig. 2 (a–d) The TEM images of Ag2MoO4, MoS2, Ag2MoO4/Ag2S, and Ag2MoO4/Ag2S/MoS2, respectively. (e) The HRTEM images of Ag2MoO4/Ag2S/MoS2. | ||
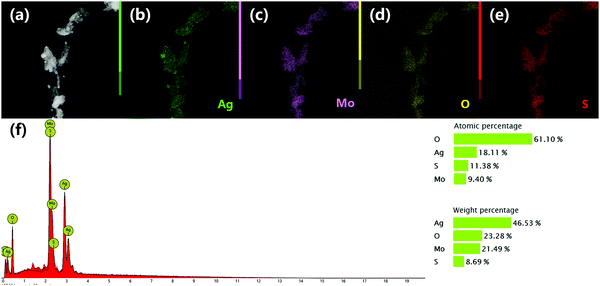
The EDX elemental mapping images and EDX spectrum (Fig. 4) show that all of the elements including Ag, Mo, O and S are detected in the composite, confirming that the exact ingredients are desirably combined to form the composite. The atomic percentages of the elements determined by EDX are consistent with the theory values, demonstrating that the heterojunction composite is successfully prepared.
X-ray photoelectron spectroscopy (XPS) analysis was performed to identify the chemical states and compositions of the prepared products. As shown in Fig. 5a, the XPS survey spectrum shows that the composition of Ag2MoO4/Ag2S/MoS2 presents the peaks of Ag, Mo, O, S and adventitious C. The obtained binding energies of these elements are calibrated by referencing the binding energy of 284.6![[thin space (1/6-em)]](https://www.rsc.org/images/entities/char_2009.gif) eV for C 1s.6 As shown in Fig. 5e, two strong peaks located at binding energies 367.7 eV and 373.8 eV can be ascribed to Ag 3d5/2 and Ag 3d3/2 of Ag+ in Ag2MoO4 and Ag2S, respectively.45 In the Mo 3d spectrum (Fig. 5c), two predominant peaks at 232.5 eV and 235.6 eV are assigned to the Mo 3d5/2 and Mo 3d3/2 of Mo6+ in Ag2MoO4, respectively.34 In addition, two weak peaks at 226.2 eV and 231.8 eV are attributed to the 3d5/2 and 3d3/2 of Mo4+ in MoS2, respectively.66 In the O 1s spectrum (Fig. 5b), the peak at 530.4 eV is indexed to the Mo–O bonds in Ag2MoO4.30 The S 2p spectrum (Fig. 5d) shows two peaks at 161.7 eV and 162.9 eV, which can be ascribed to S 2p3/2 and S 2p1/2, respectively.67,68
eV for C 1s.6 As shown in Fig. 5e, two strong peaks located at binding energies 367.7 eV and 373.8 eV can be ascribed to Ag 3d5/2 and Ag 3d3/2 of Ag+ in Ag2MoO4 and Ag2S, respectively.45 In the Mo 3d spectrum (Fig. 5c), two predominant peaks at 232.5 eV and 235.6 eV are assigned to the Mo 3d5/2 and Mo 3d3/2 of Mo6+ in Ag2MoO4, respectively.34 In addition, two weak peaks at 226.2 eV and 231.8 eV are attributed to the 3d5/2 and 3d3/2 of Mo4+ in MoS2, respectively.66 In the O 1s spectrum (Fig. 5b), the peak at 530.4 eV is indexed to the Mo–O bonds in Ag2MoO4.30 The S 2p spectrum (Fig. 5d) shows two peaks at 161.7 eV and 162.9 eV, which can be ascribed to S 2p3/2 and S 2p1/2, respectively.67,68
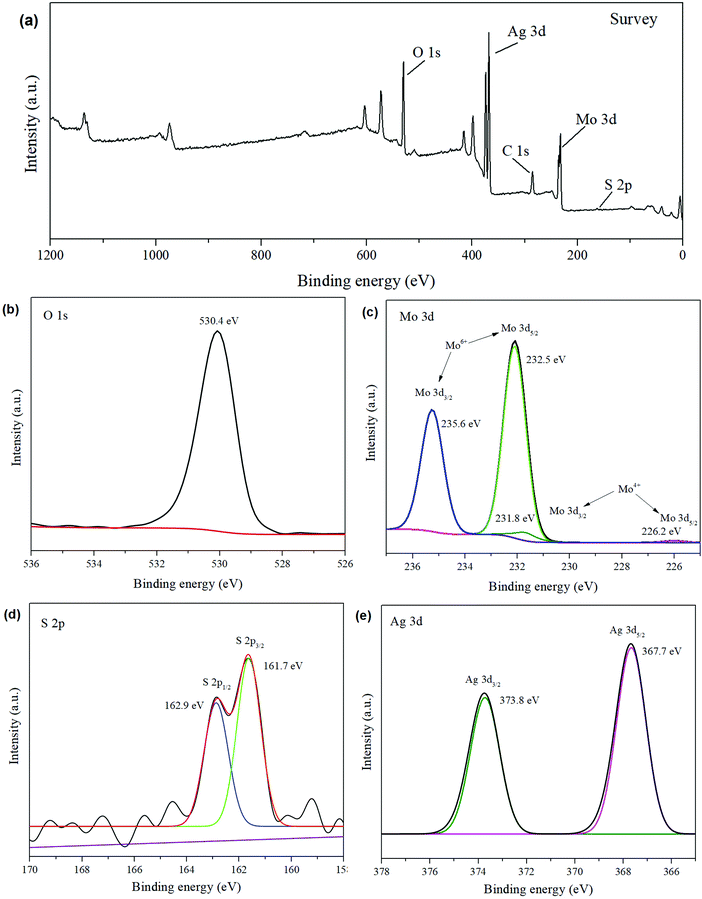 | ||
| Fig. 5 XPS spectra of (a) the whole spectrum, (b) O 1s, (c) Mo 3d, (d) S 2p, and (e) Ag 3d spectra for the Ag2MoO4/Ag2S/MoS2. | ||
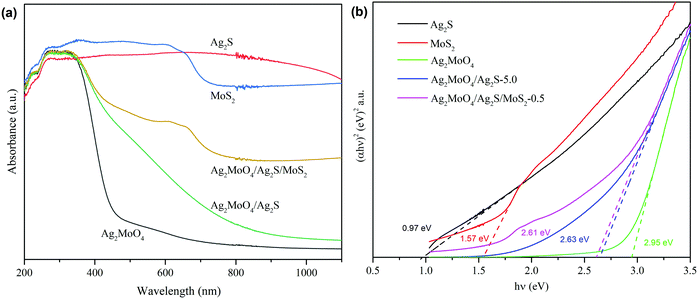
The light absorption properties of the samples were measured by the UV-vis diffuse reflectance spectra. As shown in Fig. 6a, both Ag2S and MoS2 exhibit a strong and full light absorption from 200 to 1100 nm. The pure Ag2MoO4 displays an absorption edge of 446 nm with low absorption at the visible region. When the Ag2MoO4 is coupled with Ag2S to form a binary heterojunction or further coupled with MoS2 to form a ternary heterojunction, its absorption edge has a remarkable red-shift with an obvious enhanced light absorption toward visible light. Moreover, in contrast to the binary heterojunction, the ternary heterojunction displays a bigger red-shift and a stronger light absorption. The red-shift of the absorption edge and increase in light absorption intensity can contribute to the enhancement of the photocatalytic activity of the catalysts.
The optical band gap energy (Eg) for the semiconductor catalyst can be calculated from the Tauc plots using the formula:
| αhv = A(hv − Eg)n/2 | (1) |
In which α, h, v, A and Eg represent the absorption coefficient, Planck's constant, light frequency, proportionality, and band gap energy, respectively. n equals 1 or 4, depending on whether the optical transition is direct or indirect, and n is 4![[thin space (1/6-em)]](https://www.rsc.org/images/entities/char_2009.gif) herein.7,49,69 Thus, the Eg values for Ag2MoO4, Ag2S, MoS2, Ag2MoO4/Ag2S-5.0 and Ag2MoO4/Ag2S/MoS2-0.5 are calculated to be 2.95, 0.97, 1.57, 2.63 and 2.61 eV, respectively (Fig. 6b). In contrast to bare Ag2MoO4, the band gap energies for the binary and ternary composites show an obvious decrease. Moreover, the band gap energy for the ternary composite is lower than that of the binary composite. The decrease of band gap energy caused by the formation heterojunction is consistent with the enhanced light absorption.
herein.7,49,69 Thus, the Eg values for Ag2MoO4, Ag2S, MoS2, Ag2MoO4/Ag2S-5.0 and Ag2MoO4/Ag2S/MoS2-0.5 are calculated to be 2.95, 0.97, 1.57, 2.63 and 2.61 eV, respectively (Fig. 6b). In contrast to bare Ag2MoO4, the band gap energies for the binary and ternary composites show an obvious decrease. Moreover, the band gap energy for the ternary composite is lower than that of the binary composite. The decrease of band gap energy caused by the formation heterojunction is consistent with the enhanced light absorption.
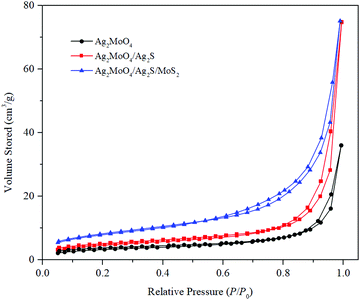
The surface areas and porous structures of the samples were measured by N2 adsorption–desorption experiments (Fig. 7). As shown in Fig. 7, all of the samples exhibit type IV isotherms with hysteresis loops, suggesting the mesoporous structures of the materials. The Brunauer–Emmett–Teller surface areas (SBET) were calculated to be 13.35, 18.35, and 30.19 m2 g−1 for Ag2MoO4, Ag2MoO4/Ag2S and Ag2MoO4/Ag2S/MoS2, respectively. It is clear that the formation of the heterojunction can increase SBET and the ternary heterojunction has the biggest SBET and pore volume (Table 1). The increased SBET and pore volume can offer more actives sites, which is favorable for the reactants’ adsorption and contributes to the enhancement of photocatalytic activity for the catalysts.
| Samples | Surface area (m2 g−1) | Average pore size (nm) | Pore volume (cm3 g−1) |
|---|---|---|---|
| Ag2MoO4 | 13.35 | 16.71 | 0.0558 |
| Ag2MoO4/Ag2S | 18.35 | 25.27 | 0.1159 |
| Ag2MoO4/Ag2S/MoS2 | 30.19 | 15.41 | 0.1163 |
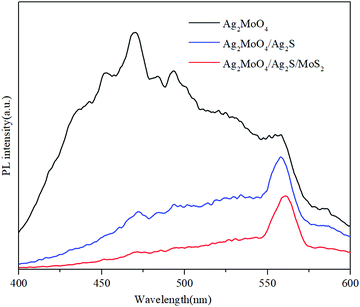
The photoluminescence (PL) spectra were measured to determine the recombination rate of the photo-induced charge carriers. As shown in Fig. 8, the PL intensities of Ag2MoO4/Ag2S and Ag2MoO4/Ag2S/MoS2 are much weaker than that of bare Ag2MoO4, indicating a great decrease of the recombination rate of the charge carriers in the heterojunctions. The Ag2MoO4/Ag2S/MoS2 exhibits the lowest PL intensity, demonstrating that the formed ternary heterojunction has a lower recombination rate of charge carriers in contrast to the binary heterojunction. In addition, the PL peaks shift to a longer wavelength after the formation heterojunction, owing to their interaction.70,71
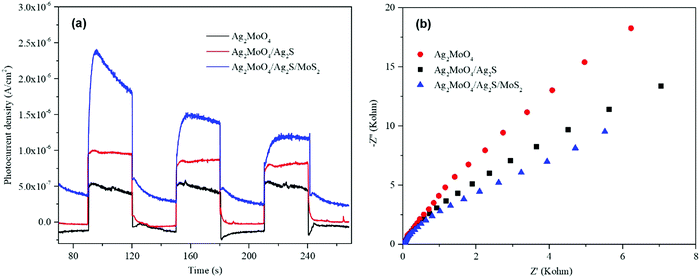
To further study the separation efficiency of the charge carriers, the transient photocurrent response and electrochemical impedance spectroscopy (EIS) were conducted. As shown in Fig. 9a, the photocurrent density of Ag2MoO4/Ag2S is higher than that of pure Ag2MoO4, and Ag2MoO4/Ag2S/MoS2 is higher than that of Ag2MoO4/Ag2S, respectively. This implies that the formation of the heterojunction can promote the separation efficiency of charge carriers, and the formed ternary heterojunction has a higher separation efficiency compared with the binary heterojunction. As shown in Fig. 9b, the Nyquist semicircle radius of the Ag2MoO4/Ag2S is smaller than that of the bare Ag2MoO4, indicating its lower interface charge transport resistance. Ag2MoO4/Ag2S/MoS2 displays the smallest EIS radius, suggesting its lowest resistance for charge transport. All of the results of the PL, photocurrent response and EIS are consistent, which demonstrates that the formation of the Ag2MoO4/Ag2S/MoS2 ternary heterojunction is the most effective strategy to improve transfer and separation and inhibit the recombination of the interface charge carriers.
3.2 Photocatalytic Properties
The photocatalytic performances of the prepared products were evaluated through the degradation of RhB and TC. As shown in Fig. 10a, pure Ag2MoO4, Ag2S and MoS2 show poor photocatalytic activities. The removal ratios of RhB within 15 min irradiation are only 42%, 11% and 19% for Ag2MoO4, Ag2S and MoS2, respectively. The composites show higher photocatalytic activities compared with the pristine samples, and Ag2MoO4/Ag2S/MoS2 exhibits the most superior photocatalytic performance in all of the samples. The degradation ratios of RhB with 15 min irradiation are 74.8% and 93.9% for Ag2MoO4/Ag2S and Ag2MoO4/Ag2S/MoS2, respectively. The apparent rate constants of the catalysts toward the photocatalytic degradation of RhB are calculated to be 0.036 min−1, 0.092 min−1 and 0.189 min−1 for Ag2MoO4, Ag2MoO4/Ag2S and Ag2MoO4/Ag2S/MoS2, respectively (Fig. 10b). Ag2MoO4/Ag2S/MoS2 exhibits the highest rate constant, which is about 2 and 5 times higher than those of Ag2MoO4/Ag2S and Ag2MoO4, respectively.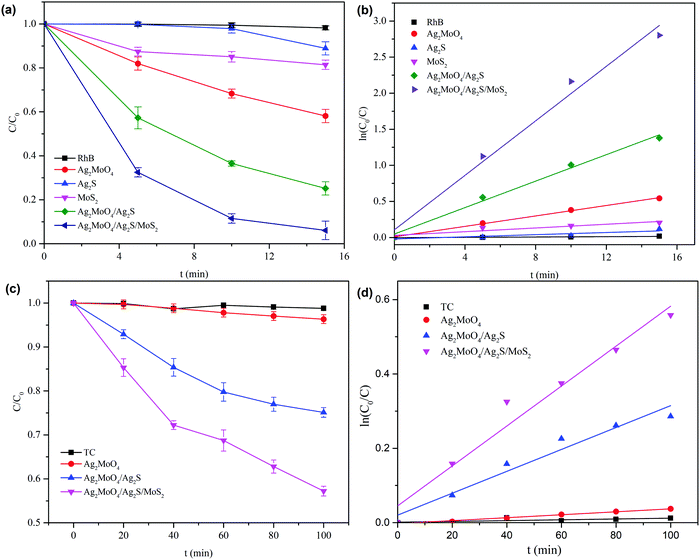 | ||
| Fig. 10 (a and c) Photocatalytic degradation curves for RhB and TC. (b and d) Kinetic fits for the degradation of RhB and TC over various as-prepared samples under simulated sunlight irradiation. | ||
For the photocatalytic degradation of TC, its degradation ratio by Ag2MoO4/Ag2S/MoS2 is 42.8% after 100 min irradiation, while it is only 3.7% and 24.9% for pure Ag2MoO4 and Ag2MoO4/Ag2S, respectively (Fig. 10c). The apparent rate constant of the TC degradation for Ag2MoO4/Ag2S/MoS2 is 0.0054 min−1, which is about 13 and 2 times higher than that of pristine Ag2MoO4 and Ag2MoO4/Ag2S, respectively (Fig. 10d).
The better photocatalytic performance of the composites can be ascribed to the formation of heterojunctions, which promote the transfer and separation of the charge carriers and increase light absorption as well as specific surface area. In contrast to Ag2MoO4/Ag2S, Ag2MoO4/Ag2S/MoS2 displays a higher photocatalytic activity. This can be ascribed to the introduction of MoS2, which further improves the transfer of charge carriers and further increases light absorption as well as specific surface area (Fig. 6–9). The influence of the coupled amounts of Ag2S and MoS2 was investigated. As shown in Fig. 10 and Fig. S2 (ESI), the introduction of Ag2S and MoS2 can improve the photocatalytic performance of Ag2MoO4, nevertheless, excessive Ag2S and MoS2 may cause agglomeration, which inhibits the incoming light absorption and the transfer of the charge carriers, resulting in a decrease of photocatalytic efficiency. It was found that the optimized amount of Ag2S and MoS2 in the composite Ag2MoO4/Ag2S/MoS2 is 5% and 0.5% of molar ratio, respectively.
As the specific surface area of Ag2MoO4/Ag2S/MoS2 is larger than that of Ag2MoO4/Ag2S and Ag2MoO4, we conducted a control experiment to distinguish the effect of the surface area and the charge separation and light absorption here. We blocked the surface of the sample by covering it with an inert layer of SiO2. It was found that after covering with a layer of SiO2, the apparent rate constant of the RhB degradation for Ag2MoO4/Ag2S/MoS2 is about 2 times higher than that of Ag2MoO4/Ag2S (Fig. S3, ESI†), which is similar to the result without a covering of SiO2 (Fig. 10b). This indicates that the surface area may not play a crucial role, but the charge separation and light absorption play an essential role in the photocatalytic reactions in this work.
Besides the high photocatalytic efficiency, the stability of the catalyst is another important factor for practical application. Thus, photocatalytic recycling experiments were performed to evaluate the stability of the catalyst Ag2MoO4/Ag2S/MoS2. All the used samples were collected together after each cycle test by centrifugation, washed, and vacuum-dried at 80 °C for 12 h. As shown in Fig. 11, the degradation efficiency of the catalyst does not decrease obviously after 3 cycles, demonstrating that the as-prepared catalyst Ag2MoO4/Ag2S/MoS2 has some stability. However, Fig. 11 shows a small decrease of degradation efficiency after 3 cycles. The reduced degradation efficiency in the cycle experiments may be ascribed to the photocorrosion of Ag2S.41
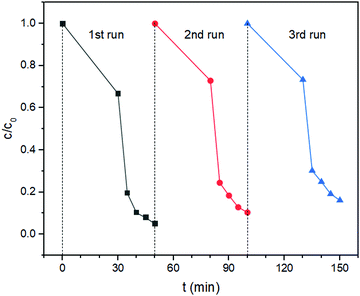 | ||
| Fig. 11 Repeated photocatalytic experiments for the degradation of RhB using Ag2MoO4/Ag2S/MoS2 as the catalyst under simulated sunlight irradiation. | ||
4. Photocatalysis mechanism
For an in-depth investigation of the photodegradation mechanism, capture experiments toward the radicals were carried out. Herein, different scavengers were employed in the RhB photodegradation. Benzoquinone, TEOA, IPA and AgNO3 are applied as the sacrificial agents for superoxide ions (˙O2−), holes (h+), hydroxyl radicals (˙OH) and electrons (e−), respectively. Fig. 12 shows the degradation ratios of RhB in the presence of various trapping agents under simulated sunlight irradiation for 15 min. It reveals that the degradation ratio of RhB does not change in the presence of AgNO3, indicating that the electrons are not the active species. The degradation ratios of RhB reach 80.4% and 91.0% in the presence of BQ and IPA, respectively, which are slightly less than those in the absence of trapping agents (93.9%). These results imply that ˙O2− and ˙OH do not play a crucial role toward the RhB degradation. However, the degradation ratio significantly reduces to 11.0% with the addition of TEOA. This indicates that h+ is the main active species, which plays a crucial part in the degradation of RhB. Therefore, the influence sequence of the active species for RhB degradation is h+ > ˙O2− > ˙OH.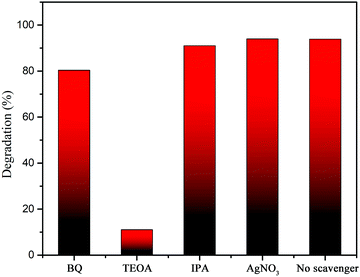 | ||
| Fig. 12 Trapping experiments by using different scavengers in RhB degradation over Ag2MoO4/Ag2S/MoS2. | ||
The CB and VB of the as-prepared photocatalysts can be calculated according to the Mulliken electronegativity theory:69
| EVB = X − Ee + 0.5Eg | (2) |
| ECB = EVB − Eg | (3) |
![[thin space (1/6-em)]](https://www.rsc.org/images/entities/char_2009.gif) eV, 4.96 eV and 5.32 eV, respectively.67,72,73 On the basis of the formula and the obtained band gaps, the EVB and ECB values are calculated to be 2.90 eV and −0.05
eV, 4.96 eV and 5.32 eV, respectively.67,72,73 On the basis of the formula and the obtained band gaps, the EVB and ECB values are calculated to be 2.90 eV and −0.05![[thin space (1/6-em)]](https://www.rsc.org/images/entities/char_2009.gif) eV for Ag2MoO4, 0.95 eV and −0.02
eV for Ag2MoO4, 0.95 eV and −0.02![[thin space (1/6-em)]](https://www.rsc.org/images/entities/char_2009.gif) eV for Ag2S, and 1.61 eV and 0.04
eV for Ag2S, and 1.61 eV and 0.04![[thin space (1/6-em)]](https://www.rsc.org/images/entities/char_2009.gif) eV for MoS2, respectively.
eV for MoS2, respectively.
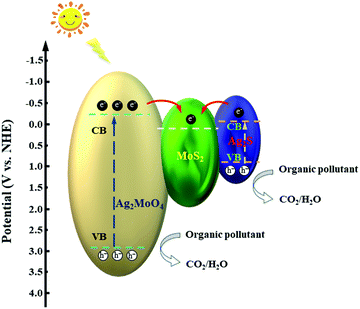
Based on the results of the trapping experiments and the calculated values of the CB and VB for the catalysts, the tentative mechanism for the ternary composite is illustrated in Fig. 13. Ag2MoO4 and Ag2S are excited and engender photoinduced electron–hole pairs under the simulated solar light irradiation. MoS2, in the ternary heterojunction, acts as a good electron acceptor due to its two-dimensional structure and excellent electrical carrier mobility.56,74 Both of the generated electrons on the CB of Ag2MoO4 and Ag2S can rapidly transfer to that of MoS2. The transfer of the electrons between the interfaces of the semiconductors can effectively inhibit the recombination of the electrons and holes. The holes on the VB of Ag2MoO4 and Ag2S can directly oxidize the organic molecules into small molecules, e.g., CO2 and H2O. Meanwhile, the accumulated electrons on the CB of MoS2 can react with the adsorbed O2 to form ˙O2− radicals. These formed ˙O2− radicals and subsequently generated ˙OH radicals can also participate in the photocatalytic degradation reaction. The photocatalytic reaction processes are illustrated below.
| Ag2MoO4 + hν = h+ + e− |
| Ag2S + hν = h+ + e− |
| Ag2MoO4 (e−CB) + Ag2S (e−CB) → MoS2 (e−CB) |
| MoS2 (e−) + O2 = ˙O2− |
| ˙O2− + 2H+ + e− = H2O2 |
| H2O2 + e− = OH− + ˙OH |
| h+ + ˙O2− + ˙OH + Pollutants = CO2 + H2O + degradation intermediate |
5. Conclusions
In summary, a novel ternary heterojunction hybrid Ag2MoO4/Ag2S/MoS2 was successfully fabricated via a facile two-step method. In contrast to the pristine catalysts, the as-prepared composite exhibits superlative photocatalytic performances. The tremendously enhanced photocatalytic performances can be ascribed to the formation of a ternary heterojunction, which effectively inhibits the recombination of the photoinduced charge carriers and increases light absorption and the specific surface area. The empirical findings in this study offer a new strategy to rationally design Ag2MoO4-based photocatalytic systems with significantly promoted photocatalytic performances for application in environmental protection issues.Conflicts of interest
There are no conflicts to declare.Acknowledgements
The authors acknowledge the Innovative research team of high-level local universities in Shanghai, National Natural Science Foundation of China (No. 21271126), Program for Innovative Research Team in University (No. IRT 13078), and National 973 Program (No. 2010CB933901).References
- H. Tang, A. Lu, L. Li, W. Zhou, Z. Xie and L. Zhang, Chem. Eng. J., 2013, 234, 124–131 CrossRef CAS.
- H. Xu, J. Zhang, X. Lv, T. Niu, Y. Zeng, J. Duan and B. Hou, Biofouling, 2019, 35, 719–731 CrossRef CAS.
- C. C. De Foggi, R. C. De Oliveira, M. Assis, M. T. Fabbro, V. R. Mastelaro, C. E. Vergani, L. Gracia, J. Andres, E. Longo and A. L. Machado, Mater. Sci. Eng., C, 2020, 111, 110765 CrossRef CAS.
- M. Abinaya, R. Rajakumaran, S. M. Chen, R. Karthik and V. Muthuraj, ACS Appl. Mater. Interfaces, 2019, 11, 38321–38335 CrossRef CAS.
- R. H. N. Frazao, D. G. Della Rocca, S. M. Amorim, R. A. Peralta, C. D. Moura-Nickel, A. de Noni, Jr. and R. Moreira, Environ. Technol., 2019, 1–12 CrossRef.
- Z. Jiao, J. Zhang, Z. Liu and Z. Ma, J. Photochem. Photobiol., 2019, 371, 67–75 CrossRef CAS.
- X. Liu, W. Li, H. Li, C. Ren, X. Li and Y. Zhao, Appl. Catal., A, 2018, 568, 54–63 CrossRef CAS.
- M. Pandiri, R. Velchuri, R. Gundeboina and V. Muga, J. Photochem. Photobiol., 2018, 360, 231–241 CrossRef CAS.
- J. Liu, Z. Liu, J. Zhang and Z. Ma, Mater. Chem. Phys., 2020, 241, 122406 CrossRef CAS.
- D. Das, S. K. Gupta, A. P. Srivastava, P. Utpalla and K. Sudarshan, New J. Chem., 2020, 44, 10380–10389 RSC.
- P. Dixit, V. Chauhan, P. Kumar and P. C. Pandey, J. Lumin., 2020, 223, 117240 CrossRef CAS.
- J. Zhang, S. Pan, D. Xiang, Z. Chen, Y. Fan, H. Wang, Y. Zhang, J. Pan and H. Chen, Opt. Mater., 2019, 95, 109205 CrossRef CAS.
- K. Thomas, D. Alexander, L. A. Jacob, P. R. Biju, N. V. Unnikrishnan and C. Joseph, Opt. Mater., 2020, 100, 109623 CrossRef CAS.
- Z. A. Mikhaylovskaya, E. S. Buyanova, S. A. Petrova, O. V. Russkikh and I. V. Nikolaenko, Russ. J. Appl. Chem., 2017, 90, 853–861 CrossRef CAS.
- P. M. Kamal, G. Vimal, P. R. Biju, C. Joseph, N. V. Unnikrishnan and M. A. Ittyachen, Opt. Mater., 2015, 42, 237–244 CrossRef CAS.
- K. Thomas, D. Alexander, K. P. Mani, S. Gopi, S. Ajeesh Kumar, P. R. Biju, N. V. Unnikrishnan and C. Joseph, J. Phys. Chem. Solids, 2020, 137, 109212 CrossRef CAS.
- K. Thomas, D. Alexander, S. Sisira, L. A. Jacob, P. R. Biju, N. V. Unnikrishnan, M. A. Ittyachen and C. Joseph, J. Lumin., 2019, 211, 284–291 CrossRef CAS.
- Z. Wiśniewski, R. Wiśniewski, D. Zasada, R. Dziduszko and T. Wilczyńska, J. Phys.: Conf. Ser., 2009, 144, 012084 CrossRef.
- S. A. Suthanthiraraj and Y. D. Premchand, J. Solid State Chem., 2003, 170, 142–153 CrossRef CAS.
- D. Tanasic, A. Rathner, J. P. Kollender, P. Rathner, N. Muller, K. C. Zelenka, A. W. Hassel and C. C. Mardare, Biointerphases, 2017, 12, 05G607 CrossRef.
- J. V. Moura, T. S. Freitas, R. P. Cruz, R. L. Pereira, A. R. Silva, A. T. Santos, J. H. da Silva, C. Luz-Lima, P. T. Freire and H. D. Coutinho, Biomed. Pharmacother., 2017, 86, 242–247 CrossRef CAS.
- H. Wang, Y. Wang, A. Xu, Q. Yang, F. Tao, M. Ma, Z. Song and X. Chen, RSC Adv., 2019, 9, 34804–34813 RSC.
- M. Ghobadifard, S. Mohebbi and P. V. Radovanovic, New J. Chem., 2020, 44, 2858–2867 RSC.
- C. A. Oliveira, D. P. Volanti, A. E. Nogueira, C. A. Zamperini, C. E. Vergani and E. Longo, Mater. Des., 2017, 115, 73–81 CrossRef CAS.
- L. Warmuth, C. Ritschel and C. Feldmann, RSC Adv., 2020, 10, 18377–18383 RSC.
- R. Guo, G. Han, A. Yan, Y. He, N. Su, X. Liu and T. Yi, J. Alloys Compd., 2020, 814, 152255 CrossRef CAS.
- E. A. C. Ferreira, N. F. Andrade Neto, M. R. D. Bomio and F. V. Motta, Ceram. Int., 2019, 45, 11448–11456 CrossRef CAS.
- K. Sudarshan, S. K. Gupta, K. Sonawane and R. M. Kadam, J. Lumin., 2019, 212, 293–299 CrossRef CAS.
- J. Liu, B. Yang, M. Gao, L. You, Y. Zhang, Z. Li, L. Guo, T. Li, P. Chen and M. Liu, New J. Chem., 2020, 44, 3194–3205 RSC.
- Y. Chen, X. Xie, Y. Si, P. Wang and Q. Yan, Appl. Surf. Sci., 2019, 498, 143860 CrossRef CAS.
- M. Wu, H. Lv, T. Wang, Z. Ao, H. Sun, C. Wang, T. An and S. Wang, Catal. Today, 2018, 315, 205–212 CrossRef CAS.
- W. Liu, J. Shen, X. Yang, Q. Liu and H. Tang, Appl. Surf. Sci., 2018, 456, 369–378 CrossRef CAS.
- A. Abulizi, K. Kadeer, L. Zhou, Y. Tursun and T. Dilinuer, J. Taiwan Inst. Chem. Eng., 2018, 88, 243–251 CrossRef CAS.
- J. Zhang and Z. Ma, J. Taiwan Inst. Chem. Eng., 2017, 81, 225–231 CrossRef CAS.
- J. Zhang and Z. Ma, RSC Adv., 2017, 7, 2163–2171 RSC.
- Z. Wang, J. Zhang, J. Lv, K. Dai and C. Liang, Appl. Surf. Sci., 2017, 396, 791–798 CrossRef CAS.
- H. Tang, Y. Fu, S. Chang, S. Xie and G. Tang, Chin. J. Catal., 2017, 38, 337–347 CrossRef CAS.
- Y. Y. Bai, Y. Lu and J. K. Liu, J. Hazard. Mater., 2016, 307, 26–35 CrossRef CAS.
- S. Velmurugan, S. Balu, S. Palanisamy, T. C. K. Yang, V. Velusamy, S.-W. Chen and E. S. I. El-Shafey, Appl. Surf. Sci., 2020, 500, 143991 CrossRef CAS.
- A. Badawi and S. S. Alharthi, Mater. Sci. Semicond. Process., 2020, 116, 105139 CrossRef CAS.
- X. Chen, W. Zhang, L. Zhang, L. Feng, J. Wen, J. Yang, C. Zhang, J. Jiang and H. Wang, Appl. Surf. Sci., 2019, 481, 1335–1343 CrossRef CAS.
- Y. Zhang, C. Liu, G. Zhu, X. Huang, W. Liu, W. Hu, M. Song, W. He, J. Liu and J. Zhai, RSC Adv., 2017, 7, 48176–48183 RSC.
- X. Li, D. Shen, C. Liu, J. Li, Y. Zhou, X. Song, P. Huo, H. Wang and Y. Yan, J. Colloid Interface Sci., 2019, 554, 468–478 CrossRef CAS.
- Z. Wei, T. Xinyue, W. Xiaomeng, D. Benlin, Z. Lili, X. Jiming, F. Yue, S. Ni and Z. Fengxia, Chem. Eng. J., 2019, 361, 1173–1181 CrossRef CAS.
- J. Tian, T. Yan, Z. Qiao, L. Wang, W. Li, J. You and B. Huang, Appl. Catal., B, 2017, 209, 566–578 CrossRef CAS.
- X. Zheng, S. Liu, Y. Gu, S. Das, J. Zhao and Y. Gao, MRS Commun., 2020, 10, 194–199 CrossRef CAS.
- X. Guo, X. Tong, Y. Wang, C. Chen, G. Jin and X.-Y. Guo, J. Mater. Chem. A, 2013, 1, 4657–4661 RSC.
- Q. Gao, C. Giordano and M. Antonietti, Angew. Chem., Int. Ed., 2012, 51, 11740–11744 CrossRef CAS.
- Y. Guan, J. Wu, Q. Liu, M. Gu, Y. Lin, Y. Qi, T. Jia, W. Pan, P. He and Q. Li, Mater. Res. Bull., 2019, 120, 110579 CrossRef CAS.
- S. Zhang, X. Liu, C. Liu, S. Luo, L. Wang, T. Cai, Y. Zeng, J. Yuan, W. Dong, Y. Pei and Y. Liu, ACS Nano, 2018, 12, 751–758 CrossRef CAS.
- Y. Zeng, N. Guo, H. Li, Q. Wang, X. Xu, Y. Yu, X. Han and H. Yu, Sci. Total Environ., 2019, 659, 20–32 CrossRef CAS.
- M. H. Wu, L. Li, Y.-C. Xue, G. Xu, L. Tang, N. Liu and W.y. Huang, Appl. Catal., B, 2018, 228, 103–112 CrossRef CAS.
- J. Kang, C. Jin, Z. Li, M. Wang, Z. Chen and Y. Wang, J. Alloys Compd., 2020, 825, 153975 CrossRef CAS.
- G. Dong, P. Qiu, F. Meng, Y. Wang, B. He, Y. Yu, X. Liu and Z. Li, Chem. Eng. J., 2020, 384, 123330 CrossRef CAS.
- A. Beyhaqi, Q. Zeng, S. Chang, M. Wang, S. M. Taghi Azimi and C. Hu, Chemosphere, 2020, 247, 125784 CrossRef CAS.
- X. Hu, X. Zeng, Y. Liu, J. Lu, S. Yuan, Y. Yin, J. Hu, D. T. McCarthy and X. Zhang, Appl. Catal., B, 2020, 268, 118466 CrossRef CAS.
- K. K. Khaing, D. Yin, Y. Ouyang, S. Xiao, B. Liu, L. Deng, L. Li, X. Guo, J. Wang, J. Liu and Y. Zhang, Inorg. Chem., 2020, 59, 6942–6952 CrossRef CAS.
- T. Chen, D. Yin, F. Zhao, K. K. Kyu, B. Liu, D. Chen, K. Huang, L. Deng and L. Li, New J. Chem., 2019, 43, 463–473 RSC.
- X. Shen, J. Yang, T. Zheng, Q. Wang, H. Zhuang, R. Zheng, S. Shan and S. Li, Sep. Purif. Technol., 2020, 251, 117347 CrossRef CAS.
- S. Zoha, M. Ahmad, S. J. A. Zaidi, M. N. Ashiq, W. Ahmad, T. J. Park and M. A. Basit, J. Photochem. Photobiol., 2020, 394, 112472 CrossRef CAS.
- B. Liu, D. Yin, F. Zhao, K. K. Khaing, T. Chen, C. Wu, L. Deng, L. Li, K. Huang and Y. Zhang, J. Phys. Chem. C, 2019, 123, 4193–4203 CrossRef CAS.
- H. Hu, W. Wei, Z. Jiang, W. Sun, X. Lv and J. Xie, J. Mol. Liq., 2019, 292, 111476 CrossRef CAS.
- S. K. Gahlaut, P. Devi and J. P. Singh, Appl. Surf. Sci., 2020, 528, 147037 CrossRef CAS.
- C. Wang, J. Zhai, H. Jiang, D. Liu and L. Zhang, Solid State Sci., 2019, 98, 106020 CrossRef CAS.
- M. Wang, P. Ju, W. Li, Y. Zhao and X. Han, Dalton Trans., 2017, 46, 483–490 RSC.
- A. Yoon, J. H. Kim, J. Yoon, Y. Lee and Z. Lee, ACS Appl. Mater. Interfaces, 2020, 12, 22029–22036 CrossRef CAS.
- M. Pang, J. Hu and H. C. Zeng, J. Am. Chem. Soc., 2010, 132, 10771–10785 CrossRef CAS.
- Y. Liu, W. Wang, M. Si and H. Zhang, ChemCatChem, 2019, 11, 1–10 CrossRef CAS.
- L. Cao, K. Xu and R. Wang, Mater. Res. Bull., 2019, 113, 175–181 CrossRef CAS.
- M. S. Nasir, G. Yang, I. Ayub, S. Wang and W. Yan, Appl. Catal., B, 2020, 270, 118900 CrossRef CAS.
- N. Kumaresan, M. M. A. Sinthiya, M. Sarathbavan, K. Ramamurthi, K. Sethuraman and R. R. Babu, Sep. Purif. Technol., 2020, 244, 116356 CrossRef CAS.
- M. Abinaya, R. Rajakumaran, S.-M. Chen, R. Karthik and V. Muthuraj, ACS Appl. Mater. Interfaces, 2019, 11, 38321–38335 CrossRef CAS.
- W. Sheng, Y. Tian, Y. Song, J. Ji and F. Wang, Int. J. Hydrogen Energy, 2019, 44, 19890–19899 CrossRef CAS.
- C. Zhong, W. Weng, X. Liang, D. Gu and W. Xiao, Appl. Surf. Sci., 2020, 507, 145072 CrossRef CAS.
Footnote |
| † Electronic supplementary information (ESI) available. See DOI: 10.1039/d0nj04290k |
| This journal is © The Royal Society of Chemistry and the Centre National de la Recherche Scientifique 2021 |

