 Open Access Article
Exploiting the efficacy of Tyro3 and folate receptors to enhance the delivery of gold nanoparticles into colorectal cancer cells in vitro
Nakul
Patel
 *,
Lucy
Ghali
,
Ivan
Roitt
,
Leonardo Puntoja
Munoz
 and
Richard
Bayford
Department of Science and Technology, Middlesex University, The Burroughs, Hendon, NW4 4BT, London, UK. E-mail: Nakulpatel90@yahoo.com
First published on 15th July 2021
Abstract
Colorectal cancer (CRC) is the fourth most common cancer in the world. Due to its asymptomatic nature, CRC is diagnosed at an advanced stage where the survival rate is <5%. Besides, CRC treatment using chemotherapy, radiotherapy and surgery often causes undesirable side-effects. As such, gold nanoparticles (GNPs) are envisaged in the field for the diagnosis and treatment of CRC. GNPs have unique physical, chemical and electrical properties at the nanoscale which make them suitable for application in biomedicine. However, for GNPs to become clinically effective, their internalisation efficiency in cancer cells must be enhanced. Folate receptor-α (FR) is overexpressed in CRC cells wherein FR helps in the uptake of folic acid within the cells. Tyro3, a novel tyrosine kinase receptor, drives cell proliferation and its overexpression is correlated with poor prognosis in CRC. Their upregulated expression in CRC cells relative to normal cells makes them an ideal target for GNPs using active targeting. Therefore, in this study receptors FR and Tyro3 were simultaneously targeted using specific antibody-coated GNPs in order to enhance the uptake and internalisation of GNPs in CRC cells in vitro. Four different types of coated-GNPs were synthesised GNPs-PEG, GNPs-anti-FR, GNPs-anti-Tyro3 and GNPs-anti-(FR + Tyro3) and incubated (0–50 ng) with three CRC cell lines namely CRL1790, CRL2159 and HCT116. Simultaneous targeting of these receptors by GNPs-anti-(FR + Tyro3) was found to be the most effective in internalisation in CRC cells compared with GNPs targeted singly to FR or Tyro3 (p <0.05). Besides this, results show that Tyro3 mediated similar internalisation efficacy to FR (p <0.05) in CRC cells using ICP-OES.
1 Introduction
Colorectal cancer (CRC) ranks fourth in mortality and morbidity worldwide and is characterised by the formation of malignant neoplasms in the mucosa of the colon and rectum.1,2 In CRC, early diagnosis and treatment is key to treating the disease as CRC remains asymptomatic and develops over the span of 10 years.3 Adjuvant chemo-radiotherapy and surgery are the only alternatives to treating CRC, but due to late diagnosis, not all patients respond to therapeutic regimes properly and, therefore, no one magic bullet can target CRC. Also, toxic side-effects associated with the treatment such as vomiting, diarrhoea, blood and hair loss, proteinuria, etc can have an overwhelming effect on a patient's routine life.4 Additionally, the results of the surgery too are not noteworthy as it relies on radiotherapy and chemotherapy for its success. Hence, the need to develop a personalised tailor-made therapy specific for CRC remains indispensable.5 To that end, nanotechnology is utilised in order to circumvent the above-mentioned drawbacks.Nanotechnology is evolving as a novel area in scientific research and has led to advances in the field of cancer therapy, drug delivery, biological sensors, microbiology, heart disease, etc.6 Gold nanoparticles (GNPs) refer to particles constituted of gold (Au) atoms with sizes ranging between 2 nm and 100 nm that are derived by reducing gold-based compounds such as HAuCl4.7,8 GNPs have a unique physicochemical feature of readily forming thiol and amine bonds as well as intrinsic surface plasmon resonance (SPR), a property which makes them versatile in biological applications. SPR refers to the collective oscillation of electrons by absorbing photons from light at a specific wavelength and emitting the energy dependent upon the size and shape of the GNPs. SPR of GNPs can be tuned to resonate with the specific wavelength of light in the visible or infrared spectrum. Hence, monitoring the therapy, imaging, drug delivery and biomedical imaging using a contrast agent, diagnosing and hyperthermia therapy could be possible.5 Additionally, GNPs are shown to be non-toxic to the cells as the core of GNPs is inert.9
GNPs have a wide spectrum of applications in genomics, biosensors, immunoassays, clinical studies, drug discovery, detection, imaging and microbiology.6 Amongst all these, their application in cancer diagnosis and therapy is most promising.10 GNPs can be delivered by linking molecules that can recognise the proteins/molecules on the CRC cell surface in a process called ‘active targeting’. In contrast, in passive targeting, due to leaky and poorly developed blood vessels with enlarged pores (100–600 nm), GNPs can preferentially accumulate in the tumour.11 Also, with underdeveloped lymphatic vessels, GNPs are improperly drained from the tumour. As such, they target the CRC tumour passively in a process called the enhanced permeability effect (EPR).12 As a result, GNPs (10–200 nm) penetrate the tumour and accumulate prior to reaching the cell cytoplasm.13 Consequently, this results in increased delivery of drugs ferrying GNPs into the tumour.14
Currently, applications of nanomedicine can be hindered by problems of toxicity and delivery.15 Nanomaterials administered in vivo spread throughout the body and can reach off-target sites and damage healthy cells and tissues. Consequently, this lowers their efficacy in reaching the target site leading to non-specific accumulation and unwanted side-effects.16 For GNP application in vivo, they need to reach directly the tumour site to enhance their subsequent uptake by the tumour cells.17 These obstacles must be addressed in order to improve the efficacy of using GNPs for delivery and, therefore, efficient delivery of GNPs which must be attained for their biomedical application such as imaging, detection/diagnosis and therapy.18–20 To overcome these drawbacks and in order to increase the GNP internalisation and delivery efficacy, two different receptors folate receptor-α (FR) and Tyro3 receptor on CRC cells were selected simultaneously for active targeting.
FR is overexpressed in various malignancies such as breast, colon, ovarian, endometrium, kidney, brain and myeloid cells.21 This folate receptor is limited or absent in non-proliferating normal cells which helps to distinguish tumour cells from normal healthy cells.22 FR is a membrane-bound receptor and participates in the transport of folate into the cells.23 FR is present in four different isoforms (α, β, γ and δ) and different tissues express different isoforms. In cancer, folate receptor-α is overexpressed in colon, ovary, breast and head and neck cancers constituting up to 40% in human cancers.24 FR-β is upregulated in brain, liver, thyroid, uterus, stomach, prostate, testis and colon cancers.24 Therefore, due to folate receptor-α's overexpression in different cancers, especially in CRC, we selected it as a targeting moiety.25
Tyro3, together with Axl and Mer, constitutes the TAM receptor family and is a subfamily receptor of tyrosine kinases discovered in 1991.26 In 1993, Tyro3 receptor, also known as Tif, Sky, BYK and Dtk,27 was discovered to have a role in embryonic differentiation.28 In 1995, proteins Gas6/protein S (Pros1) were identified as ligands for these TAM receptors.29 TAM mediates signal transduction through the binding of Gas6/Protein S followed by homodimerisation or heterodimerisation of its receptors and autophosphorylation of the tyrosine residue in the kinase domain.30 Tyro3's oncogenic potential first emerged when murine models were shown to have mammary tumours due to the upregulation of TAM receptors.31 Tyro3 can also be activated in ligand-independent activation when expressed in high concentrations.32 Similar to FR, Tyro3 receptor is also upregulated in various human cancers including CRC and its overexpression is correlated with poor prognosis and advanced tumour stage.33 For example, in a study conducted in CRC patients, it was found that Tyro3 was overexpressed in CRC tumour patients compared with healthy colon mucosa (p <0.0001). It was also shown that overexpression of Tyro3 led to CRC and metastasis in the liver, making Tyro3 a potential target in CRC.30 In another study comparing 76 polyps and 265 pairs of normal and cancer samples, overexpression of Tyro3 was found to greatly enhance cell motility, invasion, anchorage-independent growth and metastatic ability in CRC and induces Endothelial to Mesenchymal Transition (EMT).27 Moreover, no clinical trials so far have been shown to have targeted the Tyro3 receptor, making Tyro3 a novel target in CRC.30,34 Besides CRC, Tyro3 as a novel target was also demonstrated in Hepatocellular Carcinoma (HCC) wherein samples from 55 patients showed two-fold expression of Tyro3 in the cancerous tissue compared to normal tissue.35 Therefore, the aim of the current study was to target FR and Tyro3 receptors simultaneously in order to increase the efficacy of GNP delivery and internalisation in CRC tumour cells. Fig. 1 shows a schematic representation of the entire research.
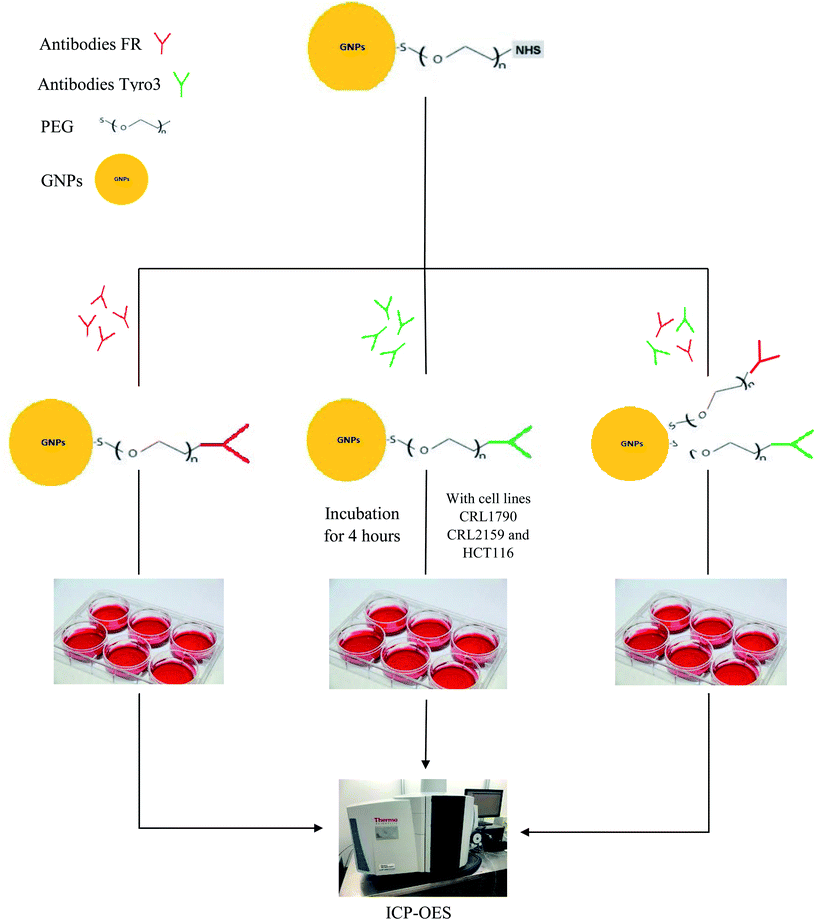 | ||
| Fig. 1 Schematic representation shows the synthesis of FR and Tyro3 antibody-coated GNPs, incubation with all three cell lines and subsequent assessment via ICP-OES. | ||
2 Results and discussion
2.1 Gold nanoparticle characterisation by UV-vis spectroscopy and DLS
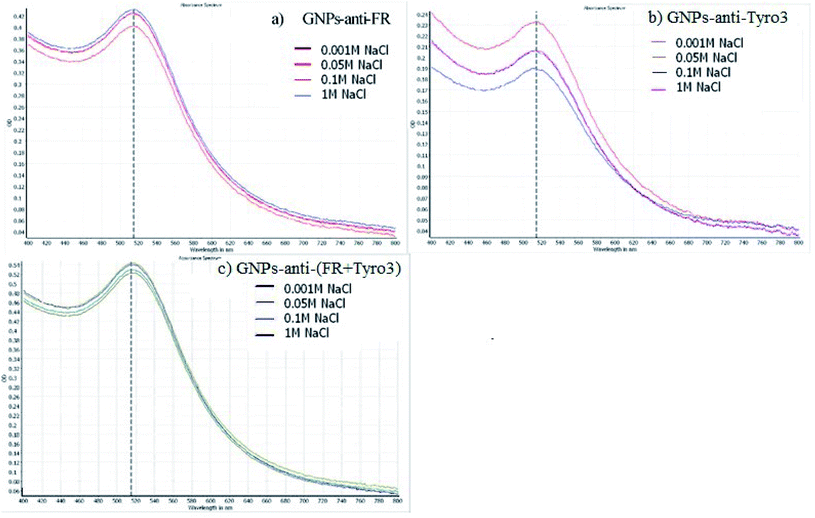
Ultraviolet visible (UV-vis) spectroscopy is a vital technique in determining the GNP size distribution, concentration and aggregation levels. Hence, UV-vis spectra were used to determine the characteristics and attachment of the FR and Tyro3 antibodies to the GNPs. For GNPs-PEG, the SPR peak was found at 513 nm but after conjugation the peak shifted towards a longer wavelength.36 Newly synthesised GNPs-anti-FR and GNPs-anti-Tyro3 had respective λmax at 517 nm whereas for GNPs-anti-(FR + Tyro3) the λmax was at 516 nm (Fig. 2). These newly formed SPR peaks were associated with red shifts (4 nm and 3 nm) due to the change in the local refractive index indicating the addition of antibody layers around the GNPs.37Table 1 provides an overview of all 4 GNPs and their respective UV-vis spectra. A similar red-shift (<10 nm) was also reported when the Epidermal Growth Factor Receptor (C225) antibody was conjugated to GNPs with an alkane-thiol linker.38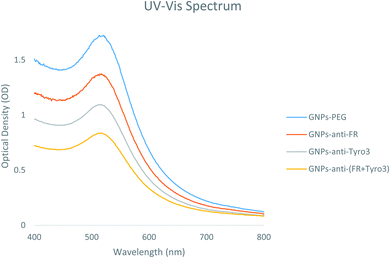 | ||
| Fig. 2 UV-vis spectra of all 4 GNP constructs GNPs-PEG, GNPs-anti-FR, GNPs-anti-Tyro3 and GNPs-anti-(FR + Tyro3). | ||
| Types of GNP constructs | UV-vis spectrophotometry | DLS (nm) | Zeta Potential (mV) | PDI |
|---|---|---|---|---|
| GNPs-PEG | 513 nm | 22.97 nm ± 2.1 | −18.7 mV ± 1.5 | 0.204 |
| GNPs-anti-FR | 517 nm | 30.78 nm ± 1.8 | −1.86 mV ± 2.3 | 0.231 |
| GNPs-anti-Tyro3 | 517 nm | 30.96 nm ± 2.2 | −2.32 mV ± 1.9 | 0.142 |
| GNPs-anti-(FR + Tyro3) | 516 nm | 31.36 nm ± 1.6 | −0.55 mV ± 2.6 | 0.148 |
The stability of GNPs was also determined via inducing aggregation. Aggregation of GNPs will induce a red shift towards the infrared region of the spectrum and broadening of the SPR peak.39 As such, GNPs-anti-FR (Fig. 3a), GNPs-anti-Tyro3 (Fig. 3b) and GNPs-anti-(FR + Tyro3) (Fig. 3c) were tested with different concentrations of NaCl for 1 hour to determine the stability in the solution. For all three types of GNP constructs, no observable red shift or broadening of the peaks was seen indicating that all three constructs were highly stable.
Dynamic light scattering (DLS) is also commonly used to determine the hydrodynamic size and zeta potential of the nanoparticles in the suspension in the nanometre range. The size of GNPs-PEG was measured to be 22.97 nm (Fig. 4a). However, after the addition of the FR and Tyro3 antibodies, the overall size of the GNPs-anti-FR and GNPs-anti-Tyro3 increased to 30.78 nm and 30.96 nm, respectively (Fig. 4b and c). The molecular mass of the antibodies used is ∼150 kDa and their corresponding size is around 7–10 nm.40 Therefore, the overall increase in the GNP hydrodynamic size of approximately 8–10 nm is attributed to the attachment of the antibodies to GNPs. Similarly, the hydrodynamic diameter of GNPs-anti-(FR + Tyro3) was 31.36 nm (Fig. 4d) confirming the attachment of both FR and Tyro3 antibodies to GNPs. Additionally, the polydispersity index (PDI) for all types of GNPs was <0.3 indicating a narrow monodisperse GNP suspension (Fig. 4). The zeta potential of GNPs in the suspension was also measured and as a result all GNPs conferred a net negative charge. GNPs-PEG had an overall negative charge (−18.7 mV). However, once respective antibodies (FR and Tyro3) were conjugated, it changed the overall dielectric state of the nanoparticles lowering the zeta potential values.41 As a result, GNPs-anti-FR, GNPs-anti-Tyro3 and GNPs-anti-(FR + Tyro3) had significantly lower zeta potentials compared to GNPs-PEG (Table 1). Taken together, UV-vis and DLS studies show that GNP conjugates are highly stable, monodisperse and bonded with respective antibodies.
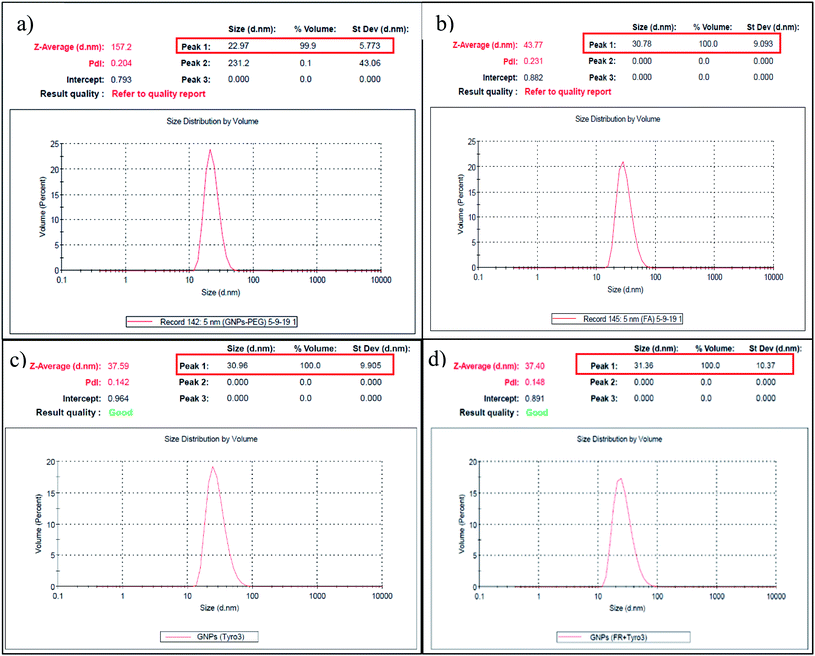 | ||
| Fig. 4 Hydrodynamic size of GNPs is shown in (a)–(d) of GNPs-PEG, GNPs-anti-FR, GNPs-anti-Tyro3 and GNPs-anti-(FR + Tyro3), respectively. PDI <0.03. The corresponding molecular weights are shown in Fig. 6 and 7. | ||
2.2 Bradford assay to quantify antibody attachment
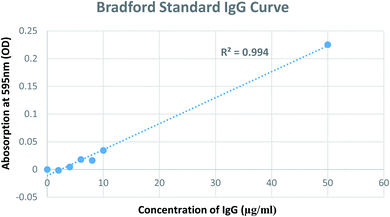
A modified Bradford assay was used to quantify antibody conjugation to GNPs. The assay involves the use of the dye Coomassie Brilliant Blue G-250 for the quantification of proteins. First, the Bradford assay was performed to determine the amount of antibodies in the supernatant obtained after the centrifugation and incubation of GNPs with respective antibodies. A standard solution of IgG was used to generate a calibration curve to quantify the unbound antibodies in the supernatant. Thereafter, the number of antibodies conjugated to GNPs was calculated via the difference between the initial concentration used and concentration found in the supernatant (Fig. 5). Consequently, the number of antibodies (IgG) bound to one GNP was calculated to be ∼7.42Table 2 summarises the calculation of antibody molecules attached to each type of GNP construct. The number of antibodies attached to a single GNP is consistent with that quantified in two separate studies.37,43| Type of gold nanoparticles | Initial amount 200 μg | Supernatant using the Bradford assay | Antibody attached | Antibody coated to one gold nanoparticle |
|---|---|---|---|---|
| GNPs-anti-FR | 200 μg | 1.7 μg | 198.3 μg ± 1.2 | 7.23 ± 0.3 |
| GNPs-anti-Tyro3 | 200 μg | 2.1 μg | 197.9 μg ± 1.4 | 7.19 ± 0.2 |
| GNPs-anti-(FR + Tyro3) | 200 μg | 0.4 μg | 199.6 μg ± 0.9 | 7.26 ± 0.5 |
2.3 Matrix associated laser desorption/ionisation time-of-flight (TOF) mass spectroscopy (MALDI-TOF)
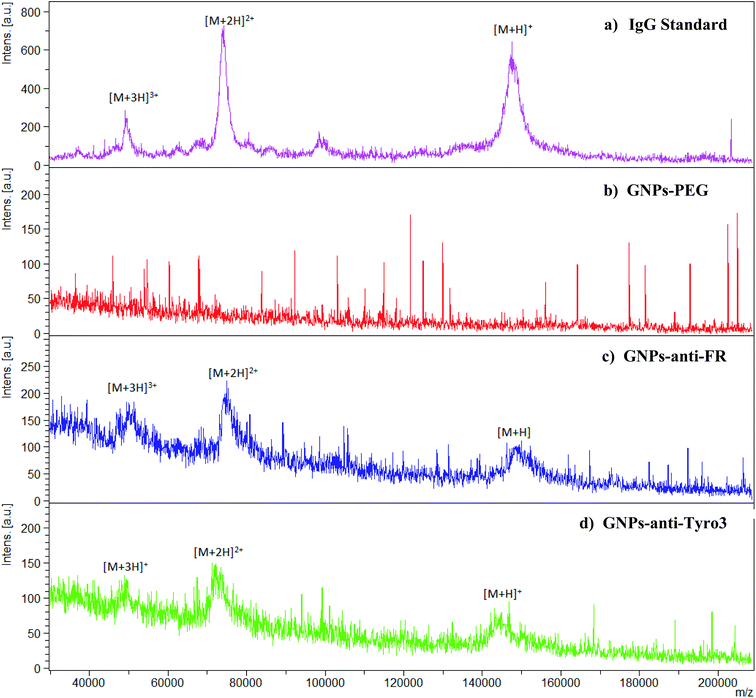
MALDI-TOF was implemented to further confirm the attachment of IgG (anti-FR and anti-Tyro3) to all the antibody-coated GNP constructs. Intensity peaks were confirmed using IgG as the standard. Three intensity peaks were observed [M + H]+, [M + 2H]2+ and [M + 3H]3+ (Fig. 6a) generated from IgG as shown previously.44,45 Out of the three peaks, IgG is mainly denoted by two main peaks [M + H]+ and [M + 2H]2+ corresponding to single protonated (m/z = 148![[thin space (1/6-em)]](https://www.rsc.org/images/entities/char_2009.gif) 286) and double protonated (m/z = 74
286) and double protonated (m/z = 74![[thin space (1/6-em)]](https://www.rsc.org/images/entities/char_2009.gif) 478) IgG molecules.46,47 For all the antibody-coated GNPs (Fig. 6c), (Fig. 6d) and (Fig. 7), similar peaks were also seen which confirmed the attachment of the antibodies to GNPs-PEG (Fig. 6b). As a proof of principle, GNPs-PEG were also analysed using MALDI-TOF and showed no similar IgG peaks in the sample due to the absence of the antibodies. This further confirmed that those peaks were emanating from IgG only and not generated from either the GNPs, polyethyleneglycol chain or the matrix used to analyse the GNPs.
478) IgG molecules.46,47 For all the antibody-coated GNPs (Fig. 6c), (Fig. 6d) and (Fig. 7), similar peaks were also seen which confirmed the attachment of the antibodies to GNPs-PEG (Fig. 6b). As a proof of principle, GNPs-PEG were also analysed using MALDI-TOF and showed no similar IgG peaks in the sample due to the absence of the antibodies. This further confirmed that those peaks were emanating from IgG only and not generated from either the GNPs, polyethyleneglycol chain or the matrix used to analyse the GNPs.
 | ||
| Fig. 7 MALDI-TOF spectrum for GNPs-anti-(FR + Tyro3) also shows all three intensity peaks representative of IgG antibodies. | ||
2.4 FR and Tyro3 expression levels in different cell lines
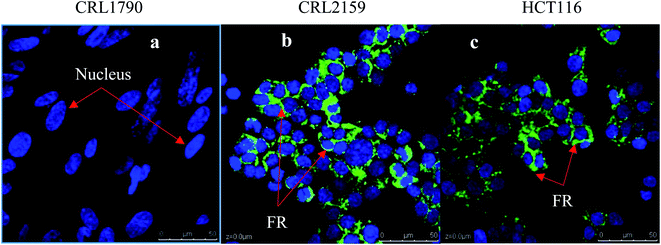
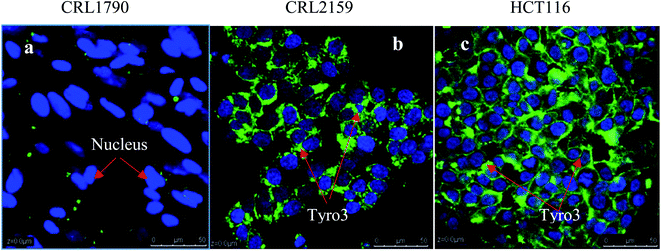
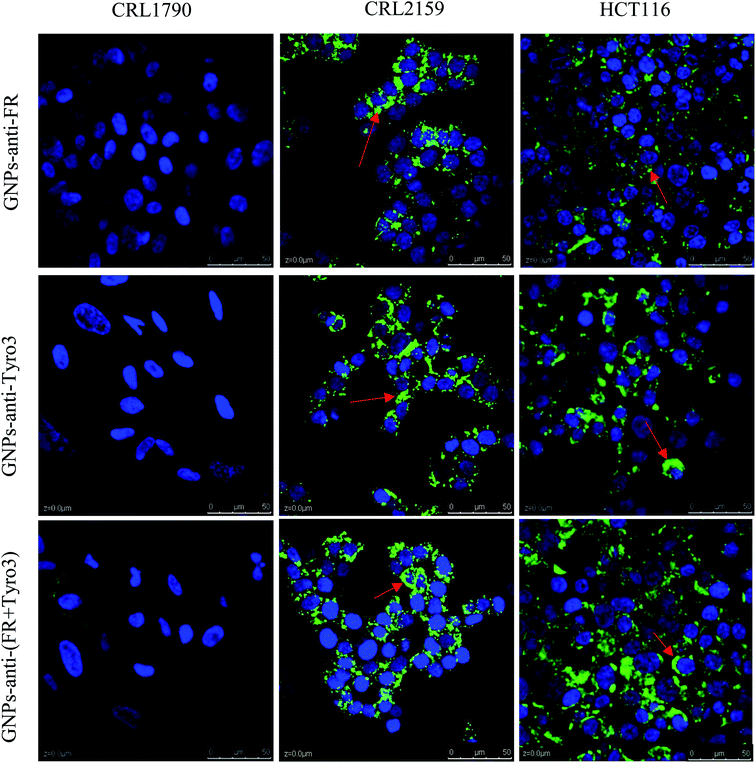
For targeting and testing of GNPs, FR and Tyro3 were assayed for their expression levels in the colon epithelial cell line (CRL1790) vs. CRC cell lines (CRL2159 and HCT116). FR is a membrane bound receptor and was found to be overexpressed in CRL2159 and HCT116 CRC cell lines whereas it was absent in CRL1790 in ICC experiments (Fig. 8). FR is upregulated in many cancers such as brain, kidney, breast, ovarian, and colon.22 Due to the fact that FR is absent or minimally expressed in normal colonic tissue, it makes it a potential target for GNP application in biomedicine.48 Tyro3 is another subtype of tyrosine kinase and a membrane bound receptor along with others such as EGFR, VEGFR, PDGFR, IFF1R and MET.35 Tyro3 had been found to be overexpressed in various cancers including CRC.41 In ICC experiments, its expression patterns too were concomitant with the literature and were not expressed in CRL1790 compared to CRL2159 and HCT116 (Fig. 8).27,30 Thus, FR and Tyro3 receptors are overexpressed in CRC cells compared to colon epithelial cells making them a feasible target for GNPs. Hence, they were used simultaneously to target the cells by exploiting their upregulation in CRC cells in order to increase the efficiency of GNP delivery to the targeted tumour cells (Fig. 9).2.5 Inductively coupled plasma-optical emission spectroscopy (ICP-OES)
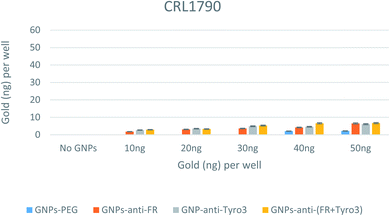
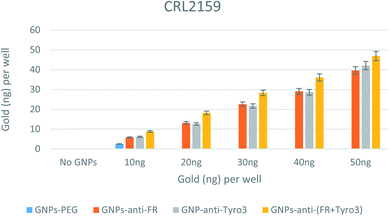
To study the internalisation and efficacy of all GNP constructs, elemental analysis was conducted using the ICP-OES technique. After binding with the receptors on the plasma membrane of the cells, GNPs become internalised via receptor-mediated endocytosis (RME).49 Different amounts of all types of GNPs (0–50 ng) were aliquoted in wells for each of the three cell lines. After 4 hours of incubation, the cells were thoroughly washed, and then digested in aqua regia before being subjected to ICP-OES. CRL1790 has shown the least internalisation with less than 10 ng for all the GNP concentrations (Fig. 10). In CRL1790, uptake of antibody-coated GNPs was greater than that observed for GNPs-PEG alone (p <0.05). An important observation was also made that there was no difference in internalisation in single antibody-coated GNPs (GNPs-anti-FR & GNPs-anti-Tyro3) vs. double antibody-coated GNPs (GNPs-anti-(FR + Tyro3)) (p >0.05). Both of these observations can be attributed to the low number of FR and Tyro3 receptors in CRL1790.In CRL2159, there was an increase in GNP uptake for single antibody-coated GNPs (p <0.05) and double antibody-coated GNPs (p <0.05) compared to GNPs-PEG (Fig. 11). Also, compared to GNPs-PEG, GNPs-anti-FR, GNPs-anti-Tyro3 and GNPs-anti-(FR + Tyro3) had more internalisation for each and every concentration of the incubated GNPs. At 20 ng, GNPs-anti-FR and GNPs-anti-Tyro3 were internalised more than 10 ng in CRL2159 compared to below 10 ng in CRL1790 (p <0.05). This could be explained by the overexpression of FR and Tyro3 receptors in CRL2159, as a result of which there was a two-fold increase in RME and internalisation compared to CRL1790. Additionally, double antibody-coated GNPs were highly efficient in targeting CRL2159 cells compared to single antibody-coated GNPs (p <0.05). Most importantly, no significant difference in internalisation efficiency was observed between FR and Tyro3 targeted single antibody-coated GNPs (p >0.05). This means that GNPs-anti-Tyro3 had the same internalisation capability as GNPs-anti-FR. This observation that the Tyro3 receptor can be equally capable as FR in targeting CRC using GNPs is a novel finding. The graph also demonstrates there was a very low uptake of GNPs-PEG in CRL2159 (Fig. 11) particularly when compared to single and double antibody-coated GNPs.
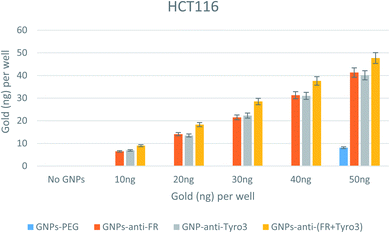
A similar pattern was also seen for the HCT116 colorectal carcinoma cell line (Fig. 12). For every concentration of all single and double-antibody coated GNPs, there was an increased internalisation efficiency compared to GNPs-PEG. However, at 50 ng there was a non-specific uptake that could be explained by the high number of non-targeted GNPs. This set of results also show that HCT116 had a high number of internalised GNPs compared to CRL1790 and CRL2159 which can be attributed to overexpression of FR and Tyro3 receptors and a different method of endocytosis mechanism pertaining to an individual cell line.50 Such results also indicate that double antibody-coated GNPs had a higher internalisation efficiency compared to single antibody-coated GNPs (p <0.05). Moreover, the GNPs-anti-Tyro3 had similar internalisation efficacy to GNPs-anti-Tyro3 since there was no significant difference in their uptake (p >0.05) showing that the Tyro3 receptor had an equal potential for the uptake of GNPs as the FR receptor.
2.6 Cell uptake studies using confocal microscopy
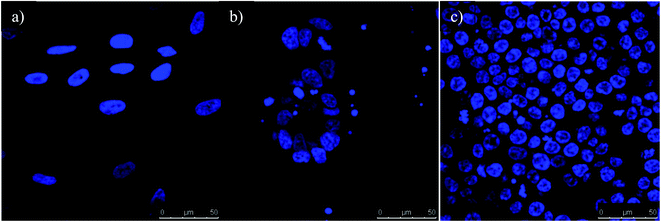
Conjugation of FITC antibody-coated GNPs has enabled confocal microscopy imaging to determine cellular uptake and localisation (Fig. 13). A concentration of 50 ng was chosen for the experiment since the fluorescent signals were constant compared to other concentrations used and also were the most internalised concentration as determined using ICP-OES. In the present experiment, GNPs-anti-FR, GNPs-anti-Tyro3 and GNPs-anti-(FR + Tyro3) were successfully used to target cancer cells using FR and Tyro3 receptors as quantified by ICP-OES. CRL1790 gave reduced non-specific binding or no signal due to low expression of FR or Tyro3 receptors on these CRC cells. On the other hand, CRL2159 and HCT116 had overexpressed FR & Tyro3 receptors and, therefore, had more internalisation of GNPs which was also supported by ICP-OES (Fig. 11) and (Fig. 12). Similar results can also be seen with strong green fluorescence associated with GNP uptake (Fig. 13). As a comparison, cells from all three cell lines without GNPs are also shown in Fig. 14. In a separate study, electron microscopy had demonstrated 4 nm and 6 nm internalisation by HeLa cells and the NPs were sub-localised in endosomes and lysosomes.51 In another experiment to demonstrate the uptake, HeLa cells were incubated with folate-conjugated GNPs. GNPs were shown via confocal and electron microscopy to be localised in the cytoplasm due to overexpressed folate receptors.41 These results strongly suggest that the presence of GNPs in the cytoplasm was due to receptor mediated endocytosis (RME) via invagination of the plasma membrane in the cytoplasm. Results as shown in Fig. 13 are also in line with the experiments conducted here and previous literature as stated above confirming the hypothesis that simultaneous targeting of FR and Tyro3 receptors has led to an increase in cellular uptake of GNPs.3 Materials and methods
3.1 Cell culture
Human Colon Epithelium Cell Line CRL1790 (ATCC no. CCD841), Human Colorectal Cancer Duke's B CRL2159 (ATCC no. LS411N) and Colorectal Carcinoma HCT116 (ATCC no. CCL-247) were used to grow and test the efficiency of gold nanoparticles. CRL1790 was cultured using Sigma's Minimum Essential Medium (MEM) Eagle (product no. M4655) supplemented with 10% (v/v) Foetal Bovine Serum (FBS) and 1% Penicillin/Streptomycin (v/v) antibiotic solution. CRL2159 was cultured using Sigma's RPMI1640 (product no. R8758) supplemented with 10% FBS and 1% antibiotic solution. HCT116 was cultured using Gibco's Dulbecco's Modified Eagle Medium (DMEM) solution (product no. 61965-026) and supplemented with 10% FBS and 1% antibiotic solution. The cells were passaged at 80–90% confluence, once or twice a week. Approximately, 10![[thin space (1/6-em)]](https://www.rsc.org/images/entities/char_2009.gif) 000 cells per well were aliquoted in 6-well plates and allowed to reach 80–90% confluency before aliquoting GNPs with different targeting moieties for the purpose of testing the efficiency.
000 cells per well were aliquoted in 6-well plates and allowed to reach 80–90% confluency before aliquoting GNPs with different targeting moieties for the purpose of testing the efficiency.
3.2 Synthesis of different types of GNPs
Schematic representation of the study is shown in Fig. 1. To test the hypothesis that targeting FR and Tyro3 simultaneously leads to a higher concentration of GNPs in the cells, pegylated GNPs (GNPs-PEG), folate receptor-α antibody bound GNPs (GNPs-anti-FR), Tyro3 receptor antibody bound GNPs (GNPs-anti-Tyro3) and both antibodies specific for FR and Tyro3 receptor (1![[thin space (1/6-em)]](https://www.rsc.org/images/entities/char_2009.gif) :
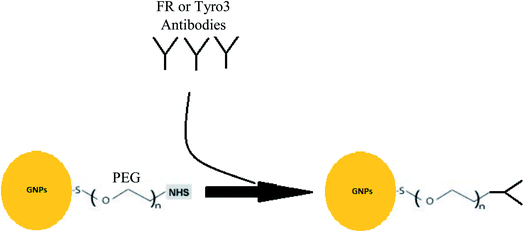
:![[thin space (1/6-em)]](https://www.rsc.org/images/entities/char_2009.gif) 1) attached GNPs (GNPs-anti-(Tyro3 + FR)) were tested in Colon Epithelium (CRL1790), Duke's Carcinoma (CRL2159) and Colorectal Carcinoma (HCT116) cell lines to investigate the uptake of these constructs. To synthesise the above-mentioned GNPs, lyophilised GNPs with a polyethylene glycol (PEG) (5 kDa) linker, a NHS ester-activated kit was purchased from Cytodiagnostics (product no. CGN5K-5-2) and the protocol followed is given in Fig. 15. Briefly, 5 mg ml−1 FR (product no. MA-23917) or Tyro3 antibodies (product no. ab235078) were reacted with NHS-activated GNPs for 2 hours to yield GNPs-anti-FR and GNPs-anti-Tyro3 conjugates. For GNPs-anti-(FR + Tyro3), a 1
1) attached GNPs (GNPs-anti-(Tyro3 + FR)) were tested in Colon Epithelium (CRL1790), Duke's Carcinoma (CRL2159) and Colorectal Carcinoma (HCT116) cell lines to investigate the uptake of these constructs. To synthesise the above-mentioned GNPs, lyophilised GNPs with a polyethylene glycol (PEG) (5 kDa) linker, a NHS ester-activated kit was purchased from Cytodiagnostics (product no. CGN5K-5-2) and the protocol followed is given in Fig. 15. Briefly, 5 mg ml−1 FR (product no. MA-23917) or Tyro3 antibodies (product no. ab235078) were reacted with NHS-activated GNPs for 2 hours to yield GNPs-anti-FR and GNPs-anti-Tyro3 conjugates. For GNPs-anti-(FR + Tyro3), a 1![[thin space (1/6-em)]](https://www.rsc.org/images/entities/char_2009.gif) :
:![[thin space (1/6-em)]](https://www.rsc.org/images/entities/char_2009.gif) 1 ratio was used whilst reacting respective antibodies with NHS-activated GNPs. The solution was then centrifuged at 15
1 ratio was used whilst reacting respective antibodies with NHS-activated GNPs. The solution was then centrifuged at 15![[thin space (1/6-em)]](https://www.rsc.org/images/entities/char_2009.gif) 000g for 1 hour using 100 kDa membrane filters (product no. VS0152) to remove the unbound antibodies from the antibody-conjugated GNPs. GNPs-PEG were synthesised by activating the GNPs first without any antibodies resulting in pegylated GNPs. Synthesised conjugates were then stored in gold nanoparticle buffer at 4 °C where they were stable for 3 months. The final volume had approximately 1.1 × 10¹⁴ GNPs in accordance with the information provided by the company.
000g for 1 hour using 100 kDa membrane filters (product no. VS0152) to remove the unbound antibodies from the antibody-conjugated GNPs. GNPs-PEG were synthesised by activating the GNPs first without any antibodies resulting in pegylated GNPs. Synthesised conjugates were then stored in gold nanoparticle buffer at 4 °C where they were stable for 3 months. The final volume had approximately 1.1 × 10¹⁴ GNPs in accordance with the information provided by the company.
Due to the fact that fluorescein isothiocyanate (FITC) recognises and binds to primary amine residues found on monoclonal antibodies, all antibody-coated GNPs were reacted with 0.1 mol L−1 FITC for 24 hours in the dark on an orbital shaker to enable visualisation using confocal microscopy.41 FITC labelled GNP conjugates were then centrifuged using 10![[thin space (1/6-em)]](https://www.rsc.org/images/entities/char_2009.gif) 000 MW Amicon® centrifugal filter tubes to remove excess FITC from the suspension. GNPs-PEG were the only exception since they do not provide a supporting amino group to bind FITC and, thus, were not included in the confocal imaging experiment. Since confocal imaging is used to qualitatively and solely assess the localisation of single- and double-antibody-coated GNPs in the cytoplasm, inclusion of GNPs-PEG would be an irrelevant experiment. ICP-OES was used to quantify the uptake of GNPs-PEG in all three cell lines as a control.
000 MW Amicon® centrifugal filter tubes to remove excess FITC from the suspension. GNPs-PEG were the only exception since they do not provide a supporting amino group to bind FITC and, thus, were not included in the confocal imaging experiment. Since confocal imaging is used to qualitatively and solely assess the localisation of single- and double-antibody-coated GNPs in the cytoplasm, inclusion of GNPs-PEG would be an irrelevant experiment. ICP-OES was used to quantify the uptake of GNPs-PEG in all three cell lines as a control.
3.3 Ultraviolet visible (UV-vis) spectroscopy
All UV-spectra were recorded using the BMG FLUstar Omega software to read the absorbance at room temperature. Briefly, 300 μl of GNPs-PEG, GNPs-anti-FR, GNPs-anti-Tyro3 and GNPs-anti-(FR + Tyro3) were aliquoted into a 96-well plate (96NUN) and readings were recorded between 400 and 800 nm. Colloidal stability of the nanoparticles in biological media is equally crucial to preserve their utility as aggregation often leads to an undesirable biological response. A quantitative measurement of nanoparticle aggregation in solution would provide a valuable assessment of colloidal stability of bio-nano interfaces after surface functionalization. As such, 1 ml GNPs-PEG, GNPs-anti-FR, GNPs-anti-Tyro3 and GNPs-anti-(FR + Tyro3) were incubated with 100 μl of varied NaCl concentrations (0.01 M, 0.1 M, 0.5 M and 1 M) for 1 hour at room temperature. This provided a check for aggregation via a red-spectral shift in the SPR peak of all the GNP constructs using a UV-vis spectrophotometer.3.4 Dynamic light scattering (DLS)
The dynamic light scattering apparatus (DLS) (Malvern Nano-ZS) was used to record the distribution of the size of the nanoparticles and zeta potential in the suspension. Disposable cuvettes were used to determine the size of the respective GNPs. 1.5 ml GNPs solution was loaded into the DLS and measurements were taken. Readings were taken in triplicate for every GNP conjugate.3.5 Bradford assay
To quantify the antibodies attached to all the GNP constructs, the Bradford assay was performed. A calibration curve was plotted in the range of 0 to 50 μg ml−1 using IgG antibodies (product no. 56834–25 MG) in 1× PBS buffer (pH 7.4) as the standard (R2 = 0.997) (Fig. 5). Briefly, in a 96-well plate, 100 μl of supernatants from GNPs-anti-FR, GNPs-anti-Tyro3 and GNPs-anti-(FR + Tyro3) were aliquoted and incubated with 150 μl of Bradford reagent (catalog no. 23200). The samples were incubated with Bradford reagent (lot no. SLBW5151) in the dark for 10 minutes. Subsequently, the absorbance readings were taken at 595 nm to estimate the amount of antibodies attached to each GNP construct by subtracting from the total amount added. GNPs-PEG were not aliquoted since there was no antibody associated with this construct.3.6 FR and Tyro3 expression levels in different cell lines
CRL1790, CRL2159 and HCT116 were cultured and passaged as mentioned above. For detecting differential expression of FR and Tyro3 receptors in normal vs. CRC cell lines, the cells cultured on sterilised coverslips were fixed using 4% paraformaldehyde (PFA) for 30 minutes. After fixation, residual PFA was washed away by washing twice with 1× PBS buffer after which all three cell lines were subjected to ICC experiments. Fixed cells, after being washed 3 times with 1× PBS, were treated with citrate buffer at pH 6 for FR antigen retrieval for 10 minutes whereas they remained untreated for the Tyro3 receptor. The citrate treated cells were washed thoroughly with 1× PBS. Subsequently, 50% horse serum in 1× PBS (1![[thin space (1/6-em)]](https://www.rsc.org/images/entities/char_2009.gif) :
:![[thin space (1/6-em)]](https://www.rsc.org/images/entities/char_2009.gif) 1) was aliquoted to inhibit any unwanted signals and non-specific binding of primary antibodies to the antigen receptors. Thereafter, FR receptor alpha rabbit polyclonal antibody (no. PA5-42004) at a concentration of 1
1) was aliquoted to inhibit any unwanted signals and non-specific binding of primary antibodies to the antigen receptors. Thereafter, FR receptor alpha rabbit polyclonal antibody (no. PA5-42004) at a concentration of 1![[thin space (1/6-em)]](https://www.rsc.org/images/entities/char_2009.gif) :
:![[thin space (1/6-em)]](https://www.rsc.org/images/entities/char_2009.gif) 100 and Tyro3 mouse monoclonal antibody (no. MA5-11171) at a concentration 1
100 and Tyro3 mouse monoclonal antibody (no. MA5-11171) at a concentration 1![[thin space (1/6-em)]](https://www.rsc.org/images/entities/char_2009.gif) :
:![[thin space (1/6-em)]](https://www.rsc.org/images/entities/char_2009.gif) 50 were incubated with all three types of cell line for 90 minutes followed by washing with 1× PBS. Next, using the VECTASTATIN ABC kit (catalog no. AK-6100), a biotinylated-secondary antibody was incubated with the cells to facilitate binding with the primary antibodies for 30 minutes. Again, the residual unbound secondary antibody was washed away using 1× PBS. Avidin-bound tertiary antibodies were then aliquoted for 20 minutes to bind to the biotinylated-secondary antibodies at room temperature. The cells were washed with 1× PBS again. A tertiary peroxidase-labelled avidin was applied at room temperature for 20 min before developing with a tyramide signal amplification (TSA) fluorescein system (NEN Life Science Products, Boston, MA, USA) to enable the visualisation of the receptors. Excess FITC was washed away using 1× PBS, and the cover-slips were counter-stained using DAPI (4′,6-diamidino-2-phenylindole) (Product no. H-1200) based mounting media. Confocal microscopy was used for obtaining pictures of FR and Tyro3 expression.
50 were incubated with all three types of cell line for 90 minutes followed by washing with 1× PBS. Next, using the VECTASTATIN ABC kit (catalog no. AK-6100), a biotinylated-secondary antibody was incubated with the cells to facilitate binding with the primary antibodies for 30 minutes. Again, the residual unbound secondary antibody was washed away using 1× PBS. Avidin-bound tertiary antibodies were then aliquoted for 20 minutes to bind to the biotinylated-secondary antibodies at room temperature. The cells were washed with 1× PBS again. A tertiary peroxidase-labelled avidin was applied at room temperature for 20 min before developing with a tyramide signal amplification (TSA) fluorescein system (NEN Life Science Products, Boston, MA, USA) to enable the visualisation of the receptors. Excess FITC was washed away using 1× PBS, and the cover-slips were counter-stained using DAPI (4′,6-diamidino-2-phenylindole) (Product no. H-1200) based mounting media. Confocal microscopy was used for obtaining pictures of FR and Tyro3 expression.
3.7 Matrix associated laser desorption/ionisation time-of-flight (TOF) mass spectroscopy (MALDI-TOF)
The MALDI-TOF instrument (Bruker) was calibrated using IgG antibodies as the standard (product no. 56834-25 MG). Thereafter, 1 μl GNPs-PEG, GNPs-anti-FR, GNPs-anti-Tyro3 and GNPs-anti-(FR + Tyro3) conjugates were deposited on the target plate to detect the presence of attached antibodies. The samples were left to air-dry at room temperature. Subsequently, 1 μl of sinapinic acid in acetonitrile and water (1![[thin space (1/6-em)]](https://www.rsc.org/images/entities/char_2009.gif) :
:![[thin space (1/6-em)]](https://www.rsc.org/images/entities/char_2009.gif) 1) with 0.1% trifluroacetate (TFA) (70
1) with 0.1% trifluroacetate (TFA) (70![[thin space (1/6-em)]](https://www.rsc.org/images/entities/char_2009.gif) :
:![[thin space (1/6-em)]](https://www.rsc.org/images/entities/char_2009.gif) 30 v/v) was pipetted onto the dried sample and left to form a thin layer over the sample at room temperature. The mass spectra were acquired in a positive linear mode with the laser beam at 60% intensity and 5000 shots on an average were fired upon the sample to generate protonated ions within the 20
30 v/v) was pipetted onto the dried sample and left to form a thin layer over the sample at room temperature. The mass spectra were acquired in a positive linear mode with the laser beam at 60% intensity and 5000 shots on an average were fired upon the sample to generate protonated ions within the 20![[thin space (1/6-em)]](https://www.rsc.org/images/entities/char_2009.gif) 000–200
000–200![[thin space (1/6-em)]](https://www.rsc.org/images/entities/char_2009.gif) 000 m/z range. Spectra were reviewed in FlexAnalysis Software (Bruker) and visually inspected for the presence of monoclonal peaks.
000 m/z range. Spectra were reviewed in FlexAnalysis Software (Bruker) and visually inspected for the presence of monoclonal peaks.
3.8 Cell uptake studies using confocal microscopy
All 3 fluorescently labelled GNP constructs GNPs-anti-FR, GNPs-anti-Tyro3 and GNPs-anti-(FR + Tyro3) were subjected to confocal microscopy. Normal Colon Epithelium (CRL1790), Duke's B Colorectal Cancer (CRL2159) and colorectal carcinoma (HCT116) were grown and cultured as mentioned above. After trypsinisation, 10![[thin space (1/6-em)]](https://www.rsc.org/images/entities/char_2009.gif) 000 cells were pipetted onto the sterilised cover-slips in 6-well plates and placed in an incubator at 37 °C at 5% CO2 to reach 80–90% confluence. Later, FITC bound antibody-coated GNPs (10–50 ng) were aliquoted in all three cell lines and incubated for 4 hours. For a control, one well of each cell line was incubated without GNPs. Thereafter, the media were discarded and the non-bound GNPs were washed away by using 1× PBS repeatedly over 4 times. 4% PFA was later pipetted to fix the cells for 30 minutes. The cells were again washed using 1× PBS twice and the cover-slips were mounted onto the slides using DAP-based mounting media. Internalisation of FITC bound GNPs was then visualised using a Leica confocal microscope.
000 cells were pipetted onto the sterilised cover-slips in 6-well plates and placed in an incubator at 37 °C at 5% CO2 to reach 80–90% confluence. Later, FITC bound antibody-coated GNPs (10–50 ng) were aliquoted in all three cell lines and incubated for 4 hours. For a control, one well of each cell line was incubated without GNPs. Thereafter, the media were discarded and the non-bound GNPs were washed away by using 1× PBS repeatedly over 4 times. 4% PFA was later pipetted to fix the cells for 30 minutes. The cells were again washed using 1× PBS twice and the cover-slips were mounted onto the slides using DAP-based mounting media. Internalisation of FITC bound GNPs was then visualised using a Leica confocal microscope.
3.9 ICP-OES
Quantification of GNPs in nanograms (ng) was carried out using an ICP-OES (iCAP 6000 Series). The conditions of the ICP-OES being operated upon are listed in Table 3. A gold standard calibration curve (R2 = 0.9946) was plotted using gold standard solution (product no. 170321) in the range of 0–10 μg l−1. All three cell lines were grown and passaged as mentioned above and later aliquoted in 6-well plates at approximately 10![[thin space (1/6-em)]](https://www.rsc.org/images/entities/char_2009.gif) 000 cells per well. The cells were allowed to grow until they were 80–90% confluent. GNPs-PEG and the antibody-coated GNPs were incubated for 4 hours with all three cell lines. After incubation with relevant GNPs, the cells were washed 4 times with 1× PBS to remove free and loosely bound GNPs. Later, the cells were digested using freshly prepared 1 ml aqua regia (3
000 cells per well. The cells were allowed to grow until they were 80–90% confluent. GNPs-PEG and the antibody-coated GNPs were incubated for 4 hours with all three cell lines. After incubation with relevant GNPs, the cells were washed 4 times with 1× PBS to remove free and loosely bound GNPs. Later, the cells were digested using freshly prepared 1 ml aqua regia (3![[thin space (1/6-em)]](https://www.rsc.org/images/entities/char_2009.gif) :
:![[thin space (1/6-em)]](https://www.rsc.org/images/entities/char_2009.gif) 1 HCL
1 HCL![[thin space (1/6-em)]](https://www.rsc.org/images/entities/char_2009.gif) :
:![[thin space (1/6-em)]](https://www.rsc.org/images/entities/char_2009.gif) HNO3) for 1 hour. Each digested sample with aqua regia was later brought up to 10 ml by adding de-ionised water in 15 ml centrifuged tubes. Respective samples were then run through an ICP-OES to measure the uptake of GNPs in nanograms. Concentrations (μg L−1) obtained from ICP-OES were used to determine the amount internalised by the cells in 10 ml suspension using a C1V1 = C2V2 formula.
HNO3) for 1 hour. Each digested sample with aqua regia was later brought up to 10 ml by adding de-ionised water in 15 ml centrifuged tubes. Respective samples were then run through an ICP-OES to measure the uptake of GNPs in nanograms. Concentrations (μg L−1) obtained from ICP-OES were used to determine the amount internalised by the cells in 10 ml suspension using a C1V1 = C2V2 formula.
| Nebuliser | Cross-flow |
|---|---|
| Spray chamber | Glass-Scott type |
| Power (watts) | 1150 watts |
| Coolant gas (L min−1) | 12 L min−1 |
| Auxiliary gas (L min−1) | 0.5 L min−1 |
| Nebuliser gas (L min−1) | 0.7 L min−1 |
| Viewing | Axial |
| Sample uptake (ml) | 1 ml |
| Analyte wavelength | 242.795 nm |
| Measurement time per replicate (seconds) | 30 s |
| R 2 | 0.9946 |
3.10 Statistics
Analysis of variance (ANOVA) was carried out where two or more groups of means were involved and Student's unpaired t-test where only two groups were compared. P ≤0.05 was considered to be statistically significant.4 Conclusion
CRC ranks fourth in mortality and morbidity worldwide whereas diagnosis and treatment have shortcomings making CRC patients' survival rate <5%. Therefore, targeting CRC cells using GNPs could result in diagnosis and better treatment by delivering contrast agents and drugs, respectively, in a selective manner with minimum side-effects. To that end, this work demonstrates targeting novel receptors Tyro3 and FR on CRC cells simultaneously to enhance GNP delivery in vitro. The minimum threshold levels of GNPs in CRC cells were higher via targeting these receptors simultaneously compared to when targeted individually. RME mediated localisation of GNPs was also shown using confocal microscopy and concomitantly quantified using ICP-OES. Similarly, depending on the cancer types overexpressing specific receptors, GNPs can be exploited for targeting using a similar principle to efficiently and specifically deliver nanoparticles into cancer cells. Furthermore, the work has also elucidated the internalisation of GNPs via the novel receptor Tyro3 wherein it is equally effective as FR in delivering GNPs in cancer cells. Therefore, by increasing cellular delivery and internalisation, hyperthermia based molecular imaging and treatments using GNPs can be made feasible.52Author contributions
NP devised and executed the research as well as carried out all the experiments as depicted in this study, LG provided expertise in investigating overexpression of receptors in all cell lines using ICC. IR provided the expertise on immunology and biochemistry. LPM assisted with the use of techniques ICP-OES and MALDI-TOF mass spectrometry. RB has also devised the research and provided expertise on GNPs. The authors have read and are unanimous in submitting this manuscript.Conflicts of interest
There was no competing interest amongst the authors.Acknowledgements
We are also extremely grateful to our colleagues Fahimullah Hayat and Nirusha Chandima Weerasinghe for their support during the time. This research was partly funded by the Engineering and Physical Sciences Research Council (EPSRC) under grant number EP/R04192X/1.References
- R. L. Siegel, K. D. Miller and A. Jemal, Cancer statistics, 2018, Ca-Cancer J. Clin., 2018, 68(6), 394–424 CrossRef PubMed.
- B. A. Cisterna, N. Kamaly, W. I. Choi, A. Tavakkoli, O. C. Farokhzad and C. Vilos, Targeted nanoparticles for colorectal cancer, Nanomedicine, 2016, 11(8), 2443–2456 CrossRef CAS PubMed.
- M. Gonzalez-Pons and M. Cruz-Correa, Colorectal Cancer Biomarkers: Where Are We Now?, BioMed Res. Int., 2015, 2015, 149014 Search PubMed , available from: http://europepmc.org/articles/PMC4461726.
- S. A. Kaliberov and D. J. Buchsbaum, Cancer treatment with gene therapy and radiation therapy, Adv. Cancer Res., 2012, 115, 221–263 CrossRef CAS PubMed , available from: http://www.ncbi.nlm.nih.gov/pubmed/23021246.
- M. Singh, D. C. Harris-Birtill, S. R. Markar, G. B. Hanna and D. S. Elson, Application of gold nanoparticles for gastrointestinal cancer theranostics: A systematic review, Nanomedicine, 2015, 11(8), 2083–2098 CrossRef CAS PubMed.
- M. Shah, V. D. Badwaik and R. Dakshinamurthy, Biological applications of gold nanoparticles, J. Nanosci. Nanotechnol., 2014, 37(9), 1896–1908 Search PubMed.
- J. Turkevich, P. C. Stevenson and J. Hillier, A study of the nucleation and growth processes in the synthesis of colloidal gold, Discuss. Faraday Soc., 1951, 11, 55–75, 10.1039/DF9511100055.
- S. R. Grobmyer, N. Iwakuma, P. Sharma and B. M. Moudgil, What Is Cancer Nanotechnology? in Cancer Nanotechnology: Methods and Protocols, ed. S. R. Grobmyer and B. M. Moudgil, Humana Press, Totowa, NJ, 2010, pp. 1–9, DOI:10.1007/978-1-60761-609-2_1.
- R. Lévy, U. Shaheen, Y. Cesbron and V. Sée, Gold nanoparticles delivery in mammalian live cells: a critical review, Nano Rev., 2010, 1(1), 4889 CrossRef PubMed , available from: http://www.ncbi.nlm.nih.gov/pubmed/22110850.
- W. Cai, T. Gao, H. Hong and J. Sun, Applications of gold nanoparticles in cancer nanotechnology, Nanotechnol., Sci. Appl., 2008, 1, 17–32 CrossRef CAS PubMed.
- G. Obaid, I. Chambrier, M. J. Cook and D. A. Russell, Cancer targeting with biomolecules: a comparative study of photodynamic therapy efficacy using antibody or lectin conjugated phthalocyanine-PEG gold nanoparticles, Photochem. Photobiol. Sci., 2015, 14(4), 737–747, 10.1039/C4PP00312H.
- Y. Hong and Y. Rao, Current status of nanoscale drug delivery systems for colorectal cancer liver metastasis, Biomed. Pharmacother., 2019, 114, 1–10 Search PubMed.
- H. Holback and Y. Yeo, Intratumoral drug delivery with nanoparticulate carriers, Pharm. Res., 2011, 28(8), 1819–1830 CrossRef CAS PubMed.
- S. Her, D. A. Jaffray and C. Allen, Gold nanoparticles for applications in cancer radiotherapy: Mechanisms and recent advancements, Adv. Drug Delivery Rev., 2017, 109, 84–101 CrossRef CAS PubMed , available from: http://www.sciencedirect.com/science/article/pii/S0169409X15300144.
- A. Albanese, P. S. Tang and W. C. W. Chan, The Effect of Nanoparticle Size, Shape, and Surface Chemistry on Biological Systems, Annu. Rev. Biomed. Eng., 2012, 14, 1–16 CrossRef CAS PubMed.
- N. Gou, A. Onnis-Hayden and A. Z. Gu, Mechanistic toxicity assessment of nanomaterials by whole-cell-array stress genes expression analysis, Environ. Sci. Technol., 2010, 44(15), 5964–5970 CrossRef CAS PubMed.
- R. Lévy, U. Shaheen, Y. Cesbron and V. Sée, Gold nanoparticles delivery in mammalian live cells: a critical review, Nano Rev., 2010, 1(1), 4889 CrossRef PubMed.
- D. A. Giljohann and C. A. Mirkin, Drivers of biodiagnostic development, Nature, 2009, 462(7272), 461–464 CrossRef CAS PubMed , available from: http://www.ncbi.nlm.nih.gov/pubmed/19940916.
- P. Alivisatos, The use of nanocrystals in biological detection, Nat. Biotechnol., 2004, 22(1), 47–52 CrossRef CAS PubMed.
- L. Y. T. Chou and W. C. W. Chan, Fluorescence-Tagged Gold Nanoparticles for Rapidly Characterizing the Size-Dependent Biodistribution in Tumor Models, Adv. Healthcare Mater., 2012, 1(6), 714–721 CrossRef CAS PubMed.
- A. Cheung, H. J. Bax, D. H. Josephs, K. M. Ilieva, G. Pellizzari and J. Opzoomer, et al., Targeting folate receptor alpha for cancer treatment, Oncotarget, 2016, 7(32), 52553–52574 CrossRef PubMed.
- E. I. Sega and P. S. Low, Tumor detection using folate receptor-targeted imaging agents, Cancer Metastasis Rev., 2008, 655–664 CrossRef CAS PubMed.
- A. C. Antony, Folate Receptors, Annu. Rev. Nutr., 1996, 16(1), 501–521 CrossRef CAS PubMed , available from: http://www.ncbi.nlm.nih.gov/pubmed/8839936.
- J. Shen, K. S. Putt, D. W. Visscher, L. Murphy, C. Cohen and S. Singhal, et al., Assessment of folate receptor-beta expression in human neoplastic tissues, Oncotarget, 2015, 6(16), 14700–14709 CrossRef PubMed.
- R. Bhattacharya, C. R. Patra, A. Earl, S. Wang, A. Katarya and L. Lu, et al., Attaching folic acid on gold nanoparticles using noncovalent interaction via different polyethylene glycol backbones and targeting of cancer cells, Nanomedicine, 2007, 224–238 CrossRef CAS.
- T. Schmidt, I. Ben-Batalla, A. Schultze and S. Loges, Macrophage-tumor crosstalk: Role of TAMR tyrosine kinase receptors and of their ligands, Cell. Mol. Life Sci., 2012, 69(9), 1391–1414 CrossRef CAS PubMed.
- C. W. Chien, P. C. Hou, H. C. Wu, Y. L. Chang, S. C. Lin and S. C. Lin, et al., Targeting TYRO3 inhibits epithelial-mesenchymal transition and increases drug sensitivity in colon cancer, Oncogene, 2016, 35(45), 5872–5881 CrossRef CAS PubMed.
- L. G. Biesecker, L. R. Gottschalk and S. G. Emerson, Identification of four murine cDNAs encoding putative protein kinases from primitive embryonic stem cells differentiated in vitro, Proc. Natl. Acad. Sci. U. S. A., 1993, 90(15), 7044–7048 CrossRef CAS PubMed , available from: http://www.ncbi.nlm.nih.gov/pubmed/8346215.
- T. N. Stitt, G. Conn, M. Gore, C. Lai, J. Bruno and C. Radziejewski, et al., The anticoagulation factor protein S and its relative, Gas6, are ligands for the Tyro 3/Axl family of receptor tyrosine kinases, Cell, 1995, 80(4), 661–670 CrossRef CAS PubMed , available from: http://www.ncbi.nlm.nih.gov/pubmed/7867073.
- R. Schmitz, A. F. Valls, R. Yerbes, S. von Richter, C. Kahlert and S. Loges, et al. TAM receptors Tyro3 and Mer as novel targets in colorectal cancer, Oncotarget, 2016, 7(35), 56355–56370 CrossRef PubMed , available from: https://pubmed.ncbi.nlm.nih.gov/27486820/.
- I. C. A. Taylor, S. Roy, P. Yaswen, M. R. Stampfer and H. E. Varmus, Mouse mammary tumors express elevated levels of RNA encoding the murine homolog of SKY, a putative receptor tyrosine kinase, J. Biol. Chem., 1995, 270(12), 6872–6880 CrossRef CAS PubMed.
- I. C. Taylor, S. Roy and H. E. Varmus, Overexpression of the Sky receptor tyrosine kinase at the cell surface or in the cytoplasm results in ligand-independent activation, Oncogene, 1995, 11(12), 2619–2626 CAS , available from: http://www.ncbi.nlm.nih.gov/pubmed/8545119.
- D. K. Graham, D. Deryckere, K. D. Davies and H. S. Earp, The TAM family: Phosphatidylserine-sensing receptor tyrosine kinases gone awry in cancer, Nat. Rev. Cancer, 2014, 14(12), 769–785 CrossRef CAS PubMed.
- M. Hojjat-Farsangi, Small-molecule inhibitors of the receptor tyrosine kinases: Promising tools for targeted cancer therapies, Int. J. Mol. Sci., 2014, 15, 13768–13801 CrossRef CAS PubMed , available from: https://pubmed.ncbi.nlm.nih.gov/25110867/.
- Y. Duan, W. Wong, S. C. Chua, H. L. Wee, S. G. Lim and B. T. Chua, et al., Overexpression of Tyro3 and its implications on hepatocellular carcinoma progression, Internet J. Oncol., 2016, 48(1), 358–366 CrossRef CAS PubMed.
- W. Haiss, N. T. K. Thanh, J. Aveyard, D. G. Fernig, W. Haiss, N. Thanh and D. Fernig, Determination of Size and Concentration of Gold Nanoparticles from UV/vis Spectra - Supporting Information, Anal. Chem., 2007, 79(11), 4215–4221 CrossRef CAS PubMed.
- S. Kumar, J. Aaron and K. Sokolov, Directional conjugation of antibodies to nanoparticles for synthesis of multiplexed optical contrast agents with both delivery and targeting moieties, Nat. Protoc., 2008, 3(2), 314–320 CrossRef CAS PubMed.
- M. Raoof, S. J. Corr, W. D. Kaluarachchi, K. L. Massey, K. Briggs and C. Zhu, et al., Stability of antibody-conjugated gold nanoparticles in the endolysosomal nanoenvironment: Implications for noninvasive radiofrequency-based cancer therapy, Nanomedicine, 2012, 8(7), 1096–1105 CrossRef CAS PubMed.
- C. Fang, N. Bhattarai, C. Sun and M. Zhang, Functionalized nanoparticles with long-term stability in biological media, Small, 2009, 5(14), 1637–1641 CrossRef CAS PubMed.
- H. Jans, X. Liu, L. Austin, G. Maes and Q. Huo, Dynamic light scattering as a powerful tool for gold nanoparticle bioconjugation and biomolecular binding studies, Anal. Chem., 2009, 81(22), 9425–9432 CrossRef CAS PubMed.
- Z. Zhang, J. Jia, Y. Lai, Y. Ma, J. Weng and L. Sun, Conjugating folic acid to gold nanoparticles through glutathione for targeting and detecting cancer cells, Bioorg. Med. Chem., 2010, 18(15), 5528–5534 CrossRef CAS PubMed.
- K. Tripathi and J. D. Driskell, Quantifying Bound and Active Antibodies Conjugated to Gold Nanoparticles: A Comprehensive and Robust Approach to Evaluate Immobilization Chemistry, ACS Omega, 2018, 3(7), 8253–8259 CrossRef CAS PubMed.
- W. Eck, G. Craig, A. Sigdel, G. Ritter, L. J. Old and L. Tang, et al., PEGylated gold nanoparticles conjugated to monoclonal F19 antibodies as targeted labeling agents for human pancreatic carcinoma tissue, ACS Nano, 2008, 2(11), 2263–2272 CrossRef CAS PubMed.
- J. Bian and S. V. Olesik, Surface-assisted laser desorption/ionization time-of-flight mass spectrometry of small drug molecules and high molecular weight synthetic/biological polymers using electrospun composite nanofibers, Analyst, 2017, 142(7), 1125–1132 RSC.
- L. Signor and E. B. Erba, Matrix-assisted laser desorption/ionization time of flight (MALDI-TOF) mass spectrometric analysis of intact proteins larger than 100 kDa, J. Visualized Exp., 2013, 79, 1–10 Search PubMed , available from: https://pubmed.ncbi.nlm.nih.gov/24056304/.
- A. Lapolla, D. Fedele, M. Garbeglio, L. Martano, R. Tonani and R. Seraglia, et al., Matrix-assisted laser desorption/ionization mass spectrometry, enzymatic digestion, and molecular modeling in the study of nonenzymatic glycation of IgG, J. Am. Soc. Mass Spectrom., 2000, 11(2), 153–159 CrossRef CAS PubMed.
- A. Lapolla, D. Fedele, R. Aronica, M. Garbeglio, M. D'Alpaos and R. Seraglia, et al., Evaluation of IgG glycation levels by matrix-assisted laser desorption/ionization mass spectrometry, Rapid Commun. Mass Spectrom., 1997, 11(12), 1342–1346 CrossRef CAS PubMed , available from: https://pubmed.ncbi.nlm.nih.gov/9276978/.
- H. Samadian, S. Hosseini-Nami, S. K. Kamrava, H. Ghaznavi and A. Shakeri-Zadeh, Folate-conjugated gold nanoparticle as a new nanoplatform for targeted cancer therapy, J. Cancer Res. Clin. Oncol., 2016, 142(11), 2217–2229 CrossRef CAS PubMed , available from: http://link.springer.com/10.1007/s00432-016-2179-3.
- H. Gao, W. Shi and L. B. Freund, Mechanics of receptor-mediated endocytosis, Proc. Natl. Acad. Sci. U. S. A., 2005, 102(27), 9469–9474 CrossRef CAS PubMed.
- S. Bhattacharyya, R. Bhattacharya, S. Curley, M. A. McNiven and P. Mukherjee, Nanoconjugation modulates the trafficking and mechanism of antibody induced receptor endocytosis, Proc. Natl. Acad. Sci. U. S. A., 2010, 107(33), 14541–14546 CrossRef CAS PubMed , available from: http://www.ncbi.nlm.nih.gov/pubmed/20679244.
- C. S. Kim, X. Li, Y. Jiang, B. Yan, G. Y. Tonga and M. Ray, et al., Cellular imaging of endosome entrapped small gold nanoparticles, MethodsX, 2015, 2(6), 306–315 CrossRef PubMed , available from: https://pubmed.ncbi.nlm.nih.gov/26151001/.
- X. Huang, I. H. El-Sayed, W. Qian and M. A. El-Sayed, Cancer cell imaging and photothermal therapy in the near-infrared region by using gold nanorods, J. Am. Chem. Soc., 2006, 128(6), 2115–2120 CrossRef CAS PubMed , available from: https://pubmed.ncbi.nlm.nih.gov/16464114/.
| This journal is © The Royal Society of Chemistry 2021 |

