
 Open Access Article
 This Open Access Article is licensed under a Creative Commons Attribution-Non Commercial 3.0 Unported Licence
ALD coating of centrifugally spun polymeric fibers and postannealing: case study for nanotubular TiO2 photocatalyst†
Martina
Rihova
 a,
Oksana
Yurkevich
b,
Martin
Motola‡
c,
Ludek
Hromadko
ab,
Zdenek
Spotz
a,
Raul
Zazpe
ac,
Mato
Knez
bd and
Jan M.
Macak
*ac
a,
Oksana
Yurkevich
b,
Martin
Motola‡
c,
Ludek
Hromadko
ab,
Zdenek
Spotz
a,
Raul
Zazpe
ac,
Mato
Knez
bd and
Jan M.
Macak
*ac
aCentral European Institute of Technology, Brno University of Technology, Purkynova 123, 612 00 Brno, Czech Republic
bCIC nanoGUNE BRTA, Tolosa Hiribidea 76, E-20018 Donostia – San Sebastian, Spain
cCenter of Materials and Nanotechnologies, Faculty of Chemical Technology, University of Pardubice, Nam. Cs. Legii, 565, 530 02 Pardubice, Czech Republic. E-mail: jan.macak@upce.cz
dIKERBASQUE, Basque Foundation for Science, Plaza Euskadi 5, E-48009 Bilbao, Spain
First published on 5th July 2021
Abstract
This work describes the synthesis of highly photocatalytically active TiO2 tubes (TiTBs) by combining centrifugal spinning and atomic layer deposition (ALD). Poly(vinyl pyrrolidone) (PVP) fibers were first produced by centrifugal spinning and subsequently coated with TiO2 with various film thicknesses in a fluidized bed ALD reactor. After annealing of the TiO2 ALD coated PVP fibers, TiO2 tubes (TiTBs) with excellent textural properties and diameters in the range from approx. 170 to 430 nm were obtained. The morphology and structure of all TiTBs were investigated by scanning and transmission electron microscopy (SEM and TEM), X-ray diffraction (XRD), and Brunauer–Emmett–Teller analysis (BET). Liquid phase photocatalysis was conducted to determine the photocatalytic activity of the TiTBs. The photocatalytic activity of the TiTBs obtained after 50 TiO2 ALD cycles (degradation rate 0.123 min−1) was twice that of the reference TiO2 P25. The underlying reasons for the remarkable photocatalytic performance were textural properties of the resulting tubes along with suitable crystallinity, embedded within the 1D tubular morphology. The herein presented proof-of-concept approach paves a way for the processing of various polymeric fibers into various tubular nanostructures.
Introduction
Over the last decade, the development of one-dimensional (1D) titanium dioxide (TiO2) nanostructures has attracted considerable attention.1,2 Their unique geometry and physico-chemical properties such as high surface area, tunability of dimensions, and strong incident light absorption are highly suitable for advanced applications (e.g., electrochromic devices, solar cells, batteries, and biomedical applications). TiO2 nanotubes (TiNTs) are among the most sought after 1D materials due to their low cost, non-toxicity, high chemical stability,2,3 and photo-electrochemical and photocatalytic properties based on their suitable bandgap energy for the incident UV light utilization (3.2 eV and 3.0 eV for the most common anatase and rutile phase, respectively).4During the last 15 years, electrochemical anodization of Ti foil in organic-based fluoride-containing electrolytes has become the most common method for the preparation of TiNTs.5,6 This method allows the preparation of self-organized 1D TiNTs structures with a high aspect ratio and tunable dimensions.5–7 An alternative approach for the synthesis of 1D materials relies on thin film coating of preformed nanostructures such as fibers, arrays, or tubes.8,9 For example, nanofibers are often used as substrate for metal oxide deposition, as they can be easily produced and efficiently coated.10–13 Electrospinning14,15 is one of the current state-of-the-art techniques to prepare polymeric nanofibers. However, this method possesses several drawbacks, such as a decent production rate and the application of a high electric field (in the order of kV) within a highly flammable solvent (with implications on fire hazards). An alternative approach to circumvent these major shortcomings is the synthesis through centrifugal fiber spinning, formerly also called forcespinning.16,17 The process allows high throughput and can be roughly compared with a cotton candy maker. During the centrifugal spinning process, the fibers are expulsed as a result of a strong centrifugal force acting on the precursor in the rotating spinneret and the airflow in the spinning chamber. The subsequent evaporation of the solvent leaves behind the fibers, which are collected on the fiber collector. Due to the nature of the formation, centrifugal spinning produces fibers with larger diameters (from several hundreds of nanometers up to very few micrometers) than electrospinning.18
Atomic Layer Deposition (ALD) is a technique for the controllable deposition of various materials, including metal oxides.19 ALD is based on sequential self-limited adsorption of vapors of compatible precursors on surfaces and their reactions to atomic layers.20 The main advantages of ALD are the great control over the composition, thickness, conformality and homogeneity of the resulting coating. It is a non-line-of-sight deposition method, which allows the use of various porous materials with high aspect ratios as templates for ALD coatings besides its traditional application to coat flat substrates. The ALD coatings contain a low amount of contaminants and adhere very well since they are chemisorbed to the underlying substrates. More importantly, some ALD processes enable the deposition of coatings at lower temperatures (<100 °C), compatible with temperature-sensitive substrates, such as bio-organic species, organic media and polymers.11,12,20,21 The type of the polymer is a crucial factor for the use as a substrate for ALD as it defines the ALD temperature range and availability of the functional groups needed for successful chemisorption. Many reports have already shown nanotubes with metal oxide coatings prepared by a combination of electrospinning and ALD. The coatings of metal oxide were applied both on natural cotton fibers22 and synthetic polymer fibers obtained by electrospinning, such as poly(acrylonitrile),23–26 poly(vinylidene fluoride),27 poly(methyl methacrylate),27 polysulfone,28 poly(ether sulfone),29 nylon 6,6,30–34 nylon 6 (ref. 35–37) and poly(butylene adipate terephthalate).38
Among the synthetic polymers, poly(vinyl pyrrolidone) PVP and poly(vinyl alcohol) PVA are most widely used due to their facile preparation in water as solvents.39–41 The electrospun polymer fibers were subsequently coated by ALD with TiO2,11,42–46 Al2O3 (ref. 10, 47–49) or ZnO.44,50–53
In all aforementioned reports the diameters of the electrospun fibers were limiting the diameters of the resulting nanotubes to the range between tens and few hundreds of nm. No report employed fibers with larger diameters, up to the sub-micron scale. There are several reasons, why tubes with larger diameters would be beneficial: (1) larger crystals within the tube walls with more degrees of freedom for growth and orientation, (2) higher yield, and (3) safety issues (i.e., larger diameter nanofibers can possess a lower health risk compared to low diameter ones). Overall, a robust synthesis protocol to produce such tubes is desirable, but missing.
In this work, the centrifugal spinning of fibers and ALD are combined for the first time to a robust synthesis protocol for efficient TiO2 photocatalyst tubes (TiTBs). In order to achieve TiTBs, poly(vinyl pyrrolidone) (PVP) fibers, fabricated via centrifugal spinning, were subsequently coated with TiO2 by ALD. The resulting core–shell structure underwent thermal post-treatment rendering hollow TiTBs upon annealing of the polymeric fiber core. The morphology, structure, and specific surface area of the prepared TiTBs were characterized by scanning electron microscopy (SEM), high-resolution transmission electron microscopy (HRTEM), X-ray diffraction (XRD), and Brunauer–Emmett–Teller (BET) analysis. The photocatalytic properties of the TiTBs were evaluated under UV light irradiation, showing photocatalytic activities that outperform those of the reference TiO2 nanoparticles (P25) and yielding a very promising material for photocatalytic applications.
Experimental
Centrifugal spinning
Poly(vinyl pyrrolidone) with commercial name K-90 (PVP, average molecular weight Mw ≈ 600![[thin space (1/6-em)]](https://www.rsc.org/images/entities/char_2009.gif) 000 g mol−1) was purchased from Prochema (Austria). Based on our previous work,18 the PVP solution was prepared in distilled water with a concentration of 22 wt%. Polymer fibers were prepared from this solution using the centrifugal spinning pilot tool Cyclon Pilot G1 (Pardam Ltd., Czech Republic). The fibers were prepared with the following processing conditions: rotational speed of the spinneret 11000 rpm, temperature 40 °C, and relative humidity 15%.
000 g mol−1) was purchased from Prochema (Austria). Based on our previous work,18 the PVP solution was prepared in distilled water with a concentration of 22 wt%. Polymer fibers were prepared from this solution using the centrifugal spinning pilot tool Cyclon Pilot G1 (Pardam Ltd., Czech Republic). The fibers were prepared with the following processing conditions: rotational speed of the spinneret 11000 rpm, temperature 40 °C, and relative humidity 15%.
Atomic layer deposition
The ALD process was carried out in a home-built fluidized bed reactor using TiCl4 and H2O as precursors. The reactor temperature was maintained at 85 °C. High-purity nitrogen (99.9999%) with a flow of 200 standard cubic centimeters per minute (sccm) was used as a carrier and purging gas. The PVP fibers were coated by TiO2 applying various numbers of ALD cycles (12, 25, 50, 100, and 200). After each precursor pulse an exposure time of 5 s was allowed for both TiCl4 and H2O, followed by a nitrogen purge of 60 s. The extended exposure of the substrates to the precursors in the chamber was needed to ensure diffusion and the complete coverage of the fibers, due to their high surface area. The post-annealing treatment of the as-coated fibers was carried out at 500 °C in air for 4 h in a muffle oven, rendering hollow TiO2 tubes (TiTBs).Material and photocatalytic characterization of TiTBs
The morphology of the PVP fibers and TiTBs was characterized by scanning electron microscopy (FE-SEM JEOL JSM 7500F) and selected samples also by high-resolution transmission electron microscopy (HRTEM, FEI Titan Themis 60, operated at 300 keV). The structure of the TiTBs was analyzed by X-ray diffractometry (XRD, SmartLab 3 kW from Rigaku) set up in Bragg–Brentano geometry using Cu-Kα radiation (λ = 1.54 Å) and equipped with the Dtex-Ultra 1D-detector. The Cu lamp was operated at a current of 30 mA and a voltage of 40 kV. The phase analysis was performed based on the chemical composition using the databases PDF2 and ICSD. Quantitative phase analysis was calculated by Rietveld refinement. Crystallite size was find out from diffraction peak broadening based on Scherrer formula. The textural properties (specific surface area and pore size distribution) of TiO2 fibers and reference TiO2 P25 nanoparticles were determined from the N2 adsorption isotherms. The isotherms were acquired using an ASAP 2020 instrument (Micromeritics) and evaluated by its MicroActive software. Before the adsorption measurement, the materials were carefully degassed to allow a quantitative removal of the preadsorbed H2O.The photocatalytic activities of the TiTBs were evaluated using photocatalytic degradation of aqueous methylene blue solution (MB; initial concentration = 1 × 10⁻⁵ M). Prior to all measurements, to achieve the dye adsorption/desorption equilibrium, 5 mg of the samples were immersed into the MB solution (Vtotal = 150 mL) for 1 h under constant stirring. After reaching the equilibrium, the samples were separated from the MB solution by centrifugation at 15000 rpm for 3 min at 25 °C using a fixed angle rotor (MLA-50). Subsequently, 5 mg of the sample was immersed in the MB solution (Vtotal = 150 mL) and irradiated by a LED lamp (UV lamp; λ = 365 nm ± 5 nm) and the absorbance of the MB solution was periodically (10 min steps) measured by a UV-VIS spectrophotometer (S-200, Boeco) at a wavelength of 670 nm to monitor the degradation rates. Repeatedly, before the absorbance measurements, 30 mL of MB solution were taken out of the reaction solution and the sample was separated from the MB solution by centrifugation at 15000 rpm for 3 min at 25 °C using an MLA-50 rotor. This approach was used due to: (1) dispersed photocatalyst would disrupt the absorbance measurements of the MB and (2) the maximum amount of solution that can be put into ultracentrifuge is 30 mL. After the absorbance measurements, the separated photocatalyst along with the solution were put back into the original MB solution (i.e., the total amount of 150 mL was preserved during the entire photocatalytic activity measurements).
Results and discussion
Morphology and structure
The morphologies of the submicron sized TiO2-coated PVP fibers, after applying 12, 25, 50, and 100 ALD cycles, and TiTBs, prepared by annealing, are shown in Fig. 1. The morphologies of all PVP fibers with TiO2 coatings were very similar and the TiO2 coatings could not be discerned by the SEM at low magnification. Fig. S1† shows a cross-sectional view of a PVP fiber with a TiO2 coating after 200 ALD cycles, which shows the homogeneity of the coatings and its thickness. The measured thickness of the TiO2 coating was approximately 27 nm (Fig. S1†), which translates to a growth rate of 0.135 nm per cycle. | ||
| Fig. 1 SEM images of PVP fibers coated with TiO2 by applying 12, 25, 50, or 100 ALD cycles (upper row) and TiTBs (lower row) after annealing of the respective fibers. | ||
The as-spun PVP fibers had diameters of approx. 790 nm. However, the morphology and diameters dramatically changed after annealing, by which distinct hollow shapes were formed, as shown in Fig. 1. The TiTBs showed diameter values of approx. 168 nm, 234 nm, 234 nm, and 434 nm resulting from the initial PVP fibers coated with 12, 25, 50, and 100 ALD cycles, respectively.
These results contrast with the early reports for coated electrospun fibers, where the annealing process of ALD TiO2 coated polymeric fibers did not yield such a significant change in the diameter of the resulting hollow tubular structures.11,42–46 Namely, Kim et al.11 coated electrospun PVP fibers with diameters of around 500 nm with TiO2 by ALD applying 1000 cycles and the resulting TiTBs largely maintained the initial diameters with a wall thickness of ≈60 nm. De Dicastillo et al.45 coated electrospun PVA fibers with TiO2 by ALD by applying 250 and 500 ALD cycles and annealed them at temperatures of 400 °C and 600 °C. The resulting tubes showed a slight increase of diameters from approximately 200 nm to some 210–230 nm. Finally, Choi et al.42 also reported similar diameters of PVA fibers and TiTBs (approximately 240 nm) before and after annealing. Their tubes had very thick side walls (75 nm). To sum up, all TiTBs obtained after 250 or more ALD cycles have a sufficiently high wall thickness to withstand annealing without losing the integrity of the tubes. At the same time, this indicates a low porosity, which suppresses the photocatalytic activity. However, an exact comparison of our results to the mentioned publications cannot be easily made. Except for the different polymeric fibers used (PVP vs. PVA), the authors either did not indicate the number of ALD cycles applied for the ALD coating, or used significantly higher cycle numbers. The resulting wall thicknesses were considerably larger and the coatings were less porous than in the presented research. In addition, the annealing conditions (i.e. temperature, duration, heating, and colling rates) were very different. Overall, the TiTBs obtained in this work were prepared with a lower number of ALD cycles (i.e., 12, 25, 50, and 100 cycles) than in these reports and possess a porous surface, which is desired for an efficient photocatalysis and diffusion.
The tubes resulting from the sample with 12 TiO2 ALD cycles (Fig. 2) were fragile and prone to collapse. With ≈1.6 nm thickness, the tube walls were obviously too thin to carry the own load and maintain the tubular shape. With increased numbers of ALD cycles (i.e., 25, 50, 100) TiTBs with a more stable tubular morphology were obtained. Their average wall thicknesses were approx. 3.4 nm, 6.8 nm, and 13.5 nm for the three different cycle numbers, respectively. Interestingly, the TiTBs obtained after annealing of the 50 ALD cycle coated fibers showed a brush-like tubular morphology. The reason for this brush-like morphology lies in the crystallization of the TiO2 coating during annealing. As the amorphous mass crystallizes, the side walls of the material thin down because atoms migrate from the original disordered mass to the crystal lattice. Such mass rearrangements are usually accompanied with compression of the material. For TiTBs prepared upon 12, 25, and 50 TiO2 ALD cycles, the wall thicknesses of the forming tubes were reduced during the annealing and the crystallization resulted in a partial rupture of the initially uniform coating along with the formation of distinct flaky TiO2 crystals. A more detailed information regarding the morphology can be obtained from additional TEM and HRTEM images shown in Fig. S2.† Therein the fiber walls show a high degree of porosity and the individual fibers are connected by TiO2 crystals, which stem from the crystallization of the amorphous TiO2 coating upon subsequent annealing. With 100 ALD cycles a coating thickness threshold was exceeded and the tube wall crystallized without significant morphological changes, as it occurred after fewer ALD cycles. In other words, the wall was able to disperse compression and expansion events during annealing and arrange the crystals without major cracks. The uniformity of the tube was also much higher in comparison with the other samples, as shown in Fig. 2d.
 | ||
| Fig. 2 TEM images of TiTBs obtained with: (a) 12, (b) 25, (c) 50, (d) 100 TiO2 ALD cycles. | ||
The specific surface areas (SBET) of the TiTBs were evaluated by Brunauer–Emmett–Teller (BET) analysis and are summarized in Table 1. The SBET of the TiTBs were increasing with increased number of ALD cycles from ∼3.21 m2 g−1 (12 ALD cycles) to ∼37.57 m2 g−1 (50 ALD cycles). This is attributed to the increased porosity and the brush-like morphology of the TiTBs at ALD 50 cycles, as seen in Fig. 1. Interestingly, increasing the number of ALD cycles from 12 to 25 resulted in a remarkable growth of the SBET by one order of magnitude. In contrast, doubling the number of ALD cycles from 25 to 50 did not further increase SBET but even decreased it to ∼22,7 m2 g−1 after 100 ALD cycles. This is ascribed to the morphological differences between TiTBs after 50 and 100 ALD cycles, as previously discussed (Fig. 1 and 2). The SBET was also measured for the standard P25 commercial TiO2 nanopowder, (SBET = ∼54.9 m2 g−1). Unlike TiTBs, the commercial P25 powder is formed of spherical particles, which caused a higher SBET.
| TiO2 ALD cycles | S BET [m2 g−1] | Outer diameters of TiTBs [nm] | Crystallite size (Scherrer method) [nm] | Quantitative ratio between phases (A:R:B) |
|
|---|---|---|---|---|---|
| Anatase | Rutile | ||||
| 12 | 3.21 ± 0.02 | 168 ± 54 | 16 | 26 | 85.6:14.4:0 |
| 25 | 32.85 ± 0.27 | 234 ± 41 | 18 | 28 | 68.8:30.2:1.0 |
| 50 | 37.57 ± 0.29 | 234 ± 69 | 23 | 19 | 86.5:10.7:2.8 |
| 100 | 22.7 ± 0.90 | 434 ± 188 | 63 | — | 100:0:0 |
| P25 | 54.9 ± 0.52 | — | 28 | 48 | 85.6:14.4:0 |
The PVP fibers with as-deposited TiO2 ALD coatings were amorphous, as confirmed by X-ray diffraction (XRD). The representative XRD pattern of a 200 ALD cycle sample is shown in Fig. S3.† With the amorphicity of the coatings after deposition with the highest number of ALD cycles used in this study, it is safe to state that any other thinner coating must be amorphous as well. On the one hand, after annealing at 500 °C, three different crystalline phases were identified in the TiTBs, as shown in Fig. 3. Namely, tetragonal anatase TiO2 with the space group P42/mnm (ICCD 01-086-1157), tetragonal rutile TiO2 with the space group I41/amd (ICCD 00-021-1276), and orthorhombic brookite TiO2 with the space group Pbca (ICDD 01-076-1937). However, brookite diffractions were only observed in TiTBs fabricated after 25 and 50 ALD cycles. On the other hand, pure anatase was identified in TiTBs after 100 ALD cycles. This is consistent with earlier findings,11 indicating that exceeding a specific wall thickness will result in pure anatase upon annealing. However, there is no clear trend in the overall results that could be easily explained, especially for the appearance of the high temperature phases rutile and brookite at low coating thicknesses. Crystallization is a complex thermodynamic process and is influenced by numerous factors.54
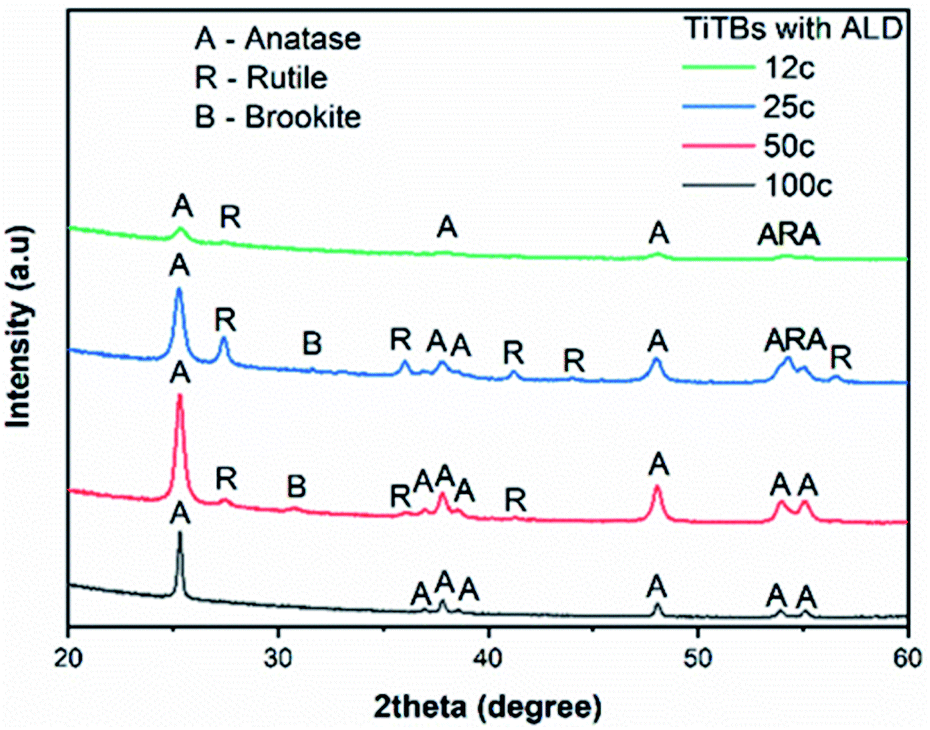 | ||
| Fig. 3 X-ray diffraction patterns of TiTBs obtained with 12, 25, 50, and 100 TiO2 ALD cycles. | ||
In general, phase transformation of TiO2 (from amorphous to crystalline) is primarily influenced by the annealing temperature and time.45,55 Additional factors that influence the amorphous to crystalline TiO2 transformation include the aspect ratio, the surface to volume ratio, morphology, and/or stoichiometry. Amorphous TiO2 thin films are prone to crystallize into stable (rutile) and metastable TiO2 polymorphs (anatase, brookite) upon annealing.56 Even though the exact mechanism, especially for brookite formation, is not clear, the stoichiometry, amount of oxygen vacancies, and the total thickness of the TiO2 are important factors regarding the amorphous to crystalline transformation of TiO2.
The crystallite size, calculated by Scherer's formula, was applied to estimate the TiO2 crystallite form (Table 1). A clear trend was observed for anatase, where the crystallite size grew from approx. 16 nm to 63 nm with increasing the number of ALD cycles. The fact that crystallites have a larger average size than the actual thickness of the ALD coating can be explained with asymmetric elongated crystals, viz. platelets, that compose the crystalline tube wall. For the rutile phase, the crystallite size of approx. 26 nm, 28 nm, and 19 nm for TiTBs with 12, 25, and 50 TiO2 ALD cycles was determined, respectively, showing an opposite trend to the anatase crystallites: smaller anatase crystallites are accompanied with larger rutile crystallites and vice versa. This indicates again a correlation of lower wall thickness with the formation of higher energetic phases.
Photocatalytic activity
All TiTBs were evaluated for their photocatalytic properties by means of degradation of aqueous methylene blue (MB) solution under irradiation with UV light (λ = 365 ± 5 nm). Nanoparticulate P25 served as a reference TiO2 photocatalyst. Fig. 4 shows the degradation rates of MB with the various TiO2 materials. The photocatalytic degradation of organic dyes in aqueous solutions typically follows the first-order reaction kinetics:4,57| lnc/c0 = −kt | (1) |
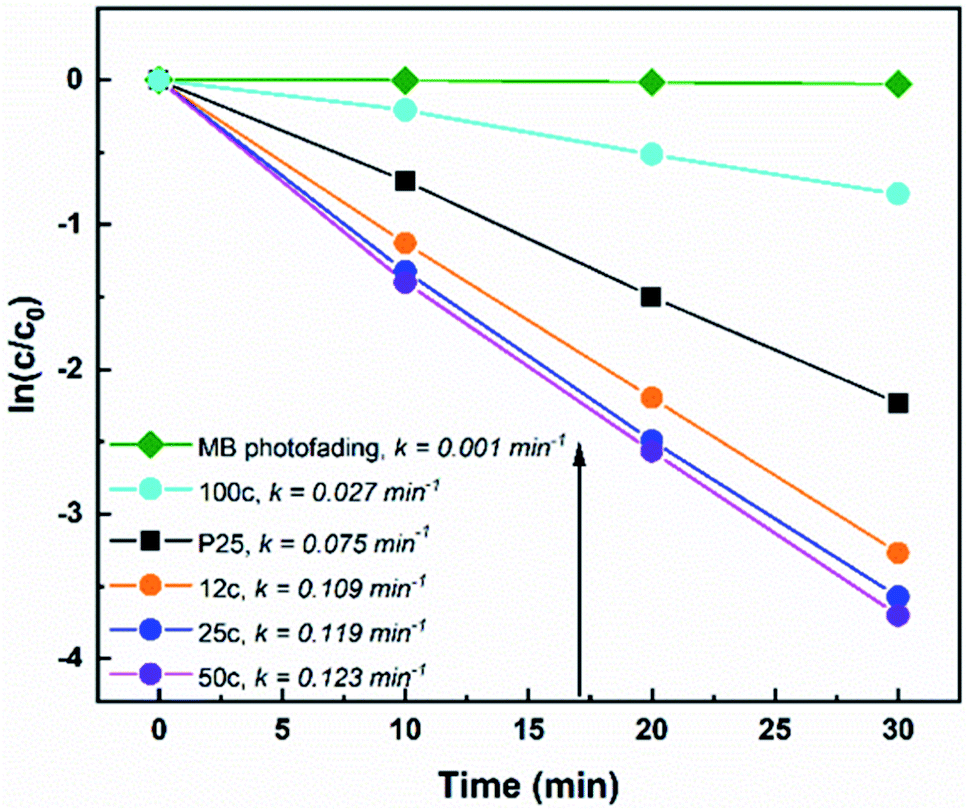 | ||
| Fig. 4 Photocatalytic degradation rates of methylene blue for TiTBs under UV light irradiation. “Xc” specifies the number of applied ALD cycles prior to annealing and k represents the kinetic rate constant. | ||
The reasons behind these results are very complex and will be further discussed. It is well known that the specific surface area, phase composition, and morphology of TiO2 are crucial parameters for the material's photocatalytic activity.4,57 The SBET of the samples are shown in Table 1. Indeed, the obtained SBET correlate with the photocatalytic activity trend of TiTBs with 50c (SBET = ∼38 m2 g−1) > 25c (SBET = ∼33 m2 g−1) > 12c (SBET = ∼3 m2 g−1). The specific surface area increased significantly (approx. 10 times) for TiTBs after 50 ALD cycles compared to that of TiTBs after 12 ALD cycles. As discussed earlier (SEM Fig. 1 and TEM Fig. 2), this is due to the brush-like morphology of the 50 ALD cycle TiTBs where the fiber walls show a high degree of porosity. TiTBs after 12 and 25 ALD cycles are composed of rather small TiO2 nanocrystals with an overall lower active surface area for photocatalysis. Interestingly, TiTBS after 12 ALD cycles show a relatively high photocatalytic activity, although they possess the lowest specific surface area, as they don't have the brush like morphology as the 50c samples. In addition, they have smaller diameter and slightly different size of crystals. However, it is not just the available surface area that is decisive for the photocatalytic performance. In this particular case, the interplay between all parameters yields the photocatalytic activity quite high. On the other hand, TiTBs after 100 ALD cycles have a rather low porosity with SBET = ∼23 m2 g−1 that overall show a rather poor photocatalytic activity. As discussed earlier (SEM, Fig. 1; TEM Fig. 2), TiTBs with different morphologies were obtained after applying different numbers of ALD cycles due to morphological changes during annealing that affected their total specific surface area. Interestingly, although P25 possesses the highest SBET = ∼55 m2 g−1, the photocatalytic activity was lower than that of 50, 25, and 12 ALD cycles TiTBs.
The present work is not the first example of nanofibers showing a better performance than the corresponding nanoparticles. There are numerous papers dealing with either dye-sensitized solar cells or various photocatalytic systems with the same tendency.58–61 At the first glance, it is the dimensionality of the materials (0D for nanoparticles, 1D for nanofibers) that is responsible for such an outcome. All these papers commonly assign this effect to a better charge separation and transport in 1D materials (nanofibers or nanotubes) than in 0D nanoparticles.58 In other words, more conduction band electrons are photogenerated within nanofibers and therefore more conduction band electrons are available in TiTBs than in P25. Consequently, the photoinduced degradation rates of MB are higher in TiTBs.
Moreover, several other aspects favor 1D materials over 0D ones for photocatalysis: (1) increased number of active sites on the surface of 1D compared to 0D materials, (2) enhanced conductivity and electron mobility that facilitate the transfer and separation of e−/h+ in 1D materials, and (3) increased contact surface and charge transfer rate.
However, there are also textural, optical and crystalline properties that come into play. The mesoporosity of the nanofibers, along with their suitable 1D geometry, has a positive effect on the enhanced number of adsorption/desorption sites compared to that in P25, which are three-dimensionally connected and do not necessarily offer so many reaction sites and good diffusion of the species.58,62 One has also to consider that within 1D structures, there are multiple light scattering events that provide a higher number of photons utilized for the UV charge separation.63–65 These events also contribute to an enhancement of the photocatalytic reactions at the fiber/dye interface and result in an increased photocatalytic activity.
Last, but not least, also the crystallinity of the TiO2 matters. P25 contains small amounts of rutile in predominantly anatase TiO2 which is suitable for the charge carrier separation. Such a phase composition is considered optimal for photocatalysis.66 Interestingly, the crystallinity of the best performing sample (TiTBs with 50 ALD cycles), has a similar anatase:rutile ratio.
Considering all these various aspects, one can state that the interplay of structure and composition is in favour of the photocatalytic properties of the herein presented TiTBs (in particular those produced with 50 ALD cycles) more than those of the reference P25 nanoparticles.
Conclusions
In summary, titania tubes (TiTBs) were developed by coating of centrifugally spun PVP fibers with TiO2 by ALD, applying 12, 25, 50, or 100 ALD cycles and subsequent annealing. A tubular morphology was obtained in all cases with the tubewall thicknesses being a function of the applied number of ALD cycles. The mechanical integrity of the tubes notably increased with the coating thickness. Interestingly, a very pronounced texture with high porosity was observed in TiTBs obtained after 50 ALD cycles (with wall thicknesses of about 7 nm). The TiTBs were found to be polycrystalline with varying ratios of anatase, rutile and brookite. Pure anatase was observed only in tubes with a TiO2 coating formed after 100 ALD cycles. Besides morphological analyses, the specific surface area and photocatalytic activity were determined for the various tubes. The photocatalytic tests against reference TiO2 P25 nanoparticles showed an outstanding performance of the TiTBs. In particular the 50 ALD cycle TiTB yielded the highest photocatalytic degradation rates of methylene blue, owing to combination of the large surface area, efficient charge separation and also suitable crystallinity. The herein presented approach offers manifold opportunities for lab scale as well as industrial scale production of various metal oxide nanotubular structures.Author contributions
Martina Rihova: writing – original draft, investigation, visualization. Oksana Yurkevich: investigation, validation, methodology. Martin Motola: investigation, visualization, writing – reviewing and editing. Ludek Hromadko: investigation. Zdenek Spotz: investigation. Raul Zazpe: methodology, Mato Knez: methodology, resources, writing – reviewing and editing, supervision. Jan M. Macak: supervision, conceptualization, writing – reviewing and editing, resources.Conflicts of interest
There are no conflicts to declare.Acknowledgements
The work was supported by the Ministry of Education, Youth and Sports of the Czech Republic (CZ.02.1.01/0.0/0.0/17_048/0007421). The CzechNanoLab project LM2018110 funded by MEYS CR is gratefully acknowledged for the financial support of XRD and TEM measurements at CEITEC Nano Research Infrastructure. We thank prof. Roman Bulanek and Mrs Veronika Cicmancova (University of Pardubice) for conducting BET measurements and PVP fiber production, respectively. We thank to Dr Eva Kolibalova and Mr Jan Michalicka (CEITEC BUT) for conducting TEM measurements. M. K. and O. Y. acknowledge funding from the European Union's Horizon 2020 research and innovation programme under the Marie Sklodowska-Curie grant agreement no. 765378, the Spanish Ministry of Science and Innovation (Grant Agreement No. PID2019-111065RB-I00), including FEDER funds, and the Maria de Maeztu Units of Excellence Programme (grant number MDM-2016-0618).Notes and references
- X. Wang, Z. Li, J. Shi and Y. Yu, Chem. Rev., 2014, 114, 9346–9384 CrossRef CAS.
- K. Lee, A. Mazare and P. Schmuki, Chem. Rev., 2014, 114, 9385–9454 CrossRef CAS.
- T. Kasuga, M. Hiramatsu, A. Hoson, T. Sekino and K. Niihara, Langmuir, 1998, 14, 3160–3163 CrossRef CAS.
- A. L. Linsebigler, G. Lu and J. T. Yates, Chem. Rev., 1995, 95, 735–758 CrossRef CAS.
- J. M. Macak, H. Tsuchiya, L. Taverira, S. Aldabergerova and P. Schmuki, Angew. Chem., 2005, 44, 7463–7465 CrossRef CAS PubMed.
- S. P. Albu, A. Ghicov, J. M. Macak and P. Schmuki, Phys. Status Solidi RRL, 2007, 1, R65–R67 CrossRef CAS.
- J. M. Macak, H. Hildebrand, U. Marten-Jahns and P. Schmuki, J. Electroanal. Chem., 2008, 621, 254 CrossRef CAS.
- B. Wang, D. Xue, Y. Shi and F. Xue, Titania 1D nanostructured materials: synthesis, properties and applications, in Nanorods, Nanotubes and Nanomaterials Research Progress, ed, W. V. Prescott and A. I. Schwartz, New Nova Science Publishers Inc., 2008, pp.163–201 Search PubMed.
- H.-W. Liang, S. Liu and S.-H. Yu, Adv. Mater., 2010, 22, 3925–3937 CrossRef CAS.
- Q. Peng, X.-Y. Sun, J. C. Spagnola, G. K. Hyde, R. J. Spontak and G. N. Parsons, Nano Lett., 2007, 7, 719–722 CrossRef CAS PubMed.
- G.-M. Kim, S.-M. Lee, G. H. Michler, H. Roggendorf, U. Gösele and M. Knez, Chem. Mater., 2008, 20, 3085–3091 CrossRef CAS.
- E. Santala, M. Kemell, M. Leskelä and M. Ritala, Nanotechnology, 2009, 20, 035602 CrossRef.
- I. M. Szilágyi and D. Nagy, J. Phys.: Conf. Ser., 2014, 559, 012010 CrossRef.
- Z.-M. Huang, Y.-Z. Zhang, M. Kotaki and S. Ramakrishna, Compos. Sci. Technol., 2003, 63, 2223–2253 CrossRef CAS.
- A. Frenot and I. S. Chronakis, Curr. Opin. Colloid Interface Sci., 2003, 8, 64–75 CrossRef CAS.
- S. Padron, A. Fuentes, D. Caruntu and K. Lozano, J. Appl. Phys., 2013, 113, 024318 CrossRef.
- B. Vazquez, H. Vasquez and K. Lozano, Polym. Eng. Sci., 2012, 52, 2260–2265 CrossRef CAS.
- M. Rihova, A. E. Ince, V. Cicmanova, L. Hromadko, K. Castkova, D. Pavlinak, L. Vojtova and J. M. Macak, J. Appl. Polym. Sci., 2021, 38, 1–14 Search PubMed.
- M. Leskelä and M. Ritala, Adv. Electron. Mater., 2003, 42, 5548–5554 Search PubMed.
- G. N. Parsons, S. George and M. Knez, MRS Bull., 2011, 36, 865–871 CrossRef CAS.
- M. Knez, A. Kadri, C. Wege, U. Gösele, H. Jeske and K. Nielsch, Nano Lett., 2006, 6, 1172–1177 CrossRef CAS PubMed.
- G. K. Hyde, K. J. Park, M. Stewart, J. P. Hinestroza and G. N. Parsons, Langmuir, 2007, 23, 9844–9849 CrossRef CAS PubMed.
- W.-S. Kim, B.-S. Lee, D.-H. Kim, H.-C. Kim, W.-R. Yu and S.-H. Hong, Nanotechnology, 2010, 21, 245605 CrossRef PubMed.
- B.-S. Lee, W.-S. Kim, D.-H. Kim, H.-C. Kim, S.-H. Hong and W.-R. Yu, Smart Mater. Struct., 2011, 20, 105019 CrossRef.
- S. Cho, D.-H. Kim, B.-S. Lee, J. Jung, W.-R. Yu, S.-H. Hong and S. Lee S, Sens. Actuators, B, 2012, 162, 300–306 CrossRef CAS.
- A. A. Chaaya, M. Bechelany, S. Balme and P. Miele, J. Mater. Chem., 2013, 2, 20650–20658 RSC.
- D. B. Dwyer, D. T. Lee, S. Boyer, W. E. Bernier, N. Parsons and W. E. Jones Jr, ACS Appl. Mater. Interfaces, 2018, 10, 25794–25803 CrossRef CAS PubMed.
- F. Kayaci, S. Vempati, I. Donmez, N. Biyikli and T. Uyar, Nanoscale, 2014, 6, 10224–10234 RSC.
- S. Vempati, F. Kayaci-Senirmak, C. Ozgit-Akgun, N. Biyikli and T. Uyar, J. Phys. Chem. C, 2015, 119, 23268–23273 CrossRef CAS.
- F. Kayaci, C. Ozgit-Akgun, I. Donmez, N. Biyikli and T. Uyar, ACS Appl. Mater. Interfaces, 2012, 4, 6185–6194 CrossRef CAS.
- I. Domnez, F. Kayaci, C. Ozgit-Akgun, T. Uyar and N. N. Biyikli, J. Alloys Compd., 2013, 559, 146–151 CrossRef.
- F. Kayaci, C. Ozgit-Akgun, N. Biyikli and T. Uyar, RSC Adv., 2013, 3, 6817–6820 RSC.
- A. Haider, C. Ozgit-Akgun, F. Kayaci, A. K. Okyay, T. Uyar and N. Biyikli, APL Mater., 2014, 2, 096109 CrossRef.
- C. Ozgit-Akgun, F. Kayaci, S. Vempati, A. Haider, A. Celebioglu, E. Goldenberg, S. Kizir, T. Uyar and N. Biyikli, J. Mater. Chem. C, 2015, 3, 5199–5206 RSC.
- C. J. Oldham, B. Gong, J. C. Spagnola, J. S. Jur, K. J. Senecal, T. A. Godfrey and G. N. Parsons, ECS Trans., 2010, 33, 279–290 CrossRef CAS.
- C. D. McClure, C. J. Oldham, H. J. Walls and G. N. Parsons, J. Vac. Sci. Technol., A, 2013, 31, 061506 CrossRef.
- Z. Wang, L. Zhang, Z. Liu, L. Sang, L. Yang and Q. Chen, Nanoscale Res. Lett., 2017, 12, 1–8 CrossRef PubMed.
- B. V. M. Rodrigues, V. M. Dias, M. A. Fraga, A. S. da Silva Sobrinho, A. O. Lobo, H. S. Maciel and R. S. Pessoa, Mater. Today, 2019, 14, 656–662 CAS.
- D. Li, J. T. McCann, Y. Xia and M. Marquez, J. Am. Ceram. Soc., 2006, 89, 1861–1869 CrossRef CAS.
- D. Lubasova, H. Niu, X. Zhao and T. Lin, RSC Adv., 2015, 5, 54481–54487 RSC.
- U. Bunyatova, Z. M. O. Rzayev and M. Simşek, eXPRESS Polym. Lett., 2016, 10, 598–616 CrossRef CAS.
- S.-W. Choi, J. Y. Park, C. Lee, J. G. Lee and S. S. Kim, J. Am. Chem. Soc., 2011, 94, 1974–1977 CAS.
- M.-H. Jung, Y. J. Yun, M.-J. Chu and M. G. Kang, Chem.–Eur. J., 2013, 19, 8543–8549 CrossRef CAS PubMed.
- F. Kayaci, S. Vempati, C. Ozgit-Akgun, I. Donmez, N. Biyikli and T. Uyar, Nanoscale, 2014, 6, 5735–5745 RSC.
- C. L. de Dicastillo, C. Patiño, M. J. Galotto, J. L. Palma, D. Alburquenque and J. Escrig, Nanomaterials, 2018, 8, 1–17 Search PubMed.
- M. Putkonen, P. Heikkilä, A. T. Pasanen, H. Rautkoski, L. Svärd, P. Simell and M. Vähä-Nissi, J. Vac. Sci. Technol., A, 2018, 36, 01A102 CrossRef.
- P. Heikkilä, T. Hirvikorpi, H. Hilden, J. Sievänen, L. Hyvärinen, A. Harlin and M. Vähä-Nissi, J. Mater. Sci., 2012, 47, 3607–3612 CrossRef.
- C. Xu, H. Wang, J. Song, X. Bai, Z. Liu, M. Fang, Y. Yuan, J. Sheng, X. Li, N. Wang and H. Wu, J. Am. Ceram. Soc., 2017, 101, 1677–1683 CrossRef.
- O. Kéri, E. Kocsis, Z. K. Nagy, B. Parditka, Z. Erdélyi and I. M. Szilágyi, Rev. Roum. Chim., 2018, 63, 401–406 Search PubMed.
- X. Fang, S. Li, X. Wang, F. Fang, X. Chu, Z. Wei, J. Li, Z. Chen and F. Wai, Appl. Surf. Sci., 2012, 263, 14–17 CrossRef CAS.
- G.-M. Kim, S.-M. Lee, M. Knez and P. Simon, Thin Solid Films, 2014, 562, 291–298 CrossRef CAS.
- X. Chen, Y. Zhai, J. Li, X. Fang, F. Fang, X. Chu, Z. Wei and X. Wang, Appl. Surf. Sci., 2014, 319, 216–220 CrossRef CAS.
- A. Katoch, Z. U. Abideen, J.-H. Kim and S. S. Kim, Sens. Actuators, B, 2016, 232, 698–704 CrossRef CAS.
- J.-Y. Huang, K.-Q. Zhang and Y.-K. Lai, Int. J. Photoenergy, 2013, 2013, 1–19 Search PubMed.
- D. A. H. Hanaor and C. C. Sorrell, J. Mater. Sci., 2011, 46, 855–874 CrossRef CAS.
- J. S. Mangum, O. Agirseven, J. E. S. Haggerty, J. D. Perkins, L. T. Schelhas, D. A. Kitchaev, L. M. Garten, D. S. Ginley, M. F. Toney, J. Tate and B. P. Gorman, J. Non-Cryst. Solids, 2019, 505, 109–114 CrossRef CAS.
- J. Schneider, M. Matsuoka, M. Takeuchi, J. Zhang, Y. Horiuchi, M. Anpo and D. W. Bahnemann, Chem. Rev., 2014, 114, 9919–9986 CrossRef CAS PubMed.
- S. K. Choi, S. Kim, S. K. Lim and H. Park, J. Phys. Chem. C, 2010, 114, 16475–16480 CrossRef CAS.
- N. Lakshminarasimhan, E. Bae and W. J. Choi, J. Phys. Chem. C, 2007, 111, 15244–15250 CrossRef CAS.
- L. Hu, X.-W. Yan, X.-J. Zhang and D. Shan, Appl. Surf. Sci., 2018, 48, 819–824 CrossRef.
- K. Rajeshwar, M. E. Osugi, W. Chanmanee, C. R. Chenthamarakshan, M. V. B. Zanoni, P. Kajitvichyanukul and R. Krishnan-Ayer, J. Photochem. Photobiol., C, 2008, 9, 71–192 CrossRef.
- S. J. Doh, C. Kim, S. G. Lee, S. J. Lee and H. Kim, J. Hazard. Mater., 2008, 154, 118–127 CrossRef CAS PubMed.
- J. Yang, H. Wu, M. Wang and Y. Liang, Int. J. Heat Mass Transfer, 2008, 117, 729–739 CrossRef.
- N. Bao, G. Wu, J. Niu, Q. Zhang, S. He and J. Wang, J. Alloys Compd., 2014, 599, 40–48 CrossRef CAS.
- R. Zazpe, H. Sopha, J. Prikryl, M. Krbal, J. Mistrik, F. Dvorak, L. Hromadko and J. M. Macak, Nanoscale, 2018, 10, 16601–16612 RSC.
- R. I. Bickley, T. Gonzalez-Carreno, J. S. Lees, L. Palmisano and R. J. D. Tilley, J. Solid State Chem., 1991, 92, 178–190 CrossRef CAS.
Footnotes |
| † Electronic supplementary information (ESI) available: SEM, TEM, XRD. See DOI: 10.1039/d1na00288k |
| ‡ Present address: Department of Inorganic Chemistry, Faculty of Natural Sciences, Comenius University in Bratislava, Ilkovicova 6, 842 15 Bratislava, Slovakia. |
| This journal is © The Royal Society of Chemistry 2021 |