
 Open Access Article
 This Open Access Article is licensed under a Creative Commons Attribution-Non Commercial 3.0 Unported Licence
Metal nanoparticles entrapped in metal matrices†
Dina
Pinsky
 a,
Noam
Ralbag
a,
Ramesh Kumar
Singh
bc,
Meirav
Mann-Lahav
b,
Gennady E.
Shter
b,
Dario R.
Dekel
*bc,
Gideon S.
Grader
*bc and
David
Avnir
*a
a,
Noam
Ralbag
a,
Ramesh Kumar
Singh
bc,
Meirav
Mann-Lahav
b,
Gennady E.
Shter
b,
Dario R.
Dekel
*bc,
Gideon S.
Grader
*bc and
David
Avnir
*a
aInstitute of Chemistry and the Center for Nanoscience and Nanotechnology, The Hebrew University of Jerusalem, Jerusalem 9190401, Israel. E-mail: David.Avnir@mail.huji.ac.il
bThe Wolfson Department of Chemical Engineering, Technion-Israel Institute of Technology, Haifa 3200003, Israel. E-mail: dario@technion.ac.il; grader@technion.ac.il
cThe Nancy & Stephen Grand Technion Energy Program (GTEP), Technion –Israel Institute of Technology, Haifa 3200003, Israel
First published on 14th July 2021
Abstract
We developed synthetic methods for the doping of metals (M) with metallic nanoparticles (NPs). To the best of our knowledge – unlike oxides, polymers and carbon-based supports – metals were not used so far as supporting matrices for metallic NPs. The composites (denoted M1-NPs@M2) comprise two separate phases: the metallic NPs (the dopant) and the entrapping 3D porous metallic matrix, within which the NPs are intimately held and well dispersed. Two different general synthetic strategies were developed, each resulting in a group of materials with characteristic structure and properties. The first strategy uses pre-prepared NPs and these are entrapped during reductive formation of the metallic matrix from its cation. The second strategy is in situ growth of the doped metallic NPs within the pre-prepared entrapping metallic matrix. These two methods were developed for two types of entrapping metallic matrices with different morphologies: porous aggregated metallic matrices and metallic foams. The leading case in this study was the use of Pt as the NP dopant and Ag as the entrapping matrix, using all of the four combinations – entrapment or growth within aggregated Ag or Ag foam matrices. Full physical and chemical properties analysis of these novel types of materials was carried out, using a wide variety of analytical methods. The generality of the methods developed for these bi-metallic composites was investigated and demonstrated on additional metallic pairs: Au NPs within Ag matrices, Pd NPs within Ni matrices and Ir-NPs within a Rh matrix. As the main application of metallic NPs is in catalysis, the catalytic activity of M1-NPs@M2 is demonstrated successfully for entrapped Pt within Ag for reductive catalytic reactions, and for Pd within Ni for the electrocatalytic hydrogen oxidation reaction.
1. Introduction
Metallic nanoparticles (NPs) have entered practically every modern facet of the natural sciences, including catalysis, optics, sensing, biomedicine, and more. Many of these applications require the dispersion of the NPs in or on solid supports, in order to avoid their aggregation, to ease their transport and after-use separation, to allow their use as components in devices, and to stabilize them against environmental deterioration. The solid-materials world, offers three large families of supports for metallic NPs: (I) ceramics and glasses (such as silica, alumina, zirconia, titania, etc., in the forms of sol–gel matrices, aerogels, zeolites and more1); (II) carbon-based materials (polymers, plastics, MOFs, biopolymers, various forms of carbon2); and, (III) metals. Of these three families, the first two have been used intensively as supports of metallic NPs, but not – and this comes as a surprise – the third large family of metals. The main focus of this report is to draw attention to the concept of using metals as supports of metallic NPs, and to offer synthetic routes for such immobilizations. Many of the physical and chemical properties of metals are unique to this family, which has properties not found in the plentitude of non-metallic supports that have been used so far: metals are excellent electric conductors; they are excellent heat conductors; they are malleable and ductile to desired shapes; many of the metals are biocompatible (Au, Pt) and chemically stable; endless alloy combinations allow fine tuning of desired properties; dual activity of metallic dopant and matrix become possible; and synergism between dopant and matrix may emerge (as shown in this report). All of these expand the arsenal of the materials in the design of catalytic, electrocatalytic, and sensing systems. It should be noted that bimetallic (or multi-metallic) materials can also form alloys in which one element penetrates into the crystal lattice of another3 forming “solid solutions”; we refer, however, to a metallic composite in which the supporting matrices and the entrapped NP metals are well defined different phases. It is also of relevance to mention metal–metal core–shell materials, for instance, Au-core/Pd-shell NPs4,5 and Pd-core/Pt-shell;6 yet in this architecture, the exposed surface is of the shells only, unlike high surface area porous supports of NPs.Of the two approaches we developed for obtaining metal-entrapped metals (denoted M1-NP@M2), the first one requires introductory background, as it uses a special materials methodology, namely that of molecularly doped metals.7,8 This methodology allows the three-dimensional (3D) encaging of dopants in porous metallic matrices, that is, the molecule is surrounded all around it by metallic NPs in cages which keep it from being washed away, while allowing accessibility through the interstitial porosity of the aggregates. It is quite general and a wide variety of dopants – dyes, antibacterial agents and drugs, enzymes, polymers, chiral molecules, and catalytic complexes, have been entrapped in various metals, including Ag, Pt, Pd, Cu, Fe, Co, Au, and various alloys.7,8 Recently, this methodology was extended to the entrapment of non-metallic NPs as dopants: ceria-NPs@Pd,9 magnetic strontium hexaferrite-NPs@coin metals10 and CdSe/CdS core-SiO2 shell entrapped in thin films of Au.11 The main methods for obtaining these dopant@M materials are based on the reduction of the metal cation of the entrapping metal in the presence of the dopant to be entrapped, and specific reduction processes include using homogeneous reducing agents, heterogeneous reducing agents, using the solvent for the reduction, electrochemical reduction and more.8 As in the case of molecules, a NP-dopant is held tightly inside the cages of the aggregated porous matrix, but on the other hand, is accessible to react with external reagents. There are significant differences between this 3D entrapment process and 2D adsorption: the adsorbed dopant is exposed, while the 3D entrapment protects the molecule all around it; while in adsorption or covalent attachment, only one moiety of the molecule is in contact with the metal, in the 3D entrapment all parts of it touch the metal; and, while adsorbed molecules are easily washed, entrapped ones are difficult to extract.12 Nevertheless, the accessibility of the dopant for the external environment opens applications such as catalysis and sensing. While the first method for obtaining M1-NP@M2 utilized pre-prepared M1-NPs and the reductive synthesis of M2, the second approach presented here does the opposite: it utilized pre-prepared porous matrix of M2, and synthesizes the M1-NPs using the M2 as a reducing agent – this is described in detail below.
The two methods for entrapping metallic NPs were developed for two types of metallic matrices with different morphologies: porous aggregated matrices, and metal-foam matrices. All and all, we have therefore four options for M1-NP@M2, each with its unique characteristics and properties, as detailed below. Pt as a dopant and Ag as an entrapping metallic matrix were chosen as a leading case of this report and are described in detail. The generality of the methods developed was investigated and demonstrated on several additional metallic pairs: Au-NPs within Ag matrices, Pd-NPs within Ni matrices and Ir-NPs within Rh matrix. As the main application of metallic NP has been their use as supported catalysts, we demonstrate the feasibility of the use of metals as supports of catalytic metallic NPs – we believe for the first time – on two catalytic processes: Pt-catalyzed reductive degradations of dyes with Pt-NPs entrapped in silver and the electrocatalytic hydrogen oxidation reaction (HOR) with Pd-NPs in Ni.
2. Experimental details
2.1 Chemicals, instrumentation and analytical methods
See ESI, Sections 1.1 and 1.2.†2.2 Materials syntheses
| NPs element | Pt | Au | Ir | Pd |
|---|---|---|---|---|
| Size (nm) | 1.7 ± 0.4 | 1.9 ± 0.7 | 1.7 ± 0.6 | 2.8 ± 0.8 |
2.3. Catalysis
![[thin space (1/6-em)]](https://www.rsc.org/images/entities/char_2009.gif) :MO:NaBH4 was kept 1:10:200 for all composites. For the determination of activation energy in the MO reaction, the above procedure was conducted at different temperatures.
:MO:NaBH4 was kept 1:10:200 for all composites. For the determination of activation energy in the MO reaction, the above procedure was conducted at different temperatures.
Recycling test was carried out as follows: 1 mL of MO stock solution (125.5 mg in 50 mL TDW) was mixed with 600 μL of NaBH4 solution (48.6 mg in 7 mL TDW) and kept in a close vial in an ice bath. 1 mg of Pt@Ag composite was placed in a 4 mL glass cuvette, filled with 3 mL of TDW and equipped with a magnetic stirrer. The spectrophotometric measurements started with the addition of 160 μL of MO-NaBH4 solution to the cuvette. Once the absorbance of the solution reached 50% of its initial value, another portion of 80 μL of MO solution (1 mL of stock solution + 600 μL of TDW) was added, and this was repeated for additional three times (four in total). Then the upper solution was decanted, the catalyst cleaned with TDW and acetone and the same four-additions process was repeated two additional times.
:K3[Fe(CN)6]:Na2S2O3 was set to 1:20:200 for all composites. Recycling test was carried out as follows: 1.5 mg of Pt@Ag composite was placed in a glass cuvette, filled with 2.5 mL of TDW and equipped with a magnetic stirrer. The spectrophotometric measurements were performed at a fixed wavelength of 425 nm. 215 μL of Na2S2O3 solution (136 mg in 4 mL) were added to the cuvette followed by the addition 230 μL of K3[Fe(CN)6] stock solution (32.6 mg in 5 mL), after which the spectrophotometric measurement started. At the end of each cycle, the upper solution was decanted and the catalyst was washed with acetone and water.
3. Results and discussion
3.1 Terminology and notations
For clarity of the presentation of the results and discussion, here are the notations and terminology of the four main types of metallic hybrids we present (see Experimental details):Type-A, denoted M1@M2: entrapment of M1-NPs within porous M2.
Type B, denoted M1@M2-foam: entrapment of M1-NPs within a foam of M2. The porous M2 and the M2 foam are different materials, as explained below.
Type C, denoted M1-grown@M2: in situ growth of M1 inside porous M2.
Type D, denoted M1-grown@M2-foam: in situ growth of M1 inside M2-foam.
In what follows, we shall describe in detail the four types for platinum entrapped in silver, adding main comparative comments regarding the other metal systems – Au within Ag, Ir within Rh, and Pd within Ni; further full details for these additional systems are collected in the ESI.†
3.2 The syntheses the doped metals
After intensive preliminary tests, the chosen optimal load was found to be around 3 wt% of Pt-NPs (see ESI Section 2.1† for discussion comments of their synthesis). This loading also applies to all other bimetallic composites described below and was ensured by careful testing of the supernatant solutions of the various syntheses. The entrapping matrices were either aggregated Ag (termed here porous Ag) or silver foam (so-termed), which are prepared differently. As already mentioned in the introduction, the synthetic approach towards the entrapment of Pt-NPs within Ag (Pt@Ag – type A and Pt@Ag-foam – type B) was based on the principles of the methodology of molecularly doped metals and its extension to functional NPs entrapped within metals. For type-A, the reductive entrapping reaction is:| 2AgNO3(aq) + H3PO2(aq) + H2O(l) ⇒ 2Ag(s) + H3PO3(aq)+ 2HNO3(aq), |
in the presence of Pt-NPs. The reducing agent, hypophosphorous acid, is a modification of the previously widely used sodium hypophosphite in other syntheses of dopant@metal,16,17 which was found to be optimal for the entrapment of the NPs. Gradual reduction and aggregation of the silver then occur, during which the NPs are tightly entrapped within the formed matrix.
For type B, the silver foam, the reducing agent of choice is sodium borohydride, NaBH4.9 The reason is the dual role of this agent – it is used both as a reducing agent for the Ag+ cations, and as a foaming agent since it evolves hydrogen gas while reacting with the aqueous reaction medium. Therefore, in this case, the reducing agent is used in an excess of 5 molar ratio compared to the AgNO3. The entrapping reaction carried out in the presence of Pt-NPs is:
| 8AgNO3(aq) + BH4(aq)− + 3H2O(l) ⇒ 8Ag(s) + B(OH)3(aq) + 7H+(aq) +8NO3(aq)−, |
| BH4(aq)− + 4H2O(l) ⇒ B(OH)4(aq)− + 4H2(g). |
While in the above-described types A and B the a-priori preparation is of the Pt-NPs, in types C and D the a-priori preparation is of the porous and foamy Ag matrices. Here the precursor metal salt is adsorbed within the pre-prepared matrix reaching all of internal pores surface, which is then reduced upon contact with the Ag to metallic Pt:
| 4Ag(s) + Pt(aq)4+ ⇒ Pt(s) + 4Ag(aq)+. |
PVP is added too in order to affect separation between the Pt particles to be formed, avoiding a continuous Pt layer.
We move next to the other bimetallic systems: for the gold within silver materials types A and B, gold NPs (very widely studied and attracting a lot of attention in the last decades18) were synthesized with PVP as a capping agent (similarly to the synthesis of Pt-NPs)19 according to:
| 8Au(aq)3+ + 3BH4(aq)− + 9H2O(l) ⇒ 8Au + 3B(OH)3(aq) + 21H(aq)+. |
After the cleaning of the NPs (average size 1.9 nm) from the PVP they were entrapped within porous Ag and Ag foam using H3PO2 and NaBH4 as reducing agents, respectively, as described for the entrapment of Pt-NPs. For the in situ Au-grown composites, the Ag matrices were used for the generation of the Au in the matrix's pores by the following reaction:
| 3Ag(s) + Au(aq)3+ ⇒ Au(s) + 3Ag(aq)+. |
Due to the high surface area of the metallic foams (see next section), which makes them potentially useful for catalytic applications, two additional type-B doped foams were prepared, Ir@Rh-foam and Pd@Ni-foam (average NPs sizes of 1.7 nm and 2.8 nm, respectively). Ir NPs were synthesized according to:20
| 8Ir(aq)3+ + 3BH4(aq)− + 9H2O(l) ⇒ 8Ir + 3B(OH)3(aq) + 21H(aq)+, |
which were entrapped within a foam Rh matrix according to:
| 8Rh(aq)3+ + 3BH4(aq)− + 9H2O(l) ⇒ 8Rh(s) + 3B(OH)3(aq) + 21H(aq)+. |
Using an excess of X15 mole BH4− for the foaming. Likewise, for Pd@Ni-foam, the Pd-NPs stabilized with PVP, were synthesized according to:21
| 4Pd(aq)2+ + BH4(aq)− + 3H2O(l) ⇒ 4Pd + B(OH)3(aq) + 7H(aq)+. |
In this case, the NPs were entrapped with the PVP coating because its removal caused their aggregation. However, the PVP was washed after the entrapment. The entrapping metallic Ni foam was prepared, as in the previous composites, by using NaBH4 as a reducing agent:
| 4Ni(aq)2+ + BH4(aq)− + 3H2O(l) ⇒ 4Ni (s) + B(OH)3(aq) + 7H(aq)+. |
An excess of 10 times mole BH4− was used for foaming as described above.
Last but not least, in order to further demonstrate the generality of the approach to other porous surface area metallic supports, another type of Ni doped with palladium was prepared, using this time electrospun Ni fibers, about 250 nm in diameter and 1 micron long, synthesized by hydrogen reduction from NiO mats (provided generously by the authors of ref. 40). On these Ni fibers, Pd was in situ grown to form Pd-grown@Ni-fiber (similar to type C), according to:
| Ni(s) + Pd(aq)2+ ⇒ Pd(s) + Ni(aq)2+. |
As described in the next section, the Ir–Rh and Pd–Ni syntheses are accompanied by some oxidation. Customarily, prior to the use of these metals for catalysis, they undergo a hydrogen reductive activation process.
3.3 Material characterizations – the four Pt-in-Ag systems
We focus in this section on the materials characterization of the platinum within silver systems, as the leading case. The full material characterization of all other bimetallic M1@M2 systems, along with comparison to the observations summarized here, appear in the ESI, Section 2.3.†:1.2) resulting in a slow reduction (8 hours), which encourages the growth process over the nucleation. On the other hand, the foam is obtained by reduction with a larger excess (ratio of 1:5) of a stronger reducing agent, NaBH4, during which an H2 gas is being evolved, thus resulting in smaller particles and foam-like structure. It is also noticed that the Ag aggregates of Pt@Ag are composed of two populations: smaller undefined aggregates and larger highly ordered aggregates of triangular and hexagonal form. The ordered aggregates are formed due to the presence of PVP in the synthesis, which binds selectively to a certain facet in the crystal (〈100〉 in the case of Ag), directing its growth on other facets, creating the observed shapes.22 In the Pt@Ag-foam composite, these two populations are not observed, regardless of the presence of PVP in the synthesis, since the reduction of the matrix is much faster, causing a preference to the nucleation process over the growth of the matrix's aggregates.
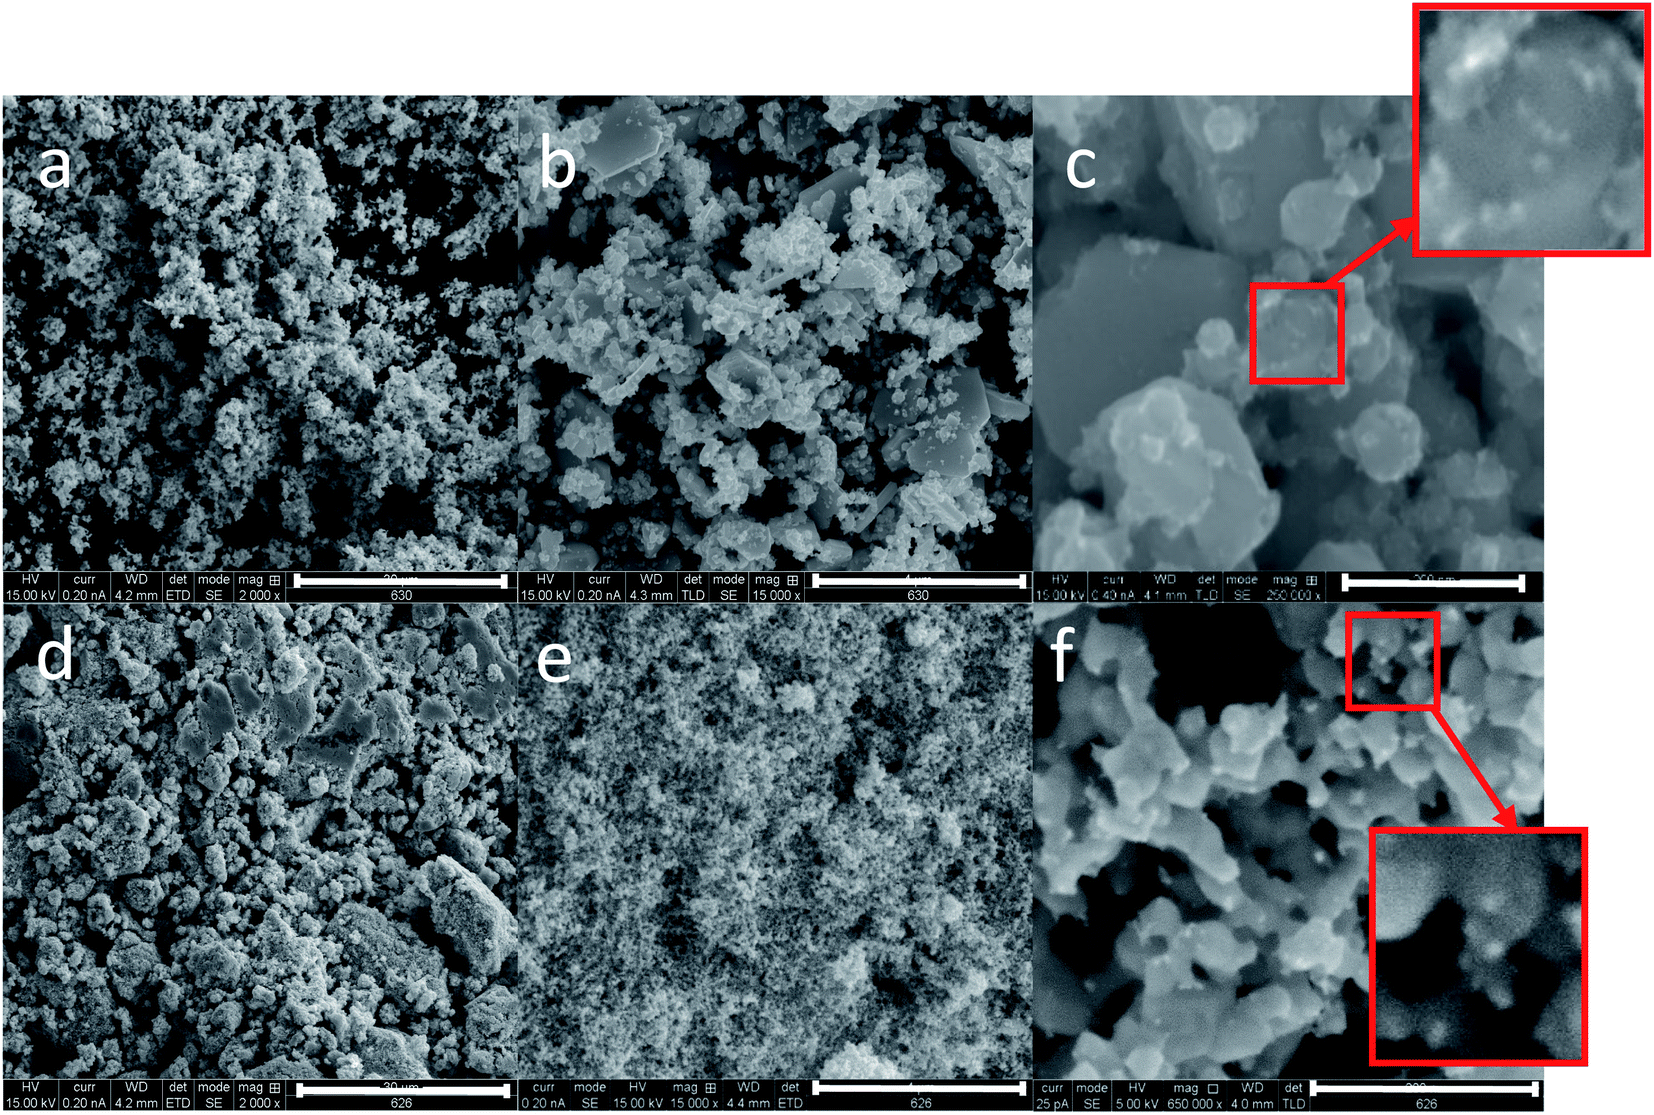 | ||
| Fig. 1 XHR-SEM images of entrapped platinum NPs within silver composites: (a–c) Pt@Ag, (d–f) Pt@Ag-foam. Pt-NPs of approximately 2 nm can be seen inside the enlarged squares. Bars: (a and d): 30 μm; (b and e): 4 μm; (d and f): 200 nm. | ||
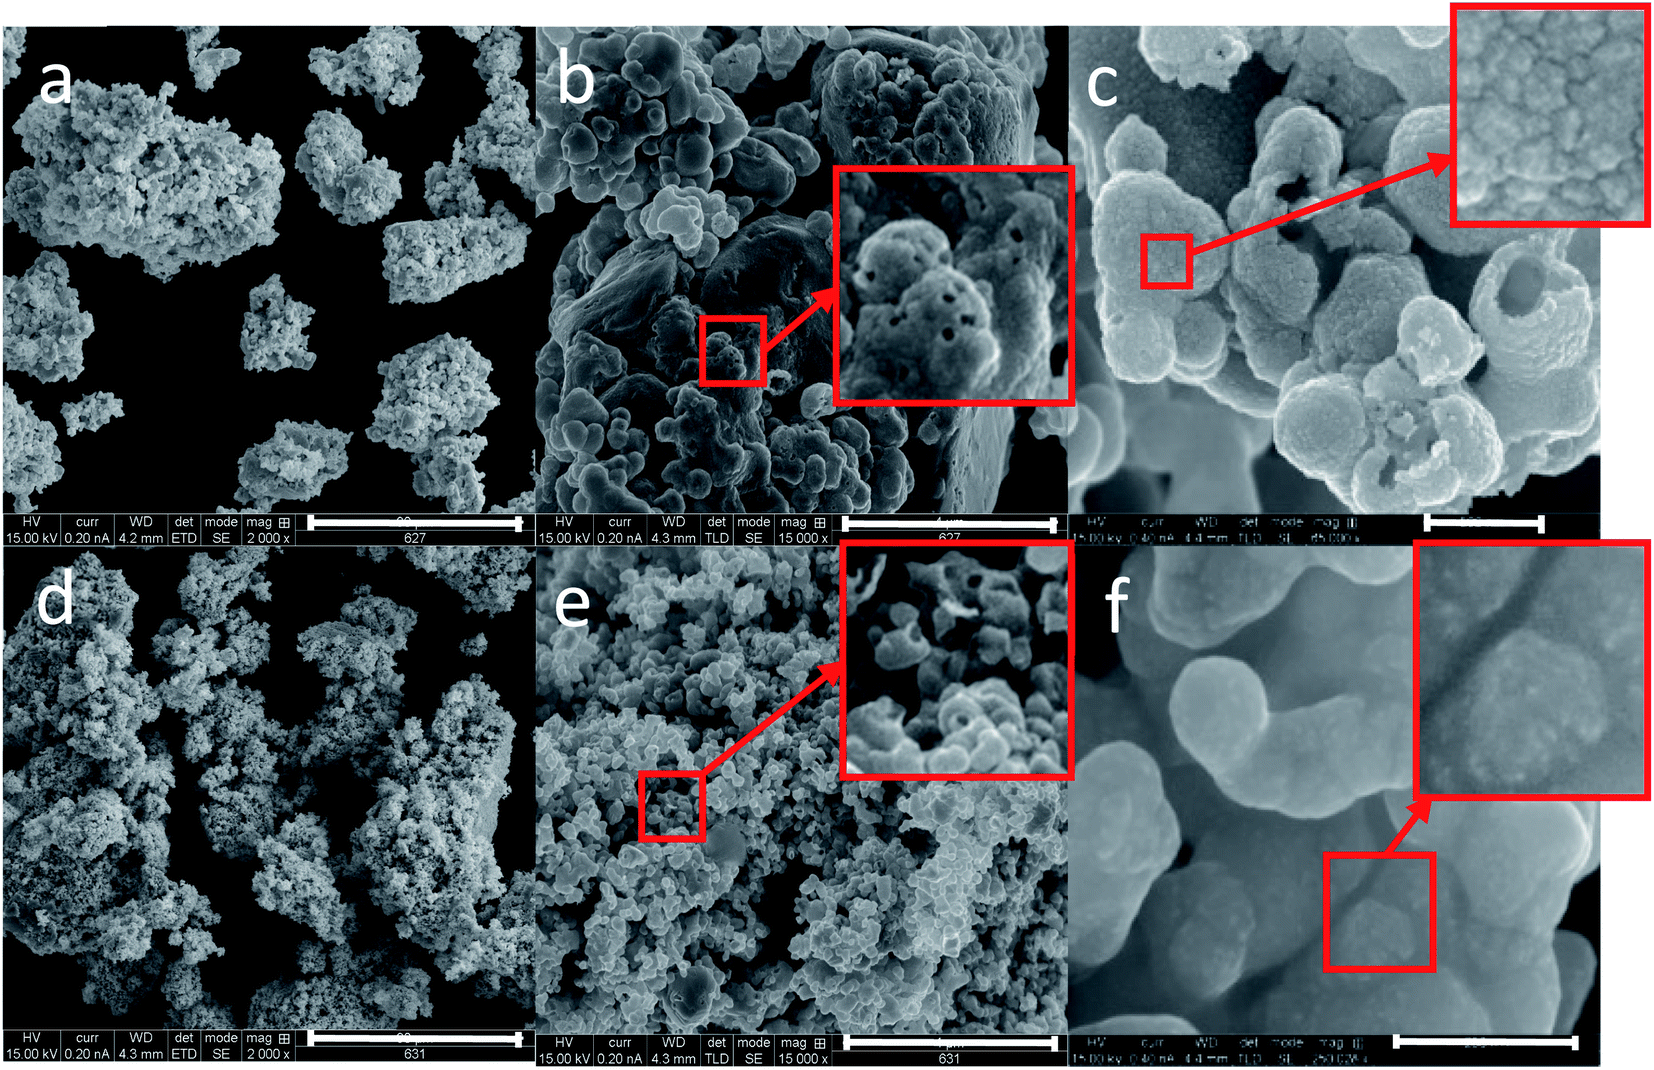 | ||
| Fig. 2 XHR-SEM images of composites of in situ grown platinum within silver: (a–c) Pt-grown@Ag, (d–f) Pt-grown@Ag-foam. Pt particles and islands can be seen inside the enlarged squares. Bars: (a and d): 30 μm; (b and e): 4 μm; (d and f): 200 nm. | ||
In both composites, it can be seen that the largest magnifications (c) and (f) reveal a certain roughness of the surface compared to their blanks in Fig. S2.† The main reason for this roughness, as displayed in the magnified squares, is the entrapment of the Pt nanoparticles of approximately 2 nm. The most prominent feature in the case of the Pt grown composites (types C and D, Fig. 2) are the cavities in the silver matrices of the composites (seen in the red squares). These cavities are formed by the in situ reduction of the Pt ions by the silver matrix (not seen in the blank Ag matrices – Fig. S2†). In the case of the foam composite (f), the Pt appears almost as discrete and fine particles on the surface, while in the Pt-grown@Ag composite they appear as separated crude islands (c). We propose that this difference is due to the larger surface area of the foam, which enables better dispersion.
| Composite | Ag crystal size (nm) | Surface area (m2 g−1) | Total pore volume (cm3 g−1) |
|---|---|---|---|
| Porous Ag | 93.4 | 0.36 | 0.39 ± 0.06 |
| Foam Ag | 42.3 | 2.36 | 1.79 ± 0.04 |
| Pt@Ag | 43.8 | 3.79 | 0.39 ± 0.02 |
| Pt@Ag-foam | 17.3 | 9.74 | 0.59 ± 0.05 |
| Pt-grown@Ag | 51.1 | 1.03 | 0.40 ± 0.10 |
| Pt-grown@Ag-foam | 37.3 | 2.78 | 0.58 ± 0.07 |
It is seen that the pure silver foam and its composites (types B and D) have smaller elementary crystal sizes compared to the porous silver analogs (types A and C). This data also agrees with the SEM images (Fig. 1, 2 and S2†). The reason for this difference is again reflecting the difference in the synthetic conditions: the use of NaBH4 in a large excess promotes more nucleation centers in the foam composites compared to the non-foam composites, thus resulting in smaller Ag crystals.
It is also seen that the silver in all composites has smaller crystal sizes compared to their Ag pure matrices. This trend was also observed in molecular dopant@metal composites, and the rationalization has been that the dopant inhibits the crystal growth of the matrix through reversible adsorption interactions between the dopant and the surface of the growing matrix nanocrystallite.7
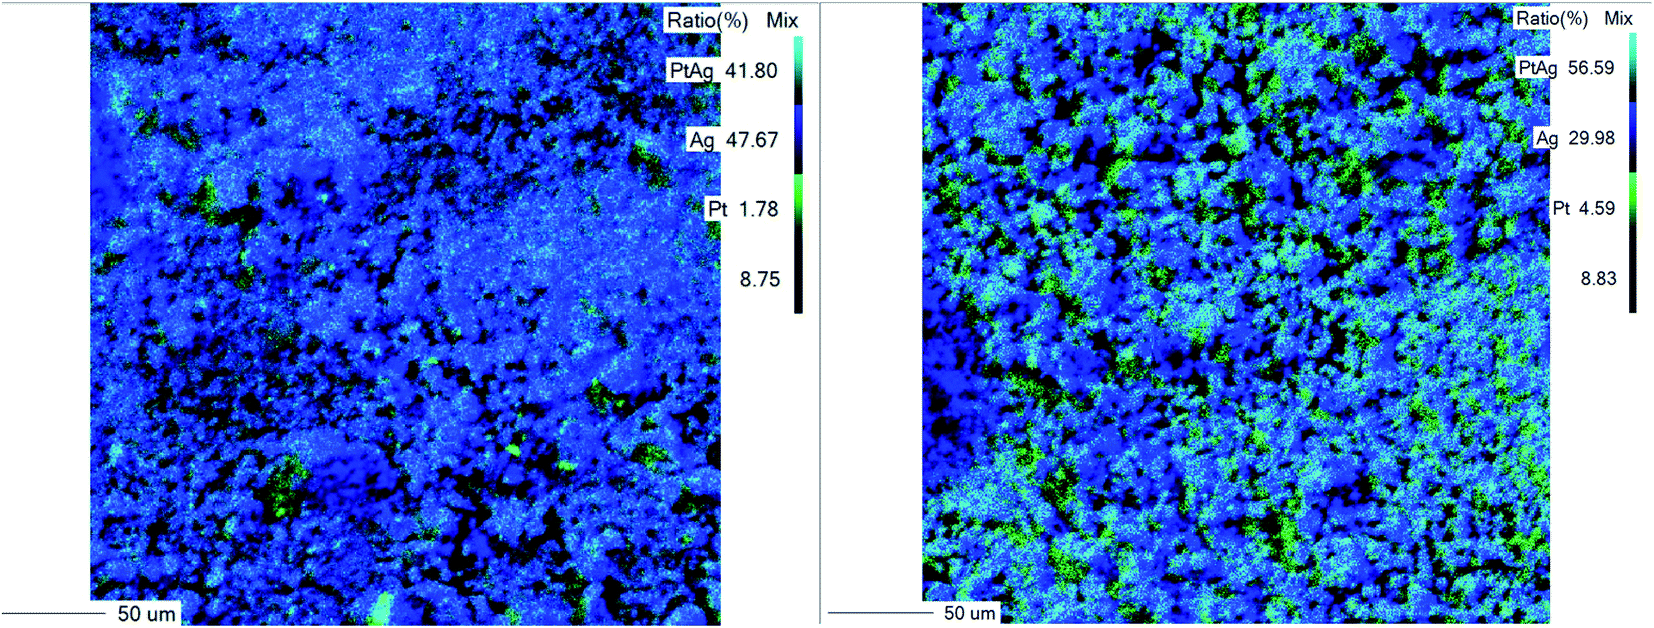 | ||
| Fig. 3 WDS maps of platinum within silver composites: right – Pt@Ag; left – Pt-grown@Ag. Green, light blue and deep blue represent areas with Pt, Pt–Ag and Ag respectively. Bars: 50 μm. | ||
It is seen in Fig. 3 that in the Pt@Ag composite, there are smaller Pt particles compared to the Pt-grown@Ag composite. This observation corresponds with the experimental procedure, as well as with the SEM images (Fig. 1 and 2) since the Ag in the Pt@Ag composite stabilizes discrete 2 nm Pt nanoparticles, while the Pt-grown@Ag composite is composed of thicker, cruder Pt islands layer. The roughness of the foams made it technically difficult to apply the WDS analysis; however, EDS provided the needed chemical analysis (Fig. S4†).
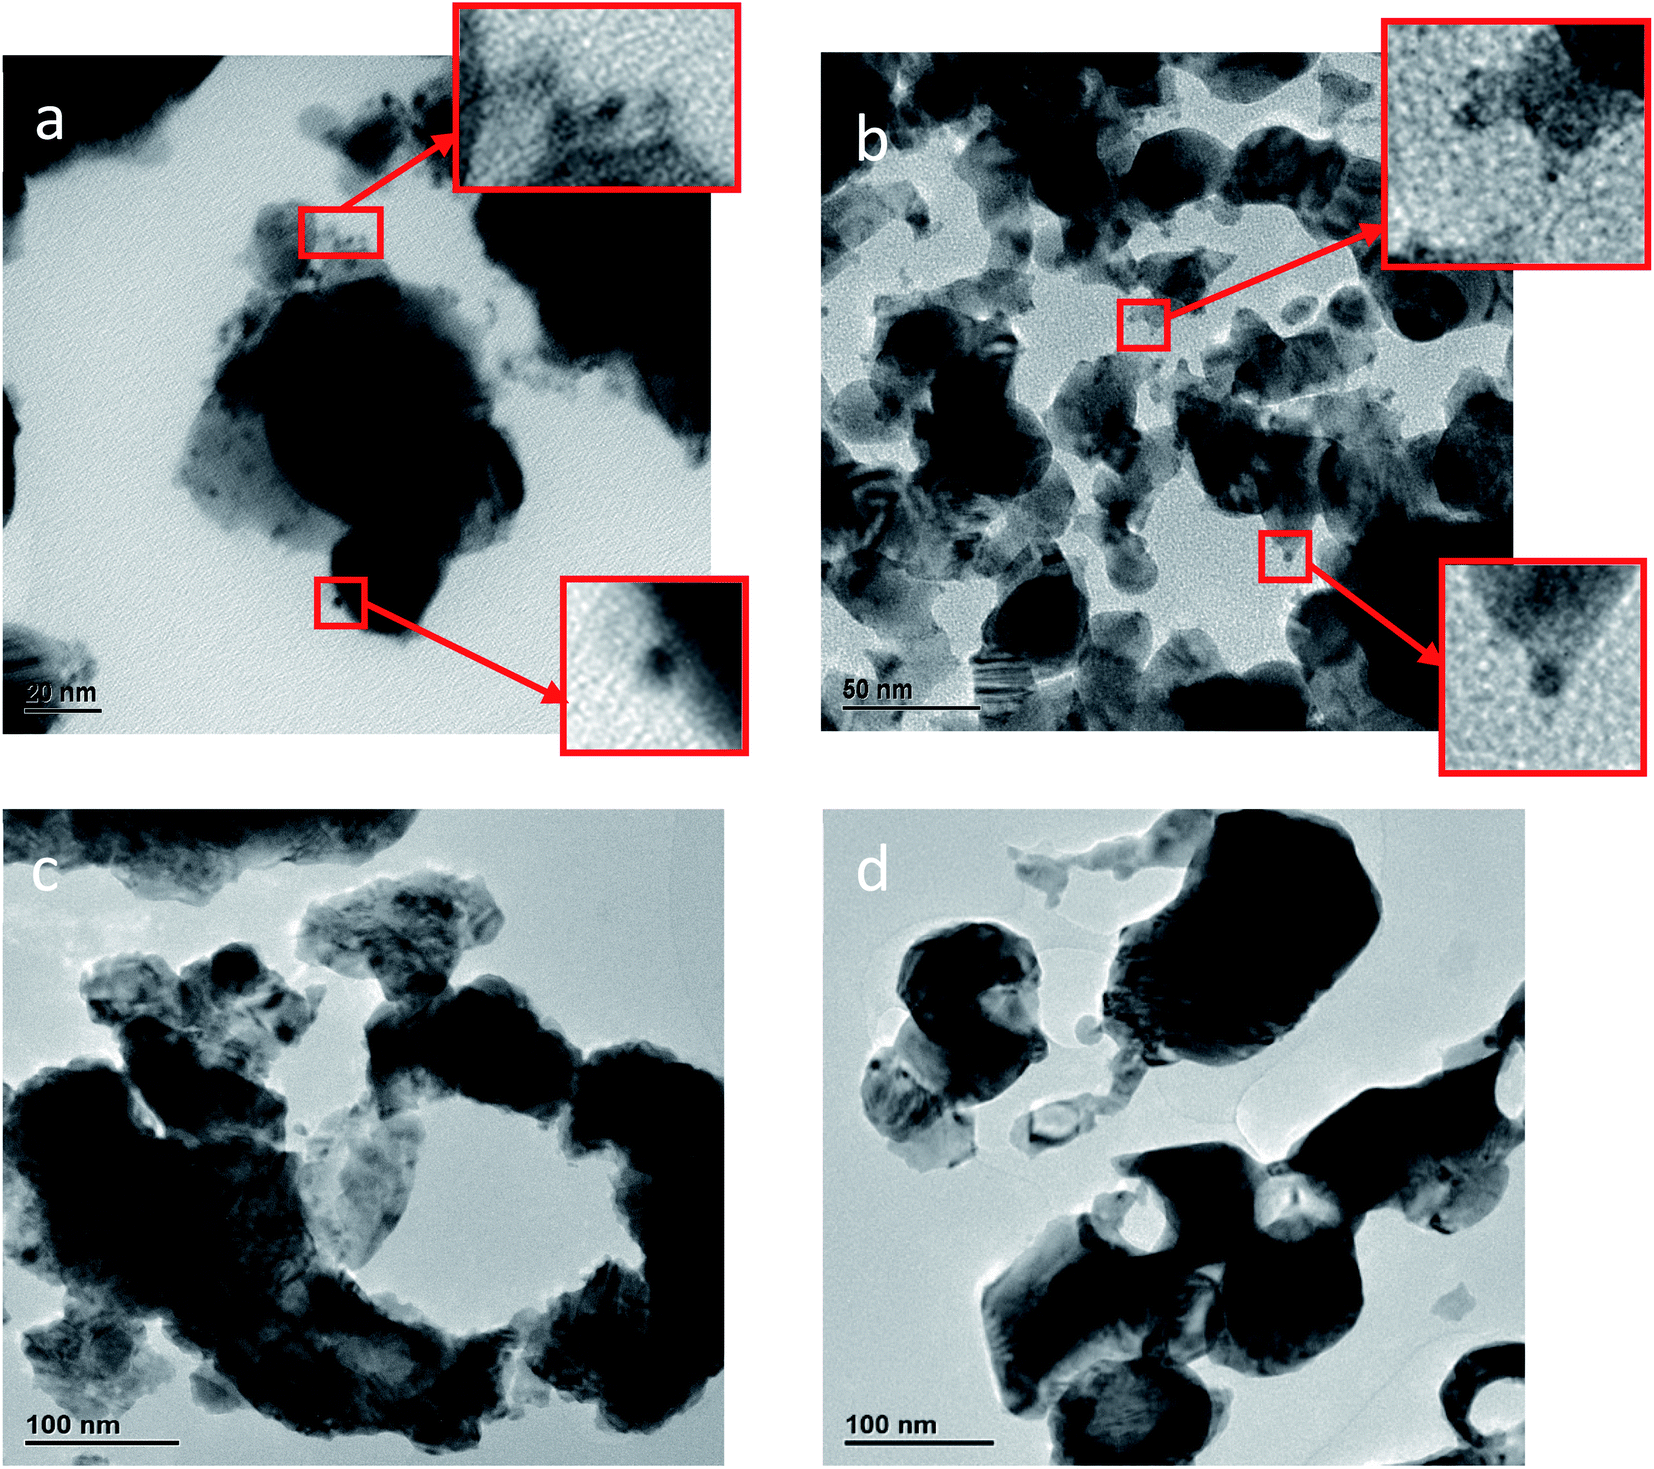 | ||
| Fig. 4 HR-TEM images of entrapped platinum within silver composites: (a) Pt@Ag. (b) Pt@Ag-foam. Pt NPs can be seen in the squares of (a) and (b). (c) Pt-grown@Ag. (d) Pt-grown@Ag-foam. | ||
The TEM images of the grown platinum within silver composites (Pt-grown@Ag and Pt-grown@Ag-foam), on the other hand, look quite different. The images, shown in Fig. 4(c and d) reveal mainly the structure of the Ag matrix, but it is not obvious to the naked eye where the Pt is placed. Cavities and holes are seen on the Ag aggregates surface in this case, and the Ag matrix structure cross section looks as if it was corroded. This is due to the decomposition of the Ag during the formation of the Pt. Typical d-spacings of about 2.35 Å and 2.29 Å for silver and platinum, respectively, were measured from TEM images. Although these values support the assignments made, due to their close values, the additional methods described here were used.
STEM coupled with EDS is probably the most informative method for our purpose: Fig. 5(a) shows the fine dispersion of the Pt NPs in the Ag matrix in the Pt@Ag composite. Fig. 5(b) shows a STEM image at a higher resolution and (c) is its elemental mapping. It can be seen that the NPs in (b) indeed overlap with the Pt in the (c). A similar analysis is shown in Fig. 6(a and b) for the Pt@Ag-foam composite.
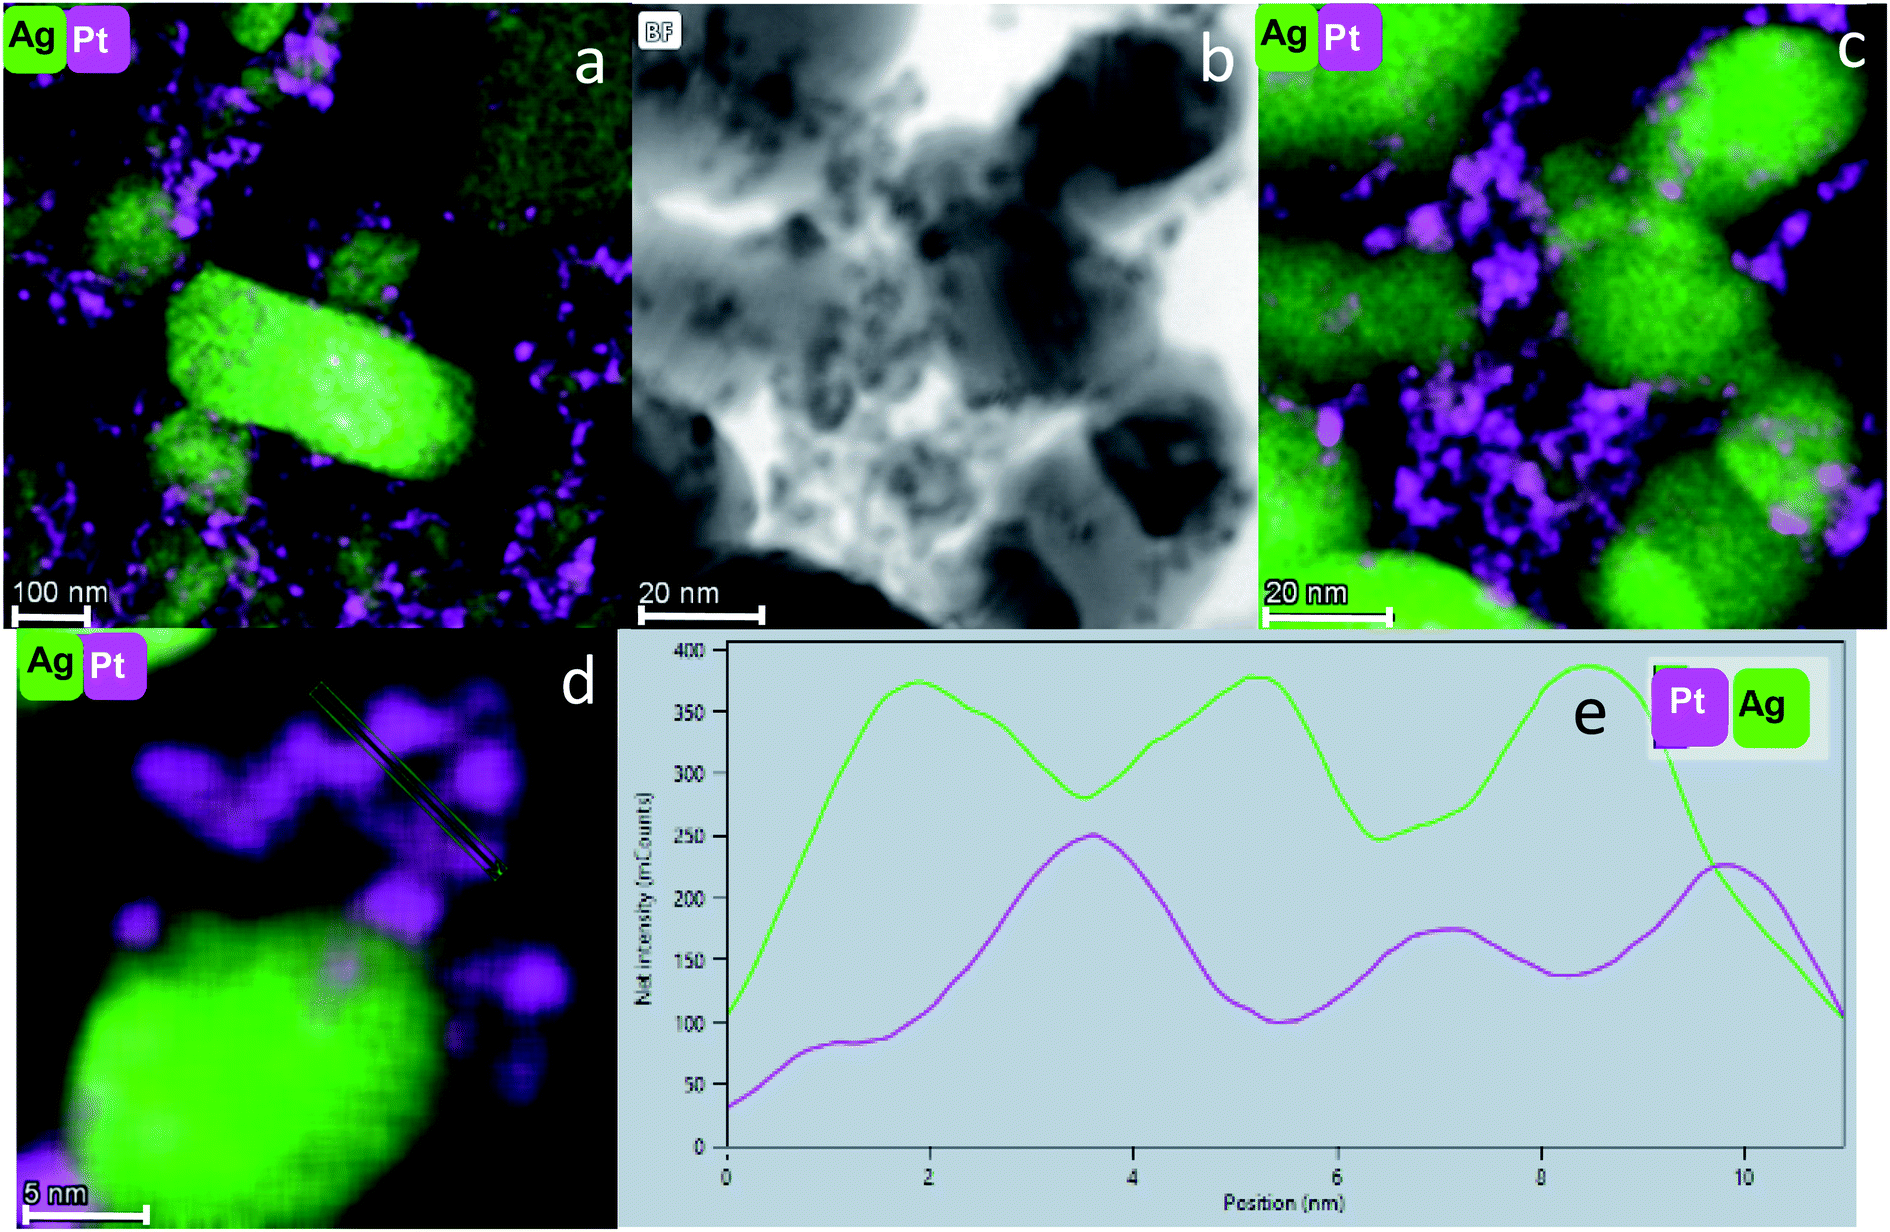 | ||
| Fig. 5 (a) STEM – EDS elemental mapping of Pt@Ag (bar: 100 nm). (b) STEM image of Pt@Ag and its corresponding EDS elemental mapping shown in (c). (d) EDS elemental mapping of Pt@Ag and (e) a profile of the elemental composition along the marked line in (d). Pink: Pt, green: Ag. Bars: (b and c): 20 nm, (d): 5 nm. | ||
Fig. 5(d) shows clearly the embedding of the Pt-NPs in the silver matrix in a higher magnification. An important observation is made by following the elemental composition along the scanning line shown in Fig. 5(d): The composition profile Fig. 5(e) shows that with each maximum of the Pt counts (pink), there is a minimum of Ag counts (green). Namely, the Pt NPs are closely embedded in kind of a ‘bowl’ shape cavities of the Ag matrix. The Pt and Ag are overlapping in their interface, but each of the phases is separate and they do not blend or form an alloy. A similar analysis was made for the entrapment in foam – Fig. 6(c and d): the Pt NPs are wrapped more intimately by the Ag compared to the case of Pt@Ag (confirming the primary TEM observation) and as a consequence, the increase in the counts of the Pt along the marked area does not correspond with a decrease in the Ag counts (Fig. 6(d)). Fig. 7 shows the results of this analysis for in situ grown composites – Pt-grown@Ag and Pt-grown@Ag-foam. The figure clearly reveals the coating nature which results from the in situ generation of the Pt that is completely different from the Pt distribution and morphology in the entrapping composites.
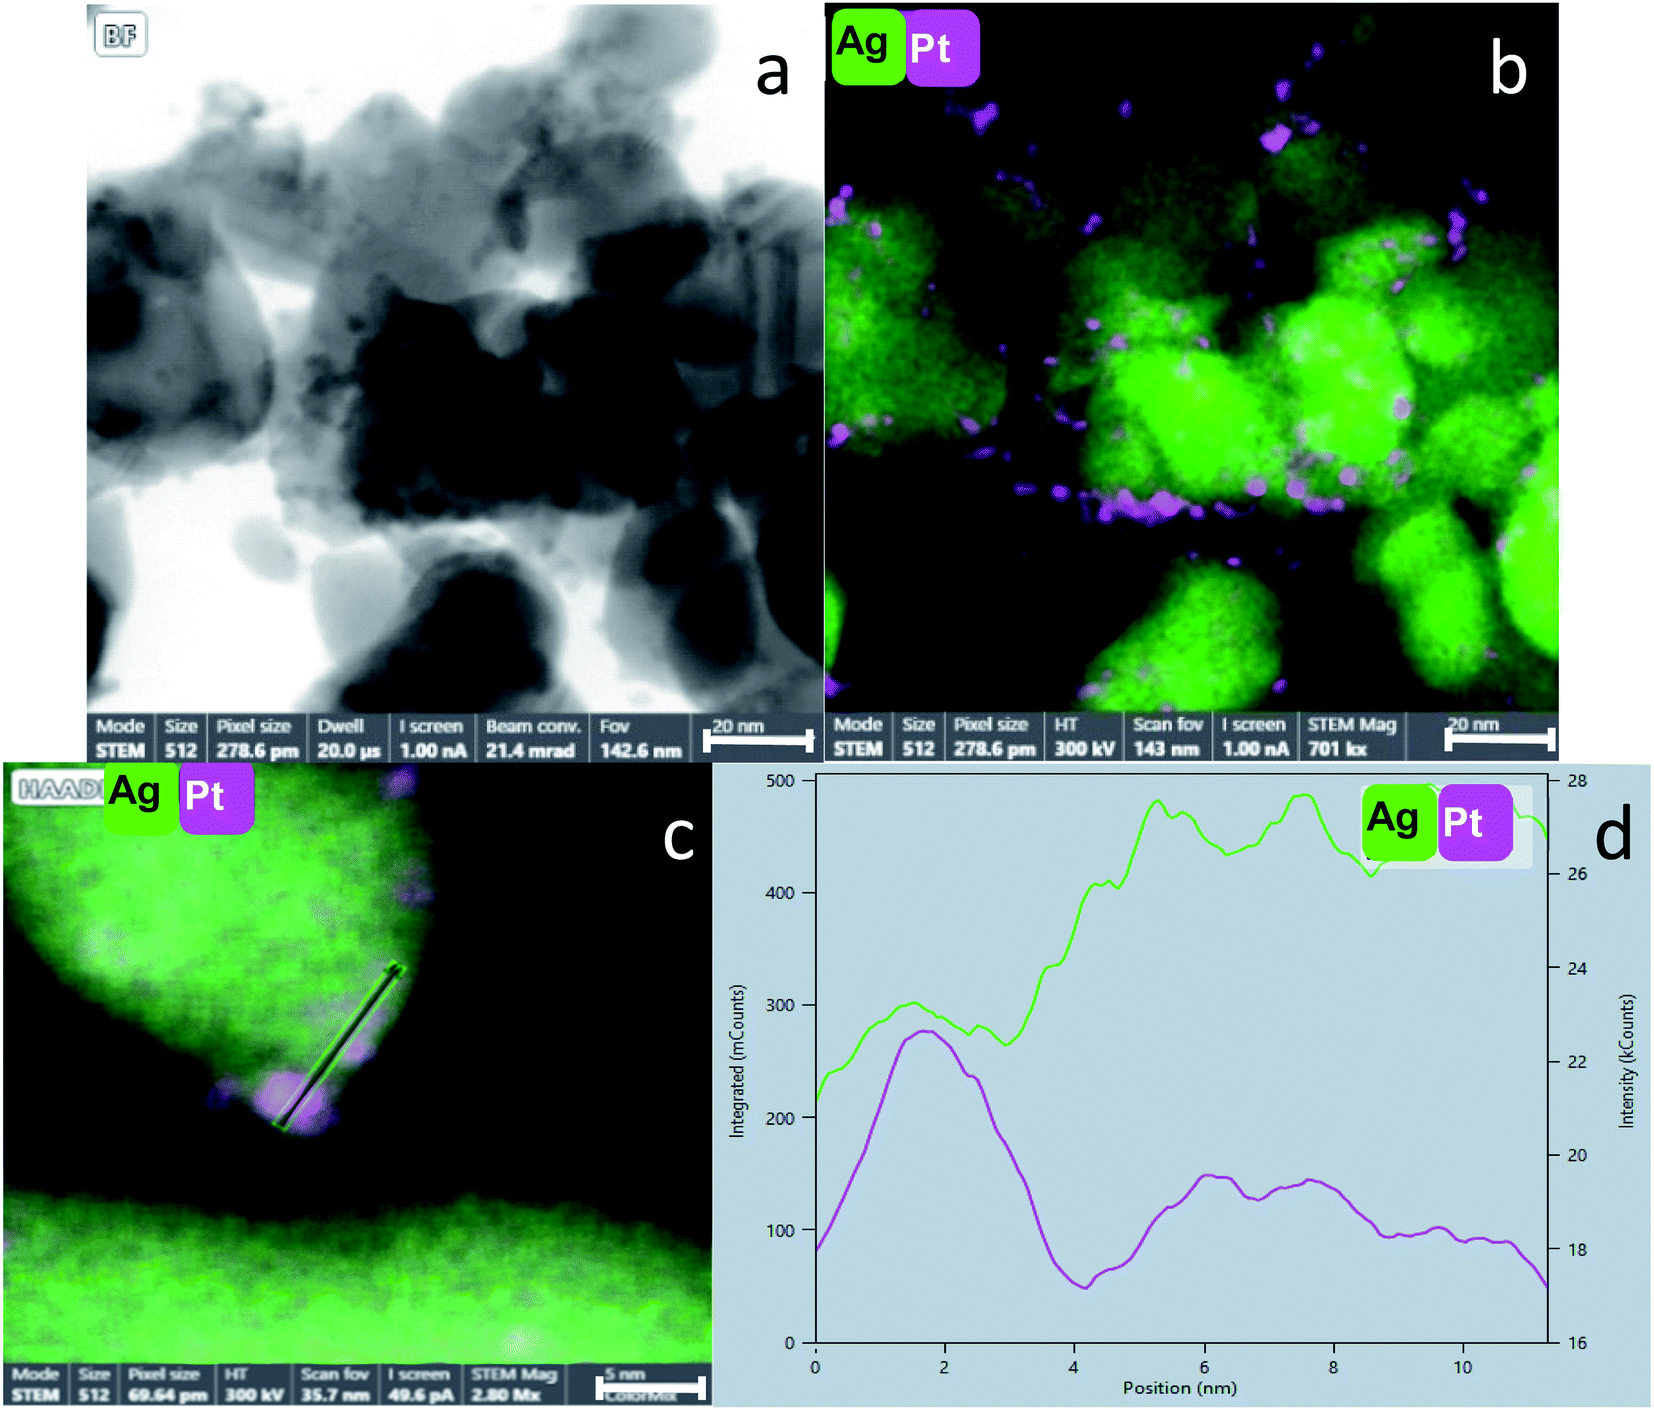 | ||
| Fig. 6 (a) STEM image of Pt@Ag-foam. Its corresponding EDS elemental mapping is shown in (b). (c) EDS elemental mapping of Pt@Ag-foam and (d) a profile of the elemental composition along the marked line in (c). Pink: Pt, green: Ag. Bars: (a and b): 20 nm, (c): 5 nm. | ||
 | ||
| Fig. 7 (a) EDS elemental mapping of Pt-grown@Ag. (b) EDS elemental mapping of Pt-grown@Ag and (c) a profile of the elemental composition along the marked line in (b). (d) EDS elemental mapping of Pt-grown@Ag-foam. (e) EDS elemental mapping of Pt-grown@Ag-foam and (f) a profile of the elemental composition along the marked line in (e). Pink: Pt, green: Ag. Bars: (a), (b): 500 nm, (d): 200 nm, (e): 50 nm. | ||
The main difference between the two Pt-grown composites is the thickness of the grown Pt – in the Pt-grown@Ag the Pt is much thicker, forming in fact partial coating (of a magnitude of order of about 100 nm thick), while in the Pt-grown@Ag-foam the coating in more delicate (about 10 nm). This difference originates from the difference in the surface areas, which in the foam matrix is much higher, that is, more area is available to be covered by the same amount of Pt, resulting in the thinner coating. Fig. 7(e and f) shows this difference with the composition profiles: In Fig. 7(f) it is seen that the peaks of the elements are not overlapping completely – Pt increases before the Ag, indicating that there are some areas that are distinctively only Pt. The Pt layer in the Pt-grown@Ag-foam composite is composed of Pt islands and particles, and its thickness is not constant in all covered areas.
3.5 Catalysis
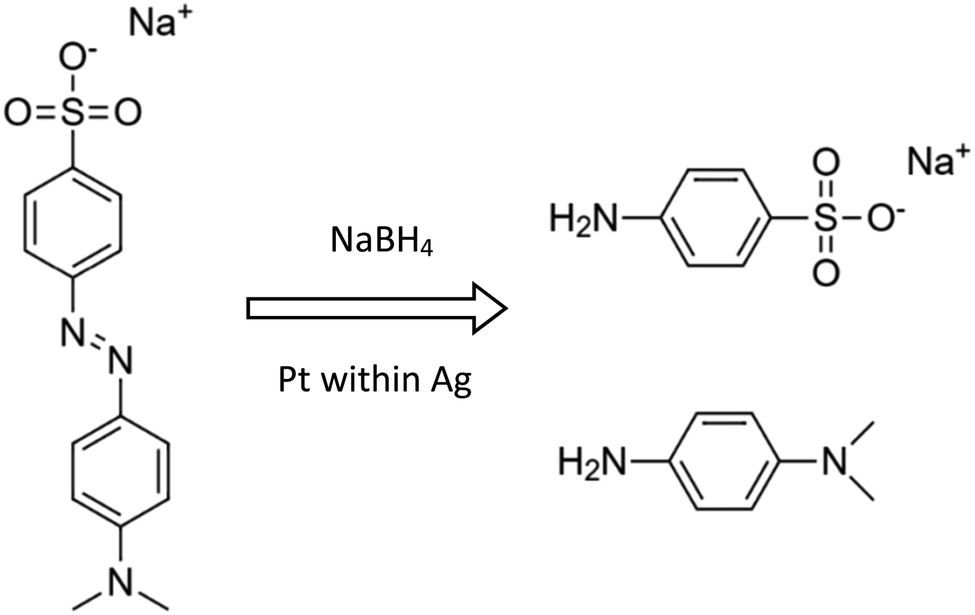
The aims of the catalysis study were dual: First, catalytic metal NPs have traditionally been supported on ceramic, glassy and polymeric supports, but never on high surface area metallic supports; we demonstrate here the applicability of this new materials-type support. Second, we use the catalytic reactions to tell us more about the structure and properties of these metallic composites, and about the resulting differences between the four types developed here.Methyl Orange reductive catalytic degradation. The importance of this reaction is in the field of water pollution:25 azo dyes such as Methyl Orange (MO) are widely used in various industries (cosmetics, food, textile, etc.), despite the fact that they are toxic and with low biodegradability; an effective method for their degradation is therefore needed. Following the observations that Pt-NPs catalyze reductive degradations of such compounds,14,25,26 we tested the ability of our composites to catalyze the MO reductive degradation to sodium sulfanilic acid and N,N-dimethyl-p-phenylenediamine:
and catalysis was indeed found to be affected. The reaction is followed spectroscopically by the decline in time of MO absorbance. The full set of spectra for Pt@Ag (type A) is collected in Fig. 8(a), and these were converted to kinetic profiles at 455 nm for all of the four types in Fig. 8(b) (including the Ag blanks). It is seen that there is a strong catalytic activity for the types A and B – Pt@Ag and Pt@Ag-foam. It is also seen, on the full-time scale of the figure, that the Ag porous matrix has some weak catalytic activity contribution – the pure Ag foam is more active than the pure porous Ag due to its larger surface area and smaller average particle size, and this activity is only slightly affected by growing Pt on it.
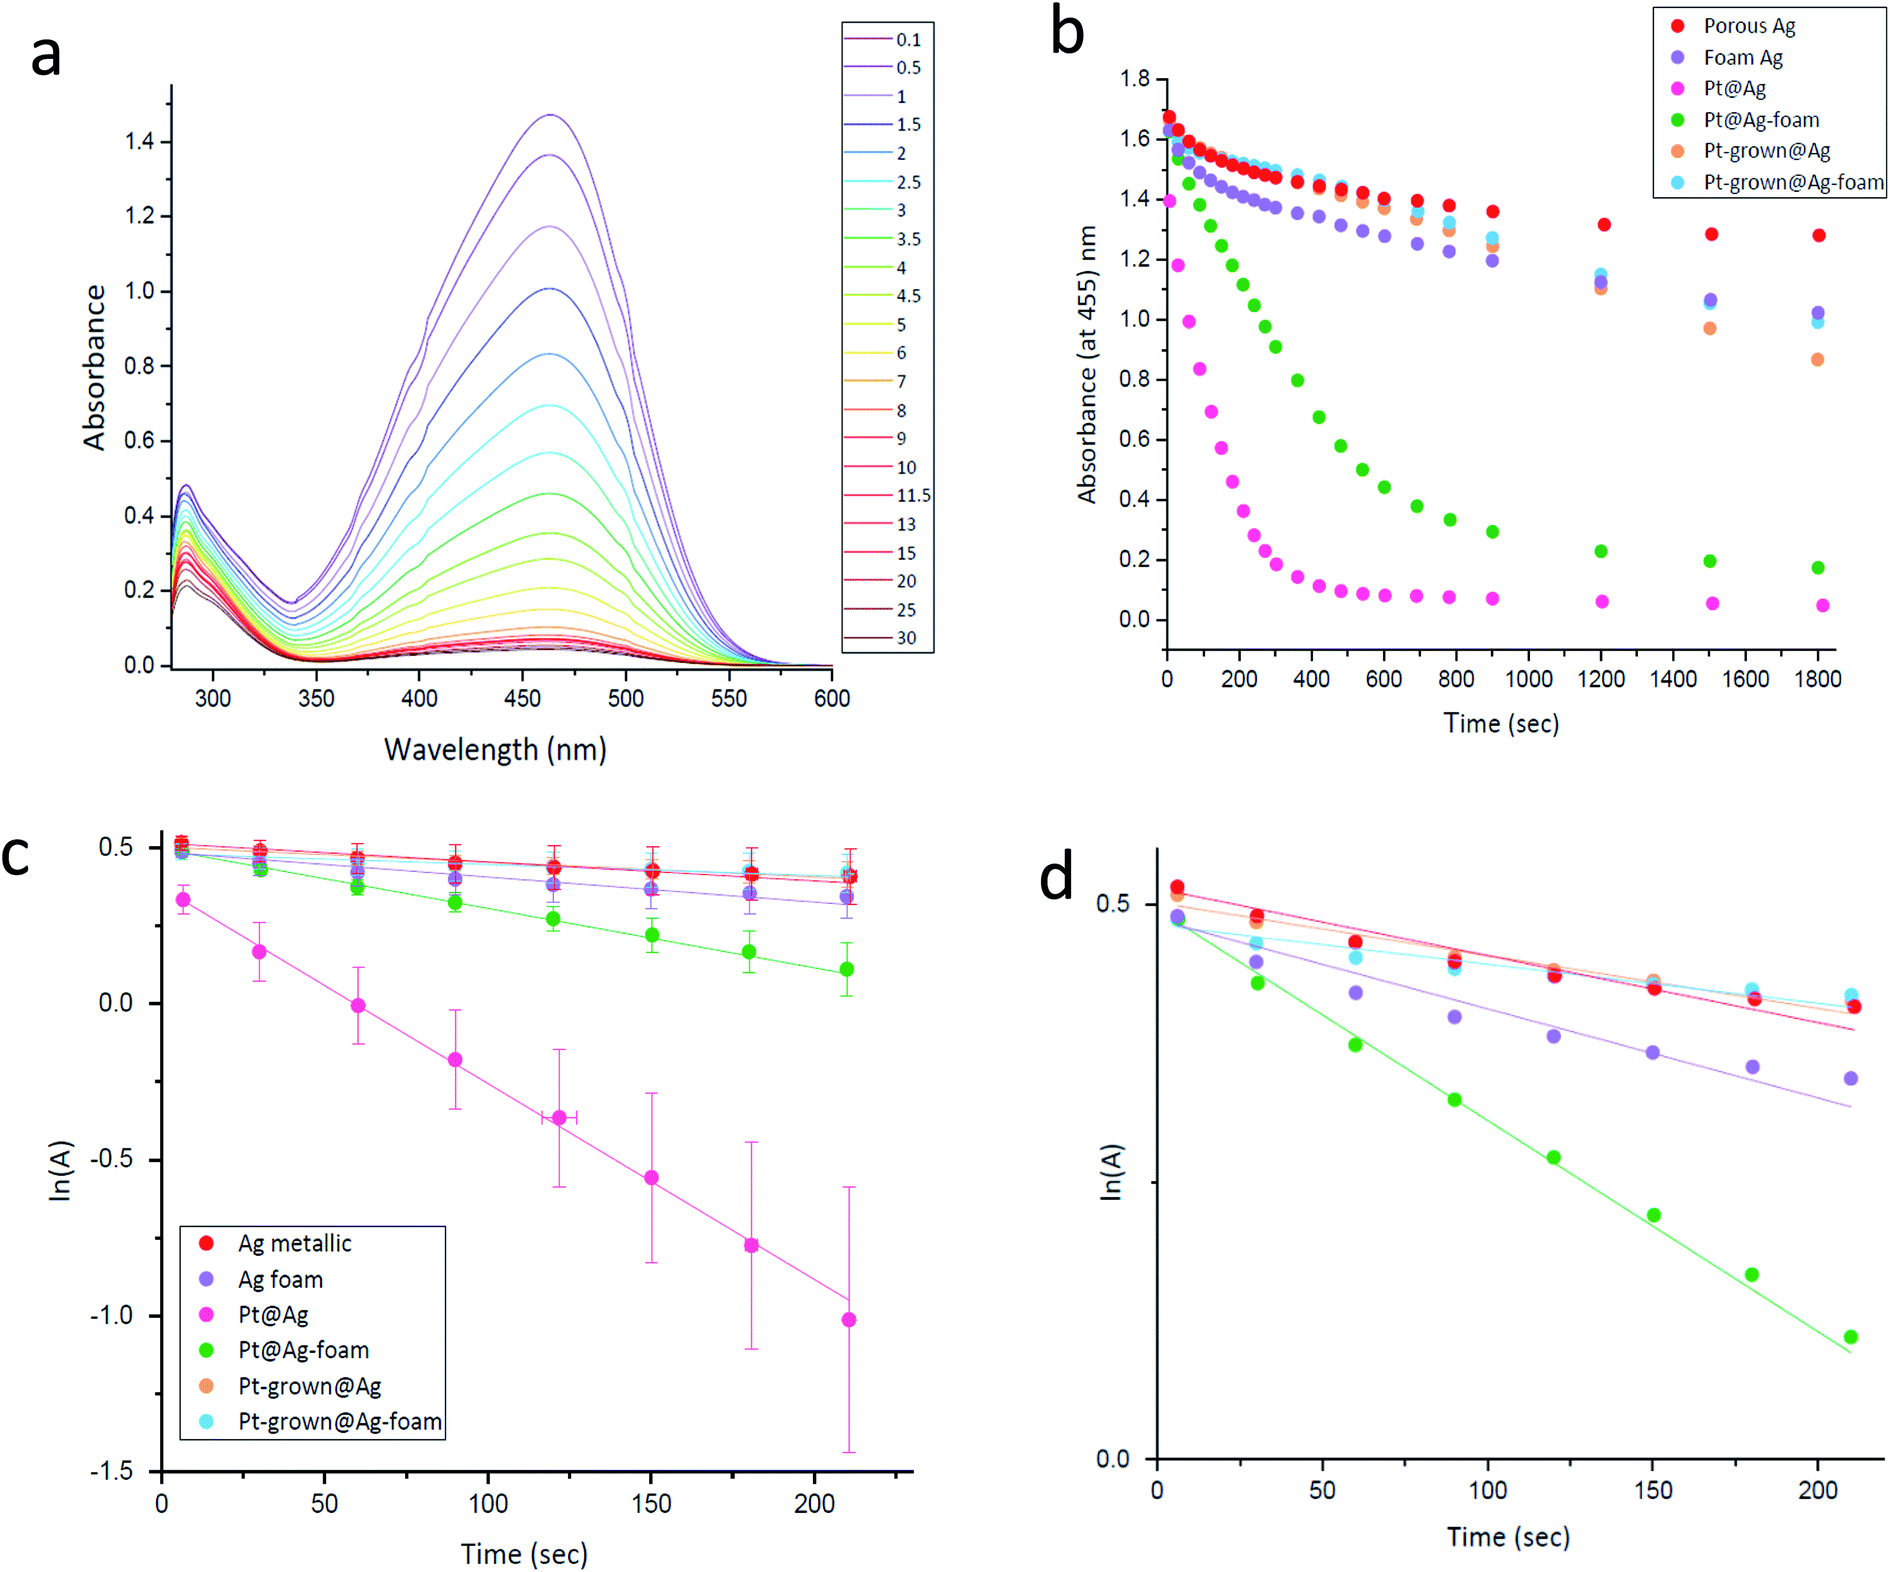 | ||
| Fig. 8 (a) Methyl Orange reductive degradation catalyzed by Pt@Ag composite. The time steps in the column are in minutes. (b) Methyl orange catalytic reductive degradation by different platinum within silver composites. (Each graph is an average of 9 measurements). (c) Methyl orange catalytic reductive degradation by Pt within Ag composites, presented as pseudo first order kinetics-full scale. (d) The 0.0–0.5 ln(A) range of (c). | ||
Since NaBH4 is taken in large excess and since the catalyst is not consumed, a pseudo first-order kinetics analysis with respect to the MO concentration (the absorbance, A) was carried out for short times. The results are presented in Fig. 8(c and d): (c) is the full scale for all the composites and (d) is in the expanded ln(A) range of 0.0–0.5. It is seen that the pseudo first-order assumption is fairly good, and the kinetic parameters are collected in Table 3. It confirms the high activities of Pt@Ag and Pt@Ag-foam – an increase in factors of 10.5 and 2.3 in the rate constants compared to the blanks, respectively.
| Porous Ag | Ag foam | Pt@Ag | Pt@Ag-foam | Pt-grown@Ag | Pt-grown@Ag-foam | |
|---|---|---|---|---|---|---|
| MO reduction rate constant × 10−3(sec−1) | 0.60 ± 0.05 | 0.80 ± 0.08 | 6.3 ± 0.1 | 1.91 ± 0.06 | 0.47 ± 0.05 | 0.35 ± 0.04 |
| MO, t1/2 (sec) | 1200 ± 100 | 900 ± 100 | 110 ± 2 | 360 ± 10 | 2000 ± 200 | 1500 ± 100 |
| Fe(CN)63 reduction rate constant × 10−3 (sec−1) | 2.970 ± 0.003 | 2.050 ± 0.007 | 15.4 ± 0.3 | 5.64 ± 0.02 | 1.550 ± 0.009 | 6.980 ± 0.006 |
| Fe(CN)63, t1/2 (sec) | 233.4 ± 0.2 | 338 ± 1 | 44.9 ± 0.9 | 122.9 ± 0.4 | 447 ± 3 | 99.31 ± 0.08 |
The activity order of the lesser active materials slightly changes to foam Ag > porous Ag > Pt-grown@Ag > Pt-grown@Ag-foam. The in situ grown composites, Pt-grown@Ag and Pt-grown@Ag-foam (types C, D) show no increase in the catalytic activity compared to silver, and even a small decrease in the short time scales. This observation highlights the importance of the morphology of the metallic catalyst in affecting its activity: while the pre-prepared Pt-NPs are active in this reaction, the grown Pt islands that are formed on the surface of the Ag matrix are apparently not energetic enough, that is, with a small number of defects and active sites needed to enhance this reaction. Since the pure foam matrix is more active than the pure porous Ag, one might expect that the combined activity with Pt NPs will result in an activity order of Pt@Ag-foam > Pt@Ag, while the opposite is true. It implies that the NPs in the Pt@Ag are more exposed to perform the catalysis, while in the foam they are more buried in the matrix. This observation is indeed supported by the HR-TEM and STEM results described above (Fig. 4–6). The catalytic reduction of MO with Pt@Ag was also monitored at different temperatures in the range of 5–30 °C, in order to calculate the activation energy, using the Arrhenius equation. Fig. 9(a) shows that the reaction complies with this equation and the value of the activation energy derived from it is 88 ± 9 kJ mol−1. This value indicates that the reaction is not controlled by the diffusion of the substances (usually resulting in activation energies smaller than 21 kJ mol−127), but rather a surface-controlled reaction.26,28 Recyclability for three cycles was tested and the results are shown in Fig. 9(b). It is seen that cleaning between the cycles preserves the activity, but with a slight decrease in the reaction rate.
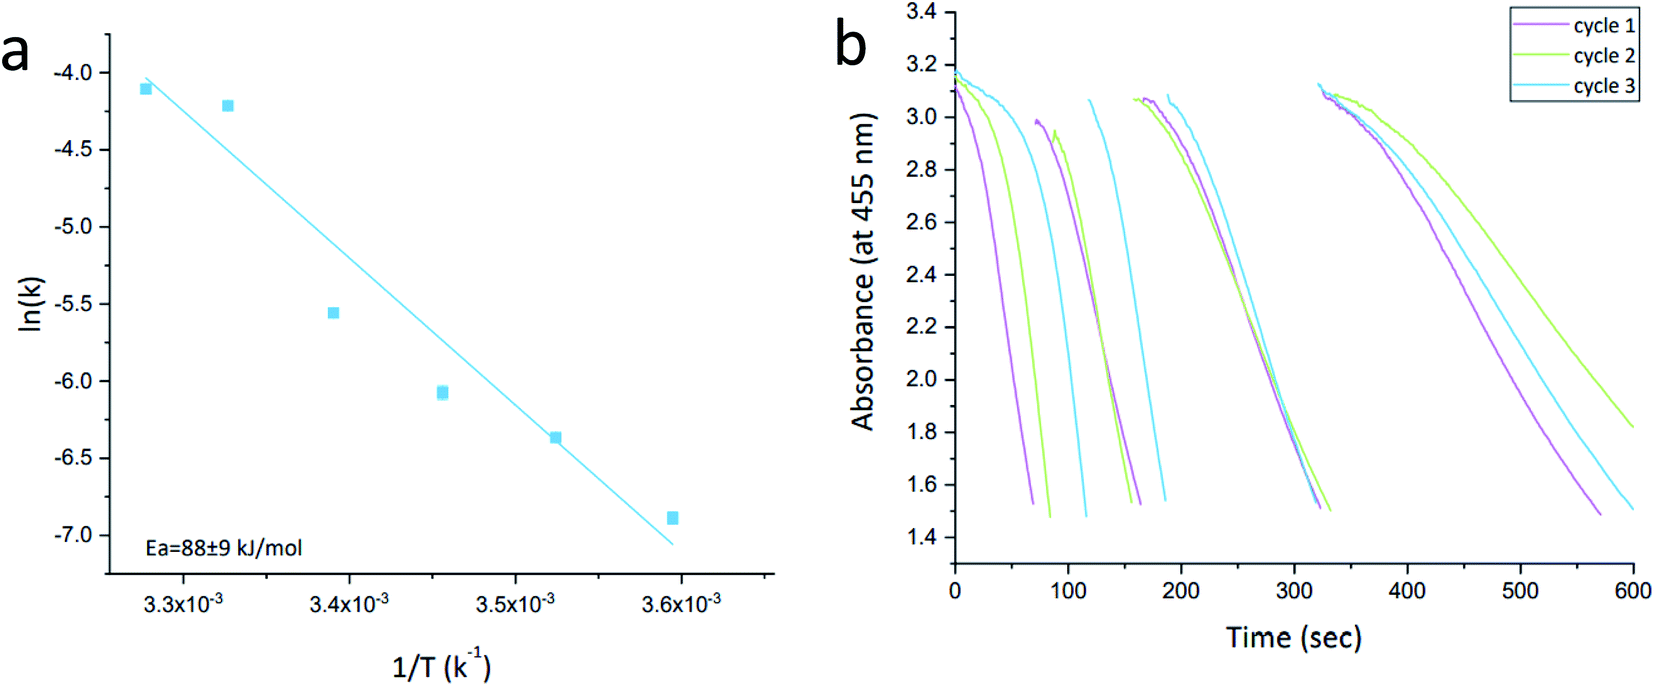 | ||
| Fig. 9 (a) Arrhenius plot of the reductive degradation of Methyl Orange with Pt@Ag catalyst. The correlation coefficient of the fit to the equation is 0.947. (b) Recycling test of Pt@Ag in the MO reductive degradation reaction. Vertical gaps indicate addition of starting material. Three cycles are shown – see color code. | ||
The catalytic reduction of hexacyanoferrate reduction. The second Pt-catalytic reaction that was examined is sodium thiosulfate reduction of hexacyanoferrate. The reduction of hexacyanoferrate(III) to ferrocyanide(II), is a well-known model reaction for the examination of NPs catalytic activity,29 and as the previous reaction, has importance in environmental aspects in reducing the hexacyanoferrate's toxicity.30 This reduction was found to be catalyzed by the platinum within silver composites according to:
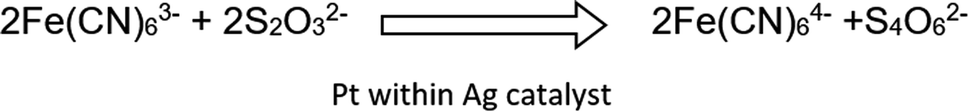
The reaction was monitored spectrophotometrically, and a typical collection of time-changing absorption spectra is presented in Fig. 10(a) for Pt@Ag (type A). The appearance of the isosbestic point confirms the proposed conversion of the starting material to a single product (unlike the previous reaction). The kinetic profiles of the reactions were monitored at 425 nm for the different composites and of the Ag blanks and the results are shown in Fig. 10(b). It is seen that in this reaction, contrary to the results observed for MO degradation, the Ag pure matrices have significant catalytic activity. However, the Pt@Ag, Pt@Ag-foam and Pt-grown@Ag-foam composites clearly show the catalytic effect of Pt, as they have enhanced catalytic activity compared to their blanks.
 | ||
| Fig. 10 (a) Hexacyanoferrate(III) catalytic reduction with thiosulfate as the reducing agent and Pt@Ag composite as the catalyst. The interval between each spectrum is 10 seconds. (b) Hexacyanoferrate catalytic reduction by the different platinum within silver composites monitored at 425 nm. Each trend is an average of 8 measurements. (c) Representation of the reaction as pseudo first-order kinetics. Typical error bars are shown for porous Ag. | ||
An exception is Pt-grown@Ag (probably due to some blocking of the active sites of the Ag matrix by the Pt coating). Since the thiosulfate was used in excess, a pseudo first-order kinetic analysis is possible in this case as well and the results are shown Fig. 10(c). The fit to the fastest reaction – Pt@Ag – is slightly curved, but is still good and allows comparison with the other reactions. The kinetic parameters are collected in Table 3. The catalytic activity trends are reserved as in Fig. 10(b): Pt@Ag > Pt-grown@Ag-foam > Pt@Ag-foam > porous Ag > foam Ag > Pt-grown@Ag. The enhancement of the reaction by the entrapped composites is similar to the trend seen for these composites in the MO degradation (the rate constants increase by factors of 5.2 and 2.7 for Pt@Ag and Pt@Ag-foam, respectively), supporting the suggested hypothesis that the Pt available active sites are the governing parameter. Moreover, the close values – same order of magnitude – of the rate constants obtained for the two reactions (the Pt@Ag rate constant in the MO degradation is 6.3 and in the hexacyanoferrate reduction, 15.4) suggests a certain resemblance between the two reactions: both reactions include a transfer of electrons from the donor to the acceptor through the metallic catalyst, and that this is the rate-determining step.31,32 Finally, recycling in this case is possible, but it is not as good as for the MO reaction – see Fig. S15.†
Tafel Step:
| 2Pd + H2 ⇒ 2PdHads | (1a) |
Volmer Step:
| 2PdHads + 2OH− ⇒ 2Pd + 2H2O + 2e− | (1b) |
Overall reaction:
| H2 + 2OH− ⇒ 2H2O + 2e− | (1c) |
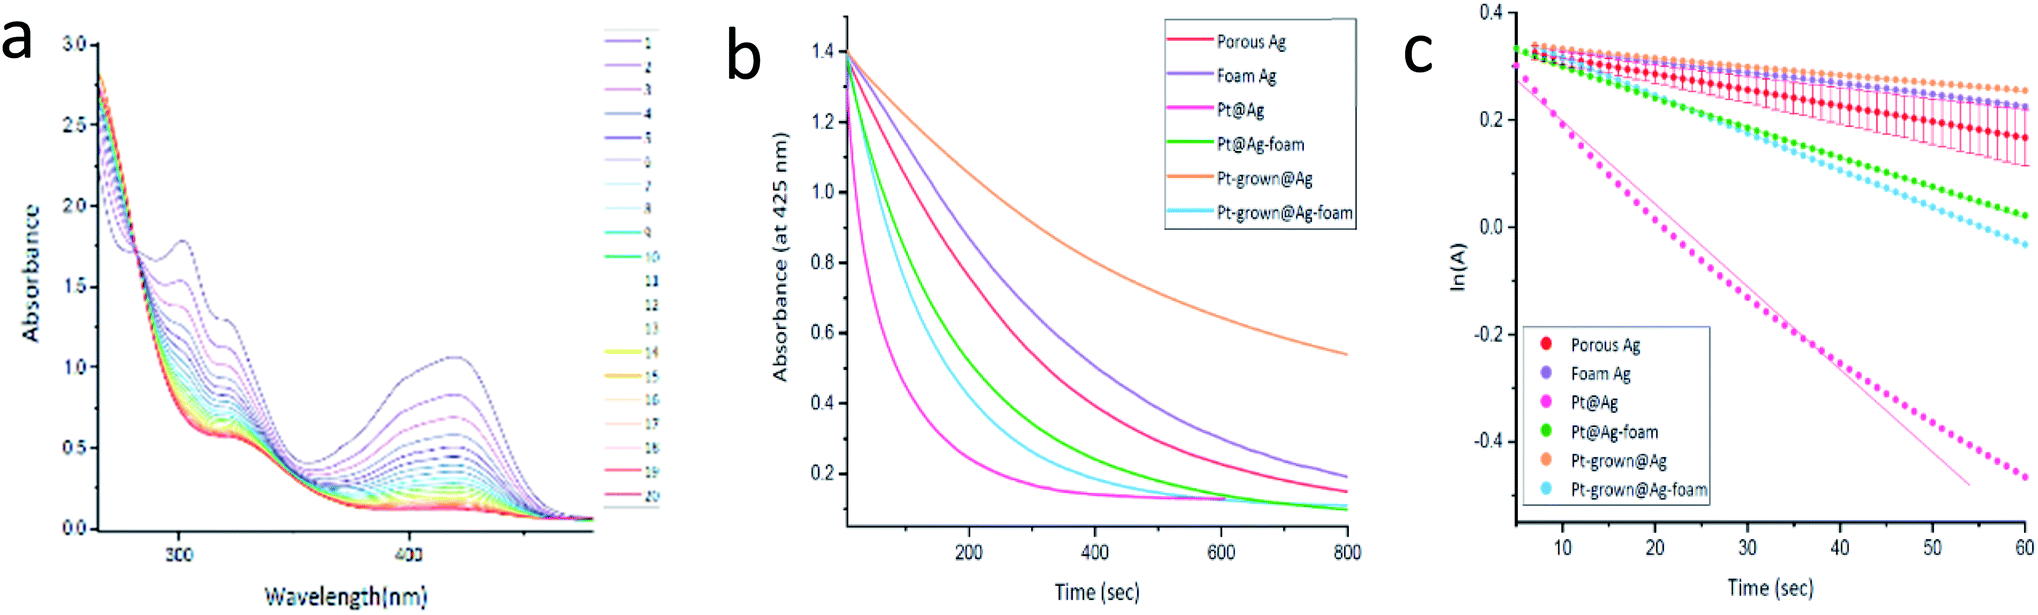
H2 adsorbs on the metallic surface in the Tafel step followed by the Volmer rate-limiting electron release step.33 While Pt is usually used for that process, Pd can be used as well by adding a second oxophilic metal such as Ni,34 which improves the Volmer step.35 Therefore, we selected Pd/Ni system to demonstrate the concept of the metal-entrapment method. Fibers morphology – see Fig. S5† – was selected, following reports on enhanced activity and stability of IrOx fibers layer coated with IrOx NPs.36 Cyclic voltamograms (CVs) of Ni/NiO-decorated fibers and of Pd-grown@Ni/NiO-decorated fibers, shown in Fig. 11(e) and (f), were recorded to display the surface electrical characteristics (Fig. 11(a)). The flat CV features below 0.4 V with Ni/NiO-decorated fibers suggest no hydrogen adsorption/desorption region, which is typical of precious metals. The CV features are the signature of the Pd present in our sample. This observation is similar to our previous results9 on PdCeO2. The corresponding hydrogen oxidation polarization curves are shown in Fig. 11(b), and the inset shows the mass-normalized activity. Interestingly, Pd-grown@Ni/NiO-decorated fibers displaced strong oxidation current, attributed to hydrogen oxidation. Ni/NiO-decorated fibers' HOR curves show negligible current towards HOR reflecting the role of Pd in Pd-grown@Ni/NiO-decorated fibers. The HOR current at 0.10 V is comparable to those recorded for Pd–W–C,37 Pd,38 Pd–CeO2.9 Pd-grown@Ni/NiO-decorated fibers were further analyzed to investigate the mass-transport behavior by varying the electrode's rotation speed (Fig. 11(c)). The increase in HOR current with rotation rate confirms that the process is limiting by mass-transport.39 Pd-grown@Ni/NiO-decorated fibers exhibited reasonable stability for 10 h at 0.37 V vs. RHE in H2-saturated 0.1 M KOH (Fig. 11(d)).
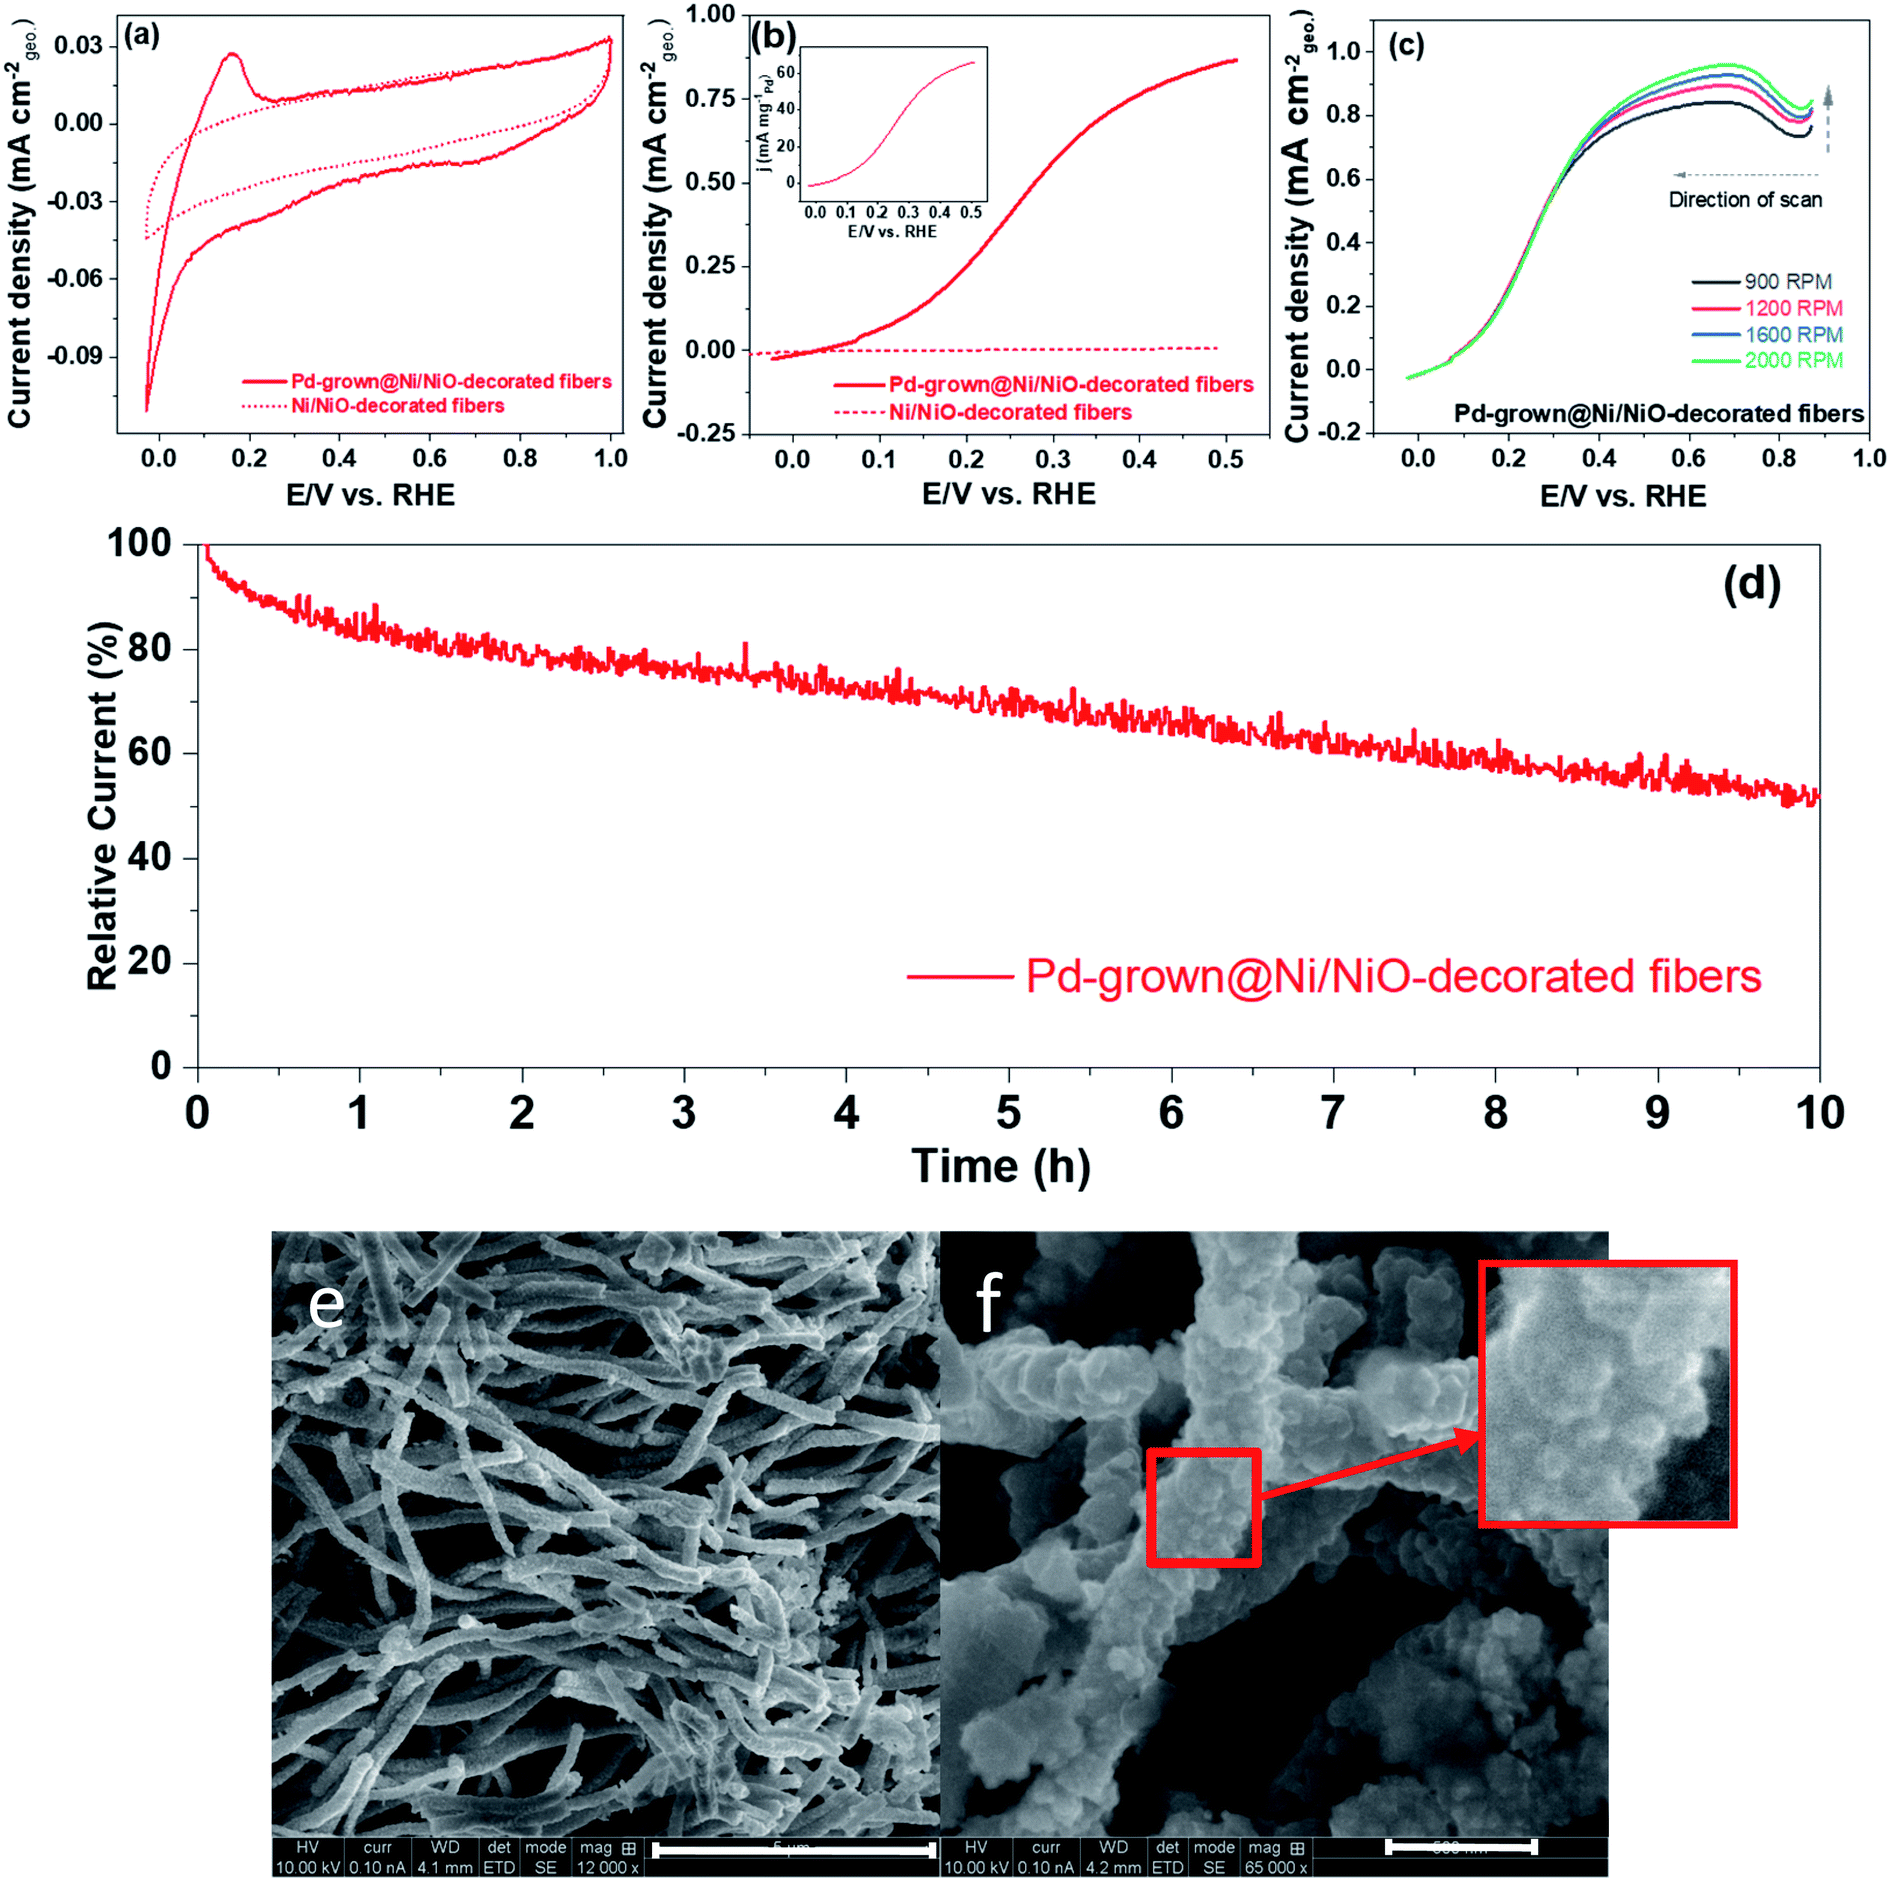 | ||
| Fig. 11 (a) Cyclic voltammograms (CVs) and (b) hydrogen oxidation polarization curve of Ni/NiO-decorated fibers and Pd-grown@Ni/NiO-decorated fibers. The CV is recorded in argon-saturated 0.1 M KOH electrode at a scan rate of 50 mV s−1, and the HOR polarization curves were recorded in 0.1 M electrolyte at a scan rate of 5 mV s−1 with 1600 RPM. Inset to (b) shown mass-normalized activity of Pd-grown@Ni/NiO-decorated fibers, (c) HOR polarization as a function of the rotation speed of the electrode of Pd-grown@Ni/NiO-decorated fibers, and (d) chronoamperometric curves of Pd-grown@Ni/NiO-decorated fibers at 0.37 V in H2-saturated 0.1 M KOH electrolyte with 1600 RPM. (e) and (f) XHR-SEM images of Pd-grown@Ni-fiber composite. Close-up of the surface morphology is seen in the square. Bars: (e) – 5 μm, (f) – 500 nm. | ||
4. Conclusion
Traditionally, 3D dispersion and support of metallic NPs for a variety of applications have been carried out on porous ceramics, glasses, and cross-linked polymers. Here we advance the use of metal for that purpose. Several methods have been developed and are presented, which are based on the entrapment of pre-prepared NPs within the metallic matrices during their reductive formation from the metals' cations; and on the reductive formation of the NPs within pre-prepared metallic matrices, either aggregated porous metals, or metallic foams. Various combinations of metallic NPs and metallic matrices were used, based on Ag, Au, Pt, Pd, Rh, Ir, and Ni. Of the potential applications of dispersed metallic NP, the feasibility of their use in catalysis was demonstrated on the catalyzed reduction of polluting dyes, and on the fuel-cell electrocatalyzed oxidation of hydrogen. We believe that the results shown here can be generalized to other protocols using metal entrapment for any pair of metals, M1 and M2, of relevance.Conflicts of interest
There are no conflicts of interest to declare.Acknowledgements
This work was partially funded by the Nancy & Stephen Grand Technion Energy Program (GTEP); by the Ministry of Science, Technology & Space of Israel through grant No. 3-12948; by the Israel Science Foundation (ISF) [grant No. 1481/17]; by the Russell Berrie Nanotechnology Institute, Technion.References
- J. M. Campelo, D. Luna, R. Luque, J. M. Marinas and A. A. Romero, Sustainable Preparation of Supported Metal Nanoparticles and Their Applications in Catalysis, ChemSusChem, 2009, 2(1), 18–45 CrossRef CAS PubMed.
- Q. L. Zhu and Q. Xu, Immobilization of Ultrafine Metal Nanoparticles to High-Surface-Area Materials and Their Catalytic Applications, Chem, 2016, 1(2), 220–245 CAS.
- J. R. Davis, Alloying: Understanding the Basics, ASM International, Materials Park, OH, 2001 Search PubMed.
- Y. Han, H. Xu, Y. Su, Z. Xu, K. Wang and W. Wang, Noble Metal (Pt, Au@Pd) Nanoparticles Supported on Metal Organic Framework (MOF-74) Nanoshuttles as High-Selectivity CO2 Conversion Catalysts, J. Catal., 2019, 370, 70–78 CrossRef CAS.
- Z. Zheng, H. Xu, Z. Xu and J. Ge, A Monodispersed Spherical Zr-Based Metal–Organic Framework Catalyst, Pt/Au@Pd@UIO-66, Comprising an Au@Pd Core–Shell Encapsulated in a UIO-66 Center and Its Highly Selective CO2 Hydrogenation to Produce CO, Small, 2018, 14(5), 1–8 CrossRef PubMed.
- Y. Fang, C. Li, J. Bo, J. Henzie, Y. Yamauchi and T. Asahi, Chiral Sensing with Mesoporous Pd@Pt Nanoparticles, ChemElectroChem, 2017, 4(8), 1832–1835 CrossRef CAS.
- D. Avnir, Recent Progress in the Study of Molecularly Doped Metals, Adv. Mater., 2018, 30(41), 1–6 CrossRef PubMed.
- D. Avnir, Molecularly Doped Metals, Acc. Chem. Res., 2014, 47(2), 579–592 CrossRef CAS PubMed.
- N. Ralbag, E. S. Davydova, M. Mann-Lahav, P. Cong, J. He, A. M. Beale, G. S. Grader, D. Avnir and D. R. Dekel, Ceria Entrapped Palladium Novel Composites for Hydrogen Oxidation Reaction in Alkaline Medium, J. Electrochem. Soc., 2020, 167(5), 054514 CrossRef CAS.
- N. Ralbag, I. Felner and D. Avnir, Induction of Enhanced Magnetic Behavior in Gold, Silver, and Copper by Doping with SrF E12 O19 Nanoparticles, Phys. Rev. B, 2019, 99(6), 1–7 CrossRef.
- J. He, B. Ji, S. Koley, U. Banin and D. Avnir, Metallic Conductive Luminescent Film, ACS Nano, 2019, 13(9), 10826–10834 CrossRef CAS PubMed.
- I. Yosef and D. Avnir, Metal-Organic Composites: The Heterogeneous Organic Doping of the Coin Metals-Copper, Silver, and Gold, Chem. Mater., 2006, 18(25), 5890–5896 CrossRef CAS.
- K. S. Krishna, C. S. S. Sandeep, R. Philip and M. Eswaramoorthy, Mixing Does the Magic: A Rapid Synthesis of High Surface Area Noble Metal Nanosponges Showing Broadband Nonlinear Optical Response, ACS Nano, 2010, 4(5), 2681–2688 CrossRef CAS PubMed.
- N. Gupta, H. P. Singh and R. K. Sharma, Metal Nanoparticles with High Catalytic Activity in Degradation of Methyl Orange: An Electron Relay Effect, J. Mol. Catal. A: Chem., 2011, 335(1–2), 248–252 CrossRef CAS.
- R. Narayanan and M. A. El-sayed, Shape-Dependent Catalytic Activity of Platinum Nanoparticles in Colloidal Solution, 2004 Search PubMed.
- J. He, L. Iagher, L. Etgar and D. Avnir, Fine-Tuning of the Metal Work Function by Molecular Doping, Chem. Commun., 2018, 54(52), 7203–7206 RSC.
- B. Menagen, R. Pedahzur and D. Avnir, Sustained Release from a Metal - Analgesics Entrapped within Biocidal Silver, Sci. Rep., 2017, 7(1), 1–11 CrossRef CAS PubMed.
- S. Alex and A. Tiwari, Functionalized Gold Nanoparticles: Synthesis, Properties and Applications-A Review, J. Nanosci. Nanotechnol., 2015, 15(3), 1869–1894 CrossRef CAS PubMed.
- H. Tsunoyama, H. Sakurai, N. Ichikuni, Y. Negishi and T. Tsukuda, Colloidal Gold Nanoparticles as Catalyst for Carbon-Carbon Bond Formation: Application to Aerobic Homocoupling of Phenylboronic Acid in Water, Langmuir, 2004, 20(26), 11293–11296 CrossRef CAS PubMed.
- M. J. Sharif, P. Maity, S. Yamazoe and T. Tsukuda, Selective Hydrogenation of Nitroaromatics by Colloidal Iridium Nanoparticles, Chem. Lett., 2013, 42(9), 1023–1025 CrossRef CAS.
- Y. Zhao, J. A. Baeza, N. K. Rao, L. Calvo, M. A. Gilarranz, Y. D. Li and L. Lefferts, Unsupported PVA- and PVP-Stabilized Pd Nanoparticles as Catalyst for Nitrite Hydrogenation in Aqueous Phase, J. Catal., 2014, 318, 162–169 CrossRef CAS.
- K. M. Koczkur, S. Mourdikoudis, L. Polavarapu and S. E. Skrabalak, Polyvinylpyrrolidone (PVP) in Nanoparticle Synthesis, Dalton Trans., 2015, 44(41), 17883–17905 RSC.
- B. Vellaichamy and P. Periakaruppan, Ag Nanoshell Catalyzed Dedying of Industrial Effluents, RSC Adv., 2016, 6(38), 31653–31660 RSC.
- J. Pakarinen, L. He, A. R. Hassan, Y. Wang, M. Gupta, A. El-Azab and T. R. Allen, Annealing-Induced Lattice Recovery in Room-Temperature Xenon Irradiated CeO2: X-Ray Diffraction and Electron Energy Loss Spectroscopy Experiments, J. Mater. Res., 2015, 30(9), 1555–1562 CrossRef CAS.
- M. Bahrami and S. Jafar Hoseini, Simultaneous Formation of Platinum-Based Nanocatalysts and Degradation of Dyes at Oil/Water Interface: Comparative Morphological and Kinetic Studies, Appl. Organomet. Chem., 2018, 32(1), 1–12 CrossRef.
- A. K. Ilunga, B. B. Mamba and T. T. I. Nkambule, Fabrication of Palladium and Platinum Nanocatalysts Stabilized by Polyvinylpyrrolidone and Their Use in the Hydrogenolysis of Methyl Orange, React. Kinet., Mech. Catal., 2020, 129(2), 991–1005 CrossRef CAS.
- X. Liu, F. Wang, Z. Chen, M. Megharaj and R. Naidu, Heterogeneous Fenton Oxidation of Direct Black G in Dye Effluent Using Functional Kaolin-Supported Nanoscale Zero Iron, Environ. Sci. Pollut. Res., 2014, 21(3), 1936–1943 CrossRef CAS PubMed.
- K. M. Carroll, A. W. Knoll, H. Wolf and U. Duerig, Explaining the Transition from Diffusion Limited to Reaction Limited Surface Assembly of Molecular Species through Spatial Variations, Langmuir, 2018, 34(1), 73–80 CrossRef CAS PubMed.
- P. Hervés, M. Pérez-Lorenzo, L. M. Liz-Marzán, J. Dzubiella, Y. Lub and M. Ballauff, Catalysis by Metallic Nanoparticles in Aqueous Solution: Model Reactions, Chem. Soc. Rev., 2012, 41(17), 5577–5587 RSC.
- A. K. Ilunga, B. B. Mamba and T. T. I. Nkambule, Ferricyanide Reduction to Elucidate Kinetic and Electrochemical Activities on the Metal Nanocatalysts Surface, Chem. Eng. J., 2020, 398(May), 125623 CrossRef CAS.
- Y. Li, J. Petroski and M. A. El-Sayed, Activation Energy of the Reaction between Hexacyanoferrate(IH) and Thiosulfate Ions Catalyzed by Platinum Nanoparticles, J. Phys. Chem. B, 2000, 104(47), 10956–10959 CrossRef CAS.
- M. Sakir and M. S. Onses, Solid Substrates Decorated with Ag Nanostructures for the Catalytic Degradation of Methyl Orange, Results Phys., 2019, 12, 1133–1141 CrossRef.
- J. Durst, A. Siebel, C. Simon, F. Hasché, J. Herranz and H. A. Gasteiger, New Insights into the Electrochemical Hydrogen Oxidation and Evolution Reaction Mechanism, Energy Environ. Sci., 2014, 7(7), 2255–2260 RSC.
- M. Alesker, M. Page, M. Shviro, Y. Paska, G. Gershinsky, D. R. Dekel and D. Zitoun, Palladium/Nickel Bifunctional Electrocatalyst for Hydrogen Oxidation Reaction in Alkaline Membrane Fuel Cell, J. Power Sources, 2016, 304, 332–339 CrossRef CAS.
- D. Strmcnik, M. Uchimura, C. Wang, R. Subbaraman, N. Danilovic, D. van der Vliet, A. P. Paulikas, V. R. Stamenkovic and N. M. Markovic, Improving the Hydrogen Oxidation Reaction Rate by Promotion of Hydroxyl Adsorption, Nat. Chem., 2013, 5(4), 300–306 CrossRef CAS PubMed.
- F. Hegge, F. Lombeck, E. Cruz Ortiz, L. Bohn, M. von Holst, M. Kroschel, J. Hübner, M. Breitwieser, P. Strasser and S. Vierrath, Efficient and Stable Low Iridium Loaded Anodes for PEM Water Electrolysis Made Possible by Nanofiber Interlayers, ACS Appl. Energy Mater., 2020, 3(9), 8276–8284 CrossRef CAS.
- A. C. Arulrajan, P. Subramanian, R. K. Singh and A. Schechter, Pd-Decorated Tungsten as Pt-Free Bimetallic Catalysts for Hydrogen Oxidation Reaction in Alkaline Electrolyte, Isr. J. Chem., 2020, 60(5–6), 563–569 CrossRef CAS.
- V. Yarmiayev, M. Alesker, A. Muzikansky, M. Zysler and D. Zitoun, Enhancement of Palladium HOR Activity in Alkaline Conditions through Ceria Surface Doping, J. Electrochem. Soc., 2019, 166(7), F3234–F3239 CrossRef CAS.
- E. R. Hamo, R. K. Singh, J. C. Douglin, S. Chen, M. B. Hassine, E. Carbo-Argibay, S. Lu, H. Wang, P. J. Ferreira and B. A. Rosen, et al., Carbide-Supported PtRu Catalysts for Hydrogen Oxidation Reaction in Alkaline Electrolyte, ACS Catal., 2021, 11(2), 932–947 CrossRef CAS.
- A. Landman, S. Hadash, G. E. Shter, A. Ben-Azaria, H. Dotan, A. Rothschild and G. S. Grader, High Performance Core/Shell Ni/Ni(OH)2 Electrospun Nanofiber Anodes for Decoupled Water Splitting, Adv. Funct. Mater., 2021, 31, 2008118 CrossRef CAS.
Footnote |
| † Electronic supplementary information (ESI) available. See DOI: 10.1039/d1na00315a |
| This journal is © The Royal Society of Chemistry 2021 |