 Open Access Article
Enhanced electrochemical activities of morphologically tuned MnFe2O4 nanoneedles and nanoparticles integrated on reduced graphene oxide for highly efficient supercapacitor electrodes†
R.
Rajalakshmi
,
K. P.
Remya
,
C.
Viswanathan
 and
N.
Ponpandian
 *
*
Department of Nanoscience and Technology, Bharathiar University, Coimbatore 641 046, India. E-mail: ponpandian@buc.edu.in; Tel: +91-422-2428 421
First published on 18th March 2021
Abstract
The morphology of a nanoparticle strongly controls the path of electronic interaction, which directly correlates with the physicochemical properties and also the electrochemical comportment. Combining it with a two-dimensional (2D) material for a layer-by-layer approach will increase its possibilities in applications such as energy conversion and storage. Here, two different morphologies of MnFe2O4, nanoparticles and nanoneedles, are developed by a facile hydrothermal approach and sandwiched with reduced graphene oxide for constructing a 2D/3D sandwiched architecture. The rGO planar structure with abundant hierarchical short pores facilitates the thorough utilization of the utmost surface area to permeate the electrolyte within the structure to minimize the accumulation of rGO nanosheets laterally. The ferrite composited with rGO manifests high specific capacitance as the EDLC behaviour surpasses the faradaic pseudocapacitance boosting electrical conductivity compared to the as-synthesized MnFe2O4 structures. Benefiting from a 3D structure and the synergetic contribution of the MnFe2O4 nanoneedles and electrically conductive rGO layer, the MnFe2O4 nanoneedles@rGO electrode exhibits a high areal capacitance of 890 mF cm−2 and a remarkable specific capacitance of 1327 F g−1 at a current density of 5 mA cm−2. 93.36% of the initial capacitance was retained after 5000 cycles in 1 mol L−1 Na2SO4 indicating its high cycling stability. The synthesis route proves to be beneficial for a comprehensive yield of MnFe2O4@rGO nanosheets of different morphologies for use in the sophisticated design of energy-storing devices. This research strongly suggests that nanoparticle geometry, in addition to two-dimensional carbon-based materials, is a critical factor in a supercapacitor design.
1. Introduction
Sustainable technologies for energy conversion and storage remain an indispensable part of the current civilization taking into consideration the rising global economy with environmental consciousness. The present rapid depletion of fossil fuels and increasing environmental pollution have prompted the scientific community to focus on delivering green and environmentally friendly research output.1 In electrochemical energy storage (EES) technology, supercapacitors surpass batteries in many aspects as they possess some exceptional properties like fast recharge capability, high power density, long cycle life over repeated charge–discharge cycling and better endurance. They are diversified in various applications including portable electronic gadgets, power back up, hybrid electric vehicles and several microdevices.2,3 Motivated by the aforementioned endeavours, multitudinous efforts are being made to increase the quality of the electrode material which plays a pivotal role in the overall efficiency of a supercapacitor. Electrode materials are generally classified into two types: electric double layer capacitors (EDLCs) and pseudocapacitors.EDLC based supercapacitors have superior specific capacitance but are limited by low energy density as their storage mechanism occurs on the electrode surface at the interface between the electrolyte and electrode via electrostatic adsorption of electrical charge. This constricts their broader range of applications, where an appropriate power density is necessary only for a short period of time.4 Generally, carbon based materials such as graphene, carbon black, graphene oxide, reduced graphene oxide, etc., exhibit EDLC-type behaviour. In the case of pseudocapacitors, a very high energy density is obtained where the charge storage mechanism is due to fast faradaic redox reactions.5,6 Different types of metal oxides including spinel,7,8 transition metal oxides9,10 and conducting polymers11,12 have been reported as pseudocapacitive materials. However, these metal oxides suffer from sluggish ion diffusion problems and poor electrical conductivity resulting in low capacitive performance. Moreover, the inferior structural stability of conducting polymers limits the cycle life of the electrode.7 To circumvent these challenges, the beneficial features of the individual components of EDLC and pseudocapacitive materials are scrutinized to form a nanocomposite and developed into an efficient active electrode material.13
In our work, the pseudocapacitive constituent of the nanocomposite is designed as MnFe2O4, a spinel ferrite as it is advantageous with the coexistence of two different transition-metal ions Mn and Fe. Also, a rich faradaic redox reaction considering the multiple oxidation states of Mn will meet the requirements of an efficient electroactive component.14–16 Many research groups have already tried to synthesize MnFe2O4 by various wet chemical methods including co-precipitation, solvothermal, and template-assisted methods.17,18 The solvothermal method proves to be advantageous compared to the other wet chemical methods as the working parameters such as pH, temperature, solvent selection, etc. could be altered in a wider range.19 However, the material performance depends on not only the synthesis route but also the morphology, size and microstructure of the sample obtained. Therefore, control over the morphology and uniform size of MnFe2O4 remains a major focus.20 Several morphologies of MnFe2O4 have been developed (spheres, clusters, needles, flakes, etc.). We have concentrated mainly on spherical and one-dimensional nanoneedles which were synthesized by altering the working parameters in the hydrothermal method.
Reduced graphene oxide (rGO) is taken as the EDLC component of the working electrode as its spongy wrinkled nature with a high surface area acts as a supportive matrix for MnFe2O4 to attach itself onto the layered surface. The scarcity of oxygen functional group in rGO compared to graphene oxide (GO) and the increase in C/O ratio above 6 facilitates a faster electron transport processing rGO compared to GO.21 Therefore, a decrease in the diffusion length of the ions enhances the electrical conductivity in the nanoscale domain thereby improving the effective electrochemical utilization of MnFe2O4 in the nanocomposite. Recently, research was made towards developing a complete cell for a supercapacitor comprising MnFe2O4/rGO as the cathode and rGO as the anode, which exhibited a good power density of 750 W kg−1 with an energy density of 28.12 W h kg−1. A prominent specific capacitance of 768 F g−1 was also attained at a current density of 8 A g−1 contributing to the overall performance of the fabricated cell.16 Another group fabricated a hybrid supercapacitor using a two-electrode system with the MnFe2O4/rGO nanocomposite which revealed a specific capacitance of 271 F g−1 at a current density of 0.5 A g−1 with an exceptional cycling durability of 104% after 5000 cycles.22 To our knowledge, only a few reports on the supercapacitive behaviour of morphology dependent MnFe2O4 on a carbon matrix (GO, rGO, CNT nanofibers, etc.) have been published, a summary of which is in Table 2. Herein, we report the preparation of MnFe2O4 nanoparticles–rGO nanocomposite and MnFe2O4 nanoneedles–rGO nanocomposite by a one-pot solvothermal method. The optimum weight percentage of MnFe2O4 and rGO was fixed before depositing over a stainless steel substrate. To determine the effect of the substrate, copper foil was also taken as an additive substrate. A three electrode set-up was arranged to determine the electrochemical properties of the synthesized materials and their specific capacitance was evaluated by cyclic voltammetric and galvanostatic charge–discharge measurements. The electrochemical performance of the two pristine and rGO nanocomposites of MnFe2O4 was evaluated by calculating specific capacitance from both cyclic voltammetry and galvanostatic charge–discharge measurements. The Trasatti method was applied to determine the contribution of pseudocapacitance and electric double layer capacitance. The results of power density, energy density and cycling stability demonstrate that the MnFe2O4 nanorods–rGO nanocomposite could be an optimal choice for supercapacitor electrode material characterized by its high specific capacitance and related properties.
2. Experimental section
2.1 Chemicals and reagents
Graphite powder (325 mesh) and manganese chloride (MnCl2·4H2O) were purchased from Sigma. Ferric chloride (FeCl3·6H2O), sodium hydroxide (NaOH), potassium permanganate (KMnO4), ammonia solution, sodium nitrate (NaNO3), sulfuric acid (H2SO4), hydrogen peroxide (H2O2) and ethanol were obtained from HiMedia. All the chemicals purchased were of scientific grade and used directly without any purification.2.2 Synthesis of MnFe2O4 nanoparticle and nanoneedle structures
The preparation methodology for MnFe2O4 nanoneedles is reproduced from earlier work with some modifications.23 For a typical synthesis of MnFe2O4 nanoneedles named (M-nr), MnCl2·4H2O and FeCl3·6H2O were taken in a ratio of 1![[thin space (1/6-em)]](https://www.rsc.org/images/entities/char_2009.gif) :
:![[thin space (1/6-em)]](https://www.rsc.org/images/entities/char_2009.gif) 2 and stirred separately in 20 ml of distilled water until completely dissolved. The iron chloride solution was then added dropwise to the manganese chloride solution and stirred for another 30 minutes. Finally in this protocol, the required weight of NaOH was dissolved separately in 10 ml deionized water and it was added dropwise to the metal salt solution until the pH reached 14. The slurry was then decanted into a Teflon autoclave and kept at 180 °C for 18 hours. The obtained sample was washed with distilled water and ethanol to remove the impurities and finally dried in a vacuum at 80 °C for 6 h. To obtain MnFe2O4 nanoparticles described henceforth as (M-np), the same procedure was repeated except that the pH was maintained at 12 and the oven temperature was kept at 180 °C for 12 h.
2 and stirred separately in 20 ml of distilled water until completely dissolved. The iron chloride solution was then added dropwise to the manganese chloride solution and stirred for another 30 minutes. Finally in this protocol, the required weight of NaOH was dissolved separately in 10 ml deionized water and it was added dropwise to the metal salt solution until the pH reached 14. The slurry was then decanted into a Teflon autoclave and kept at 180 °C for 18 hours. The obtained sample was washed with distilled water and ethanol to remove the impurities and finally dried in a vacuum at 80 °C for 6 h. To obtain MnFe2O4 nanoparticles described henceforth as (M-np), the same procedure was repeated except that the pH was maintained at 12 and the oven temperature was kept at 180 °C for 12 h.
2.3 Synthesis of MnFe2O4/GO composites
Graphene oxide was synthesized based on a modified Hummer's method involving both the oxidation of the graphite sheets and further exfoliating them to obtain GO sheets as reported in our earlier work.24 In a typical process, 10 mg of the as-prepared GO was ultrasonicated in 20 ml DDW solution for several hours forming a uniform yellow-brown suspension. Then, the precursor solution of the respective MnFe2O4 (nanoparticles or needles) was added slowly to the GO suspension and sonicated for two hours. The mixture was transferred to a Teflon autoclave and refluxed at their respective temperatures mentioned before. The precipitate was rinsed several times and maintained at 80 °C overnight to obtain MnFe2O4 nanoparticles/rGO and MnFe2O4 nanoneedles/rGO composites denoted as M-np/rGO and M-nr/rGO respectively. The preparation protocol of the MnFe2O4 nanocomposites is presented schematically in Scheme 1.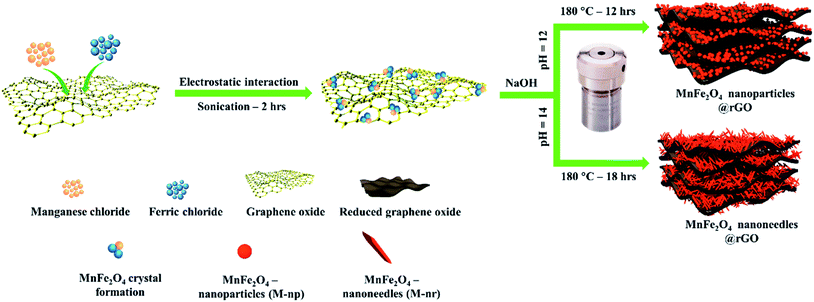 | ||
| Scheme 1 Schematic illustration of hydrothermal synthesis of morphologically tuned MnFe2O4/rGO nanocomposites of nanoparticles and nanoneedles. | ||
2.4 Characterization
The synthesized MnFe2O4 structures and their respective GO composites were characterized by using a Rigaku SmartLab X-ray diffractometer with monochromatized Cu Kα1 radiation (1.5406 Å) for their crystallographic details. The topographical and morphological information was obtained using a ZEISS, Merlin model Field Emission Scanning Electron Microscope (FESEM) with an accelerating voltage of 5 kV and the elemental analysis was done by energy dispersive X-ray spectroscopy (EDAX). Raman spectroscopy was performed on a Horiba Jobin Yvon LabRam-HR Raman spectrometer with a laser source with an excitation wavelength of 514 nm.![[thin space (1/6-em)]](https://www.rsc.org/images/entities/char_2009.gif) :
:![[thin space (1/6-em)]](https://www.rsc.org/images/entities/char_2009.gif) 1
1![[thin space (1/6-em)]](https://www.rsc.org/images/entities/char_2009.gif) :
:![[thin space (1/6-em)]](https://www.rsc.org/images/entities/char_2009.gif) 1 mixed with a drop of N-methylpyrrolidinone (NMP). The paste was coated uniformly using the doctor blade method onto a stainless steel substrate with a working area dimension of 1 × 1 cm2. The substrate was weighed before and after coating (dried) to calibrate the accurate mass of the active material coated. To determine the effect of the substrate, copper foil was also used as a substrate with the same dimension. Cyclic voltammetry (CV) from 0.1 to −0.35 V was performed with different scan rates ranging from 5 m to 100 mV s−1. The galvanostatic charge and discharge tests were carried out in the same potential window of CV. Electrochemical impedance spectroscopy (EIS) was performed by applying a frequency range from 1 Hz to 10 kHz.
1 mixed with a drop of N-methylpyrrolidinone (NMP). The paste was coated uniformly using the doctor blade method onto a stainless steel substrate with a working area dimension of 1 × 1 cm2. The substrate was weighed before and after coating (dried) to calibrate the accurate mass of the active material coated. To determine the effect of the substrate, copper foil was also used as a substrate with the same dimension. Cyclic voltammetry (CV) from 0.1 to −0.35 V was performed with different scan rates ranging from 5 m to 100 mV s−1. The galvanostatic charge and discharge tests were carried out in the same potential window of CV. Electrochemical impedance spectroscopy (EIS) was performed by applying a frequency range from 1 Hz to 10 kHz.
3. Results and discussion
3.1 Structural and functional group analysis
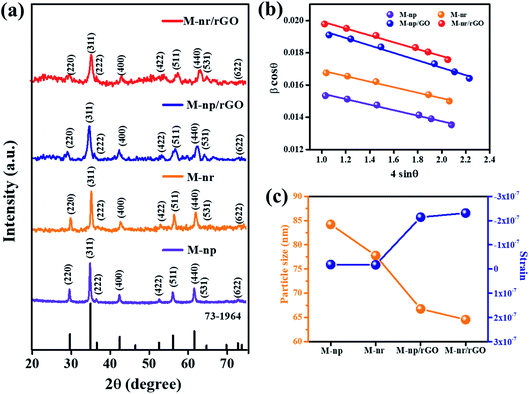
The crystalline nature and phase identification of the individual morphological components, as well as their respective reduced graphene oxide composites, were analyzed by XRD. Their X-ray diffraction (XRD) profile in the range of 20° < 2θ < 75° with a step size of 0.02° is shown in Fig. 1a. The sharpness of the highest intense peak (311) indicates that the material is highly crystallized without any impurities and its broadness indicates that the crystalline size is very small. The diffraction peaks observed at 2θ of 28.79, 33.5, 35.08, 40.47, 53, and 58.17° represent the Bragg reflections corresponding to the planes (220), (311), (222), (400), (422), (511), (440), (531), and (622) respectively confirming the spinel cubic structure of MnFe2O4 with the space group Fd![[3 with combining macron]](https://www.rsc.org/images/entities/char_0033_0304.gif) m (227) according to the JCPDS card no. 73-1964.25
m (227) according to the JCPDS card no. 73-1964.25
The distinctive peak of graphene oxide at 11.23° signifying the (001) plane is represented in the XRD diffractogram (Fig. S1†). The diffraction peaks for MnFe2O4/rGO nanocomposites show a low intense peak compared to the pure MnFe2O4 structures. Graphene related peaks were not observed in the composite which suggests that during the hydrothermal reaction, the GO is well exfoliated for the MnFe2O4 structures to nucleate and infuse into the graphene layers.26 Previous results suggest that the reflections of rGO in XRD also diminish due to the ultra-sonication which is further found to be reduced and aggregated into a multilayer structure.27,28
The interplanar spacing dhkl was calculated using Bragg's equation for the most prominent plane (311) which further helped to derive the experimental lattice constant from the relationship
| aexp = d(h2 + k2 + l2)1/2 | (1) |
The well-known Scherrer formula was used to determine the average crystalline size of the synthesized MnFe2O4 structures and nanocomposites29
D = kλ/β![[thin space (1/6-em)]](https://www.rsc.org/images/entities/char_2009.gif) cos cos![[thin space (1/6-em)]](https://www.rsc.org/images/entities/char_2009.gif) θ θ | (2) |
| βT = βs + βε | (3) |
β![[thin space (1/6-em)]](https://www.rsc.org/images/entities/char_2009.gif) cos cos![[thin space (1/6-em)]](https://www.rsc.org/images/entities/char_2009.gif) θ = ε(4 θ = ε(4![[thin space (1/6-em)]](https://www.rsc.org/images/entities/char_2009.gif) sin sin![[thin space (1/6-em)]](https://www.rsc.org/images/entities/char_2009.gif) θ) + kλ/P θ) + kλ/P | (4) |
When plotting 4![[thin space (1/6-em)]](https://www.rsc.org/images/entities/char_2009.gif) sin
sin![[thin space (1/6-em)]](https://www.rsc.org/images/entities/char_2009.gif) θ on the x-axis and β
θ on the x-axis and β![[thin space (1/6-em)]](https://www.rsc.org/images/entities/char_2009.gif) cos
cos![[thin space (1/6-em)]](https://www.rsc.org/images/entities/char_2009.gif) θ on the y-axis, the gradient (slope) of the line gives the strain (ε) and the grain size (P) can be calculated from the intercept of the line on the y-axis by equating it to the known parameters. From Fig. 1b, it is evident that the slopes are negative for all the plots indicating that only a minimum strain is developed.31 The strain developed is inversely proportional to the grain size which can be seen from Fig. 1c indicating an increase in the interface between the rGO layers. The calculated parameters are tabulated in Table 1. A decreasing trend is seen in the average grain size with the MnFe2O4 nanoneedle composite (M-nr/rGO) displaying the least value of 77 ± 2 nm. Also, the calculated d-spacing value of pure MnFe2O4 structures (∼2.542 Å) is very less compared to that of GO (7.869 Å) signifying that it could very easily impregnate between the graphene oxide layers and it also corresponds well to previously reported values.32
θ on the y-axis, the gradient (slope) of the line gives the strain (ε) and the grain size (P) can be calculated from the intercept of the line on the y-axis by equating it to the known parameters. From Fig. 1b, it is evident that the slopes are negative for all the plots indicating that only a minimum strain is developed.31 The strain developed is inversely proportional to the grain size which can be seen from Fig. 1c indicating an increase in the interface between the rGO layers. The calculated parameters are tabulated in Table 1. A decreasing trend is seen in the average grain size with the MnFe2O4 nanoneedle composite (M-nr/rGO) displaying the least value of 77 ± 2 nm. Also, the calculated d-spacing value of pure MnFe2O4 structures (∼2.542 Å) is very less compared to that of GO (7.869 Å) signifying that it could very easily impregnate between the graphene oxide layers and it also corresponds well to previously reported values.32
| Samples | Lattice distance (Å) | Lattice parameter (Å) [±0.005] | Lattice volume (Å3) | Average grain size (nm) [±2 nm] | Strain (ε) | |
|---|---|---|---|---|---|---|
| Scherrer formula | Williamson–Hall plot | |||||
| M-np | 2.542 | 8.446 | 602.494 | 98 | 84 | −1.834 × 10⁻⁸ |
| M-nr | 2.537 | 8.442 | 601.639 | 94 | 78 | −1.72 × 10⁻⁸ |
| M-np/rGO | 2.523 | 8.439 | 600.997 | 81 | 67 | −2.14 × 10⁻⁷ |
| M-nr/rGO | 2.512 | 8.435 | 600.143 | 77 | 65 | −2.31 × 10⁻⁷ |
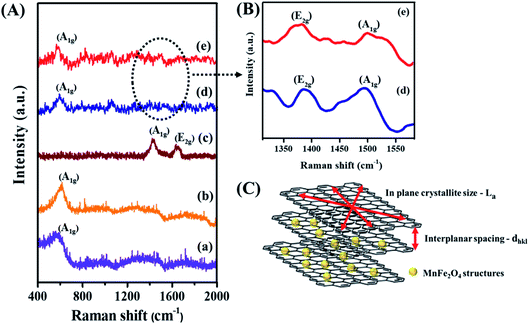
Raman spectroscopy is an essential tool to explore the structural properties of the synthesized materials. Fig. 2A shows the Raman spectra of M-np, M-nr, graphene oxide (GO), M-np/rGO and M-nr/rGO nanocomposites. In MnFe2O4, oxygen atoms at the tetragonal sites are prone to symmetric stretching represented as the A1g mode. The peaks appearing at 560 cm−1 in all the spectra except Fig. 2A(c) denotes this A1g mode.33 In GO, the vibrations of the planar sp2 carbon atoms denoted as the E2g symmetry (also called the G band) originate at 1592 cm−1 as illustrated in Fig. 2A(c). The graphene layer width can be correlated with the decrease in the lattice spacing of the nanocomposites. The band at 1350 cm−1 (Fig. 2B) represents the j-point phonons of A1g symmetry, also called the D band or the defect band. It corresponds to the defect levels or the agglomeration formed within the graphene layers. The intense D band in the GO spectra is associated with the cleavage of sp2 bonds to generate more sp3 bonds.34,35 The ratio of ID/IG is deduced to be 1.45 and 1.46 for M-np/rGO and M-nr/rGO nanocomposites respectively, compared to graphene oxide (0.97) suggesting the reduction of GO to rGO. The ratio of the D band to G band intensity can also be used to determine the in-plane crystallite size (La) of the graphene oxide layers as shown in Fig. 2C using the relationship of36
| La (nm) = 4.4 × ID/IG | (5) |
The calculated results suggest that the M-nr/rGO nanocomposite has a larger in-plane crystallite size of 6.45 nm compared to the M-np/rGO nanocomposite with 6.38 nm and GO with 4.3 nm respectively. This demonstrates that the GO sheets were well exfoliated during the nanocomposite formation to make room for the MnFe2O4 structures to disperse well on the layers of GO.
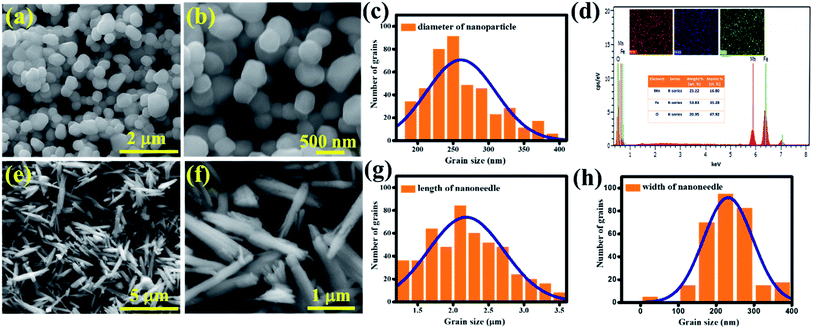
An insight into the morphology and microstructure of the synthesized samples was obtained by FESEM. The morphology of the sample depends purely on the synthesis method and it is substantiated from Fig. 3a and b that MnFe2O4 nanoparticles are spherical. The diameter of the spherical structure is ∼250 nm described in the form of a histogram (Fig. 3c) and the elemental details are confirmed by EDAX analysis (Fig. 3d) and mapping (inset). The needle like morphology of MnFe2O4 is confirmed from Fig. 3e. The edges of the needle are in a split fashion (Fig. 3f) which is not reported elsewhere. This morphology is more beneficial as the surface area is enhanced in the edges when compared to the spherical nanoparticles. The M-nr samples exhibited a significantly high-aspect ratio with a height profile of ∼2.2 μm and a width of ∼220 nm.
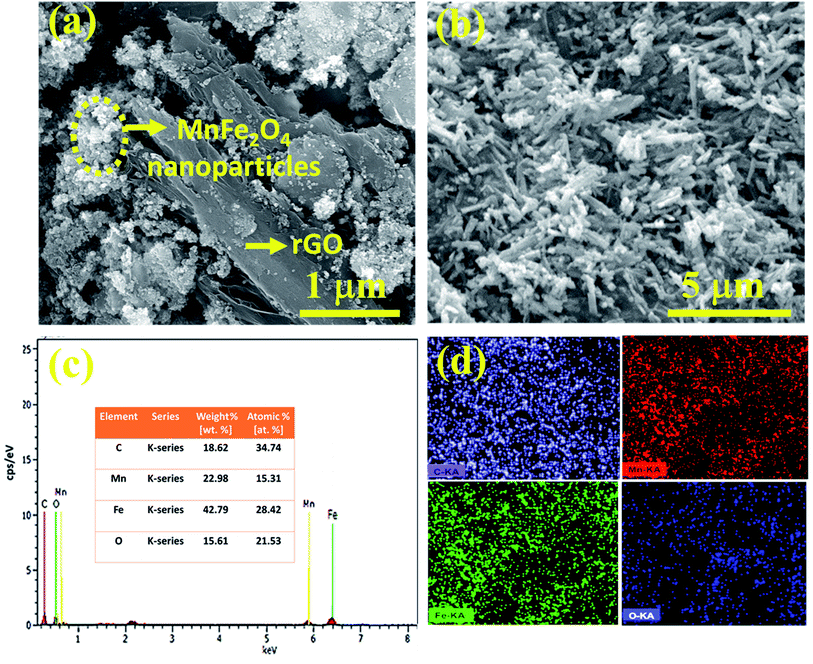
Fig. 4a reveals the binary composite morphology of MnFe2O4 nanoparticles and nanoneedles with the rGO sheets. The spherical structure of the nanoparticles is agglomerated with the rGO sheets. In contrast, when a MnFe2O4 nanoneedle is composited with rGO (Fig. 4b) it retains its morphology as the nanoneedles are interrelatedly spread on the 2-dimensional surface which further promoted the electron transfer and intensified the active sites thereby suppressing agglomeration.37Fig. 4c shows the survey spectrum of the M-nr/rGO sample providing proof for the existence of elements Mn, Fe, O and C. The ratio of atomic contents of Mn and Fe is about 1![[thin space (1/6-em)]](https://www.rsc.org/images/entities/char_2009.gif) :
:![[thin space (1/6-em)]](https://www.rsc.org/images/entities/char_2009.gif) 2 and the carbon content is predominantly from graphene exposed on the surface. Their respective EDS mapping is presented in Fig. 4d.
2 and the carbon content is predominantly from graphene exposed on the surface. Their respective EDS mapping is presented in Fig. 4d.
3.2 Electrochemical properties
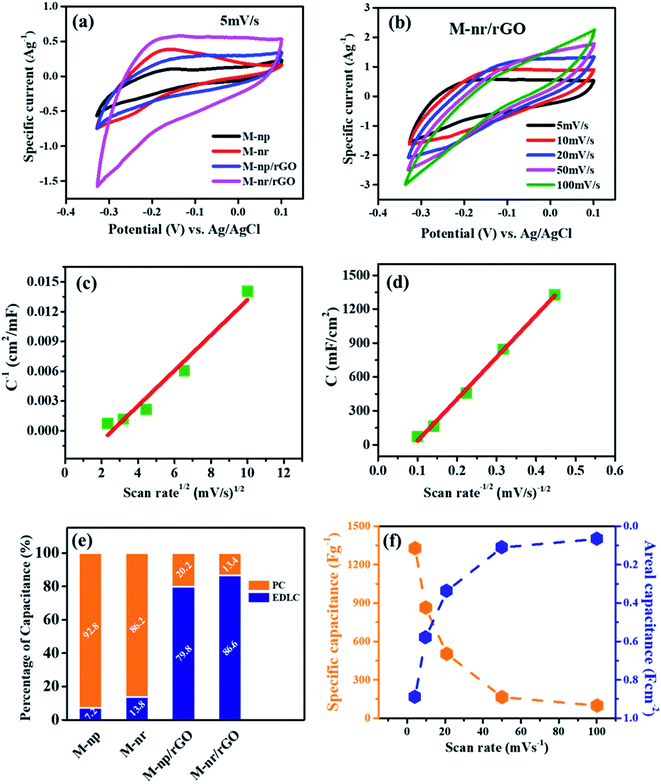
For effective practical application as a supercapacitor, the electrochemical performances were evaluated with the aid of a three-electrode system where the respective sample of MnFe2O4 was employed as the working electrode against Ag/AgCl as the reference and Pt wire as the counter electrode in a 1 M Na2SO4 aqueous electrolyte. Initially, the cyclic voltammograms of individual electrodes depicted in Fig. 5a at a constant scan rate of 5 mV s−1 clearly show that M-Mn/rGO possesses the maximum area under the CV curve with the maximum current density. This can be ascribed to the differences in the structure and crystalline size between the nanoparticle and needle-like structures of MnFe2O4 and also due to the synergetic effect of the graphene composite with the ferrite. Also, the contact area between the electrode and the electrolyte as well as the rate of the electrode reaction is enhanced with the graphene architecture incorporated into the 1-D needle like MnFe2O4 structures.38 Compared to pure MnFe2O4 structures, the CV graph of porous graphene oxide recorded in 1 M Na2SO4 solution is nearly rectangular in shape. No distinct peaks are observed signifying that the redox reaction is absent and there are no distortions in the curves even at a scan rate of 100 mV s−1 (Fig. S3†). This indicates excellent capacitance behaviour and fast diffusion of electrolyte ions into the electrode.39 Although the integration of a carbon content into the MnFe2O4 matrix increases the efficacy, that alone is not sufficient to increase the capacitance which is clearly evident from the vast difference in the current densities of M-Np/rGO and M-Mn/rGO. The agglomeration of the MnFe2O4 nanoparticles (M-Np) onto the rGO demonstrated through FESEM discloses that the transport of electrolytic ions through the electrolyte is compromised leading to the above said issue.40The cyclic voltammograms of M-Mn/rGO between the potential 0.1 and −0.35 V were recorded at various scan rates (5, 10, 20, 50, and 100 mV s−1) as illustrated in Fig. 5b. The area under the curve was found to be proportional to the scan rate. The virtually symmetrical redox peaks indicate good reversibility during charging and discharging and the structure of the CV curve implies that the pseudocapacitive behaviour of the electrode is mainly governed by a faradaic redox reaction. This is attributed to the intercalation/extraction of Na+ ions from the electrolyte at low scan rates as slow faradaic reactions contribute to more active sites from the inner surface of the working electrode for charge storage. The Na+ ions interact with the MnFe2O4 structures in the electrolyte by a redox couple reaction which is reversible as shown in eqn (6):27,41
| xNa+xe− + MnFe2O4 ⇔ NaxMnFe2O4 | (6) |
Fig. 5f shows the specific capacitance and areal capacitance of the active electrode material acquired from CV curves at different scan rates using the relationship:
 | (7) |
 | (8) |
A maximum specific capacitance of 1327 F g−1 and an areal capacitance of 890 mF cm−2 were observed at the lowest measured scan rate of 5 mV s−1 (Fig. 5f). The active sites in the MnFe2O4/rGO nanoneedles are explored more as the permeable surface structure is beneficial to enrich the electrochemical behaviour. At a lower scan rate, a higher capacitance value is guaranteed as the electrode is fully diffused by Na+ ions due to more time utilization. In contrast, a low specific capacitance at a higher scan rate is an outcome of the restriction of the same ions due to time limitation. The specific capacitance of all the working electrodes is demonstrated in Fig. S4.† The lower values of the specific capacitance of pure MnFe2O4 np and nr may be due to the surface adsorption charge storage mechanism and intrinsically poor electronic conductivity of the electrode and these two prominent factors are related to the average crystallite size of the structures calculated by XRD. The grain size is directly proportional to the electronic conductivity and inversely proportional to the specific surface area.42–44 Therefore tailoring the synthesis parameters to tune the shape and crystallite size of the material promotes optimum electrochemical properties.
To detect the origin of capacitive behaviour at a fundamental level, the Trasatti method was employed to explore the contribution of double-layer capacitance and pseudocapacitance towards the overall specific capacitance.44,45 The surface capacitive effect is due to the exterior electrochemical sites specified by the direct exposure of the electrode and electrolyte whereas the diffusion-controlled intercalation process is from the interior regions of flaws such as cracks, cavities, fissures and fractures in the grain boundaries.46 The current response i(V) at a fixed scan rate as a combination of these two effects can be expressed as:
| i(V) = k1v + k2v1/2 | (9) |
| i(V)/v1/2 = k1v1/2 + k2 | (10) |
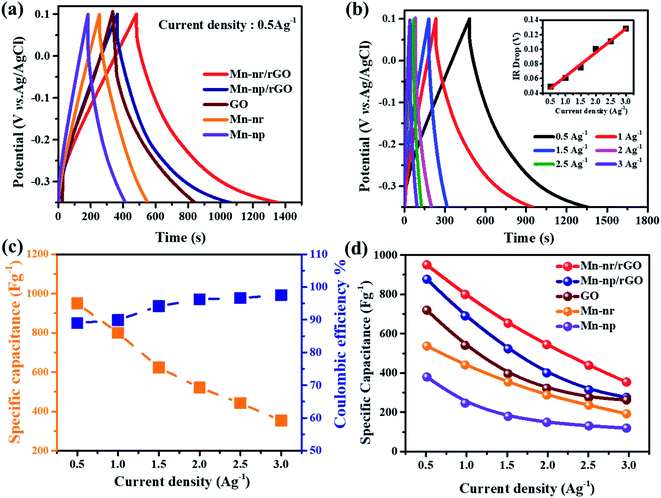
To evaluate the storage capability of all the electrodes in the three-electrode system, the electrochemical performance concerning charge and discharge behaviour was determined at a constant current density of 0.5 A g−1 (Fig. 6a) with voltage between 0.1 and −0.35 V. The specific capacitance or gravimetric capacitance, ‘Cs’, and the coulombic efficiency, ‘η’, from galvanostatic charge–discharge were calculated using eqn (11) and (12) respectively.
 | (11) |
 | (12) |
Good rate capability and coulombic efficiency are the main criteria to evaluate the practical application of a supercapacitor. Fig. 6b shows the GCD performance of the MnFe2O4/rGO nanoneedle composite from 0.5 to 3 A g−1 with a difference in current density of 0.5 A g−1. It can be seen that the charge–discharge curves at all the current densities are dimensionally symmetrical with a trivial IR drop indicating small internal resistance and better reversibility of the electrode.51 The IR drop in the Fig. 6b inset showed a linear increase from 0.04 Ω to 0.12 Ω with increasing current density. The specific capacitance of the composite electrode scaled to 950 F g−1 at 0.5 A g−1 demonstrated a high coulombic efficiency of ∼97.5% and retained a capacitance of 354 F g−1 at 3 A g−1 with an efficiency of 89% suggesting admirable rate performance (Fig. 6c). In contrast, for pristine MnFe2O4 nanoparticles, the specific capacitance decreased from 380 F g−1 to 118 F g−1 signifying a very low capacitive retention rate. The interface between the rGO layer and pristine MnFe2O4 serves as a reason for the synergistic effect between the pseudocapacitance and the electric-double layer mechanism.52 Moreover, the active surface area of 1-D MnFe2O4 nanoneedles compared to that of the MnFe2O4 nanoparticles provides high exposure of electroactive sites for rapid diffusion of ions demonstrating good rate capability and high specific capacitance of the MnFe2O4 nanoneedle composite electrode. The specific capacitance of pristine and composite electrodes of MnFe2O4 is calculated, compared and illustrated in Fig. 6d.
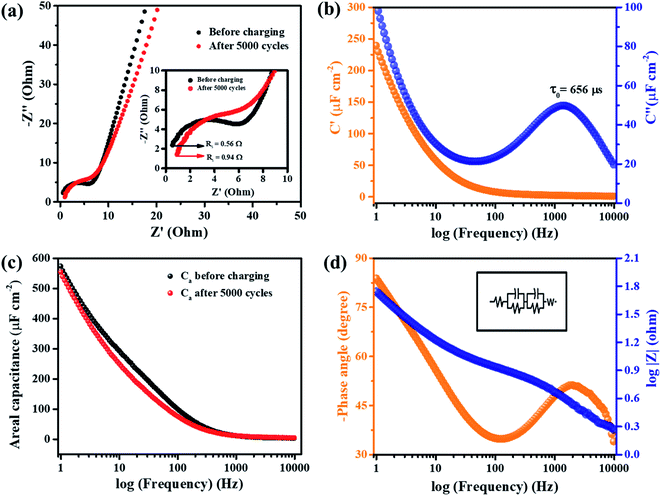
Electrochemical impedance spectroscopy (EIS) of MnFe2O4/rGO nanoneedles which exhibited superior electrochemical properties was performed at room temperature to determine the electrode's fundamental behaviour in the electrolyte. The Nyquist plot before and after charging for 5000 cycles is shown in Fig. 7a. The spectra show a semicircle that intersects the real axis in the high-frequency region, where the resistance (Rs) in the ionic conductivity of the electrolyte system is enlarged in the inset. The mid and the low-frequency region reveal a virtually vertical line around 45° called the Warburg element which distinguishes an electrode with high porosity and capacitance.53 A smaller value of Rs is advantageous for better ionic conduction and decreasing the ohmic losses.54 The Rs value increased from 0.56 Ω to 0.94 Ω after 2000 cycles (Fig. 7a inset) indicating a diminution in the overall electrochemical behaviour of the electrode material.
Furthermore, an important constraint to determine the power capability of a capacitor is the “Knee frequency” where a shift occurs from the high frequency to the low frequency component.54 The knee frequency value before charging was 233 Hz, signifying that the electrode could be operated up to 233 Hz to utilize its capacitive properties. The value decreased to 136 Hz after charging for 5000 cycles.
The areal capacitance, Ca, from EIS was calculated using the relationships,
 | (13) |
| C(ω) = C′(ω) + C′′(ω) | (14) |
 | (15) |
 | (16) |
The areal capacitance of the composite electrode before and after charging is plotted versus the log of frequency (Hz) from eqn (13) and demonstrated in Fig. 7c. The calculated areal capacitance starts with a value of 3.5 μF cm−2 at 10 kHz in both cases indicating that the resistive nature of the electrode does not change even after charging. In contrast, the capacitance increases to 573 μF cm−2 for the electrode before charging and a slightly less capacitance value is seen in the mid and low frequency regions of the electrode after charging, which matches with the Rs values and knee frequency values mentioned earlier.
The Bode plots of the phase angle and total impedance |Z| versus frequency (Hz) are shown in Fig. 7d with the equivalent circuit presented in the inset. The graph implies that the phase angle (Φ) in the lower frequency region is −84° confirming the capacitive properties of the electrode (Φ = 0°) for an ideal resistor and (Φ = 90°) for an ideal supercapacitor in the low frequency region.54 The impedance Bode plot shows inclination in the low frequency region (LF), the mid-frequency region (MF) and the high frequency region (HF). The slope values were in the order of LF (1–50 Hz) > HF (500–1000 Hz) > MF (50–500 Hz) (Fig. S5†). The high slope value in the LF region is possibly due to the resistive behaviour at the interfaces, and the HF regions combine the characteristics of both the resistive and the capacitive component, but the least slope value in the MF regions depicts purely the capacitive nature of the electrode.56
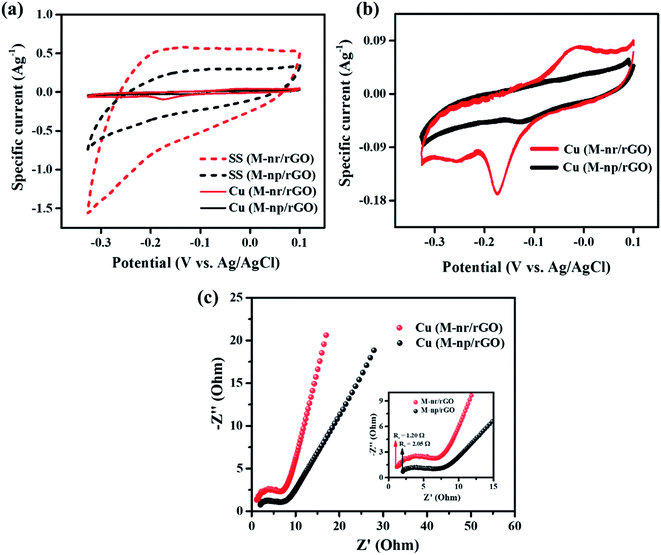
To understand the substrate dependency concerning the electrochemical performance of the synthesized MnFe2O4 samples, the MnFe2O4/rGO composites comprising nanoneedles and nanoparticles were deposited on copper foil with no modification in any other parameters. The samples were labelled with the prefix Cu and SS for copper foil and stainless steel substrates respectively. From the cyclic voltammetry test depicted in Fig. 8a and b, the area under the curve of the samples deposited on the Cu substrate is drastically less compared to that of the previously available results of the SS substrate. The enlarged view of MnFe2O4/rGO composites deposited on the copper substrate is shown in Fig. 8b, where the maximum specific current obtained is only 0.09 A g−1. The rationale behind this is that copper ions on the substrate tend to react with the electrolyte, which leads to the diffusion of ions within the electrode. This increases the total resistance of the system thereby hindering the overall stability of the electrode.57,58 Fig. S6† illustrates the cyclic voltammograms of MnFe2O4/rGO nanoneedles and nanoparticles deposited on the Cu substrate recorded at various scan rates from 5 to 100 mV s−1. It is clear from the CV profile that both the composite samples exhibit redox peaks different from the ideal rectangular shape for double-layer capacitance revealing that the samples deposited on the copper substrate possess pseudocapacitance properties.59 The impedance spectra shown in Fig. 8c describe the certainty that the Rs value has almost doubled to 1.20 Ω (for Cu(M-Mr/rGO)) and tripled to 2.05 Ω (for Cu(M-Mp/rGO)) compared to SS(M-Mr/rGO) (from Fig. 7a), revealing an escalation in ohmic losses.
The overall performance of the MnFe2O4/rGO binary composite is investigated by calculating the energy density (W h kg−1) and power density (W kg−1) using the relationships (17) and (18) as represented in the Ragone plot in Fig. 9a.
 | (17) |
 | (18) |
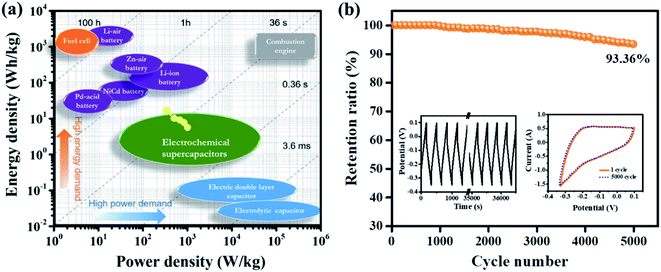 | ||
| Fig. 9 (a) The Ragone plot for MnFe2O4/rGO nanoneedles (background adapted from ref. 46) and (b) cycling stability of MnFe2O4/rGO nanoneedles for 5000 cycles (inset shows the galvanostatic charge–discharge curves for a different number of cycles and CV taken at 1.5 A g−1 and 5 mV s−1 respectively after completing the 5000 cycles). | ||
| Sample | Synthesis method | Electrolyte | Specific capacitance (F g−1) | Energy density (W h kg−1) | Power density (kW kg−1) | Rate capability/retention | Ref. |
|---|---|---|---|---|---|---|---|
| MnFe2O4NPs | Thermal decomposition | 2 M KOH | 25.21 at (50 mV s−1) | 12.60 | 0.74 | — | 62 |
| MnFe2O4 microspheres | Solvothermal | 2 M KOH | 88.4 at (0.01 A g−1) | — | — | 69.2% after 2000 cycles | 63 |
| MnFe2O4 nanocube | Hydrothermal | 1 M NaCl | 32 at (0.5 mA cm−2) | — | — | — | 55 |
| MnO2/CNT | Co-precipitation | 1 M Na2SO4 | 201 at (1 A g−1) | 3.3 | 6 | 100% after 10![[thin space (1/6-em)]](https://www.rsc.org/images/entities/char_2009.gif) 000 cycles 000 cycles |
64 |
| MnFe2O4/carbon black | Co-precipitation | 1 M NaCl | ∼55 at (200 mV s−1) | 7.6 | 0.11 | 100% after 3000 cycles | 65 |
| PANI/MnFe2O4 | Hydrothermal | 1 M H2SO4 | 371 at (1 A g−1) | — | — | 86.7% after 2000 cycles | 66 |
| MnFe2O4/graphene/PANI | Chemical oxidative polymerization method | 1 M NaCl | 338 at (0.5 mA cm−2) | 10.25 | 3.07 | 100% after 2000 cycles | 55 |
| MnFe2O4/graphene | Solvothermal | 1 M H2SO4 | 120 at (0.1 A g−1) | 5 | 0.4 | 105% after 5000 cycles | 67 |
| MnFe2O4/rGO | Chemical oxidation/sonication | 6 M KOH | 271 at (0.5 A g−1) | 15.9 | 3.24 | 104% after 5000 cycles | 38 |
| MnFe2O4 hollow sphere/rGO | Hydrothermal | 3 M KOH + 0.1 M K4[Fe(CN)6] | 768 at (8 A g−1) | 27.7 | 7.5 | 95% after 4000 cycles | 16 |
| MnFe2O4 nanoneedles/rGO | Hydrothermal | 1 M Na2SO4 | 1327 at (5 mA cm−2) | 5.7 | 10 | 93.36% after 5000 cycles | This work |
To further assess the potential of the composite for effective practicability of a supercapacitor device, the cycling stability of M-nr/rGO was evaluated by reiterating the GCD and CV tests at a current density of 1.5 A g−1 and a scan rate of 5 mV s−1 respectively. Fig. 9b reveals that the binary composite has retained 93.36% of its initial capacitance after 5000 GCD cycles indicating remarkably good cycling stability to be implemented in a supercapacitor. Cyclic voltammetry was also performed to determine its electrochemical activation process after cycling. The M-nr/rGO binary composite has achieved this remarkable electrochemical performance due to the mechanically robust hierarchical architecture of 1-dimensional nanoneedles in the spinel type MnFe2O4 along with the high conductivity of graphene in its reduced form.61 Furthermore, the electrochemical properties of M-nr/rGO significantly surpassed those in other similar literature described in (Table 2).
4. Conclusion
In summary, two different morphologies of MnFe2O4 and their respective composite with rGO were synthesized by a facile method for high performance supercapacitor application. The planar structure of rGO aided the unique morphologies of MnFe2O4 to permeate into the layers forming a stacked 2D/3D structure. The synthesized samples were characterized by different physical methods to determine their physicochemical properties and their electrochemical performance was also evaluated. However, owing to the synergistic effect of unique 1D MnFe2O4 nanoneedles integrated with 2D-rGO, a higher specific capacitance of 1327 F g−1 with an exceptionally high areal capacitance of 890 mF cm−2 at a current density of 5 mA cm−2 was demonstrated. Also, a remarkable power density of 10 kW kg−1 with a retention of 93.36% of the initial capacitance was obtained after 5000 cycles in 1 M Na2SO4, indicating high cycling stability. To the best of our knowledge, this is the first time a needle like morphology of MnFe2O4 is composited with rGO and reported for a supercapacitor application. The results suggest that MnFe2O4 nanoneedle@rGO is a very promising electrode material for assembling in a capacitor with both high energy and good capacitance retention.Conflicts of interest
There are no conflicts to declare in the present manuscript.Acknowledgements
The authors thank the DST-SERB for the funding [EMR/2016/007676] as well as the DST-FIST DST-PURSE, UGC-SAP, Government of India for the support of instrumental facilities available in the department.References
- E. Pomerantseva, F. Bonaccorso, X. Feng, Y. Cui and Y. Gogotsi, Science, 2019, 366(6468), eaan8285 CrossRef CAS PubMed.
- P. Simon, Y. Gogotsi and B. Dunn, Science, 2014, 343, 1210–1211 CrossRef CAS PubMed.
- L. Kouchachvili, W. Yaïci and E. Entchev, J. Power Sources, 2018, 374, 237–248 CrossRef CAS.
- X. You, M. Misra, S. Gregori and A. K. Mohanty, ACS Sustainable Chem. Eng., 2018, 6, 318–324 CrossRef CAS.
- L. Huang, B. Liu, H. Hou, L. Wu, X. Zhu, J. Hu and J. Yang, J. Alloys Compd., 2018, 730, 71–80 CrossRef CAS.
- L. Miao, Z. Song, D. Zhu, L. Li, L. Gan and M. Liu, Mater. Adv., 2020, 1, 945–966 RSC.
- F. M. Ismail, M. Ramadan, A. M. Abdellah, I. Ismail and N. K. Allam, J. Electroanal. Chem., 2018, 817, 111–117 CrossRef CAS.
- P. Sun, N. Li, C. Wang, J. Yin, G. Zhao, P. Hou and X. Xu, J. Power Sources, 2019, 427, 56–61 CrossRef CAS.
- X. Cheng, Z. Pan, J. Yang, Y. Zhong, X. Wang, C. Ye, J. Zhuang, Q. Huang, Q. Yongcai and W. Li, J. Power Sources, 2019, 427, 243–249 CrossRef CAS.
- C. An, Y. Zhang, H. Guo and Y. Wang, Nanoscale Adv., 2019, 1, 4644–4658 RSC.
- H. Souri and D. Bhattacharyya, ACS Appl. Mater. Interfaces, 2018, 10, 20845–20853 CrossRef CAS PubMed.
- Y. Wang, Y. Ding, X. Guo and G. Yu, Nano Res., 2019, 12, 1978–1987 CrossRef CAS.
- Y. Dong, J. Zhu, Q. Li, S. Zhang, H. Song and D. Jil, J. Mater. Chem. A, 2020, 8, 21930–21946 RSC.
- P. Xiong, C. Hu, Y. Fan, W. Zhang, J. Zhu and X. Wang, J. Power Sources, 2014, 266, 384–392 CrossRef CAS.
- W. H. Low, P. S. Khiew, S. S. Lim, C. W. Siong and E. R. Ezeigwe, J. Alloys Compd., 2019, 775, 1324–1356 CrossRef CAS.
- P. Makkar and N. N. Ghosh, ACS Appl. Energy Mater., 2020, 3, 2653–2664 CrossRef CAS.
- M. M. Baig, M. A. Yousuf, P. O. Agboola, M. A. Khan, I. Shakir and M. F. Warsi, Ceram. Int., 2019, 45, 12682–12690 CrossRef CAS.
- A. Mary Jacintha, V. Umapathy, P. Neeraja and S. Rex Jeya Rajkumar, J. Nanostruct. Chem., 2017, 7, 375–387 CrossRef.
- M. Shandilya, R. Rai and J. Singh, Adv. Appl. Ceram., 2016, 115, 354–376 CrossRef CAS.
- C. Burda, X. Chen, R. Narayanan and M. A. El-Sayed, Chem. Rev., 2005, 105, 1025–1102 CrossRef CAS PubMed.
- P. Miao, J. He, Z. Sang, F. Zhang, J. Guo, D. Su, X. Yan, X. Li and H. Ji, J. Alloys Compd., 2018, 732, 613–623 CrossRef CAS.
- A. Goljanian Tabrizi, N. Arsalani, A. Mohammadi, H. Namazi, L. Saleh Ghadimi and I. Ahadzadeh, New J. Chem., 2017, 41, 4974–4984 RSC.
- L. Zhen, K. He, C. Y. Xu and W. Z. Shao, J. Magn. Magn. Mater., 2008, 320, 2672–2675 CrossRef CAS.
- N. D. Navadeepthy, R. A. Rebekah, V. C. Viswanathan and P. N. Ponpandian, Mater. Res. Bull., 2017, 95, 1–8 CrossRef.
- R. Ghahremanzadeh, Z. Rashid, A. H. Zarnani and H. Naeimi, RSC Adv., 2014, 4, 43661–43670 RSC.
- D. A. Giannakoudakis, J. K. Mitchell and T. J. Bandosz, J. Mater. Chem. A, 2016, 4, 1008–1019 RSC.
- H. Xia, Y. Wang, J. Lin and L. Lu, Nanoscale Res. Lett., 2011, 6, 595 CrossRef.
- S. Ding, S. Chen, D. Luan and Y. Chiang, Chem. Commun., 2011, 47, 5780–5782 RSC.
- R. Rameshbabu, R. Ramesh, S. Kanagesan, A. Karthigeyan and S. Ponnusamy, J. Mater. Sci.: Mater. Electron., 2014, 25, 2583–2588 CrossRef CAS.
- A. Khorsand Zak, W. H. A. Majid, M. E. Abrishami and R. Yousefi, Solid State Sci., 2011, 13, 251–256 CrossRef CAS.
- S. E. Shirsath, M. L. Mane, Y. Yasukawa, X. Liu and A. Morisako, Phys. Chem. Chem. Phys., 2014, 16, 2347–2357 RSC.
- N. A. M. Mokhtar, H. G. Beh and K. C. Lee, Crystals, 2019, 9, 626 CrossRef CAS.
- W. Wang, Z. Ding, X. Zhao, S. Wu, F. Li, M. Yue and J. P. Liu, J. Appl. Phys., 2015, 117, 1–5 Search PubMed.
- S. Jovanović, T. Da Ross, A. Ostric, D. Tošić, J. Prekodravac, Z. Marković and B. Todorović Marković, Phys. Scr., 2014, 014023 CrossRef.
- H. Su, C. Zhang, X. Li, L. Wu and Y. Chen, RSC Adv., 2018, 8, 39140–39148 RSC.
- K. S. Subrahmanyam, S. R. C. Vivekchand, A. Govindaraj and C. N. R. Rao, J. Mater. Chem., 2008, 18, 1517–1523 RSC.
- K. Ghosh and S. K. Srivastava, Dalton Trans., 2020, 49, 16993–17004 RSC.
- B. Wang, P. Guo, H. Bi, Q. Li, G. Zhang, R. Wang, J. Liu, X. S. Zhao, A. Goljanian Tabrizi, N. Arsalani, A. Mohammadi, H. Namazi, L. Saleh Ghadimi, I. Ahadzadeh, K. V. Sankar and R. K. Selvan, Int. J. Electrochem. Sci., 2014, 4, 4974–4984 Search PubMed.
- L. Mai, H. Li, Y. Zhao, L. Xu, X. Xu, Y. Luo, Z. Zhang, W. Ke, C. Niu and Q. Zhang, Sci. Rep., 2013, 3, 1–8 Search PubMed.
- L. Q. Mai, F. Yang, Y. L. Zhao, X. Xu, L. Xu and Y. Z. Luo, Nat. Commun., 2011, 2, 1–5 Search PubMed.
- J. Yan, Z. Fan, W. Sun, G. Ning, T. Wei, Q. Zhang, R. Zhang, L. Zhi and F. Wei, Adv. Funct. Mater., 2012, 22, 2632–2641 CrossRef CAS.
- B. Li, M. Zheng, H. Xue and H. Pang, Inorg. Chem. Front., 2016, 3, 175–202 RSC.
- W. Li, W. Zhang, T. Li, A. Wei, Y. Liu and H. Wang, Nanoscale Res. Lett., 2019, 14, 229 CrossRef PubMed.
- Y. Wang, Y. Song and Y. Xia, Chem. Soc. Rev., 2016, 45, 5925–5950 RSC.
- Y. Liu, S. P. Jiang and Z. Shao, Mater. Today Adv., 2020, 7, 100072 CrossRef.
- Y. Shao, M. F. El-Kady, J. Sun, Y. Li, Q. Zhang, M. Zhu, H. Wang, B. Dunn and R. B. Kaner, Chem. Rev., 2018, 118, 9233–9280 CrossRef CAS PubMed.
- J. Shao, X. Zhou, Q. Liu, R. Zou, W. Li, J. Yang and J. Hu, J. Mater. Chem. A, 2015, 3, 6168–6176 RSC.
- Z. H. Huang, T. Y. Liu, Y. Song, Y. Li and X. X. Liu, Nanoscale, 2017, 9, 13119–13127 RSC.
- L. Xu, H. Chen and K. Shu, J. Sol-Gel Sci. Technol., 2016, 77, 463–469 CrossRef CAS.
- F. Ding, Z. Yu, X. Chen, X. Chen, C. Chen, Y. Huang, Z. Yang, C. Zou, K. Yang and S. Huang, Electrochim. Acta, 2019, 306, 549–557 CrossRef CAS.
- A. M. Khattak, H. Yin, Z. A. Ghazi, B. Liang, A. Iqbal, N. A. Khan, Y. Gao, L. Li and Z. Tang, RSC Adv., 2016, 6, 58994–59000 RSC.
- Y. H. Lee, K. H. Chang and C. C. Hu, J. Power Sources, 2013, 227, 300–308 CrossRef CAS.
- J. S. Sagu, K. G. U. Wijayantha and A. A. Tahir, Electrochim. Acta, 2017, 246, 870–878 CrossRef CAS.
- S. N. Khatavkar and S. D. Sartale, New J. Chem., 2020, 44, 6778–6790 RSC.
- K. V. Sankar and R. K. Selvan, RSC Adv., 2014, 4, 17555 RSC.
- R. Ramachandran, M. Saranya, C. Santhosh, V. Velmurugan, B. P. C. Raghupathy, S. K. Jeong and A. N. Grace, RSC Adv., 2014, 4, 21151–21162 RSC.
- A. V. Fulari, M. V. Ramana Reddy, S. T. Jadhav, G. S. Ghodake, D. Y. Kim and G. M. Lohar, J. Mater. Sci.: Mater. Electron., 2018, 29, 10814–10824 CrossRef CAS.
- R. S. Ingole, S. B. Kondawar and B. J. Lokhande, J. Mater. Sci.: Mater. Electron., 2017, 28, 2385–2391 CrossRef CAS.
- D. C. Papan Xu, K. Ye, M. Du, J. Liu, K. Cheng, J. Yin and G. Wang, RSC Adv., 2015, 5, 36656–36664 RSC.
- C. Zhao, Y. Jiang, S. Liang, F. Gao, L. Xie and L. Chen, CrystEngComm, 2020, 22, 2953–2963 RSC.
- R. Sahoo, T. H. Lee, D. T. Pham, T. H. T. Luu and Y. H. Lee, ACS Nano, 2019, 13, 10776–10786 CrossRef CAS PubMed.
- G. Singh and S. Chandra, Int. J. Hydrogen Energy, 2018, 43, 4058–4066 CrossRef CAS.
- P. Guo, Z. Li, S. Liu, J. Xue, G. Wu, H. Li and X. S. Zhao, J. Mater. Sci., 2017, 52, 5359–5365 CrossRef CAS.
- L. Li, Z. A. Hu, N. An, Y. Y. Yang, Z. M. Li and H. Y. Wu, J. Phys. Chem. C, 2014, 118, 22865–22872 CrossRef CAS.
- S. L. Kuo and N. L. Wu, J. Power Sources, 2006, 162, 1437–1443 CrossRef CAS.
- N. Arsalani, A. G. Tabrizi and L. S. Ghadimi, J. Mater. Sci.: Mater. Electron., 2018, 29, 6077–6085 CrossRef CAS.
- W. Cai, T. Lai, W. Dai and J. Ye, J. Power Sources, 2014, 255, 170–178 CrossRef CAS.
Footnote |
| † Electronic supplementary information (ESI) available. See DOI: 10.1039/d1na00144b |
| This journal is © The Royal Society of Chemistry 2021 |

