 Open Access Article
In situ laser annealing as pathway for the metal free synthesis of tailored nanographenes†
Valeria
Milotti
 *a,
Manuel
Melle-Franco
 b,
Ann-Kristin
Steiner
 c,
Ivan
Verbitskii
 a,
Konstantin
Amsharov
 d and
Thomas
Pichler‡
 a
a
aFaculty of Physics, University of Vienna, Strudlhofgasse 4, 1090 Vienna, Austria
bCICECO—Aveiro Institute of Materials, Department of Chemistry, University of Aveiro, 3810-193 Aveiro, Portugal
cDepartment of Organic Chemistry, Friedrich Alexander University Erlangen-Nuremberg, 91058 Erlangen, Germany
dDepartment of Organic Chemistry, Martin-Luther-Universität Halle Wittenberg, 06108 Halle, Germany
First published on 8th December 2020
Abstract
Tailored synthesis of nanographenes, and especially graphene nanoribbons (GNR), has been achieved on metal substrates via a bottom-up approach from organic precursors, which paves the way to their application in nanoelectronics and optoelectronics. Since quantum confinement in nanographenes leads to the creation of peculiar band structures, strongly influenced by their topological characteristics, it is important to be able to exactly engineer them in order to precisely tune their electronic, optical and magnetic properties. However practical application of these materials requires post-synthesis transfer to insulating substrates. Recently, cyclodehydrofluorination of fluorinated organic precursors has been shown to be a promising pathway to achieve metal-free bottom-up synthesis of nanographenes. Here we present how to apply in situ laser annealing to induce cyclodehydrofluorination leading to nanographene formation directly on non-metallic surfaces. In this work, we analyze the changes in the Raman fingerprint of the fluorinated precursor tetrafluoro-diphenyl-quinquephenyl (TDQ) during the laser annealing process in high vacuum (HV), demonstrating that both heating and photo-induced processes influence the cyclization process. Hence, in situ laser annealing allows not only to influence chemical reactions, but also to have a fast and contact-free monitoring of the reaction products. Optimization of the laser annealing process adds a new level of control in the tailored synthesis of nanographenes on non-metallic substrates. This is a very promising pathway to unravel the full application potential of nanographenes in general and GNR in particular, enabling a fast optimization of precursor molecules and substrate geometry engineered for specific applications.
1 Introduction
Graphene nanoribbons (GNR), quasi-one dimensional strips of honeycomb carbon, are among the best candidates to develop a new carbon-based nanotechnology. Depending on their edge morphology and their width, GNR can behave as metals, semiconductors or insulators.1–3 They are predicted to possess tunable electronic and optical properties, which mainly depend on the topological characteristics of the ribbon.State of the art bottom-up synthesis has led to the production of atomically precise GNR with interesting edge topologies, such as armchair, zigzag, cove type or chevron shaped GNR.4–6 While other synthesis methods have been developed, such as solution-mediated synthesis, on-surface synthesis provides the most control over the morphology of the final product.7–10 Therefore, the established high-yield route to obtain atomic-precision GNR is to deposit a halogenated (Br, I) precursor in ultra-high vacuum (UHV) through chemical vapour deposition on a metal substrate and then polymerize it through an Ullmann-like coupling reaction.11,12 However, restraining the growth of GNR on metals is not ideal for multiple reasons. Metals provide a good substrate for cyclodehydrogenation to occur, but they make it impossible to measure directly the optical and electrical properties of the reaction products.9,13 Moreover, for most of current technological applications GNR-based devices could only operate on insulating substrates. Although GNR synthesized on metals can be transferred to insulating surfaces, the process lowers significantly the quality of the synthesized products.14–16 Finally, the topological characteristics of the GNR strongly depend on the metal substrate that is employed during synthesis, which is extremely limiting for the variety of produced GNR that may be achieved. In view of future industrial applications, it is desirable to develop a method to synthesize GNR without using a metal catalytic substrate.
The final structure of on-surface prepared GNR is directly confirmed by scanning tunnelling microscopy (STM) and transmission electron microscopy (TEM). However, both methods present setbacks, as the former requires a metallic substrate and the latter a free-standing sample. As is the case for their parent material graphene, GNR are Raman active and their vibrational modes have extensively been explored both theoretically17,18 and experimentally.4 Therefore, Raman spectroscopy is nowadays a widespread established method to investigate the properties of GNR from the vibrational fingerprint.14 It is a fast, contactless and non-damaging bulk characterization method, in contrast to the other local investigating techniques mentioned above. The Raman spectra of GNR presents three main features, two of which are common to all planar carbon allotropes: the G-line, the D-line and the Radial Breathing Like Mode (RBLM). The first mode, which refers to vibrations in the sp2 C–C bond, is found at ∼1600 cm−1. The second mode, found at ∼1300 cm−1, refers to vibrations of carbon with sp3 hybridization; while in the graphene spectrum it reveals the amount of defects present in the honeycomb lattice, in GNR spectra it refers to vibrations at the edges. The RBLM, so called in analogy with the radial breathing mode of carbon nanotubes, is found between 300 and 550 cm−1; from its spectral position it is possible to calculate the width of the GNR.19,20
Recently, intramolecular aryl–aryl coupling by C–F bond activation in fluorinated aromatic molecules on thermally activated γ-aluminum oxide was found to be very effective for the rational synthesis of various graphene-like nanostructures by a bottom-up approach.21–25 It has been demonstrated that the cyclodehydrofluorination reaction is characterized by an unprecedented high efficiency and exceptional high regio- and chemoselectivity.24,26 Following this strategy, it was possible to synthesize various nanographenes in near quantitative yields under mild conditions, including highly strained bowl-shaped systems.24–27 Moreover, virtually linear oligophenylenes bearing fluorine functionalities in defined positions were successfully “rolled up” to the respective target nanographenes in truly domino-like fashion by tandem cyclization via HF elimination.28,29 This oligophenylene zipping approach was also successfully performed directly on a semiconducting rutile titania surface and it was later employed for the rational synthesis of precisely tailored GNR.30,31
In this contribution, we use Raman spectroscopy and laser annealing in high vacuum (HV) to investigate a promising fluorinated molecule programmed for cyclodehydrofluorination, tetrafluoro-diphenyl-quinquephenyl (TDQ) (see Fig. 1).28 By providing photo-induced heating, laser annealing triggered the cyclodehydrofluorination process in the precursor molecule, leading to the synthesis of sp2 hybridized carbon nanostructures. Throughout the whole laser annealing process, the Raman fingerprint of the precursor molecule is monitored in situ, so as to record the vibronic properties during every step of the reaction without disruptions. Raman spectroscopy, while having the advantage of being less disruptive than TEM, provides fast measurements which are pivotal for step-by-step monitoring of chemical changes. Furthermore, we employ density functional theory (DFT) calculations to identify the spectral features related to fluorine vibrations.
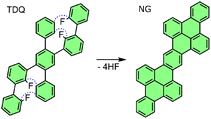 | ||
| Fig. 1 Tetrafluoro-diphenyl-quinquephenyl (TDQ) precursor and expected cyclodehydrofluorination into nanographene (NG) under ideal conditions.28 | ||
2 Experimental methods
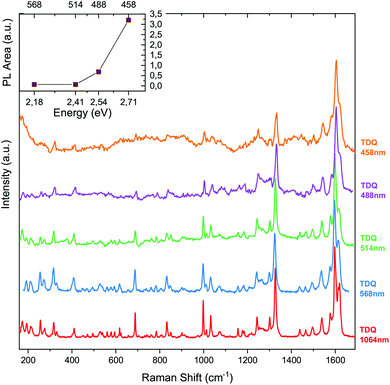
The fluorinated precursor TDQ (Fig. 1), pre-programmed for subsequent fourfold cyclodehydrofluorination reaction, was synthesized according to the known protocol.28The optical properties of TDQ were investigated using Raman spectroscopy. The background Raman fingerprint of the sample was recorded in air at room temperature with laser wavelengths of 458 nm, 488 nm, 514 nm, 568 nm, 1064 nm on TDQ deposited on aluminum oxide (Fig. 2). The infrared Raman fingerprint of the molecule was recorded with an FT-Raman spectrometer (Bruker IFS100) using a 1064 nm laser at 100 mW power and irradiance of (1.3 × 101) W cm−2, while a Horiba Yobin Yvon LabRAM notch filter Raman system with confocal microscope was used for the visible light lasers. The Stokes and anti-Stokes processes of the line at about 1326−1 were recorded with a T64000 Horiba triple Raman spectrometer at 532 nm exciting laser wavelength.
Additionally, the Raman spectra for the TDQ molecule were computed with DFT at the PBE-6-31G(d,p) level augmented by a D3 dispersion term32 with Becke–Johnson damping.32 All DFT calculations were performed with Gaussian 09.33 An exhaustive exploration of the most likely TDQ conformers was carried out with the program CREST34 which uses metadynamics on top of the recent GFN2-xTB tight-binding Hamiltonian.35 The first 18 conformers so-obtained were reoptimized with DFT and their Hessian computed to check for the presence of negative frequencies and to estimate their relative Boltzmann populations. From these computation, identification and analysis of the Raman active modes with sizable contributions by F atoms were obtained.
The cyclization of TDQ was investigated using laser annealing. The desired reaction into nanographene is represented in Fig. 1. Our setup combined a confocal microscope Raman system with a tunable wavelength laser and a small vacuum chamber with a gas inlet.36,37 The Raman laser was focused on the sample inside the vacuum chamber through an optical window. The annealing was performed by laser irradiation.38
A small amount of TDQ molecule was deposited on an TEM gold grid support covered in amorphous carbon and brought into HV (∼10−6 mbar). The sample was then heated with visible laser irradiation at 568 nm, 8 mW of power, irradiance of (1.6 × 10⁴) W cm−2. We collected the inelastically scattered radiation in 180° backscatter geometry to perform concomitant in situ Raman spectroscopy on the sample.
For the measurement of the Stokes and anti-Stokes processes, the precursor was sealed in vacuum better than 10−6 mbar in a pyrex glass vial with square cross section. From this measurement we were able to correlate Raman linewidth with temperature and calculate the temperature evolution during the laser annealing process.
3 Results and discussion
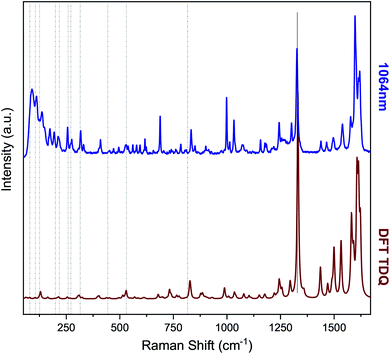
Fig. 2 shows the Raman fingerprint of the TDQ molecule recorded in air at room temperature with laser wavelengths of 458 nm, 488 nm, 514 nm, 568 nm, 1064 nm. In order to analyze the relative response of the intrinsic Raman signal, complementary fluorescence backgrounds were subtracted, taking into account the shape of the photoluminescence (PL) background. Intensities were normalized to the G-peak at ∼1600 cm−1. We observe an increase in photoluminescence and a decrease in the relative intensity of the sample's characteristic emission for shorter wavelengths, which leads to higher noise levels after background subtraction and normalization. This happens because the optical gap of TDQ is in the ultraviolet range:28 increasing the incident photon energy, therefore, tunes the laser to the emission spectrum of the molecule, which is a complementary process to the vibronic excitation of the sample.Additionally, the Raman spectra for the most likely conformations in the TDQ molecule were computed with DFT. The presented simulated spectrum corresponds to the most populated conformation as all computed conformers yielded fundamentally similar spectra. The identification and analysis of the Raman active modes with sizable contributions by F atoms were obtained by computing and ranking the ratio of the F displacements with respect to the total.39
A graphic comparison between experimental and computed spectra is in Fig. 3. As further comparison between theory and experiment, peak analysis was executed on the G-line and on the strongest fluorine related Raman active modes, both the computed and the experimental 568 nm spectra (ESI †).
The precursor was annealed through laser irradiation in HV using the Raman spectroscopic HV set-up with a 568 nm laser at (1.6 × 10⁴) W cm−2 irradiation. This laser line, being in the vanishing tail of the fluorescence spectrum of the target precursor molecule, enables us to have a weak luminescence Raman spectrum, which concomitantly allows to study the transformation to nanographene from both a decrease of the luminescence and a change in the Raman fingerprint.28
Original spectra gathered during laser annealing are in Fig. S1 in the ESI.† The acquisition time for each laser annealing cycle was 100 s, while the time between the end of an acquisition and the start of the next was about 20 s. During the laser annealing process, the molecule's color turned from white to black. An indication of TDQ decomposition came from the quartz optical window of the HV chamber, whose inner surface was etched by hydrogen fluoride during the experiment. No other fluorinated materials were present inside the HV chamber, therefore hydrogen fluoride must have originated from the first step of cyclodehydrofluorination, in which the molecule decomposes by breaking its CF bonds.
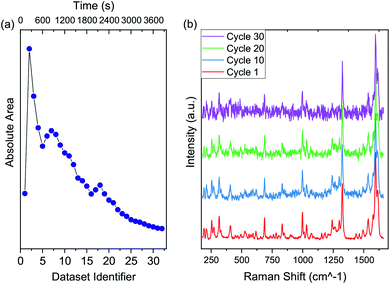
We observed a dramatic increase in the fluorescence from the first to the second cycle, followed by a slow decrease that continued for the whole process (Fig. 4a). At the same time, the Raman fingerprint of the molecule progressively lost intensity (ESI †).
We executed a subtraction of the background fluorescence and normalization of the spectra to the G-line at ∼1600 cm−1 to highlight the spectral evolution of the Raman fingerprint (Fig. 4b).
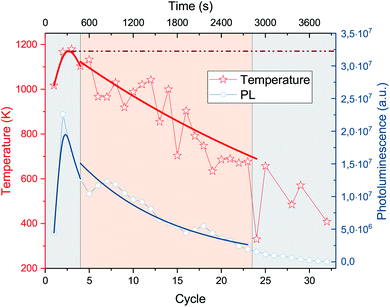
In order to determine the local temperature of the precursor during laser annealing, Stokes and anti-Stokes peaks were recorded at increasing laser irradiation at exciting laser wavelength of 532 nm. We chose to examine the mode at 1326 cm−1 as it has high intensity and it is preferable to the G-line because modes at higher wavenumbers have lower intensity anti-Stokes lines.40 Through lineshape analysis we were able to correlate the peak's linewidth to sample temperature. With such correlation we calculated the temperature during laser annealing: the precursor molecule heats almost immediately to about 1100 K. The temperature is then about constant until cycle 4, when it starts decreasing (ESI †).
During the laser annealing process, the signal-to-noise ratio of the molecular Raman fingerprint decreased, while the color change of the molecule and etching on the inside of the optical window suggest a defluorination and graphitization of TDQ. The Raman fingerprint of the target nanographene presents peaks between 1200 cm−1 and 1600 cm−1, with very low signal to noise ratio because of strong photoluminescence when measured with visible light excitations (ESI †). Therefore, the high photoluminescence is an indication that the target nanographene or similar molecules were synthesized by cyclodehydrofluorination of TDQ. At the same time, the absence of signal from the decomposition products points to a non-uniform synthesis and to their fast transition into amorphous carbon due to the high irradiance used during laser annealing.41
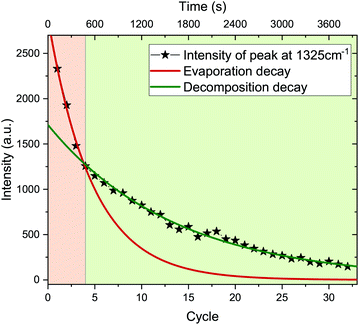
A quantitative study of the spectrum's decay can be made after subtraction of the background. We observe that the intensity decay can be separated at cycle 4 (480 s) into two well defined regimes of exponential decrease (Fig. 5). Each regime can be modeled by: I = e−λt. In our case, the decay constant λ is a function of laser irradiation. In the second regime, between cycles 4 and 23, also the photoluminescence and the temperature decay exponentially (Fig. 6).
In the first regime, the intensity decay is governed by the evaporation of the molecule λev. In this regime, the calculated temperature is stable around 1100 K within experimental error. At cycle 4 (480 s), a phase change occurs, after which the intensity decay is governed by the decomposition of the precursor molecule until the end of the laser annealing. The later regime, therefore, is governed by the decomposition rate of the precursor molecule, λdec (ESI †).
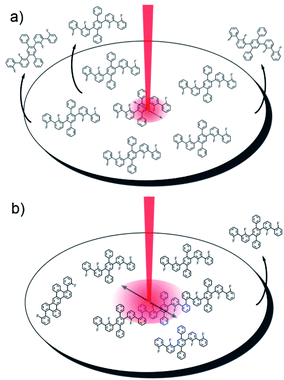
From the analysis of the two regimes, we can conclude that a transformation occurred in the molecule. As the temperature is stable in the first regime, already before cycle 2 a steady state is reached between heating by laser irradiation and heat dissipation (see sketch in Fig. 7). The high temperature reached fuels endothermal processes like evaporation and cyclodehydrofluorination, with a fraction of precursor molecules starting to decompose by breaking of CF and CH bonds. This in turn leads to the formation of HF and CC bonds, which leads to small local clusters of graphitized material.
A phase change between unpercolated and percolated clusters of graphitized material occurs at cycle 4. In this regime the temperature and the PL decrease exponentially, therefore heat conductivity increases dramatically as the light emission from the sample becomes quenched. If percolation did not occur, the temperature would be constant as the system would remain in the steady state reached during the evaporation regime (Fig. 6). The decrease in temperature is evidence supporting the transformation of the precursor, as percolated graphitized materials lead to a more efficient heat exchange in comparison to single molecules held together by van der Waals interactions.
4 Conclusions
In conclusion, in this contribution we report for the first time the experimental and computed Raman fingerprints of the fluorinated precursor tetrafluoro-diphenyl-quinquephenyl (TDQ). TDQ was processed in a pilot study on laser annealing as a pathway to induce heat- and photo-induced reactions in fluorinated precursors. During the process, we found evidence that the molecule underwent photo-induced cyclodehydrofluorination, though the high laser irradiance led to the almost immediate decay into amorphous carbon of the reaction products. Further studies will be required on the TDQ molecule and related fluorinated precursors to optimize the laser annealing process.Laser annealing allows to influence the reaction by laser irradiation, while at the same time providing quick, in situ measurements of the Raman fingerprint without requiring a metallic substrate or physical contact between probe and reagents. Therefore, it was demonstrated to be the perspective technique to optimize nanographene synthesis through cyclodehydrofluorination and unravel its full potential in engineering tailored bottom-up synthesized GNR.
Author contributions
Author contributions are listed here. V. M: investigation, data curation, methodology, formal analysis, writing – original draft. M. M. F.: methodology, formal analysis, writing – original draft, funding acquisition. A. K. S: resources, writing – original draft. I. V.: visualization. K. A.: funding acquisition, conceptualization, writing – review and editing. T. P.: funding acquisition, methodology, supervision, validation, writing – review and editing.Conflicts of interest
There are no conflicts to declare.Acknowledgements
The authors thank the University of Vienna for the support provided via the Vienna Doctoral School, and the Austrian Science Fund (FWF) for its support via the research project P27769-N20. In addition, the authors thank the Portuguese Foundation for Science and Technology/MCTES for its support through the project IF/00894/2015 and within the scope of the project CICECO-Aveiro Institute of Materials, UIDB/50011/2020 & UIDP/50011/2020, financed by national funds.Notes and references
- K. Nakada, M. Fujita, G. Dresselhaus and M. S. Dresselhaus, Phys. Rev. B: Condens. Matter Mater. Phys., 1996, 54, 17954–17961 CrossRef CAS.
- Y.-W. Son, M. L. Cohen and S. G. Louie, Phys. Rev. Lett., 2006, 97, 216803 CrossRef.
- N. Merino-Díez, A. Garcia-Lekue, E. Carbonell-Sanromà, J. Li, M. Corso, L. Colazzo, F. Sedona, D. Sánchez-Portal, J. I. Pascual and D. G. de Oteyza, ACS Nano, 2017, 11, 11661–11668 CrossRef.
- J. Cai, P. Ruffieux, R. Jaafar, M. Bieri, T. Braun, S. Blankenburg, M. Muoth, A. P. Seitsonen, M. Saleh, X. Feng, K. Müllen and R. Fasel, Nature, 2010, 466, 470 CrossRef CAS.
- J. Liu, B.-W. Li, Y.-Z. Tan, A. Giannakopoulos, C. Sanchez-Sanchez, D. Beljonne, P. Ruffieux, R. Fasel, X. Feng and K. Müllen, J. Am. Chem. Soc., 2015, 137, 6097–6103 CrossRef CAS.
- P. Ruffieux, S. Wang, B. Yang, C. Sánchez-Sánchez, J. Liu, T. Dienel, L. Talirz, P. Shinde, C. A. Pignedoli, D. Passerone, T. Dumslaff, X. Feng, K. Müllen and R. Fasel, Nature, 2016, 531, 489 CrossRef CAS.
- X. Yang, X. Dou, A. Rouhanipour, L. Zhi, H. J. Räder and K. Müllen, J. Am. Chem. Soc., 2008, 130, 4216–4217 CrossRef CAS.
- A. Narita, X. Feng, Y. Hernandez, S. A. Jensen, M. Bonn, H. Yang, I. A. Verzhbitskiy, C. Casiraghi, M. R. Hansen and A. H. R. Koch, et al. , Nat. Chem., 2013, 6, 126–132 CrossRef.
- L. Talirz, P. Ruffieux and R. Fasel, Adv. Mater., 2016, 28, 6222–6231 CrossRef CAS.
- A. Narita, Z. Chen, Q. Chen and K. Müllen, Chem. Sci., 2019, 10, 964–975 RSC.
- H. Sakaguchi, Y. Kawagoe, Y. Hirano, T. Iruka, M. Yano and T. Nakae, Adv. Mater., 2014, 26, 4134–4138 CrossRef CAS.
- Z. Chen, W. Zhang, C.-A. Palma, A. L. Rizzini, B. Liu, A. Abbas, N. Richter, L. Martini, X.-Y. Wang, N. Cavani, H. Lu, N. Mishra, C. Coletti, R. Berger, F. Klappenberger, M. Kläui, A. Candini, M. Affronte, C. Zhou, V. D. Renzi, U. del Pennino, J. V. Barth, H. J. Räder, A. Narita, X. Feng and K. Müllen, J. Am. Chem. Soc., 2016, 138, 15488–15496 CrossRef CAS.
- P. Ruffieux, J. Cai, N. C. Plumb, L. Patthey, D. Prezzi, A. Ferretti, E. Molinari, X. Feng, K. Müllen and C. A. Pignedoli, et al. , ACS Nano, 2012, 6, 6930–6935 CrossRef CAS.
- G. B. Barin, A. Fairbrother, L. Rotach, M. Bayle, M. Paillet, L. Liang, V. Meunier, R. Hauert, T. Dumslaff, A. Narita, K. Müllen, H. Sahabudeen, R. Berger, X. Feng, R. Fasel and P. Ruffieux, ACS Appl. Nano Mater., 2019, 2, 2184–2192 CrossRef.
- G. D. Nguyen, H.-Z. Tsai, A. A. Omrani, T. Marangoni, M. Wu, D. J. Rizzo, G. F. Rodgers, R. R. Cloke, R. A. Durr, Y. Sakai, F. Liou, A. S. Aikawa, J. R. Chelikowsky, S. G. Louie, F. R. Fischer and M. F. Crommie, Nat. Nanotechnol., 2017, 12, 1077 CrossRef CAS.
- J. P. Llinas, A. Fairbrother, G. Borin Barin, W. Shi, K. Lee, S. Wu, B. Yong Choi, R. Braganza, J. Lear, N. Kau, W. Choi, C. Chen, Z. Pedramrazi, T. Dumslaff, A. Narita, X. Feng, K. Müllen, F. Fischer, A. Zettl, P. Ruffieux, E. Yablonovitch, M. Crommie, R. Fasel and J. Bokor, Nat. Commun., 2017, 8, 633 CrossRef.
- R. Gillen, M. Mohr, C. Thomsen and J. Maultzsch, Phys. Rev. B: Condens. Matter Mater. Phys., 2009, 80, 155418 CrossRef.
- R. Gillen, M. Mohr and J. Maultzsch, Phys. Rev. B: Condens. Matter Mater. Phys., 2010, 81, 205426 CrossRef.
- J. Zhou and J. Dong, Appl. Phys. Lett., 2007, 91, 173108 CrossRef.
- I. A. Verzhbitskiy, M. D. Corato, A. Ruini, E. Molinari, A. Narita, Y. Hu, M. G. Schwab, M. Bruna, D. Yoon, S. Milana, X. Feng, K. Müllen, A. C. Ferrari, C. Casiraghi and D. Prezzi, Nano Lett., 2016, 16, 3442–3447 CrossRef CAS.
- K. Amsharov, M. Kabdulov and M. Jansen, Chem.–Eur. J., 2010, 16, 5868–5871 CrossRef CAS.
- N. Suzuki, T. Fujita and J. Ichikawa, Org. Lett., 2015, 17, 4984–4987 CrossRef CAS.
- N. Suzuki, T. Fujita, K. Y. Amsharov and J. Ichikawa, Chem. Commun., 2016, 52, 12948–12951 RSC.
- K. Y. Amsharov, M. A. Kabdulov and M. Jansen, Angew. Chem., 2012, 124, 4672–4675 CrossRef.
- K. Amsharov and P. Merz, J. Org. Chem., 2012, 77, 5445–5448 CrossRef CAS.
- O. Papaianina, V. A. Akhmetov, A. A. Goryunkov, F. Hampel, F. W. Heinemann and K. Y. Amsharov, Angew. Chem., Int. Ed., 2017, 56, 4834–4838 CrossRef CAS.
- O. Papaianina and K. Y. Amsharov, Chem. Commun., 2016, 52, 1505–1508 RSC.
- A.-K. Steiner and K. Y. Amsharov, Angew. Chem., Int. Ed., 2017, 56, 14732–14736 CrossRef CAS.
- D. Sharapa, A.-K. Steiner and K. Amsharov, Phys. Status Solidi B, 2018, 255, 1800189 CrossRef.
- M. Kolmer, R. Zuzak, A. Steiner, L. Zajac, M. Engelund, S. Godlewski, M. Szymonski and K. Amsharov, Science, 2019, 363, 57–60 CrossRef CAS.
- M. Kolmer, A. Steiner, I. Izydorczyk, W. Ko, M. Engelund, M. Szymonski, A.-P. Li and K. Amsharov, Science, 2020, 369, 571–575 CrossRef CAS.
- S. Grimme, S. Ehrlich and L. Goerigk, J. Comput. Chem., 2011, 32, 1456–1465 CrossRef CAS.
- M. J. Frisch, G. W. Trucks, H. B. Schlegel, G. E. Scuseria, M. A. Robb, J. R. Cheeseman, G. Scalmani, V. Barone, B. Mennucci, G. A. Petersson, H. Nakatsuji, M. Caricato, X. Li, H. P. Hratchian, A. F. Izmaylov, J. Bloino, G. Zheng, J. L. Sonnenberg, M. Hada, M. Ehara, K. Toyota, R. Fukuda, J. Hasegawa, M. Ishida, T. Nakajima, Y. Honda, O. Kitao, H. Nakai, T. Vreven, J. A. Montgomery, Jr., J. E. Peralta, F. Ogliaro, M. Bearpark, J. J. Heyd, E. Brothers, K. N. Kudin, V. N. Staroverov, R. Kobayashi, J. Normand, K. Raghavachari, A. Rendell, J. C. Burant, S. S. Iyengar, J. Tomasi, M. Cossi, N. Rega, J. M. Millam, M. Klene, J. E. Knox, J. B. Cross, V. Bakken, C. Adamo, J. Jaramillo, R. Gomperts, R. E. Stratmann, O. Yazyev, A. J. Austin, R. Cammi, C. Pomelli, J. W. Ochterski, R. L. Martin, K. Morokuma, V. G. Zakrzewski, G. A. Voth, P. Salvador, J. J. Dannenberg, S. Dapprich, A. D. Daniels, Ö. Farkas, J. B. Foresman, J. V. Ortiz, J. Cioslowski and D. J. Fox, Gaussian-09 Revision D.01, Gaussian Inc.Wallingford CT 2009 Search PubMed.
- P. Pracht, F. Bohle and S. Grimme, Phys. Chem. Chem. Phys., 2020, 22, 7169–7192 RSC.
- C. Bannwarth, S. Ehlert and S. Grimme, J. Chem. Theory Comput., 2019, 15, 1652–1671 CrossRef CAS.
- P. Vecera, J. C. Chacón-Torres, T. Pichler, S. Reich, H. R. Soni, A. Görling, K. Edelthalhammer, H. Peterlik, F. Hauke and A. Hirsch, Nat. Commun., 2017, 8, 15192 CrossRef CAS.
- J. Chimborazo, PhD thesis, University of Vienna, Faculty of Physics, 2020.
- C. Kramberger, A. Waske, K. Biedermann, T. Pichler, T. Gemming, B. Büchner and H. Kataura, Chem. Phys. Lett., 2005, 407, 254–259 CrossRef CAS.
- G. Zhurko, Chemcraft – graphical program for visualization of quantum chemistry computations., Ivanovo, Russia, 2005 Search PubMed.
- B. J. Kip and R. J. Meier, Appl. Spectrosc., 1990, 44, 707–711 CrossRef CAS.
- J. Overbeck, G. B. Barin, C. Daniels, M. L. Perrin, L. Liang, O. Braun, R. Darawish, B. Burkhardt, T. Dumslaff, X.-Y. Wang, A. Narita, K. Müllen, V. Meunier, R. Fasel, M. Calame and P. Ruffieux, Phys. Status Solidi B, 2019, 256, 1900343 CrossRef CAS.
Footnotes |
| † Electronic supplementary information (ESI) available: Processing of laser annealing data; quantitative comparison between DFT calculations and experimental spectrum for G-line and CF Raman active vibrations; detailed description of temperature calculations; decay constants calculated from the intensity of the peak at 1326 cm−1. See DOI: 10.1039/d0na00909a |
| ‡ https://epm.univie.ac.at/ |
| This journal is © The Royal Society of Chemistry 2021 |

