 Open Access Article
Creative Commons Attribution 3.0 Unported Licence
Magnetoresponsive biocomposite hydrogels comprising gelatin and valine based magnetic ionic liquid surfactant as controlled release nanocarrier for drug delivery†
Akshay
Kulshrestha
 ab,
Sanjay
Sharma
c,
Kuldeep
Singh
ab and
Arvind
Kumar
 *ab
*ab
aAcademy of Scientific and Innovative Research (AcSIR), Ghaziabad-201002, India. E-mail: arvind@csmcri.res.in; arvind@csmcri.org
bSalt and Marine Chemicals Division, CSIR-Central Salt and Marine Chemicals Research Institute, Council of Scientific and Industrial Research, G. B. Marg, Bhavnagar, 364002, Gujarat, India
cDepartment of Chemistry, Institute of Integrated & Honors Studies, Kurukshetra University, Kurukshetra, India
First published on 8th November 2021
Abstract
The utilization of biopolymer hydrogels has been challenging due to the lack of controllability, actuation, and quick-response properties. Herein, we report a strategic nanoparticle-free approach toward magnetoresponsive biocomposite hydrogels by combining a biopolymer (gelatin) and vesicles of essential amino acid (valine)-based magnetic ionic liquid surfactant [ValC16][FeCl4], and explored their potency as drug delivery nanocarriers. Self-assembly characteristics of [ValC16][FeCl4] have been investigated using surface tension, pyrene fluorescence, specific conductivity, DLS, and TEM measurements. The biocompatible nature of [ValC16][FeCl4] was confirmed by investigating its physiochemical interaction with animal DNA using circular dichroism, zeta potential, agarose gel electrophoresis, and ethidium bromide exclusion assay test. The gel strength and magnetic behavior of the prepared biocomposite magnetoresponsive hydrogels were measured using rheology and vibrating sample magnetometry techniques, respectively. The constructed biocomposite hydrogel has been employed as drug delivery carriers for an antibiotic drug (ornidazole) and an anticancer drug (5-fluorouracil). The encapsulation efficiency of ornidazole and 5-fluorouracil in the magnetic biocomposite gel was found to be 69 ± 0.6% and 78 ± 0.3%, respectively. Since magnetoresponsive biomaterials can be manipulated spatiotemporally via an external magnetic field, the prepared nanoparticle-free magnetoresponsive hydrogels can be promising candidates as active scaffolds for advanced drug delivery and tissue regeneration applications.
Introduction
Recent advances in nanotechnology have tremendous impact in medicine and therapeutic applications.1,2 In the past decade, magnetic ionic liquids, a flourishing subclass of ionic liquids with inherent unique properties and sensitivity to the external magnetic field, have been transformed into magnetic surface active ionic liquids by inducing their amphiphilic character.3–6 The self-assembly behavior of such surface active ionic liquids have indicated the formation of various nano-aggregates such as micelles, vesicles, rod-like micelles, worm-like micelles, lamellar-type micelles, and paramagnetic properties once incorporating lanthanides or transition metals.7,8 These are found to be highly promising candidates for a multitude of potential applications such as in micellar catalysis,9 nano-drug delivery,10 protein separation,11 DNA compaction, and MRI contrast agents.12 Previously, ordered surfactant–DNA hybrid nanospheres of double-strand (ds) DNA and cationic surfactants with the magnetic counterion [FeClBr]− have been reported and are shown as a potential nano-vehicle for magnetoresponsive targeted anticancer drug delivery.13 Xu et al. also reported the cationic azobenzene group containing a magnetic surfactant, which shows the DNA compaction phenomenon, and the bound DNA has been used for magnetomanipulative drug release with excellent biocompatibility and light-sensitive behavior by cis to trans conversion.14,15In this context, hydrogels consisting of biopolymers have more potential benefits due to their non-toxic, sustainable, and biocompatible nature compared to man-made synthetic polymer hydrogels, and their excessive consumption is an ecological burden to the society.16,17 Gelatin is a promising biopolymer having very good gelation capability. It can be modified due to the presence of various functional groups that are useful for therapeutic applications. Gelatin gels, although very useful, have certain inherent limitations such as lack of controllability, stimulation, and quick-response properties.18–20 Recently, magnetic biomaterial scaffolds have emerged as new active promising materials made up of biopolymers and magnetic nanoparticles and show magnetoresponsive behavior.21,22
Polymer hydrogels containing magnetic particles are stimuli-responsive gels, and their viscoelastic properties can be controlled by applying magnetic fields. Magnetic biopolymer gels can be synthesized by combining the magnetic nanoparticles and biopolymer by blending, onto-grafting, or in situ methods.23–26 Such magnetic scaffolds exhibit extraordinary biological applications, such as enzyme immobilization, tissue engineering, soft actuators, cancer treatment, and drug delivery. Drug delivery systems are primarily dependent on carriers with pH, temperature, light-sensitive, or magnetic behavior for stimuli-responsiveness, controllability, and targeted delivery.27–29 Researchers have previously reported biocomposite materials comprising of gelatin and Fe3O4 nanoparticles for the controlled release of Vitamin B12 and show the “on or off” mode on applying a magnetic field.30,31 Huang et al. also explored the magnetically controlled release of sirolimus for drug-eluting stent application using magnetic scaffolds.32 Magnetic nanoparticles can be separately prepared in different uniform sizes, are modifiable, and can be used as fillers for the preparation of magnetic gels. However, there are certain limitations such as aggregation, accumulation, morphological changes, and leakage of magnetic nanoparticles in the magnetic scaffolds.33
Herein, magnetic ionic liquid surfactants (MSAILs) have an edge over magnetic nanoparticles in hydrogels. MSAILs, via the formation of self-assembled structures such as micelles or vesicles, can act as nanocarriers for drug delivery and exhibit magnetoresponsive behavior in hydrogels. In addition, MSAILs are homogenously solubilized in an aqueous solution and provide strength to gels through intermolecular interactions with biopolymers. In view of the above facts, we have tailored a magnetic essential amino acid-based ionic liquid surfactant, [ValC16][FeCl4], and characterized using the Raman, UV, and EPR spectra. The magnetic properties have been investigated using a vibrating sample magnetometer. Prior to hydrogel formation, the surface properties and aggregation behavior of the synthesized MSAIL has been investigated. The interaction of animal DNA with [ValC16][FeCl4] has been studied using CD spectroscopy, EB-exclusion essay test, zeta potential, and agarose gel electrophoresis. The current research strategy involved the preparation of the magnetic gel using [ValC16][FeCl4] and gelatin, and its application as a nanocarrier for drug delivery, an anticancer drug, have been used for reference studies. The release kinetics of the drugs has been investigated using theoretical mathematical models.
Experimental section
Materials
Valine and p-toluenesulphonic acid were procured from TCI India Ltd. Sodium carbonate, cetyl alcohol, toluene, dichloromethane, methanol, and sodium sulfate were obtained from SD Fine Chemicals India Ltd. Sodium chloride, magnesium chloride, calcium chloride dihydrate, and potassium chloride were purchased from SRL Chemicals Ltd, India.Deoxyribonucleic acid sodium salt from salmon testes (DNA), ethidium bromide, trizma base (99.9%), ferric(III) chloride hexahydrate (97% purity), glutaraldehyde and gelatin type A (300 Bloom, IEP = 9.0), were purchased from Sigma Aldrich.
The DNA concentration was measured using a NanoDrop Spectrophotometer (ND-1000) in 80 mmol L−1 Trizma base–EDTA hydrochloride buffer (TE buffer). The optimized DNA concentration was 92.1 ng μL−1 for the DNA interaction studies.
The in vitro drug loading and release experiment was carried out as follows: magnetic gel (1 mg mL−1 magnetic surfactant, 10% gelatin, and 0.01% glutaraldehyde) was taken in 150 mL phosphate buffer (pH 7.4) containing 5 mg of the drug for 24 h and monitored using UV-Vis spectroscopy. For the release experiment, the gel was placed in 150 mL phosphate buffer and kept under an incubator shaker at 100 rpm and 37 °C. At different intervals of time, 1 mL of aliquots was taken out, and an equal amount (1 mL) was added to maintain a constant volume. The drug release behavior has also been studied in the presence of different electrolytes (0.1 M concentration). The samples were analyzed through UV-Vis spectroscopy, and calculation was done using the predetermined calibration curve. The formula used for drug loading efficiency and cumulative release are given below.
where Ms and Md are the weight of the swollen and dry hydrogel, respectively.
Methods
Results and discussion
Self-assembly characteristics of [ValC16] Cl and [ValC16][FeCl4]
Prior to gel formation and drug loading, the self-assembly characteristics and surface activity of [ValC16] Cl and [ValC][FeCl4] were investigated in aqueous solutions with the help of surface tension, conductivity, and pyrene fluorescence measurement at 298.15 K. | ||
| Fig. 2 Represents the surface tension, pyrene fluorescence, and specific conductivity measurement profiles of [ValC16]Cl and [ValC16][FeCl4] in aqueous media. | ||
| SAILs | cac (mmol L−1) | Derived parameters | ||||||||
|---|---|---|---|---|---|---|---|---|---|---|
| ST | Cond. | Flr. | γ cmc (m N m−1) | π cmc (mN m−1) | pC20 | Γ max (μmol m−2) | A min (Å2) | β | ΔG0mic (kJ mol−1) | |
| [ValC16][FeCl4] | 0.02 | 0.05 | 0.05 | 30.18 | 39.88 | 5.85 | 0.37 | 442.6 | 0.32 | −23.1 |
| [ValC16]Cl | 0.07 | 0.09 | 0.10 | 25.67 | 45.39 | 5.95 | 0.29 | 559.7 | 0.77 | −28.8 |
Morphological transitions in the self-assembled structure of [ValC16][FeCl4]
[ValC16][FeCl4] shows the morphological transition in the aqueous solution by changing the concentration. The transition from micelles to rod-like structures to vesicles has been observed by the changes in the concentration of [ValC16][FeCl4] (HR-TEM images, Fig. S10, ESI†). Transitions such as that from micelles to vesicles form in various single-chain surfactants have been previously reported.38,39 At lower concentration, i.e., about 0.05 mM [ValC16][FeCl4] forms micelles, which changes into rod-like structures till 0.5 mM, and then a further increase in the concentration to 0.9 mM forms vesicular structures (Fig. S10, ESI†). We have used vesicular structures for our study to mimic biological liposomes. Counterion binding and hydrophobic interactions play an important role. At the lower concentration, the head group of the cationic moieties of the ionic liquid have less binding with a larger hydrophobic counter anion that sufficiently stabilize the head group repulsion in micellar structures. When the concentration increases, the molecules reorganize themselves, wherein larger hydrophobic counter anions are inserted toward the head group. This stabilizes the charge repulsion between the head groups, and vesicles are expected to form. The DLS plot shows that the hydrodynamic radii of the formed vesicles are 95 nm and 8 nm for micelles (Fig. 3a and Fig. S11, ESI†). The autocorrelation function has been provided in the ESI† (Fig. S12, ESI†). The transition from clear to turbid solution on increasing the concentration indicates the conversion from micelles to vesicles in Fig. 3b. The TEM images of [ValC16][FeCl4] show that the diameter of the vesicles is 100 nm (Fig. 3c) and that of the micelles is 5 nm (Fig. S10, ESI†).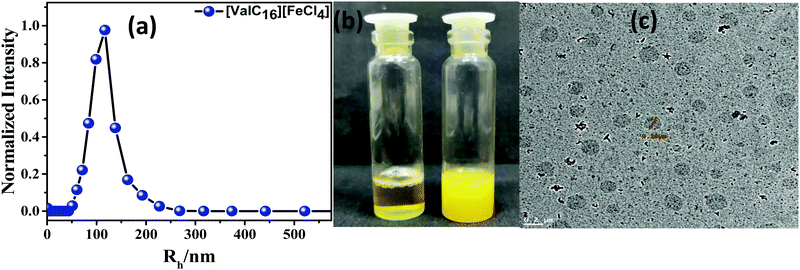 | ||
| Fig. 3 (a) DLS plot, (b) optical micrograph of micelle to vesicle transition, (c) TEM images of [ValC16][FeCl4] vesicles in aqueous medium. | ||
Physiochemical interaction of DNA with [ValC16][FeCl4]
The salmon fish-extracted DNA has been utilized to investigate the biocompatible nature of [ValC16][FeCl4]. The physicochemical interaction of [ValC16][FeCl4] with DNA has been studied using CD spectroscopy, EB-exclusion assay using fluorescence spectroscopy, zeta potential, and agarose gel electrophoresis.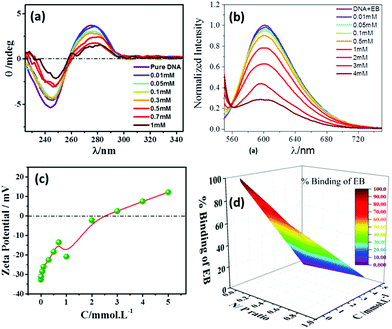 | ||
| Fig. 4 (a) CD spectra, (b) zeta potential, (c) EB-exclusion assay test, and (d) 3D plot of the % binding of EB at various concentrations of [ValC16][FeCl4]. | ||
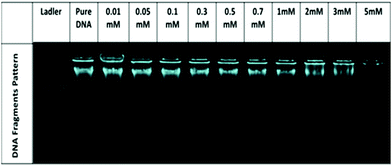
No significant change in the DNA bands has been observed till 0.7 mM of [ValC16][FeCl4], which shows the retention of the secondary structure of DNA. With a further increase in the concentration, a decrease in the intensity is observed due to the interaction of DNA with [ValC16][FeCl4]. The compaction of DNA has been observed with a reduction in the intensity and the shifting of the band positions with an increase in the surfactant concentration, which is likely due to the more exposure of the negatively charged DNA to the cationic head groups of [ValC16][FeCl4]. [ValC16][FeCl4]–DNA lipoplex formation because of the hydrophobic counter anion (FeCl4) is probably the reason behind DNA compaction.37
Zeta potential measurement
Zeta potential measurements have been used to investigate the changes or alterations in the surface charge of DNA when interacting with [ValC16][FeCl4]. As shown in Fig. 4b, the DNA solution has a negative zeta potential value due to the presence of the phosphate group in it. The zeta potential of the micelle (0.1 mM) and vesicles (1 mM) are +24 mV and +34 mV, respectively (Fig. S13, ESI†). This slight change observed in the zeta potential is likely due to the morphological transitions in the aggregated structures. At lower concentrations of [ValC16][FeCl4], the zeta potential remains unchanged due to the more DNA phosphate groups, whereas with an increase in the concentration of [ValC16][FeCl4], there is a decrease in the zeta potential value due to the effective interaction between the opposite head groups. On a further increase in the [ValC16][FeCl4] concentration, the value of the zeta potential becomes more positive, indicating DNA–surfactant complex formation.The quenching of intensity with [ValC16][FeCl4] is due to the displacement of EB by the cationic surfactant from the microenvironment of DNA. The % binding of EB decreased with the addition of [ValC16][FeCl4], as seen in Fig. 4d. The extent of binding was calculated by its ability to displace EB from the DNA–EB intercalated complex. The N/P ratio is the ratio between the moles of the N atom in the investigated molecule with the negatively charged phosphate group of DNA, and it is less than or equal to unity. The 3D surface plot indicates the increase in the surfactant concentration with an increase in the N/P ratio with more extent of DNA binding with [ValC16][FeCl4]. The maximum binding with DNA occurs between 0.5 mM and 3 mM, after which a disturbance in the band is observed due to charge neutralization. When the N/P ratio reaches one, EB is completely displaced from the surfactant.
Rheological behavior of magnetic [ValC16][FeCl4]–gelatin biocomposite hydrogel
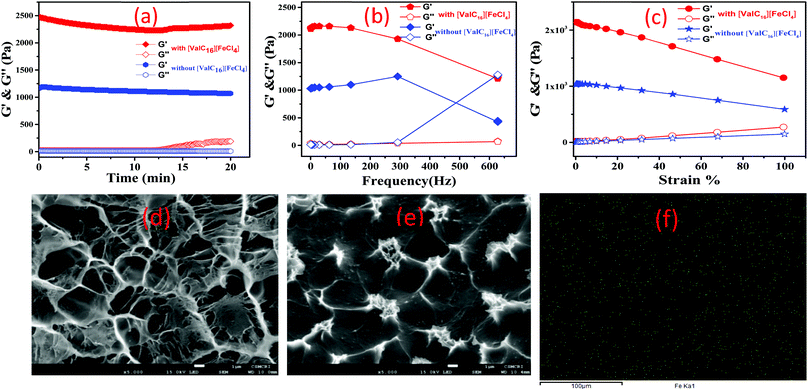
The rheological experiments were conducted to examine the strength, deformation characteristics under strain, and frequency variation of the gelatin–[ValC16][FeCl4] biocomposite gel. The vesicular region of [ValC16][FeCl4] has been used to form the magnetic biocomposite gel. The time sweep experiment in the storage modulus (G′) and loss modulus (G′′) was examined at 1 Hz constant frequency and 1% shear strain at room temperature (25 °C). It can be observed in Fig. 6a that no change was observed in G′ & G′′ and the higher G′ value indicates gel formation. The observed dynamic storage (G′) and loss (G′′) modulus under time sweep show that a linear graph is maintained, indicating no deformation in the gel. An increase in the G′ was observed after the inclusion of paramagnetic [ValC16][FeCl4] in the gel. The [ValC16][FeCl4]-containing gel was found to show a two-fold increase in the strength than the conventional gelatin gel. G′ and G′′ vs. frequency dependence are almost similar at 300 Hz, and no further decrease was observed (Fig. 6b). At higher frequencies (∼500 Hz), an intersection in G′ & G′′ was observed for the gels without [ValC16][FeCl4]. The magnetic gel shows a linear viscoelastic regime until the large strain of 75–80% at a frequency of 100 rad s−1 (Fig. 6c).The SEM images (Fig. 6d and e) show the morphology of the gelatin gels without and with [ValC16][FeCl4]. The carbonyl group in [ValC16][FeCl4] and in glutaraldehyde forms bonds with gelatin (–NH2) and forms a smooth homogenous microstructure morphology. To further confirm the structure, energy dispersive X-ray spectroscopy (EDX) was performed. EDX analysis confirms the presence of different elements and Fe(III) in the uniform surface of the magnetoresponsive biocomposite gel (Fig. S14, ESI†). Elemental mapping (Fig. 6f) shows the homogenous distribution of Fe(III) into the magnetic gel and the green dots represent Fe in the gelatin gel.
Drug loading and release studies
The entrapment of the drug molecules ornidazole and 5-fluorouracil into the biocomposite magnetic gel was studied. Initially, the leaching studies and the study on the swelling behavior of the magnetic gel in pure water were performed (Fig. S15 and S16, ESI†). From the prepared gel, no leaching or release of [ValC16][FeCl4] was observed, and time-dependent investigations showed no increase in the swelling after 24 h, also indicating a good porous behavior. Since the formation of vesicles is a spontaneous process, no external stimulus was required for drug loading into the magnetic gel. The drug loading efficiency of 5-fluorouracil and ornidazole, as determined from UV-Vis spectroscopy, was found to be 10 ± 0.2% and 8.3 ± 0.6%, respectively, in the case of pure gelatin, whereas in the magnetic gel, it was found to be 78 ± 0.3% and 69 ± 0.6%, respectively, at 37 °C, indicating a very high drug loading efficiency. The release studies of both the drugs (5-fluorouracil and ornidazole) from the magnetic gel were carried out in the phosphate buffer with respect to time (4 h to 96 h, Fig. 7a and b). After 96 h, no further release of the drug was observed. The cumulative release pattern of the drugs is shown in Fig. 7c. The slow release of both the drugs observed is due to vesicle entrapment and magnetic surfactant counterion. The retention in the UV-Vis band shows no degradation of the drug molecules entrapped in the magnetic gel. A comparison of the loading efficiency of both the drugs (ornidazole and 5-fluorouracil) in various types of systems investigated previously with the present magnetic gelatin–[ValC16][FeCl4] biocomposite gel is provided in Tables S2 and S3 (ESI†). A broad range of loading efficiencies is reported in the literature. The loading efficiency for 5-fluorouracil and ornidazole in the developed magnetic system are the highest reported so far. The VSM graph indicates the magnetic nature of the investigated [ValC16][FeCl4] surfactant and the gelatin–[ValC16][FeCl4] biocomposite gel (Fig. 7d).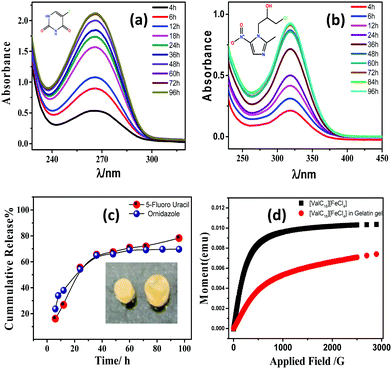 | ||
| Fig. 7 (a and b) Release pattern of 5-fluorouracil and ornidazole, respectively, (c) cumulative release of drugs, and (d) magnetic behavior of [ValC16][FeCl4] and the gelatin–[ValC16][FeCl4] gel. | ||
On lowering the concentration of [ValC16][FeCl4] in the magnetic biocomposite gel from the vesicular region to the micellar region (0.1 mM), the loading efficiency of 5-fluorouracil and ornidazole decreases to 49 ± 0.2% and 42 ± 0.5%, respectively. The decrease in the loading capacity was observed because the vesicles are more favorable to the loading of a hydrophilic drug. The release of the drug from the magnetic gel has also been studied in various equimolar electrolyte solutions to compare the release behavior. We have taken ornidazole as the representative example for the study because both drugs follow a similar release trend. The used electrolyte solutions were sodium chloride (NaCl), potassium chloride (KCl), calcium chloride (CaCl2), and magnesium chloride (MgCl2). The in vitro release profile of the drug in different electrolyte solutions was recorded as a function of time (Fig. S17, ESI†). In case of bivalent cations, it was found that drug release in CaCl2 solution is slower than in the MgCl2 solution, whereas in the case of monovalent ions, the drug release is slower in NaCl as compared to that in KCl solution.
The cumulative release pattern of the drug was fitted into different models. The kinetics of release of ornidazole and 5-fluorouracil from the magnetic gel has been studied using various mathematical models such as the Higuchi model, Hixson–Crowell model, or Korsmeyer–Peppas model, which were determined to be zero-order and first-order, respectively (Table S4, ESI†). The fitted data in the mathematical equation follows the Korsmeyer–Peppas model with R2 values of 0.99 and 0.98 for both ornidazole and 5-fluorouracil, respectively. The Korsmeyer–Peppas model shows drug release following the erosion of the material with the diffusion of the drug. The model shows that both the drugs follow similar kinetics.
Conclusions
The essential amino acid (valine)-based surfactant [ValC16][Cl] and its analogue magnetic surface active ionic liquid surfactant [ValC16][FeCl4] have been synthesized. The synthesized materials have been characterized using 1H NMR, LCMS, EPR spectroscopy, Raman spectroscopy, UV spectroscopy, TGA, and DSC. The self-assembly behavior of [ValC16][Cl] and [ValC16][FeCl4] was studied using the surface tension, pyrene fluorescence, and specific conductivity measurements and their related parameters were derived. The surface parameters show a remarkably low value of cac and high surface activity for [ValC16][FeCl4]. TEM analysis shows morphological transition from micelles to vesicles on increasing the concentration of [ValC16][FeCl4]. The physicochemical interaction investigations of DNA with [ValC16][FeCl4] indicates its biocompatible nature. The vesicular region of the surfactant has been used to form magnetic biocomposite gels using gelatin. The rheological behavior of the synthesized gels indicates very good gel strength. The formed magnetic biocomposite gel has been used as a drug carrier for ornidazole and 5-fluorouracil with very high loading efficiency (69 ± 0.6% and 78 ± 0.3%), respectively. The magnetic analysis of the magnetic biocomposite gel shows good magnetic behavior. The kinetics of release of both the drugs follows the Korsmeyer–Peppas model. Such nanoparticle-free magnetic biocomposite gels can be successfully utilized for in vivo studies and can be used in applications such as cell/drug delivery and tissue engineering purposes.Conflicts of interest
There are no conflicts to declare.Acknowledgements
CSIR-CSMCRI communication number 110/2021. Authors acknowledges Department of Science and Technology (No. EMR/2016/004747), Government of India, for financial support. We thank analytical facility of CSIR-CSMCRI. We thank Dr Mangal Singh Rathore (CSIR-CSMCRI) for help in gel electrophoresis. We also thank Dr R. Desai (CHARUSAT) for their help in magnetic measurements.References
- L. Nobile and S. Nobile, Recent advances of nanotechnology in medicine and engineering, AIP Conf. Proc., 1736, 2016, 020058 Search PubMed.
- F. Oroojalian, F. Charbgoo, M. Hashemi, A. Amani, R. Yazdian-Robati, A. Mokhtarzadeh, M. Ramezani and M. R. Hamblin, Recent advances in nanotechnology-based drug delivery systems for the kidney, J. Controlled Release, 2020, 321, 442–462 CrossRef CAS.
- E. Santos, J. Albo and A. Irabien, Magnetic ionic liquids: synthesis, properties and applications, RSC Adv., 2014, 4, 40008–40018 RSC.
- D. Chand, M. Q. Farooq, A. K. Pathak, J. Li, E. A. Smith and J. L. Anderson, Magnetic ionic liquids based on transition metal complexes with N-alkylimidazole ligands, New J. Chem., 2019, 43, 20–23 RSC.
- K. D. Clark, O. Nacham, H. Yu, T. Li, M. M. Yamsek, D. R. Ronning and J. L. Anderson, Extraction of DNA by Magnetic Ionic Liquids: Tunable Solvents for Rapid and Selective DNA Analysis, Anal. Chem., 2015, 87, 1552–1559 CrossRef CAS PubMed.
- A. Kulshrestha, P. S. Gehlot and A. Kumar, Paramagnetic surface active ionic liquids: synthesis, properties, and applications, Mater. Today Chem., 2021, 21, 100522 CrossRef CAS.
- P. Brown, A. Bushmelev, C. P. Butts, J. Cheng, J. Eastoe, I. Grillo, R. K. Heenan and A. M. Schmidt, Magnetic Control over Liquid Surface Properties with Responsive Surfactants, Angew. Chem., Int. Ed., 2012, 51, 2414–2416 CrossRef CAS PubMed.
- P. Brown, T. Alan Hatton and J. Eastoe, Magnetic surfactants, Curr. Opin. Colloid Interface Sci., 2015, 20, 140–150 CrossRef CAS.
- A. Kulshrestha, G. Kumar, N. H. Khan and A. Kumar, Metal-based surface active ionic liquids: Self-assembling characteristics and CC bond functionalization of tertiary amines with TMSCN in aqueous micellar solutions, J. Mol. Liq., 2020, 299, 112157 CrossRef CAS.
- A. Kulshrestha, P. S. Gehlot and A. Kumar, Magnetic proline-based ionic liquid surfactant as a nanocarrier for hydrophobic drug delivery, J. Mater. Chem. B, 2020, 8, 3050–3057 RSC.
- P. Brown, L. Bromberg, M. I. Rial-Hermida, M. Wasbrough, T. A. Hatton and C. Alvarez-Lorenzo, Magnetic Surfactants and Polymers with Gadolinium Counterions for Protein Separations, Langmuir, 2016, 32, 699–705 CrossRef CAS PubMed.
- P. S. Gehlot, H. Gupta and A. Kumar, Paramagnetic Surface Active Ionic Liquids: Interaction with DNA and MRI Application, Colloid Interface Sci. Commun., 2018, 26, 14–23 CrossRef CAS.
- L. Xu, Y. Wang, G. Wei, L. Feng, S. Dong and J. Hao, Ordered DNA-Surfactant Hybrid Nanospheres Triggered by Magnetic Cationic Surfactants for Photon- and MagnetoManipulated Drug Delivery and Release, Biomacromolecules, 2015, 16, 4004–4012 CrossRef CAS PubMed.
- L. Xu, L. Feng, J. Hao and S. Dong, Controlling the Capture and Release of DNA with a Dual-Responsive Cationic Surfactant, ACS Appl. Mater. Interfaces, 2015, 7, 8876–8885 CrossRef CAS PubMed.
- L. Wang, Y. Wang, J. Hao and S. Dong, Magnetic Fullerene-DNA/Hyaluronic Acid Nanovehicles with Magnetism/Reduction Dual-Responsive Triggered Release, Biomacromolecules, 2017, 18, 1029–1038 CrossRef CAS PubMed.
- S. Van Vlierberghe, P. Dubruel and E. Schacht, Biopolymer-Based Hydrogels As Scaffolds for Tissue Engineering Applications: A Review, Biomacromolecules, 2011, 12, 1387–1408 CrossRef CAS PubMed.
- N. Reddy, R. Reddy and Q. Jiang, Crosslinking biopolymers for biomedical applications, Trends Biotechnol., 2015, 33, 362–369 CrossRef CAS PubMed.
- T. N. Dinh, S. Hou, S. Park, B. A. Shalek and K. J. Jeong, Gelatin Hydrogel Combined with Polydopamine Coating To Enhance Tissue Integration of Medical Implants, ACS Biomater. Sci. Eng., 2018, 4, 3471–3477 CrossRef CAS.
- S. K. Bhattacharyya, M. Dule, R. Paul, J. Dash, M. Anas, T. K. Mandal, P. Das, N. C. Das and S. Banerjee, Carbon Dot Cross-Linked Gelatin Nanocomposite Hydrogel for pH-Sensing and pH-Responsive Drug Delivery, ACS Biomater. Sci. Eng., 2020, 6, 5662–5674 CrossRef CAS PubMed.
- A. Bakravi, Y. Ahamadian, H. Hashemi and H. Namazi, Synthesis of gelatin-based biodegradable hydrogel nanocomposite and their application as drug delivery agent, Adv. Polym. Technol., 2018, 37, 2625–2635 CrossRef CAS.
- C. Shuai, W. Yang, C. He, S. Peng, C. Gao, Y. Yang, F. Qi and P. Feng, A magnetic micro-environment in scaffolds for stimulating bone regeneration, Mater. Des., 2020, 185, 108275 CrossRef CAS.
- K. Dashnyam, R. A. Perez, R. K. Singh, E.-J. Lee and H.-W. Kim, Hybrid magnetic scaffolds of gelatin–siloxane incorporated with magnetite nanoparticles effective for bone tissue engineering, RSC Adv., 2014, 4, 40841–40851 RSC.
- X. Luo, S. Liu, J. Zhou and L. Zhang, In situ synthesis of Fe3O4/cellulose microspheres with magnetic-induced protein delivery, J. Mater. Chem., 2009, 19, 3538–3545 RSC.
- W. Zhao, K. Odelius, U. Edlund, C. Zhao and A.-C. Albertsson, In Situ Synthesis of Magnetic Field-Responsive Hemicellulose Hydrogels for Drug Delivery, Biomacromolecules, 2015, 16, 2522–2528 CrossRef CAS PubMed.
- N. N. Reddy, Y. M. Mohan, K. Varaprasad, S. Ravindra, P. A. Joy and K. M. Raju, Magnetic and electric responsive hydrogel–magnetic nanocomposites for drug-delivery application, J. Appl. Polym. Sci., 2011, 122, 1364–1375 CrossRef CAS.
- R. Barbucci, G. Giani, S. Fedi, S. Bottari and M. Casolaro, Biohydrogels with magnetic nanoparticles as crosslinker: Characteristics and potential use for controlled antitumor drug-delivery, Acta Biomater., 2012, 8, 4244–4252 CrossRef CAS PubMed.
- J. Liao and H. Huang, Review on Magnetic Natural Polymer Constructed Hydrogels as Vehicles for Drug Delivery, Biomacromolecules, 2020, 21, 2574–2594 CrossRef CAS PubMed.
- Y. Li, G. Huang, X. Zhang, B. Li, Y. Chen, T. Lu, T. J. Lu and F. Xu, Magnetic Hydrogels and Their Potential Biomedical Applications, Adv. Funct. Mater., 2013, 23, 660–672 CrossRef CAS.
- T. Mitsumata, A. Honda, H. Kanazawa and M. Kawai, Magnetically Tunable Elasticity for Magnetic Hydrogels Consisting of Carrageenan and Carbonyl Iron Particles, J. Phys. Chem. B, 2012, 116, 12341–12348 CrossRef CAS.
- S.-H. Hu, T.-Y. Liu, D.-M. Liu and S.-Y. Chen, Nano-ferrosponges for controlled drug release, J. Controlled Release, 2007, 121, 181–189 CrossRef CAS PubMed.
- T.-Y. Liu, S.-H. Hu, K.-H. Liu, D.-M. Liu and S.-Y. Chen, Preparation and characterization of smart magnetic hydrogels and its use for drug release, J. Magn. Magn. Mater., 2006, 304, e397–e399 CrossRef CAS.
- L.-Y. Huang and M.-C. Yang, Behaviors of controlled drug release of magnetic-gelatin hydrogel coated stainless steel for drug-eluting-stents application, J. Magn. Magn. Mater., 2007, 310, 2874–2876 CrossRef CAS.
- T. K. Indira and P. K. Lakshmi, Magnetic Nanoparticles – A Review, Int. J. Pharm. Sci. Nanotechnol., 2010, 3, 1035–1042 CAS.
- A. Cornellas, L. Perez, F. Comelles, I. Ribosa, A. Manresa and M. T. Garcia, Self-aggregation and antimicrobial activity of imidazolium and pyridinium based ionic liquids in aqueous solution, J. Colloid Interface Sci., 2011, 355, 164–171 CrossRef CAS.
- C. de la Fuente-Nunez, P. Brown, M. D. T. Torres, J. Cao and T. K. Lu, Magnetic Surfactant Ionic Liquids and Polymers With Tetrahaloferrate (III) Anions as Antimicrobial Agents With Low Cytotoxicity, Colloid Interface Sci. Commun., 2018, 22, 11–13 CrossRef CAS.
- K. Srinivasa Rao, T. Singh, T. J. Trivedi and A. Kumar, Aggregation Behavior of Amino Acid Ionic Liquid Surfactants in Aqueous Media, J. Phys. Chem. B, 2011, 115, 13847–13853 CrossRef CAS PubMed.
- L. Xu, L. Feng, J. Hao and S. Dong, Compaction and decompaction of DNA dominated by the competition between counterions and DNA associating with cationic aggregates, Colloids Surf., B, 2015, 134, 105–112 CrossRef CAS.
- Y. Ono, H. Kawasaki, M. Annaka and H. Maeda, Effects of micelle-to-vesicle transitions on the degree of counterion binding, J. Colloid Interface Sci., 2005, 287, 685–693 CrossRef CAS.
- B. zu Putlitz, K. Landfester, S. Förster and M. Antonietti, Vesicle-Forming Single-Tail Hydrocarbon Surfactants with Sulfonium Headgroup, Langmuir, 2000, 16, 3003–3005 CrossRef CAS.
- P. S. Gehlot, H. Gupta, M. S. Rathore, K. Khatri and A. Kumar, Intrinsic MRI contrast from amino acid-based paramagnetic ionic liquids, Mater. Adv., 2020, 1, 1980–1987 RSC.
- S. Hou, N. Ziebacz, S. A. Wieczorek, E. Kalwarczyk, V. Sashuk, T. Kalwarczyk, T. S. Kaminski and R. Holyst, Formation and structure of PEI/DNA complexes: quantitative analysis, Soft Matter, 2011, 7, 6967–6972 RSC.
- A. Dasgupta, P. K. Das, R. S. Dias, M. G. Miguel, B. Lindman, V. M. Jadhav, M. Gnanamani and S. Maiti, Effect of Headgroup on DNA–Cationic Surfactant Interactions, J. Phys. Chem. B, 2007, 111, 8502–8508 CrossRef CAS.
Footnote |
| † Electronic supplementary information (ESI) available. See DOI: 10.1039/d1ma00758k |
| This journal is © The Royal Society of Chemistry 2022 |


