 Open Access Article
Conductive NiMn-based bimetallic metal–organic gel nanosheets for supercapacitors†
Qiankun
Zhong‡
a,
Wensheng
Liu‡
a,
Yong
Yang
a,
Wenkang
Pan
a,
Mingzai
Wu
b,
Fangcai
Zheng
 c,
Xiao
Lian
a and
Helin
Niu
 *a
*a
aAnHui Province Key Laboratory of Chemistry for Inorganic/Organic Hybrid Functionalized Materials, Key Laboratory of Structure and Functional Regulation of Hybrid Materials of Ministry of Education, Department of Chemistry, Anhui University, Hefei 230601, P. R. China. E-mail: niuhelin@ahu.edu.cn
bEnergy Materials and Devices Key Lab of Anhui Province for Photoelectric Conversion, School of Physics and Materials Science, Anhui University, Hefei 230601, P. R. China
cKey Laboratory of Structure and Functional Regulation of Hybrid Materials of Ministry of Education, Institutes of Physical Science and information Technology, Anhui University, Hefei 230601, P. R. China
First published on 17th May 2021
Abstract
Recently, the easy processability and dynamic properties of metal–organic gels (MOGs) have highlighted their application in sensing, adsorption, and catalysis. However, people rarely realize the potential application of metal organic gels (MOGs) in supercapacitors due to the insufficient conductivity of most MOGs. Here, a conductive NiMn-based bimetallic metal–organic gel with controllable morphology has been manufactured via a self-assembly process with metal ion and low molecular weight gelators. The interaction of metal ion and low molecular weight gelators easily control the growth of NiMn MOG with different nanostructures, such as pieces, lines, and rods by changing the molar ratio of Ni2+ and Mn2+. Benefiting from the nanosheets, the electrode of NiMn-3 MOG exhibits an excellent capacitance of ∼692.9 F g−1 at 1 A g−1, a good rate performance (516.6 F g−1 at 9 A g−1) and a favorable conductivity (1.12 S m−1). Furthermore, an asymmetric supercapacitor (ASC) device assembled with activated carbon as the negative electrode and NiMn MOG as the positive electrode exhibits a maximum energy density of 87.5 W h kg−1 at a power density of 849 W kg−1, and preserves great cycling stability (84.54% capacity retention after 5000 cycles). This work provides an effective strategy to manufacture NiMn MOG-based electrodes for actual energy storage and conversion applications.
Introduction
Supercapacitors (SCs) have been regarded as one of the most appealing energy storage devices for various applications that require rapid recharge capabilities and high energy density.1–4 The rational design of novel structures and the development of materials are significant to enhance electrochemical performance.5–8 Metal organic frameworks (MOFs) with distinctive structures have shown extensive applications in supercapacitors due to their tunable structure, high porosity and diversity.9,10 Nevertheless, MOFs with inadequate conductivity have a certain negative influence on the efficiency of electron transfer and ion diffusion due to the serious lack of well-integrated transmission channels, further hindering their application in supercapacitors.11,12As the homologous species of MOFs, metal organic gels (MOGs) represent an emerging type of porous material displaying a certain extent of designability and adjustability in composition and function, owing to the variability of the central metal ion and ligand that could be easily designed and decorated.13–16 Besides, the synergistic effect of electrostatic effect and cross-linking coordination in the reaction system induces gelation to produce pores in the mesopore range (2–50 nm) to support the migration and diffusion of chemical substances.17 Therefore, MOGs have attracted extensive attention as potential energy storage application materials.18,19 However, obtaining metal organic gels with special functions (high stability, great conductivity and so on) is sometimes difficult as only a single metal component is used. The bimetallic MOGs could be utilized by introducing another active unit to get over this weakness.20,21 For example, the electron acceptors of iodine and 2,4,7-trinitrofluorenone were added to get high stability and great conductivity.22 In addition, compared with single-metal MOGs, bimetallic MOGs tend to have minor particles, larger volume and more metal active sites due to the introduction of heterogeneity.23,24 Simultaneously, the most significant feature of the two-component is that the properties and structure of the gels can be easily modulated by altering the molar ratio of the component. Regulating the nano-structure of the ion conduction channel has proved to be a more realistic means to comply with the high proton conductivity because the structural characteristics revise the kinetics and distance of the transition site, which determines the proton transport behavior.11,25,26 Particularly, the active centers of the metals are highly distributed in the MOG reaction system, and large-scale fabrication of MOGs are easier with the appropriate gelation process, which is advantageous for the SC process. Despite the exceptional advantages, so far, there have been no related reports that exploited the application for bimetallic MOGs in the SCs.
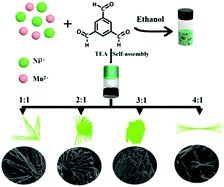
In this work, a series of metal ions with various adjustable ratios (Ni2+ and Mn2+) and organic ligands 1,3,5-benzenetricarboxylic acid (BTC) were simply mixed to prepare bimetallic NiMn-3 MOG (Ni/Mn molar ratio is 3![[thin space (1/6-em)]](https://www.rsc.org/images/entities/char_2009.gif) :
:![[thin space (1/6-em)]](https://www.rsc.org/images/entities/char_2009.gif) 1) via a self-assembly process for the SCs (Scheme 1). The bimetallic NiMn-3 MOG possesses the structure of nanosheets and exhibits great conductivity (1.12 S m−1). Test on electrochemistry shows that the specific capacitance value of NiMn-3 MOG can reach 692.9 F g−1 at a current density of 1 A g−1 due to the synergy between Ni2+ and Mn2+. Furthermore, after 5000 charge/discharge cycles at a high current density of 8 A g−1, 84.6% of specific capacitance can still be retained which exhibits excellent durability. More importantly, the assembled device, NiMn-3 MOG//AC, exhibits excellent performance in the application of energy storage of 91.52 W h kg−1 at a power density of 850.03 W kg−1 and shows great cycling stability (84.54% capacity retention after 5000 cycles), certifying that NiMn-3 MOG has great prospects for actual energy storage and conversion applications.
1) via a self-assembly process for the SCs (Scheme 1). The bimetallic NiMn-3 MOG possesses the structure of nanosheets and exhibits great conductivity (1.12 S m−1). Test on electrochemistry shows that the specific capacitance value of NiMn-3 MOG can reach 692.9 F g−1 at a current density of 1 A g−1 due to the synergy between Ni2+ and Mn2+. Furthermore, after 5000 charge/discharge cycles at a high current density of 8 A g−1, 84.6% of specific capacitance can still be retained which exhibits excellent durability. More importantly, the assembled device, NiMn-3 MOG//AC, exhibits excellent performance in the application of energy storage of 91.52 W h kg−1 at a power density of 850.03 W kg−1 and shows great cycling stability (84.54% capacity retention after 5000 cycles), certifying that NiMn-3 MOG has great prospects for actual energy storage and conversion applications.
Experimental
Materials
1,3,5-Benzenetricarboxylic acid (C6H3(CO2H)3), nickel chloride hexahydrate (NiCl2·6H2O), manganese chloride tetrahydrate (MnCl2·4H2O), ethanol (C2H5OH), potassium hydroxide (KOH), triethylamine (TEA, AR), polytetrafluoroethylene aqueous emulsion (PTFE, 6 wt%) and activated carbon were purchased from Sinopharm Chemical Reagent Co., Ltd. All reagents were of commercial quality and were used in the experiment without further purification.Preparation of MOGs
Ni MOG. First, 3 mmol of NiCl2·6H2O (237.69 g mol−1, 0.713 g) was dissolved in 2 mL of ethanol reagent, and then 2 mmol of 1,3,5-benzenetricarboxylic acid (210.14 g mol−1, 0.42 g) was dissolved in 3 mL ethanol reagent (containing 300 μL TEA, which can improve the solubility of the ligand in ethanol). The two solutions were mixed and fully shaken until they were homogenized and placed at room temperature to stand still until a gel was formed, and the sample was named Ni MOG.
Mn MOG. Similarly, 3 mmol MnCl2·4H2O (197.91 g mol−1, 0.594 g) and 2 mmol 1,3,5-trimellitic acid (210.14 g mol−1, 0.42 g) were dissolved in 2 mL and 3 mL of ethanol reagents, respectively, and the resulting gel was named Mn MOG.
![[thin space (1/6-em)]](https://www.rsc.org/images/entities/char_2009.gif) :
:![[thin space (1/6-em)]](https://www.rsc.org/images/entities/char_2009.gif) 2), the concentration of the total metal ions in the solution was always maintained at 0.6 mol L−1. After the reaction is completed, the sample is named NiMn-3 MOG, in which the concentration of Ni2+ is 0.45 mol L−1 and the concentration of Mn2+ is 0.15 mol L−1 (the molar ratio of Ni2+ to Mn2+ is 3
2), the concentration of the total metal ions in the solution was always maintained at 0.6 mol L−1. After the reaction is completed, the sample is named NiMn-3 MOG, in which the concentration of Ni2+ is 0.45 mol L−1 and the concentration of Mn2+ is 0.15 mol L−1 (the molar ratio of Ni2+ to Mn2+ is 3![[thin space (1/6-em)]](https://www.rsc.org/images/entities/char_2009.gif) :
:![[thin space (1/6-em)]](https://www.rsc.org/images/entities/char_2009.gif) 1), and expressed as NiMn-3 MOG. Other MOGs were obtained by the same method and NiMn MOGs with Ni2+ and Mn2+ ratios of 1
1), and expressed as NiMn-3 MOG. Other MOGs were obtained by the same method and NiMn MOGs with Ni2+ and Mn2+ ratios of 1![[thin space (1/6-em)]](https://www.rsc.org/images/entities/char_2009.gif) :
:![[thin space (1/6-em)]](https://www.rsc.org/images/entities/char_2009.gif) 1, 2
1, 2![[thin space (1/6-em)]](https://www.rsc.org/images/entities/char_2009.gif) :
:![[thin space (1/6-em)]](https://www.rsc.org/images/entities/char_2009.gif) 1, and 4
1, and 4![[thin space (1/6-em)]](https://www.rsc.org/images/entities/char_2009.gif) :
:![[thin space (1/6-em)]](https://www.rsc.org/images/entities/char_2009.gif) 1 were denoted as NiMn-1 MOG, NiMn-2 MOG and NiMn-4 MOG (the total molar amount of Ni2+ and Mn2+ is 3 mol and the ligand concentration remains the same), respectively.
1 were denoted as NiMn-1 MOG, NiMn-2 MOG and NiMn-4 MOG (the total molar amount of Ni2+ and Mn2+ is 3 mol and the ligand concentration remains the same), respectively.
Material characterization
The prepared material was characterized using X-ray diffraction spectrum (XRD) (Bruker D8 Focus), field emission scanning electron microscopy (FESEM) (Hitachi-S4800) and transmission electron microscopy (TEM) (FEI Tecnai G2 F20). The rheologies of the NiMn MOG composite were measured using a MCR 702 rheometer. The specific surface area and pore size distribution were characterized by adsorption/desorption isotherms at 77 K using a TriStar™ II (Micromeritics) device. The conductivity of the material was measured using a Four point probe resistivity tester (SZT-2A). The chemical composition and valence state of the materials were measured using a VG ESCALAB 250 spectrophotometer with Al Kα radiation (1486.6 eV) by X-ray photoelectron spectroscopy (XPS).Preparation of working electrode
In order to prepare the working electrode used in the three-electrode device, the active material, acetylene black and polytetrafluoroethylene (PTFE) are mixed and stirred at a mass ratio of 7![[thin space (1/6-em)]](https://www.rsc.org/images/entities/char_2009.gif) :
:![[thin space (1/6-em)]](https://www.rsc.org/images/entities/char_2009.gif) 2
2![[thin space (1/6-em)]](https://www.rsc.org/images/entities/char_2009.gif) :
:![[thin space (1/6-em)]](https://www.rsc.org/images/entities/char_2009.gif) 1 to make a slurry, and then a thin film with a thickness of 0.1 mm is prepared and laid on the nickel foam, the mass load is 5.0–6.0 mg cm−2, and dried in an oven at 60 °C for 2 hours to remove the solvent.
1 to make a slurry, and then a thin film with a thickness of 0.1 mm is prepared and laid on the nickel foam, the mass load is 5.0–6.0 mg cm−2, and dried in an oven at 60 °C for 2 hours to remove the solvent.
Electrochemical performance test
All electrochemical properties are measured using CHI 660E. In the three-electrode device, acetylene carbon black and saturated calomel electrode (SCE) are used as the counter electrode and reference electrode, respectively, and tested in 6 M KOH. Under the open circuit voltage, electrochemical impedance spectroscopy (EIS) measurement was performed at a frequency of 100 kHz to 0.1 Hz using an electrochemical workstation (ZAHNER PP211, Germany). For electrochemical tests, cyclic voltammetry (CV) and constant current discharge–charge tests were performed using an electrochemical workstation (CHI 660E). The electrode material specific capacitance Cm (F g −1) is calculated according to eqn (1).27,28 | (1) |
 | (2) |
 | (3) |
 | (4) |
Results and discussion
The microstructure features of the MOG materials obtained by scanning electron microscopy (SEM) show a refined fine-grain morphology that is related to their physical properties and chemical structure (Fig. 1 and Fig. S1, S2, ESI†). The SEM of the Ni MOG, Mn MOG and NiMn MOG with different ratios was performed to explore the independent central metal nodes Ni, Mn, and their different ratios on the adjustment of the gel morphology. It is worth noting that the pure monometallic gels Ni MOG and Mn MOG (Fig. S1(a)–(d), ESI†) have a uniform open porous microstructure with similar interconnected porous networks. As the ratio of Ni2+ to Mn2+ changes, the microscopic morphology of MOG changes from irregularly stacked nanowires to stacked nanosheets, and when Ni![[thin space (1/6-em)]](https://www.rsc.org/images/entities/char_2009.gif) :
:![[thin space (1/6-em)]](https://www.rsc.org/images/entities/char_2009.gif) Mn = 3
Mn = 3![[thin space (1/6-em)]](https://www.rsc.org/images/entities/char_2009.gif) :
:![[thin space (1/6-em)]](https://www.rsc.org/images/entities/char_2009.gif) 1, close-packed nanorods with smooth surfaces are formed as shown in Fig. 1(a) and (b). This is may be attributed to the regular coordination between the central metal node and the organic bridging ligand to improve its electrochemical performance.29,30 The ratio of the central node should be greater than 3 to obtain irregularly shaped bundled nanosheets, which may be due to the excessive introduction of Ni2+ which interferes with the coordination environment in the system. Element mapping (Fig. 1(c)) characterizes the element types and approximate distribution of the MOG aerogel (Ni
1, close-packed nanorods with smooth surfaces are formed as shown in Fig. 1(a) and (b). This is may be attributed to the regular coordination between the central metal node and the organic bridging ligand to improve its electrochemical performance.29,30 The ratio of the central node should be greater than 3 to obtain irregularly shaped bundled nanosheets, which may be due to the excessive introduction of Ni2+ which interferes with the coordination environment in the system. Element mapping (Fig. 1(c)) characterizes the element types and approximate distribution of the MOG aerogel (Ni![[thin space (1/6-em)]](https://www.rsc.org/images/entities/char_2009.gif) :
:![[thin space (1/6-em)]](https://www.rsc.org/images/entities/char_2009.gif) Mn = 3
Mn = 3![[thin space (1/6-em)]](https://www.rsc.org/images/entities/char_2009.gif) :
:![[thin space (1/6-em)]](https://www.rsc.org/images/entities/char_2009.gif) 1). The mapping analysis provides the chemical composition of NiMn-3 MOG. The mapping result shows a small amount of N element, which is related to the introduction of triethylamine. The positioning of various elements is similar, implying the coordinated coordination of Ni, Mn and BTC; in addition, triethylamine as a gel inducer leads to the formation of the NiMn-3 MOG composite. According to the EDX analysis (Fig. S3, ESI†), the atomic ratio of Mn and Ni was approximated to be 72.07
1). The mapping analysis provides the chemical composition of NiMn-3 MOG. The mapping result shows a small amount of N element, which is related to the introduction of triethylamine. The positioning of various elements is similar, implying the coordinated coordination of Ni, Mn and BTC; in addition, triethylamine as a gel inducer leads to the formation of the NiMn-3 MOG composite. According to the EDX analysis (Fig. S3, ESI†), the atomic ratio of Mn and Ni was approximated to be 72.07![[thin space (1/6-em)]](https://www.rsc.org/images/entities/char_2009.gif) :
:![[thin space (1/6-em)]](https://www.rsc.org/images/entities/char_2009.gif) 27.93, which was consistent with the result obtained using the X-ray photoelectron spectroscopy (XPS) (Mn
27.93, which was consistent with the result obtained using the X-ray photoelectron spectroscopy (XPS) (Mn![[thin space (1/6-em)]](https://www.rsc.org/images/entities/char_2009.gif) :
:![[thin space (1/6-em)]](https://www.rsc.org/images/entities/char_2009.gif) Ni = 69.7
Ni = 69.7![[thin space (1/6-em)]](https://www.rsc.org/images/entities/char_2009.gif) :
:![[thin space (1/6-em)]](https://www.rsc.org/images/entities/char_2009.gif) 30.3). The elemental ratio of the NiMn-3 MOG was not in keeping with the initial precursor ethanol solution, which may be attributed to the incomplete coordination of the precursor Ni ions.
30.3). The elemental ratio of the NiMn-3 MOG was not in keeping with the initial precursor ethanol solution, which may be attributed to the incomplete coordination of the precursor Ni ions.
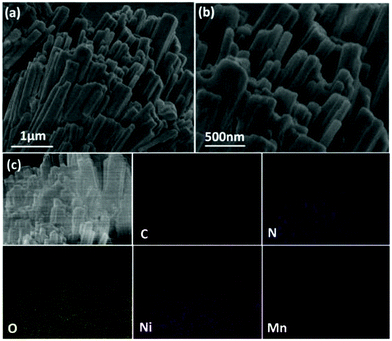 | ||
| Fig. 1 The SEM images of (a) and (b) NiMn-3 MOG, and (c) the corresponding elemental mapping of NiMn-3 MOG electrode (the bottommost images). | ||
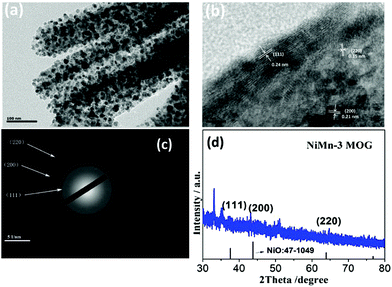
Transmission electron microscopy was performed for the NiMn-3 MOG composite in order to explore the internal micro morphology of the gel. Fig. 2(a) shows the composition of nanoparticles with a nanorod size of approximately 2 nm. These nanoparticles may result from the core structure formed under the reaction conditions during their coordination process with Ni, Mn and BTC. It is worth noting that the exterior of the nanoparticles is coated to form nanorods with smooth and regular surfaces. This may be attributed to the introduction of TEA, which changed the pH value of the reaction system and promoted the rapid formation of gels, resulting in coordination.31 The crystal nucleus quickly covered up. From the HRTEM image (Fig. 2b), the nanoparticles can be seen more clearly, and the lattice spacings of NiMn-3 MOG are 0.209 nm, 0.132 nm and 0.209 nm, respectively, corresponding to the crystal planes (011), (110) and (112). In addition, the selected area electron diffraction (SAED) pattern of NiMn-3 MOG is shown in Fig. 2(c). The diffraction ring points to the crystal planes (011), (110), (112) of the composite material, revealing the polycrystalline nature of the material. The powder X-ray diffraction (PXRD) patterns clearly suggest that the Ni salt precursor was converted into the gels (Fig. 2(d)). Particularly, the two weak and sharp signals sited at 37.3, 43.3 and 62.9 matched well with the (111), (200) and (220) planes of NiMn-3 MOG, respectively, which was consistent with the SAED results. Furthermore, the curves of PXRD proved that Ni BTC, Mn BTC and NiMn BTC all have similar crystalline structures, indicating that the co-existence of Ni and Mn and the formation of a gel with BTC have little effect on the crystalline structure of the gel (Fig. S4, ESI†). It also indirectly proves the existence of crystal nuclei in the gel.32 Combined with TEM and PXRD, it is further proved that Ni, Mn and BTC have synergistic and competitive coordination effects.
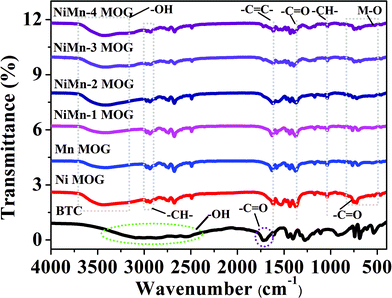
Fig. 3 shows the FTIR spectra of BTC, single MOG and different ratios of bimetallic MOG. Among them, the four stretching vibration peaks of BTC in the range of 2250–2500 cm−1 are attributed to –OH stretching. It is worth noting that after BTC forms a gel with central metal ions (Ni2+ and Mn2+), a broad stretching vibration peak appears around 3400 cm−1, which is attributed to the coordination of BTC and central metal ions leading to the stretching of –OH. The vibration peak moves in the direction of the long wave. In view of the possibility of uncoordinated –COOH or adsorbed bound water in the gel, 2931 cm−1 and 2919 cm−1 are assigned as the C–H stretching vibration and bending vibration, respectively. At 1624 cm−1 and 1038 cm−1 are the stretching vibration peaks of the –C![[double bond, length as m-dash]](https://www.rsc.org/images/entities/char_e001.gif) C– double bond and the C–H out of plane bending vibration peaks on the aromatic ring. In addition, after BTC coordinated with the metal to form a gel, the –C
C– double bond and the C–H out of plane bending vibration peaks on the aromatic ring. In addition, after BTC coordinated with the metal to form a gel, the –C![[double bond, length as m-dash]](https://www.rsc.org/images/entities/char_e001.gif) O stretching vibration peak around 1720 cm−1 was significantly weakened and moved to 1726 cm−1.33 After the gel is formed, obvious in-plane bending vibrations of –C
O stretching vibration peak around 1720 cm−1 was significantly weakened and moved to 1726 cm−1.33 After the gel is formed, obvious in-plane bending vibrations of –C![[double bond, length as m-dash]](https://www.rsc.org/images/entities/char_e001.gif) O and MO (M = Ni, Mn, and NiMn) coordination bonds appear in the range of 510–752 cm−1, indicating the existence of effective metal–organic bonding between the metal and the ligand.
O and MO (M = Ni, Mn, and NiMn) coordination bonds appear in the range of 510–752 cm−1, indicating the existence of effective metal–organic bonding between the metal and the ligand.
The X-ray photoelectron spectroscopy (XPS) was performed to reveal the surface elemental composition and chemical properties of the prepared NiMn-3 MOG sample. XPS analysis was directed to reveal the surface elemental composition and chemical properties of the prepared NiMn-3 MOG sample. The XPS survey spectrum of NiMn-3 MOG verified the presence of Ni, Mn, C, O and N in the as-prepared products (Fig. 4). The peaks at 857.8, 644.8, 529.1, 398.4 and 286.4 eV represented the Ni 2p, Mn 2p, O 1s, N 1s and C 1s spectra, respectively (Fig. 4(a)). The Mn 2p spectrum is shown in Fig. 4(b) in which the peaks located at 653.6 eV and 641.2 eV correspond to the Mn 2p1/2 and Mn 2p3/2 levels. Moreover, the weak peaks at 658.6 eV and 646.4 eV belong to the satellite peaks (identified as Sat), which indicates that the surface of the sample mainly exists in the form of Mn2+. Meanwhile, the peaks at around 856.2 eV (2p3/2) and 873.9 eV (2p1/2) with two Sat peaks at 861.2 eV and 881.8 eV in the Ni 2p spectrum (Fig. 4(c)) suggest the presence of Ni2+.34 Three peaks centered at 531.2, 532.5, and 533.7 eV in the O 1s region (Fig. 4(d)) are represented as the Ni (Mn)–O bonds, O![[double bond, length as m-dash]](https://www.rsc.org/images/entities/char_e001.gif) C–O groups of the tris-benzoic acid linkers and surface absorbed water, respectively. Fig. 4(e) shows the C 1s spectrum of the NiMn-3 MOG; two peaks appearing at 284.8 and 285.9 eV are ascribed to the benzoic rings of tris-benzoic acid ligand and the O
C–O groups of the tris-benzoic acid linkers and surface absorbed water, respectively. Fig. 4(e) shows the C 1s spectrum of the NiMn-3 MOG; two peaks appearing at 284.8 and 285.9 eV are ascribed to the benzoic rings of tris-benzoic acid ligand and the O![[double bond, length as m-dash]](https://www.rsc.org/images/entities/char_e001.gif) C–O groups,35 respectively, and the peak at 296.5 eV can also be assigned to the p–p* conjugative effect of the tris-benzoic acid. However, the N 1s (Fig. 4(f)) signal in NiMn-3 MOG is related to the adsorbed C–N from the tris-triethylamine ligand.
C–O groups,35 respectively, and the peak at 296.5 eV can also be assigned to the p–p* conjugative effect of the tris-benzoic acid. However, the N 1s (Fig. 4(f)) signal in NiMn-3 MOG is related to the adsorbed C–N from the tris-triethylamine ligand.
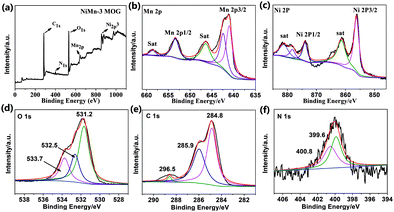 | ||
| Fig. 4 (a) Full-scale XPS spectrum and high-resolution XPS spectra of (b) Mn 2p, (c) Ni 2p, (d) O 1s, (e) Ni 2p and (f) N 1s of NiMn-3 MOG composite. | ||
Nitrogen adsorption measurements were carried out to study the specific surface area and porosity of the prepared NiMn-3 MOG. For NiMn-3 MOG, under the relative pressure of P/P0 = 0–1, it is clearly observed that there is a typical H3 type magnetic hysteresis between adsorption and desorption branches (Fig. 5(a)). Fig. 5(b) shows that the pore size distribution of NiMn-3 MOG (20.37 m2 g−1) is basically concentrated in the range of 2–50 nm, and the average pore size of the sample is 13.09 nm, so the prepared NiMn-3 MOG samples are mesoporous. The curve of ring-type III further indicates the presence of a certain mesoporous and macroporous structure.
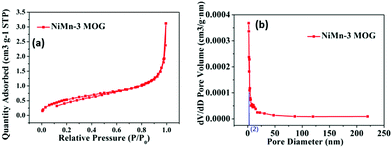 | ||
| Fig. 5 (a) N2 adsorption–desorption isotherms and (b) pore size distribution curves of the NiMn-3 MOG. | ||
Electrochemical performance of NiMn MOG-based electrode
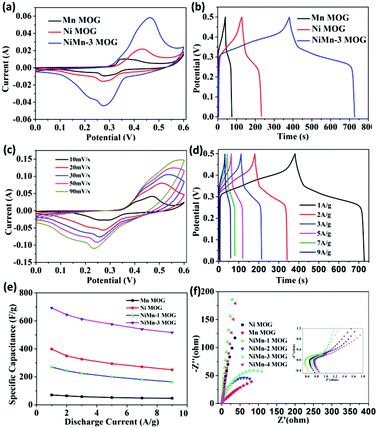
To investigate the electrochemical performance of the Ni–Mn MOG composite, CV tests were performed for NiMn-4 MOG, NiMn-3 MOG, NiMn-2 MOG, NiMn-1 MOG, Ni MOG and Mn MOG samples at the scan rate of 10 mV s−1 in 6 M KOH. The CV curves of these samples are shown in Fig. 6(a) and Fig. S5 (ESI†). The potential of the oxidation peak of each CV curve relative to SCE is close to 0.456 V vs., and the potential of the reduction peak relative to SCE is 0.267 V vs. which are related to the combination of metal ions with the carboxyl group in the ligand, and exposed metal sites in the aerogel.25 Compared with NiMn-4 MOG, NiMn-2 MOG, NiMn-1 MOG, Ni MOG and Mn MOG samples, the CV curve of NiMn-3 MOG is larger, which reveals a higher specific capacitance. Fig. 6(b) and Fig. S6 (ESI†) present the GCD curves of samples at a current density of 1 A g−1. From the GCD data, the calculated specific capacitances of NiMn-1 MOG, NiMn-2 MOG, NiMn-3 MOG, Ni MOG and Mn MOG are 270 F g−1, 464.4 F g−1, 692.2 F g−1, 398.6 F g−1, 207.1 F g−1 and 69.6 F g−1 at 1 A g−1 by using formula (1). The highest specific capacitance of NiMn-3 MOG was attributed to the laminated nanosheets, exposed metal sites and the high specific surface formed by aerogel, supplying adequate electroactive sites for the electrochemical reaction and a rapid channel for electrolyte diffusion.36Fig. 6(c) shows the CV test at various scan rates to estimate the rate capability of the NiMn-3 MOG composite. As the scan rate and current density increase, the anode and cathode peaks move more towards the anode and cathode positions. This is due to the polarization effect of fast and ohmic resistance, which undergoes a rapid and reversible redox reaction at the electrode/electrolyte interface.37 In addition, as the scan rate increases from 10 mV s−1 to 90 mV s−1, a pair of redox peaks are definitely displayed in the CV curve, indicating the existence of a reversible Faraday reaction and pseudo-capacitance behavior. With the increase in the scan rate, the peak position shifts, while the shape of the CV curve remains basically unchanged, revealing that NiMn-3 MOG possesses a good rate performance and electrochemical stability. As we all know, the charge storage kinetics can be determined from the dependence of the current (i) on the scan rate (v): i = avb, where the b values of 0.5 and 1 delegate the diffusion and capacitive processes, respectively.38,39 The electrode of NiMn-3 MOG displays b values of anodic and cathodic peaks of roughly 0.702 and 0.689, indicating that NiMn-3 MOG has pseudo-capacitance properties (Fig. S7, ESI†). The constant current charge/discharge curve of NiMn-3 MOG aerogel is shown in Fig. 6(d). The NiMn-3 MOG composite exhibits specific capacitance values of 692.2 F g−1, 644 F g−1, 612.6 F g−1, 576 F g−1, 540.4 F g−1 and 516.6 F g−1 at current densities of 1 A g−1, 2 A g−1, 3 A g−1, 5 A g−1, 7 A g−1 and 9 A g−1, respectively. The specific capacitance reaches the highest value of 692.2 F g−1 at a current density of 1 A g−1, which is quite or even higher than the previously reported supercapacitors of aerogel materials. This is may be ascribed to electrolyte ions that could permeate into the internal composition of the electrode at a lower current density, while at a higher current density, the insufficient internal resistance and dynamics lead to the lower utilization of the active substance. Finally, the specific capacitance of the NiMn-3 MOG composite gradually decreases with increasing current density.The electrochemical performance of Ni–Mn MOG composite was also probed via the GCD test at different current densities for comparison. The capacitance of Ni MOG, Mn MOG, NiMn-1 MOG, NiMn-2 MOG, NiMn-3 MOG, and NiMn-4 MOG at the current densities from 1 A g−1 to 9 A g−1 is shown in Fig. 6(e) and Fig. S8 (ESI†). Even at a high current density of 9 A g−1, the specific capacitance of NiMn-3 MOG can still be maintained at 516.6 F g−1, which is 74.6% of the maximum specific capacitance while the current density is 1 A g−1. Based on the specific capacitance at the current density of 1 A g−1, the Cm values at 9 A g−1 for Ni MOG, Mn MOG, NiMn-1 MOG, NiMn-2 MOG, NiMn-3 MOG, and NiMn-4 MOG samples are 62.7%, 66.8%, 60.66%, 72.4%, 74.6% and 67.2%, respectively. Furthermore, the conductivity of NiMn-3 MOG was measured using a Four point probe resistivity tester (SZT-2A) and the material exhibits the highest conductivity (1.12 S m−1). This may be attributed to the structure of the nanosheets, which is more conducive to ion transport and charge transfer (Table S1, ESI†). The experimental results clearly testify that NiMn-3 MOG has maximum rate capability and conductivity, which can be attributed to the structure of stacked nanosheets and coordination of bimetals and changing the molar ratio of Ni–Mn. The great compatibility and flexibility of the MOG improve the charge transfer efficiency and accelerate the dynamics of the redox reaction. Electrochemical impedance spectroscopy (EIS) was tested to further study the electrochemical behavior of Ni MOG, Mn MOG, NiMn-1 MOG, NiMn-2 MOG, NiMn-3 MOG, and NiMn-4 MOG electrodes and the mechanism of kinetic electroactive substances. In this research, for EIS measurement, the frequency range is from 0.01 Hz to 10![[thin space (1/6-em)]](https://www.rsc.org/images/entities/char_2009.gif) 000 Hz (Fig. 6(f)). The obtained samples all show a small equivalent series resistance caused by the lower resistance, and NiMn-3 MOG displays the smallest bending radius at high frequencies, indicating a smaller inherent resistance and excellent conductivity. Moreover, at low frequencies, the slope of NiMn-3 MOG is closer to the −Z′′ (ohm) axis, revealing the lower diffusion resistance and better reversibility for charge transfer.40
000 Hz (Fig. 6(f)). The obtained samples all show a small equivalent series resistance caused by the lower resistance, and NiMn-3 MOG displays the smallest bending radius at high frequencies, indicating a smaller inherent resistance and excellent conductivity. Moreover, at low frequencies, the slope of NiMn-3 MOG is closer to the −Z′′ (ohm) axis, revealing the lower diffusion resistance and better reversibility for charge transfer.40
Electrochemical performance of asymmetric supercapacitors
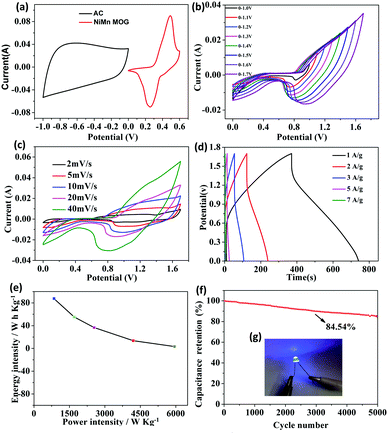
To further evaluate the practical application of NiMn-3 MOG, an asymmetric supercapacitor was assembled with NiMn-3 MOG as the positive electrode and AC as the negative electrode to test the electrochemical performance in 6 M KOH. Fig. S9 (ESI†) shows the electrochemical characteristics of the AC electrodes in a three-electrode device. The CV curve of the AC electrode is almost rectangular with a potential window from −1.0 to 0 V at different scan rates, presenting the characteristics of an electric double layer capacitor. To find the stable voltage of the NiMn MOG-3//AC device, CV curves of Fig. 7(a) measured in the three-electrode mode are combined together. It is expected that the NiMn-3 MOG//AC device reaches an operating voltage, which is as high as 1.7 V in a three-electrode device. Fig. 7(b) further shows that the potential window is flexible with the maximum operating voltage window reaching 1.7 V. Fig. 7(c) shows the CV curve of NiMn-3 MOG//AC at scan rates of 10, 20, 30, 50, 70 and 100 mV s−1. Even at a high scan rate of 100 mV s−1, the shape of the CV curve remains regular and unchanged, indicating that the device has low internal resistance and fast redox.41 The symmetric GCD curves (Fig. 7(d)) under different current densities present excellent electrochemical reversibility. The specific capacitances are 218.3, 137.8, 91.2, 34 and 8.23 F g−1 at the current densities of 1, 2, 3, 5, and 7 A g−1. In addition, after 5000 charge and discharge cycles of the ASC device, the capacitance retention rate is 84.6% (current density of 6 A g−1) as shown in Fig. 7(e). Energy density and power density are important evaluation factors for the energy storage performance of supercapacitors.42Fig. 7(f) shows the ragone diagram calculated by using the NiMn-3 MOG//AC device. Energy density and power density are calculated using formulas (3) and (4), respectively. The NiMn-3 MOG//AC equipment exhibits excellent performance, with a power density of 849 W kg−1 (current density of 1 A g−1), and the maximum energy density reaches 87.5 W h−1. These values are comparable or better than those recently reported by other ASC devices (Fig. S10, ESI†) such as LaMnO3@NiCo2O4/Ni//AC43 (36.6 W h kg−1 at 800 W kg−1), MnNiDH//AC44 (58.53 W h kg−1 at 0.8 kW kg−1) and NiCoMn LDH/rGO//AC45 (92.8 W h kg−1 at 0.46 kW kg−1) and Mn0.1–Ni–MOF//AC46 (39.6 W h kg−1 at 143.8 W kg−1). Furthermore, after the assembled ASC device is charged/discharged 5000 times, the capacitance still remains at 84.6% and exhibits an excellent cycle life (Fig. 7(f)). In order to verify the practical application of ASC devices, the LED lights can be successfully lit (Fig. 7(g)) by connecting three ASC devices in series, which proves that the NiMn-3 MOG materials have broad prospects in energy storage devices.Conclusions
In summary, conductive NiMn MOG materials were successfully synthesized via the self-assembly method of central metal ion and flexible organic ligand at room temperature. The laminated nanosheets obtained by adjusting the molar ratio of Ni2+ and Mn2+ can improve electrochemical activity and ion diffusion which endowed the high specific capacitance, great conductivity, excellent cycle stability and rate performance. In addition, the assembled device, NiMn MOG//AC, exhibits a higher energy density and preserves great cycling stability. Combining simple, green experimental synthesis and high energy density of the material, NiMn-3 MOG composites have the potential to become a material for practical energy storage devices.Conflicts of interest
There are no conflicts to declare.Acknowledgements
This work was supported by the National Natural Science Foundation of China (51771001); Independent Research and Development Project of Anhui Province (201904a07020001); and the Open Project of Key Laboratory of Structure and Functional Regulation of Hybrid Materials (Anhui University), Ministry of Education.Notes and references
- R. Reece, C. Lekakou and P. A. Smith, ACS Appl. Mater. Interfaces, 2020, 12, 25683–25692 Search PubMed.
- P. Luan, N. Zhang, W. Zhou, Z. Niu, Q. Zhang, L. Cai, X. Zhang, F. Yang, Q. Fan, W. Zhou, Z. Xiao, X. Gu, H. Chen, K. Li, S. Xiao, Y. Wang, H. Liu and S. Xie, Adv. Funct. Mater., 2016, 26, 8178–8184 Search PubMed.
- I. Marriam, Y. Wang and M. Tebyetekerwa, Energy Storage Mater., 2020, 33, 336–359 Search PubMed.
- S. Liu and S. C. Jun, J. Power Sources, 2017, 342, 629–637 Search PubMed.
- A. Capasso, J. Rodrigues, M. Moschetta, F. Buonocore, G. Faggio, G. Messina, M. J. Kim, J. Kwon, E. Placidi, F. Benfenati, M. Bramini, G. H. Lee and N. Lisi, Adv. Funct. Mater., 2020, 31, 2005300 Search PubMed.
- Z. R. Ismagilov, A. E. Shalagina, O. Y. Podyacheva, A. V. Ischenko, L. S. Kibis, A. I. Boronin, Y. A. Chesalov, D. I. Kochubey, A. I. Romanenko, O. B. Anikeeva, T. I. Buryakov and E. N. Tkachev, Carbon, 2009, 47, 1922–1929 Search PubMed.
- S. E. Yoon, J. Park, J. E. Kwon, S. Y. Lee, J. M. Han, C. Y. Go, S. Choi, K. C. Kim, H. Seo, J. H. Kim and B. G. Kim, Adv. Mater., 2020, 32, 2005129 Search PubMed.
- C. Chen, J. Song, J. Cheng, Z. Pang, W. Gan, G. Chen, Y. Kuang, H. Huang, U. Ray, T. Li and L. Hu, ACS Nano, 2020, 14, 16723–16734 Search PubMed.
- Y. Liu, Y. Wang, Y. Chen, C. Wang and L. Guo, Appl. Surf. Sci., 2020, 507, 145089 Search PubMed.
- N. Raza, T. Kumar, V. Singh and K. H. Kim, Coord. Chem. Rev., 2021, 430, 213660 Search PubMed.
- M. Qiu, H. Wu, L. Cao, B. B. Shi, X. Y. He, H. B. Geng, X. L. Mao, P. F. Yang and Z. Y. Jiang, ACS Appl. Mater. Interfaces, 2020, 12, 19788–19796 Search PubMed.
- J. M. Taylor, K. W. Dawson and G. K. Shimizu, J. Am. Chem. Soc., 2013, 135, 1193–1196 Search PubMed.
- P. Sutar and T. K. Maji, Chem. Commun., 2016, 52, 8055–8074 Search PubMed.
- Y. Li, L. He, C. Huang and Y. Li, Biosens. Bioelectron., 2019, 134, 29–35 Search PubMed.
- X. Zheng, W. He, S. Rehman and P. Zhang, ACS Appl. Mater. Interfaces, 2020, 12, 41359–41367 Search PubMed.
- R. Van Lommel, J. Zhao, W. M. De Borggraeve, F. De Proft and M. Alonso, Chem. Sci., 2020, 11, 4226–4238 Search PubMed.
- D. Vallejo-Sánchez, P. Amo-Ochoa, G. Beobide, O. Castillo, M. Fröba, F. Hoffmann, A. Luque, P. Ocón and S. Pérez-Yáñez, Adv. Funct. Mater., 2017, 27, 1605448 Search PubMed.
- A. Qian, K. Zhuo, P. Karthick Kannan and C. H. Chung, ACS Appl. Mater. Interfaces, 2016, 8, 34455–34463 Search PubMed.
- C. K. Karan, S. Mallick, C. R. Raj and M. Bhattacharjee, Chemistry, 2019, 25, 14775–14779 Search PubMed.
- P. Xue, R. Lu, P. Zhang, J. Jia, Q. Xu, T. Zhang, M. Takafuji and H. Ihara, Langmuir, 2013, 29, 417–425 Search PubMed.
- S. R. Nam, H. Y. Lee and J. I. Hong, Tetrahedron, 2008, 64, 10531–10537 Search PubMed.
- R. K. Das, S. Banerjee, G. Raffy, A. D. Guerzo, J. P. Desvergne and U. Maitra, J. Mater. Chem., 2010, 20, 7227 Search PubMed.
- A. Mahmood, W. Xia, N. Mahmood, Q. Wang and R. Zou, Sci. Rep., 2015, 5, 10556 Search PubMed.
- Z. Zhuang, Z. Mai, T. Wang and D. Liu, Coord. Chem. Rev., 2020, 421, 213461 Search PubMed.
- N. Alam and D. Sarma, ACS Omega, 2020, 5, 17356–17366 Search PubMed.
- L. Cao, H. Wu, P. Yang, X. He, J. Li, Y. Li, M. Xu, M. Qiu and Z. Jiang, Adv. Funct. Mater., 2018, 28, 1804944 Search PubMed.
- L. Ma, G. Sun, J. Ran, S. Lv, X. Shen and H. Tong, ACS Appl. Mater. Interfaces, 2018, 10, 22278–22290 Search PubMed.
- S. Liu, Q. Zhao, M. Tong, X. Zhu, G. Wang, W. Cai, H. Zhang and H. Zhao, J. Mater. Chem. A, 2016, 4, 17080–17086 Search PubMed.
- C. Zhao, Y. Xu, F. Xiao, J. Ma, Y. Zou and W. Tang, Chem. Eng. J., 2021, 406, 126852 Search PubMed.
- C. Yin, Z. Bao, H. Tan, H. Zhou and J. Li, Chem. Eng. J., 2019, 372, 408–419 Search PubMed.
- T. Nakamuro, M. Sakakibara, H. Nada, K. Harano and E. Nakamura, J. Am. Chem. Soc., 2021, 143, 1763–1767 Search PubMed.
- T. Yuan, Y. Xu, J. Fei, H. Xue, X. Li, C. Wang, G. Fytas and J. Li, Angew. Chem., Int. Ed., 2019, 58, 11072–11077 Search PubMed.
- W. S. Liu, Y. Yang, Q. K. Zhong, Z. P. Xu, J. Z. Zhang, B. B. Yao, X. Lian and H. L. Niu, Mater. Chem. Front., 2021, 5, 1932–1941 Search PubMed.
- L. Huang, B. Liu, H. Hou, L. Wu, X. Zhu, J. Hu and J. Yang, J. Alloys Compd., 2018, 730, 71–80 Search PubMed.
- M. Yu, R. Liu, J. Liu, S. Li and Y. Ma, Small, 2017, 13, 1702616 Search PubMed.
- H. Yang, C. Zhang, Q. Meng, B. Cao and G. Tian, J. Power Sources, 2019, 431, 114–124 Search PubMed.
- Y. Guo, L. Li, L. Song, M. Wu, Y. Gao, J. Chen, C. Mao, J. Song and H. Niu, J. Mater. Chem. A, 2019, 7, 12661–12668 Search PubMed.
- F. Yang, K. Zhang, W. Li and K. Xu, J. Colloid Interface Sci., 2019, 556, 386–391 Search PubMed.
- X. Xiao, H. Song, S. Lin, Y. Zhou, X. Zhan, Z. Hu, Q. Zhang, J. Sun, B. Yang, T. Li, L. Jiao, J. Zhou, J. Tang and Y. Gogotsi, Nat. Commun., 2016, 7, 11296 Search PubMed.
- J.-G. Wang, H. Liu, X. Zhang, M. Shao and B. Wei, J. Mater. Chem. A, 2018, 6, 17653–17661 Search PubMed.
- X. Meng, L. Lu and C. Sun, ACS Appl. Mater. Interfaces, 2018, 10, 16474–16481 Search PubMed.
- Z. Jian, V. Raju, Z. Li, Z. Xing, Y.-S. Hu and X. Ji, Adv. Funct. Mater., 2015, 25, 5778–5785 Search PubMed.
- H. Tian, X. Lang, H. Nan, P. An, W. Zhang, X. Hu and J. Zhang, Electrochim. Acta, 2019, 318, 651–659 Search PubMed.
- H. Liu, H. Guo, W. Yao, L. Zhang, M. Wang, T. Fan, W. Yang and W. Yang, Colloids Surf., A, 2020, 601, 125011 Search PubMed.
- M. Li, J. P. Cheng, F. Liu and X. B. Zhang, Chem. Phys. Lett., 2015, 640, 5–10 Search PubMed.
- H. Chu, F. Zhang, L. Pei, Z. Cui, J. Shen and M. Ye, J. Alloys Compd., 2018, 767, 583–591 Search PubMed.
Footnotes |
| † Electronic supplementary information (ESI) available. See DOI: 10.1039/d1ma00390a |
| ‡ Qiankun Zhong and Wensheng Liu completed the same workload. |
| This journal is © The Royal Society of Chemistry 2021 |

