 Open Access Article
Creative Commons Attribution 3.0 Unported Licence
The development of poly(ethylene oxide) reinforced with a nanocellulose-based nanocomposite polymer electrolyte in dye-sensitized solar cells
Mohd Saiful Asmal
Rani
 *a,
Nur Athirah
Abdullah
b,
Muhammad Hanif
Sainorudin
b,
Masita
Mohammad
*b and
Salmiah
Ibrahim
c
aSchool of Materials and Mineral Resources Engineering, Engineering Campus, Universiti Sains Malaysia, Nibong Tebal 14300, Penang, Malaysia. E-mail: iker.asmal55@gmail.com
bSolar Energy Research Institute (SERI), Universiti Kebangsaan Malaysia, 43600 Bangi, Selangor, Malaysia. E-mail: masita@ukm.edu.my
cCentre for Foundation Studies in Science, University of Malaya, Kuala Lumpur 50603, Malaysia
First published on 27th July 2021
Abstract
Here, we describe a nanocomposite polymer electrolyte prepared using a solution casting technique. Polyethylene oxide (PEO), lithium iodide (LI), and nanocellulose (NCC) extracted from palm oil empty fruit bunch (EFB) were used to prepare electrolyte films. The structural and electrical behaviors of the prepared films were studied using Fourier-transform infrared spectroscopy, X-ray diffraction, and electrochemical impedance spectroscopy. At room temperature, the device impregnated with 0.6 wt% NCC showed the optimum ionic conductivity of (1.03 ± 0.5) × 10−3 S cm−1. Complexation between the PEO polymer, lithium iodide, and NCC was confirmed from infrared spectroscopy data and the XRD patterns of the nanocomposite polymer electrolytes. A photovoltaic response efficiency of 2.12% was achieved using the highest-conducting film in a dye-sensitized solar cell (DSSC), and this showed the film to be suitable for DSSC applications.
1. Introduction
Solid polymer electrolytes (SPEs) are prepared by complexing polymers with metal salts. SPEs have received considerable attention due to their promising potential applications, not only in all-solid-state rechargeable batteries, but also in other electrochemical devices such as supercapacitors, batteries, electrochromic windows and sensors.1–5 SPEs have many advantages such as relatively high mechanical stability and good electrode–electrolyte contacts as well as the ease of fabricating devices made with them and their leakage-free character.6–9 Despite their many advantages, SPEs still exhibit low conductivity at room temperature, and the working efficiency for their application in electrochemical devices is still not satisfactory.10–14Hence, to improve the conductivity as well as the other properties of SPEs, modifying the polymer host for polymer electrolytes may be considered because the polymer host plays an important role for the ion transport mechanism in polymer electrolytes.15,16 Incorporating nanocellulose (NCC) into polymer matrices as a means of increasing mechanical stability levels of the SPEs has become a popular research topic. In addition, impregnating NCC into SPEs also improves the anode-polymer interfacial stability as well as the electrochemical and transport properties of polymer electrolytes.17–19 The presence of NCC can also enhance the amorphicity of the sample, create favorable pathways for ionic conduction, and immobilize the anions. NCC displays many advantages: in addition to its low cost and high abundance and the ability to produce it from naturally occurring sources, it also exhibits good mechanical properties, low density, biodegradability and relatively good surface reactivity, and hence provides better properties for its role as a reinforcing phase in nanocomposites than do micro/macro cellulose composites.20,21
Dye-sensitized solar cells (DSSCs), have attracted considerable attention since the first report written about them by O’ Regan and Grätzel in 1991 due to their simple preparation procedure, low cost, environmental compatibility and good performance under diffuse light conditions.22 Bella and co-researchers developed a green, efficient and stable DSSC using inexpensive elements, achieving a quite impressive efficiency for a water-based solar cell.23 On the other hand, a novel polymer-based platform was used to fabricate an innovative self-powered device with two electrodes that integrates energy harvesting and storage sections. A procedure involving oxygen-inhibited UV-light-promoted crosslinking has been used to produce a multifunctional polymeric layer composed of two poly(ethylene glycol)-based sections separated by a perfluorinated barrier, and a remarkable 3.72% efficiency was obtained.24 In DSSC applications, the SPEs must contain a redox ion couple (iodide/triiodide ions) to be used for regeneration of the oxidized dye.25,26 However, the function of the cation in the electrolyte system cannot be ignored because it also plays an important role for the process of converting light to electricity in the DSSC.27,28 The diffusion of electrons in the conduction band of TiO2 is considered to occur via an ambipolar diffusion mechanism.29–31 In these studies, the lithium cation (Li+) was used due to the above considerations and due to its small cationic radius allowing it to easily penetrate into the dye-coated TiO2 film and form ambipolar Li+–e− pairs with the electrons in the conduction band of TiO2. This feature has been indicated to increase the transport speed of electrons in the TiO2 network and enhance current density (JSC) levels of the DSSCs.32,33
In our current work, we set out to extract NCC from palm oil empty fruit bunch (OPEFB). Then, the derived NCC was incorporated with lithium iodide (LI) salt and the polymer host poly(ethylene oxide) (PEO) to produce nanocomposite polymer electrolytes (NPEs). The NPEs were investigated using FTIR spectroscopy, XRD and impedance analysis to study the structural and electrical properties of the corresponding film. The potential practicality of the polymer electrolyte in DSSCs was also investigated.
2. Experimental
2.1. Materials
The starting materials, namely samples of empty fruit bunch from palm oil, were collected from Sabah Softwood Sdn. Bhd., Tawau, Malaysia. Sodium hydroxide (99%), sulphuric acid (98%), sodium chlorite (80%), isopropanol, and glacial acetic acid (99.5%) were purchased from SYSTERM-chemAR (Malaysia). Poly(ethylene oxide) (PEO, Mw = 600![[thin space (1/6-em)]](https://www.rsc.org/images/entities/char_2009.gif) 000 g mol−1, Sigma Aldrich), lithium iodide crystalline powder (99.9% trace metals basis, LI, Mw = 133.85 g mol−1, Sigma Aldrich), methanol (Mw = 32.04 g mol−1, Systerm), and iodine (Merck) were the chemicals used in this study. Ruthenium dye (N-719), platinum paste under the commercial name Platisol T, fluorine-doped tin oxide (FTO) with an impedance of ∼15 Ω cm−2 (Aubonne, Switzerland, Solaronix), and titanium dioxide (TiO2) paste (DSL 18NR-AO) (New South Wales, Australia, DyeSol) were used for producing the DSSC components. All materials were used as received without further purification.
000 g mol−1, Sigma Aldrich), lithium iodide crystalline powder (99.9% trace metals basis, LI, Mw = 133.85 g mol−1, Sigma Aldrich), methanol (Mw = 32.04 g mol−1, Systerm), and iodine (Merck) were the chemicals used in this study. Ruthenium dye (N-719), platinum paste under the commercial name Platisol T, fluorine-doped tin oxide (FTO) with an impedance of ∼15 Ω cm−2 (Aubonne, Switzerland, Solaronix), and titanium dioxide (TiO2) paste (DSL 18NR-AO) (New South Wales, Australia, DyeSol) were used for producing the DSSC components. All materials were used as received without further purification.
2.2. Preparation of NCC and NPE
![[thin space (1/6-em)]](https://www.rsc.org/images/entities/char_2009.gif) :
:![[thin space (1/6-em)]](https://www.rsc.org/images/entities/char_2009.gif) 1, v/v) in a Soxhlet apparatus for 7 h. The dewaxed fibers were sequentially delignified with acidified sodium chlorite (acetic acid was used to achieve a pH of 4) at 70 °C for 1 h and this process was repeated until the sample became white. Then, it was filtered to remove water-soluble components and washed until the pH was neutral. The resulting residue was then treated with sulphuric acid (64 wt%) in a reaction flask. Samples of the solution from the hydrolysis process, each with a volume of 50 mL, were added into six centrifuge tubes, respectively. Next, the centrifuge tubes were placed in a refrigerated benchtop centrifuge (Sartorius Sigma 3-18 K), which was then operated at a speed of 10
1, v/v) in a Soxhlet apparatus for 7 h. The dewaxed fibers were sequentially delignified with acidified sodium chlorite (acetic acid was used to achieve a pH of 4) at 70 °C for 1 h and this process was repeated until the sample became white. Then, it was filtered to remove water-soluble components and washed until the pH was neutral. The resulting residue was then treated with sulphuric acid (64 wt%) in a reaction flask. Samples of the solution from the hydrolysis process, each with a volume of 50 mL, were added into six centrifuge tubes, respectively. Next, the centrifuge tubes were placed in a refrigerated benchtop centrifuge (Sartorius Sigma 3-18 K), which was then operated at a speed of 10![[thin space (1/6-em)]](https://www.rsc.org/images/entities/char_2009.gif) 000 pm for 15 minutes at a temperature of 4 °C. After 15 minutes, the samples were removed from the centrifuge. Next, a volume of 50 mL of distilled water was added into each centrifuge tube, and they were placed in the centrifuge. The process was repeated five times. After that, the collected solid residues were treated with a solution of 1% NaOH until a neutral pH was achieved. The resulting material was subjected to freeze drying, and in this way the NCC was obtained.
000 pm for 15 minutes at a temperature of 4 °C. After 15 minutes, the samples were removed from the centrifuge. Next, a volume of 50 mL of distilled water was added into each centrifuge tube, and they were placed in the centrifuge. The process was repeated five times. After that, the collected solid residues were treated with a solution of 1% NaOH until a neutral pH was achieved. The resulting material was subjected to freeze drying, and in this way the NCC was obtained.
2.3. Characterization techniques
To study the interaction between PEO, LI and NCC, FTIR analysis was carried out using a PerkinElmer Frontier FTIR spectrophotometer in the range 4000 to 550 cm−1 with a scanning resolution of 2 cm−1. X-Ray diffraction (XRD) was performed to analyze the crystallinities of the samples. Impedance measurements were taken using a SOLARTRON 1260 impedance analyzer in order to study the ionic conductivities of the samples. The samples were sandwiched between stainless steel electrodes, and measurements were taken over the frequency range 10 Hz to 5 MHz with a 100 mV dc amplitude. The bulk resistance (Rb) value was obtained from the Nyquist plot. The ionic conductivity value was calculated using the equation | (1) |
2.4. DSSC fabrication and current density–voltage measurements
For DSSC fabrication, commercial TiO2 paste was spread on a photoanode glass by using the doctor-blade technique and a counter-electrode glass was platinized using the brush-painting technique. Both the photo-anode and counter electrode were annealed at 450 °C for 30 minutes in order to improve the interconnection among particles and activate the quasi-transparent platinum layer, respectively. The TiO2 photoanode was then immersed in the dye solution (N719, 0.3 mM) for 24 h at room temperature. The PEO + LI + NCC solution was combined with iodine (10![[thin space (1/6-em)]](https://www.rsc.org/images/entities/char_2009.gif) :
:![[thin space (1/6-em)]](https://www.rsc.org/images/entities/char_2009.gif) 1) and allowed to stand for 24 h, after which it was cast on the TiO2 photoanode. After a few minutes, the counter electrode was placed on top of the dried electrolyte–TiO2 photoanode before being characterized. A Wonatech Zive MP2 multichannel electrochemical analyzer with a xenon light source and under AM 1.5 illumination (100 mW cm−2) controlled using a radiometer was deployed to record the current density–voltage (J–V) data of the FTO/TiO2-dye/PEO–LI–NCC/I2/Pt DSSC. The illumination cell area was set to 1 cm2. Photoelectric performance measures such as fill factor (FF) and light-to-electricity energy conversion efficiency (η) were calculated using eqn (2) and (3), respectively.
1) and allowed to stand for 24 h, after which it was cast on the TiO2 photoanode. After a few minutes, the counter electrode was placed on top of the dried electrolyte–TiO2 photoanode before being characterized. A Wonatech Zive MP2 multichannel electrochemical analyzer with a xenon light source and under AM 1.5 illumination (100 mW cm−2) controlled using a radiometer was deployed to record the current density–voltage (J–V) data of the FTO/TiO2-dye/PEO–LI–NCC/I2/Pt DSSC. The illumination cell area was set to 1 cm2. Photoelectric performance measures such as fill factor (FF) and light-to-electricity energy conversion efficiency (η) were calculated using eqn (2) and (3), respectively. | (2) |
 | (3) |
3. Results and discussions
3.1. X-Ray diffraction (XRD)
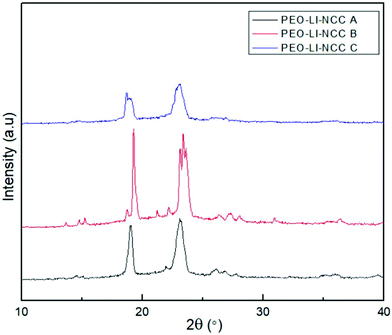
In the XRD profile of each nanocomposite, there were intense well-defined crystalline peaks at 2θ values of about 19° and 23° as illustrated in Fig. 1. These diffraction peaks can be assigned to characteristic (120) and (112/004) reflections of PEO.34 Islam and co-researcher made a similar observation when studying the influence of alkali treatment on the interfacial and physico-mechanical properties of polylactic acid composites reinforced with industrial hemp fibers. The observation was attributed to the presence of a large content of lignin, which negatively influenced the nucleating ability of the raw fibers. In the case of bleached and hydrolyzed nanofiber-based composites, the removal of lignin and hemicellulose obviously promoted trans-crystallization of the polymer chains.353.2. FTIR analysis
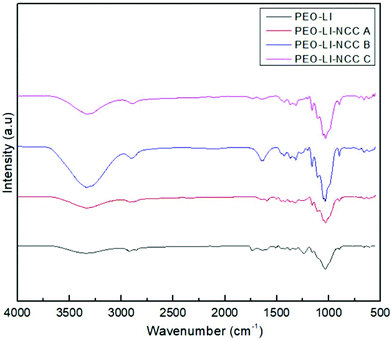
PEO displayed the characteristic FTIR bands at 2984, 1336, 1097, 958 and 840 cm−1 related to CH stretching, CH2 wagging, C–O–C stretching, CH2 rocking and twisting and C–O–C bending, respectively, as illustrated in Fig. 2. The OH stretching absorption was negligible due to the high-molecular-weight PEO used in this study. Similar bands were observed in the spectra of all of the investigated composite samples. Because the content of the NCC was too small compared to that of the high-molecular-weight PEO, there were no clear absorption signals related to the NCC from various treatment stages.3.3. Electrochemical analysis
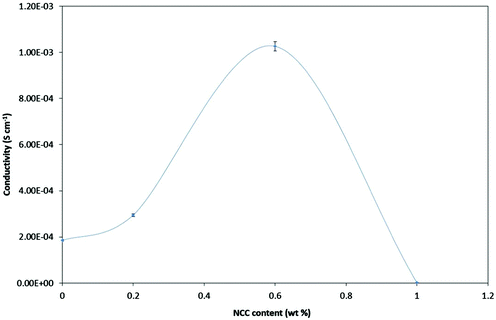
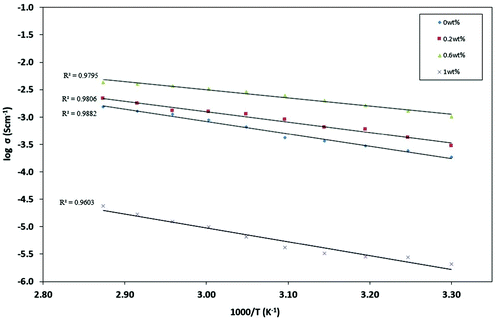
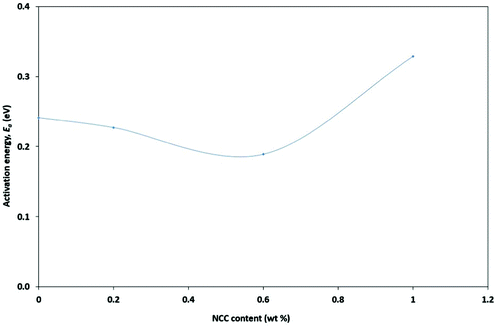
Fig. 3 shows the ionic conductivity levels of NPEs each as a function of NCC concentration at room temperature (303 K). PEO–20 wt% LI showed a low ionic conductivity (σ) of (1.85 ± 0.8) × 10−4 S cm−1 at ambient temperature (303 K). The effects of the NCC content on the ionic conductivity of PEO–LI at four different levels, namely 0, 0.2, 0.6 and 1.0 wt%, were examined. The NCC content dependence of ionic conductivity in the NPEs at room temperature is shown in Fig. 5. The ionic conductivity of the NPE first increased with increasing NCC content – up to a peak conductivity of (1.03 ± 0.5) × 10−3 S cm−1 for 0.6 wt% NCC – and then started to decrease with further addition of NCC. The increase in conductivity can be explained by the NCC particles acting as nucleation centers for the formation of minute crystallites.36 In addition, the NCC particles presumably aided in the formation of the amorphous phase in the polymer electrolyte.37 The conductivity enhancement in this system may have been due to the formation of new kinetic paths at polymer–ceramic boundaries.38 In any case, the decreased Tg presumably resulted in increased segmental movements of the polymer chains as reflected by increased conductivity in the amorphous or relatively poorly ordered regions.39 However, as described above, the conductivity was found to decrease after an optimum concentration of NCC was crossed. As the optimum concentration was attained, and then on further addition of NCC, a continuous non-conductive phase was presumably built up by a large amount of nanofillers as an electrically inert component that would block ion transport, resulting in an increase in total resistance of the composite polymer electrolyte.40,41A study of the temperature dependence of ionic conductivity was performed to investigate the influence of thermal treatment on the NPE.42 Temperature dependence of conductivity for each of several NPEs having different compositions of NCC was studied in the temperature range 303–348 K. Such measurements can be used to analyze the mechanism of ionic conduction of NPEs.43,44 The dependence of ionic conductivity on temperature for each of the NPE films is presented in Fig. 4.
The linearity of the plots of log![[thin space (1/6-em)]](https://www.rsc.org/images/entities/char_2009.gif) σ vs. 1000/T plots suggested an Arrhenius behaviour or thermally assisted behaviour of ionic conductivity, one that can be expressed as
σ vs. 1000/T plots suggested an Arrhenius behaviour or thermally assisted behaviour of ionic conductivity, one that can be expressed as
σ = σ0![[thin space (1/6-em)]](https://www.rsc.org/images/entities/char_2009.gif) exp(−Ea/kT) exp(−Ea/kT) | (4) |
3.4. DSSC performance
In order to assess the performance of the NPE, the sample was fabricated in an FTO/TiO2-dye/PEO–LI–0.6 wt% NCC/I2/Pt DSSC and tested under illumination of light. A photocurrent density–voltage (J–V) curve of the DSSC is shown in Fig. 6. The photovoltaic parameters JSC, VOC, FF and η were obtained from the intersection of current and voltage from the J–V curve for the device under illumination.45 The DSSC showed a photovoltaic response with a JSC of 7.3 mA cm−2, VOC of 0.7 V, FF of 0.44 and η of 2.21%. This efficiency value was higher than the 0.29% and 0.76% values reported by Singh et al. for, respectively, PVA:NH4I/I2 and PVPI:IL-I2 polymer electrolytes in solid forms.46 This result showed that even though I− ions are important for regeneration of oxidized dye in a DSSC system, tLi+ cannot be too low because cations can help the ion easily penetrate into the dye-coated TiO2 film and hence increase the transport speed of electrons in the TiO2 network of the DSSC.47 Thus, 0.6 wt% NCC was concluded to provide promising paths for electrolytes in a DSSC.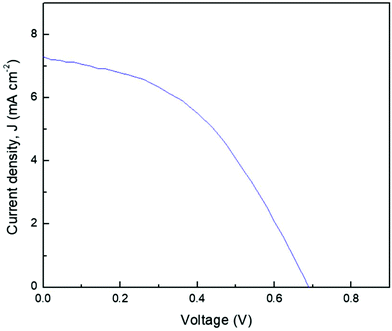 | ||
| Fig. 6 Photocurrent density versus cell potential (J–V) for a DSSC fabricated using PEO–LI–0.6 wt% NCC. | ||
4. Conclusions
Free PEO–LI standing films with various NCC weight ratios were successfully prepared via performing a solution casting technique. Fourier-transform infrared spectroscopy analysis revealed evidence of NCC, lithium, and iodide ion interactions with the host polymer. According to impedance analysis, the ionic conductivity with 0.6 wt% NCC showed the greatest value, (1.03 ± 0.5) × 10−3 S cm−1, which may be related to increased polymer backbone segmental motion. The lowest activation energy was also found for 0.6 wt% NCC. These factors may have contributed to the low energy required to provide conductive conditions and to the low relaxation period, which may be ascribed to an increase in ion mobility in the polymer matrix. The highest efficiency, 2.12%, was achieved by using the DSSC containing 0.6 wt% NCC. As a result, the 0.6 wt% NCC NPE film was concluded to be suitable for DSSCs.Conflicts of interest
There are no conflicts to declare.Acknowledgements
The authors would like to express their gratitude to the Malaysian Ministry of Education for financial support under the Fundamental Research Grant Scheme (FRGS/1/2019/TK10/UKM/02/1) and the Centre of Research and Instrument Management, Universiti Kebangsaan Malaysia (MI-2019-018).References
- B. Scrosati, R. Neat, B. Scrosati and F. M. Gray, Polymer Electrolytes, 1997 Search PubMed.
- F. M. Gray, Solid polymer electrolytes, VCH New Tork, 1991 Search PubMed.
- L. S. Ng and A. A. Mohamad, J. Membr. Sci., 2008, 325, 653–657 CrossRef CAS.
- S. Rudhziah, M. S. A. Rani, A. Ahmad, N. S. Mohamed and H. Kaddami, Ind. Crops Prod., 2015, 72, 133–141 CrossRef CAS.
- M. P. Cipolla, G. L. De Gregorio, R. Grisorio, R. Giannuzzi, G. Gigli, G. P. Suranna and M. Manca, J. Power Sources, 2017, 356, 191–199 CrossRef CAS.
- A. Balducci, S. S. Jeong, G. T. Kim, S. Passerini, M. Winter, M. Schmuck, G. B. Appetecchi, R. Marcilla, D. Mecerreyes, V. Barsukov, V. Khomenko, I. Cantero, I. De Meatza, M. Holzapfel and N. Tran, J. Power Sources, 2011, 196, 9719–9730 CrossRef CAS.
- A. L. Agapov and A. P. Sokolov, Macromolecules, 2011, 44, 4410–4414 CrossRef CAS.
- M. S. A. Rani, N. S. Mohamed and M. I. N. Isa, Int. J. Polym. Anal. Charact., 2015, 20, 491–503 CrossRef CAS.
- M. S. A. Rani, M. H. Sainorudin, N. Asim and M. Mohammad, Int. J. Electrochem. Sci., 2020, 15, 11833–11844 CrossRef CAS.
- D.-W. Kang, D.-W. Kim, S. I. Jo and H.-J. Sohn, J. Power Sources, 2002, 112, 1–7 CrossRef CAS.
- S. Rajendran, M. R. Prabhu and M. U. Rani, Int. J. Electrochem. Sci., 2008, 3, 282–290 CAS.
- M. S. A. Rani, N. H. Hassan, A. Ahmad, H. Kaddami and N. S. Mohamed, Ionics, 2016, 1–10 Search PubMed.
- R. Shanti, F. Bella, Y. Salim, S. Chee, S. Ramesh and K. Ramesh, Mater. Des., 2016, 108, 560–569 CrossRef CAS.
- M. S. A. Rani, N. S. Isa, M. H. Sainorudin, N. A. Abdullah, M. Mohammad, N. Asim, H. Razali and M. A. Ibrahim, Int. J. Electrochem. Sci., 2021, 16, 210354 CrossRef CAS.
- P. Jayathilaka, M. Dissanayake, I. Albinsson and B.-E. Mellander, Solid State Ionics, 2003, 156, 179–195 CrossRef CAS.
- M. S. A. Rani, S. Rudhziah, A. Ahmad and N. S. Mohamed, Polymers, 2014, 6, 2371–2385 CrossRef.
- M. Forsyth, D. MacFarlane, A. Best, J. Adebahr, P. Jacobsson and A. Hill, Solid State Ionics, 2002, 147, 203–211 CrossRef CAS.
- S. Chung, Y. Wang, L. Persi, F. Croce, S. Greenbaum, B. Scrosati and E. Plichta, J. Power Sources, 2001, 97, 644–648 CrossRef.
- A. M. Stephan and K. Nahm, Polymer, 2006, 47, 5952–5964 CrossRef CAS.
- N. A. Abdullah, M. S. A. Rani, M. Mohammad, M. H. Sainorudin, N. Asim, Z. Yaakob, H. Razali and Z. Emdadi, Polimery, 2021, 66, 157–168 CrossRef.
- N. A. Abdullah, M. H. Sainorudin, M. S. A. Rani, M. Mohammad, N. H. Abd Kadir and N. Asim, Polimery, 2021, 66, 187–192 CrossRef.
- B. O’regan and M. Grfitzeli, Nature, 1991, 353, 737–740 CrossRef.
- F. Bella, L. Porcarelli, D. Mantione, C. Gerbaldi, C. Barolo, M. Grätzel and D. Mecerreyes, Chem. Sci., 2020, 11, 1485–1493 RSC.
- A. Scalia, F. Bella, A. Lamberti, C. Gerbaldi and E. Tresso, Energy, 2019, 166, 789–795 CrossRef CAS.
- F. Bella, D. Pugliese, L. Zolin and C. Gerbaldi, Electrochim. Acta, 2017, 237, 87–93 CrossRef CAS.
- F. Bella, S. Galliano, M. Falco, G. Viscardi, C. Barolo, M. Grätzel and C. Gerbaldi, Green Chem., 2017, 19, 1043–1051 RSC.
- B. Bhattacharya, J. Y. Lee, J. Geng, H.-T. Jung and J.-K. Park, Langmuir, 2009, 25, 3276–3281 CrossRef CAS PubMed.
- M. Gratzel, Nature, 2001, 414, 338–345 CrossRef CAS PubMed.
- J. Wu, Z. Lan, S. Hao, P. Li, J. Lin, M. Huang, L. Fang and Y. Huang, Pure Appl. Chem., 2008, 80, 2241–2258 CAS.
- N. Kopidakis, E. Schiff, N.-G. Park, J. Van de Lagemaat and A. Frank, J. Phys. Chem. B, 2000, 104, 3930–3936 CrossRef CAS.
- N. Kopidakis, K. D. Benkstein, J. van de Lagemaat, A. J. Frank, Q. Yuan and E. A. Schiff, Phys. Rev. B: Condens. Matter Mater. Phys., 2006, 73, 045326 CrossRef.
- F. Bella, D. Pugliese, J. R. Nair, A. Sacco, S. Bianco, C. Gerbaldi, C. Barolo and R. Bongiovanni, Phys. Chem. Chem. Phys., 2013, 15, 3706–3711 RSC.
- F. Bella, S. Galliano, C. Gerbaldi and G. Viscardi, Energies, 2016, 9, 384 CrossRef.
- C. Zhou, R. Chu, R. Wu and Q. Wu, Biomacromolecules, 2011, 12, 2617–2625 CrossRef CAS PubMed.
- M. S. Islam, K. L. Pickering and N. J. Foreman, Composites, Part A, 2010, 41, 596–603 CrossRef.
- A. Chandra, P. C. Srivastava and S. Chandra, J. Mater. Sci., 1995, 30, 3633–3638 CrossRef CAS.
- N. Munichandraiah, L. G. Scanlon, R. A. Marsh, B. Kumar and A. K. Sircar, J. Appl. Electrochem., 1995, 25, 857–863 CrossRef CAS.
- J. Przyluski, M. Siekierski and W. Wieczorek, Electrochim. Acta, 1995, 40, 2101–2108 CrossRef CAS.
- Y. Horowitz, M. Lifshitz, A. Greenbaum, Y. Feldman, S. Greenbaum, A. P. Sokolov and D. Golodnitsky, J. Electrochem. Soc., 2020, 167, 160514 CrossRef CAS.
- J. P. Sharma and S. Sekhon, Indian J. Eng. Mater. Sci., 2005, 12, 557 CAS.
- R. Kumar and S. S. Sekhon, J. Appl. Electrochem., 2009, 39, 439–445 CrossRef CAS.
- M. S. A. Rani, N. S. Mohamed and M. I. N. Isa, Mater. Sci. Forum, 2016, 846, 539–544 Search PubMed.
- S. Sharma, N. Dhiman, D. Pathak and R. Kumar, Ionics, 2016, 22, 1865–1872 CrossRef CAS.
- M. S. A. Rani, M. Mohammad, M. S. Sua’it, A. Ahmad and N. S. Mohamed, Polym. Bull., 2020, 1–23, DOI:10.1007/s00289-020-03382-2.
- M. Y. A. Rahman, M. M. Salleh, I. A. Talib and M. Yahaya, Ionics, 2007, 13, 241–244 CrossRef CAS.
- B. Bhattacharya, S. K. Tomar, S. P. Pandey, H. W. Rhee and P. K. Singh, Int. J. Nanotechnol., 2012, 9, 1030–1039 CrossRef CAS.
- N. A. Dzulkurnain, M. S. A. Rani, A. Ahmad and N. S. Mohamed, Ionics, 2018, 24, 269–276 CrossRef CAS.
| This journal is © The Royal Society of Chemistry 2021 |

