 Open Access Article
Roles of structure and electron mobilization in enhanced ethanol sensing by Al doped SnO2 nanoparticles†
Nirman
Chakraborty
a,
Sagnik
Das
a,
Velaga
Srihari
b,
Dibya Jyoti
Mondal
c,
Debdulal
Saha
a,
Sanjit
Konar
 c,
Ajay K.
Mishra
b and
Swastik
Mondal
 *a
*a
aCSIR Central Glass and Ceramic Research Institute, 196, Raja S. C. Mullick Road, Jadavpur, Kolkata 700032, India. E-mail: swastik_mondal@cgcri.res.in
bHigh Pressure and Synchrotron Radiation Physics Division, Bhabha Atomic Research Centre, Trombay, Mumbai 400085, India
cDepartment of Chemistry, Indian Institute of Science Education and Research (IISER) Bhopal, Bhauri, Bhopal, 462066, India
First published on 19th April 2021
Abstract
Improvement in sensing performance by metal oxide based materials has usually been achieved by doping, morphology tuning, particle size tailoring or porosity modification. The existing models of band bending and grain boundary depletion layer that explain chemiresistive sensing address the above issues in terms of qualitative electronic behaviour. However, for thick film sensors in particular, there is a clear demarcation between the surface and the bulk. Thus the concept of gross electronic distribution needs refinement in terms of variable behavior of electrons in the surface and in the bulk so that the roles of different layers in a sensor film are distinguishable. Using the case of improved 98.2% ethanol sensing response by paramagnetic aluminium doped tin oxide mesoporous nano-systems, we have demonstrated how Al doping promotes difference in electronic behavior in the surface and in the bulk of thick film sensors, complementing the existing charge depletion model. The 4-fold improvement in sensing responses by Sn0.947Al0.144O1.881 and Sn0.869Al0.242O1.888 as compared to tin oxide have been explained in terms of shortening of the unit cell by virtue of aluminium doping, and the 2.4-fold improvement in sensing response by Sn0.869Al0.242O1.888 as compared to Sn0.947Al0.144O1.881 has been explained by surface and bulk electron mobilization. Considering the conceptual inclusiveness of correlation studied, it is expected to be applicable in explaining sensing mechanisms based on electron mobilization in other metal oxide sensor systems also.
Introduction
Owing to their easy availability, longer life time, wide band-gap behavior and reproducibility, pure and doped metal oxide based systems have extensively been used for chemiresistive gas/VOC sensing.1–3 Due to the ease of band-gap tunability, they can be used to sense a wide variety of gas/VOCs. Tin oxide is one such material which has been used numerous times in sensing a wide array of gases.4,5 While achieving selectivity remains a major challenge for metal oxide sensors, sensing selectivity in metal oxides has been achieved by doping them with a suitable dopant or changing other aspects like morphology, particle growth and so on.6–8 And the route of material synthesis remains a major pathway for introducing such alterations in these materials. For soft chemical routes in particular, non-stoichiometry is a common phenomenon that creeps into the system. Hence, while all the factors above cumulatively decide the fate of the sensing response, the plausible mechanism of chemiresistive sensing has mostly been based on the charge depletion model or the band bending concepts.9–13 But all the concepts mentioned above give a qualitative idea of the electron dynamics involved in the sensor material and hence visualizing gas sensing from a more fundamental background seems difficult.14–16 While electrons play the major role in all events during chemiresistive sensing,17,18 it is necessary to address both qualitative as well as quantitative analyses of their distribution within the system to understand the sensing mechanism. Particularly for thick film sensors, this understanding is expected to pave the way to advanced layering strategies that can lead to novel materials.While a pristine metal oxide sensor system may be electronically inefficient in responding effectively to a particular gas, the introduction of the dopant is anticipated to trigger variations in its electronic properties, paving the way to excellent sensing. Suematsu et al. has achieved selective sensing of combustible gases like H2, CO and ethanol against atmospheric humidity by doping Al in SnO2.19 Khudiar et al. has exhibited improved H2 sensing by Al doped SnO2 with emphasis on the particle size and crystallinity with doping.20 Farag has investigated the electrical properties of Al loaded SnO2 thin films in different gaseous mediums with stress on conductivity between grains.21 But all the studies mentioned above significantly depend on changes in the electronic properties of the systems with Al doping. Thus, understanding the variable electronic distribution in doped gas sensors becomes inevitably significant. Analysis of variation in an electronic distribution requires a preliminary investigation into the steady state variable distribution of electrons in the sensor material, which may change upon chemisorption by the target gas. Chemiresistive gas sensing is primarily a surface phenomenon22,23 where the pattern of electronic distribution before and after sensing actually determines the material performance. Considering the surface as an energetically favorable termination of the crystal lattice; the only source of electronic contribution on the surface besides its own electron content is the bulk, which comprises of numerous grains with electrons moving via grain boundaries. Hence in order to address variable electronic distribution within the system, before and after sensing, the contribution from inter-granular free electrons apart from those on surface needs to be considered. In our previous work on ammonia sensing by vanadium doped tin oxide nano systems24 we have explained sensing behavior in terms of modifications in the crystal and surface electronic structures, while keeping all other parameters affecting gas sensing like particle size, temperature, surface area, morphology, inter-granular activation energy and surface oxygen vacancy similar. In the present work, we complement the abovementioned aspects by introducing the concept of charge storage between grains as a result of variable electron distribution to explain enhanced ethanol sensing behavior of Al doped SnO2 thick film sensors.
Charge storage between grains and its subsequent dissipation could be studied by capacitance measurements of the materials.25,26 On the other hand, the crystal structure of a material can be elaborately studied by the Rietveld refinement of powder X-ray diffraction data,27,28 and X-ray photoelectron spectroscopy is an established method for analysing surface electronic compositions.29,30 Hence, a combined study of the sensors based on the above techniques is expected to provide a vivid idea of the variable electronic distribution in the sample and its dynamics so that all aspects of chemiresistive sensing could be better understood. Formation of nano particles ensures a greater surface to volume ratio for surface adsorption, and hence increasing response.6 Thus to categorically analyze the role of various structural aspects in improved gas sensing performance, nanosized particle formation shall act as an advantage in scaling up differences in performance so that the changes are conveniently noticeable. In this work, using the example of improved ethanol sensing by aluminium doped tin oxide nano systems (Fig. 1) of similar morphology, particle size, surface area and surface oxygen vacancy, we have tried to find the role of crystal structure modifications in improved ethanol sensing by doped samples and identify a direct correlation of the sensing responses with the variable electronic behavior of the sensor systems by employing the techniques mentioned above. While this approach of interpreting the sensing mechanism is the first of its kind, we have also achieved some highly improved and selective ethanol sensing responses by a metal oxide based sensor system.
Experimental
Material synthesis and sensor fabrication
Aluminium doped tin oxide nanoparticles of the formulae Sn0.933O2, Sn0.947Al0.144O1.881 and Sn0.869Al0.242O1.888 were synthesized by a sol–gel method followed by prolonged ultrasonication. For the synthesis, SnCl4·5H2O (Aldrich, 99.9%) and Al(NO3)3·9H2O (Aldrich, 99.9%) were dissolved separately in DI water (Merck) following molar ratios (Al![[thin space (1/6-em)]](https://www.rsc.org/images/entities/char_2009.gif) :
:![[thin space (1/6-em)]](https://www.rsc.org/images/entities/char_2009.gif) Sn) 0.00, 0.05 and 0.10, followed by magnetic stirring for 2 hours each. The aluminium solution was then added to the tin solution, followed by magnetic stirring for another 2 hours. A whitish gel was formed after adding ammonia solution (Merck) drop-wise until a pH of 9 was obtained. Further addition of ammonia led to formation of a soluble complex which dissolved in the solution. Hence, utmost precaution was taken in collecting the gel like precipitate. The gel was then ultrasonicated in a 360 watt probe sonicator (ChromTech UP 800 model) for one hour, followed by repeatedly washing in ethanol (Merck). The gel was finally dried at 60 °C for 12 hours followed by calcination at 650 °C for 3 hours. For gas sensing experiments (Fig. 2), Taguchi based sensors31 were fabricated in which a small amount of the calcined powder sample (around 0.1 g) was thoroughly mixed in iso-propyl alcohol using a mortar pestle and made into a consistent slurry. The slurry was then coated onto a cylindrical alumina substrate of 3 mm diameter and 4 mm length. The electrical contacts were made by platinum electrodes attached to the substrate by gold paste. A Nichrome wire was coiled inside the cylindrical substrate for heating the material. The substrate was then placed in a pre-heated drying oven at 60 °C and cured for 6 hours. It was then mounted on a 6 headed pin module, capped with a 200 μm polymeric mesh and checked for coating consistency under a S neox SensoSCAN 6.6 non-contact optical profiler in both focus variation and interferometry modes with 20× magnification (see the ESI†). The comparable values of the average surface height and maximum surface heights of coating ensured similar film thickness for all sensors (see ESI†).
Sn) 0.00, 0.05 and 0.10, followed by magnetic stirring for 2 hours each. The aluminium solution was then added to the tin solution, followed by magnetic stirring for another 2 hours. A whitish gel was formed after adding ammonia solution (Merck) drop-wise until a pH of 9 was obtained. Further addition of ammonia led to formation of a soluble complex which dissolved in the solution. Hence, utmost precaution was taken in collecting the gel like precipitate. The gel was then ultrasonicated in a 360 watt probe sonicator (ChromTech UP 800 model) for one hour, followed by repeatedly washing in ethanol (Merck). The gel was finally dried at 60 °C for 12 hours followed by calcination at 650 °C for 3 hours. For gas sensing experiments (Fig. 2), Taguchi based sensors31 were fabricated in which a small amount of the calcined powder sample (around 0.1 g) was thoroughly mixed in iso-propyl alcohol using a mortar pestle and made into a consistent slurry. The slurry was then coated onto a cylindrical alumina substrate of 3 mm diameter and 4 mm length. The electrical contacts were made by platinum electrodes attached to the substrate by gold paste. A Nichrome wire was coiled inside the cylindrical substrate for heating the material. The substrate was then placed in a pre-heated drying oven at 60 °C and cured for 6 hours. It was then mounted on a 6 headed pin module, capped with a 200 μm polymeric mesh and checked for coating consistency under a S neox SensoSCAN 6.6 non-contact optical profiler in both focus variation and interferometry modes with 20× magnification (see the ESI†). The comparable values of the average surface height and maximum surface heights of coating ensured similar film thickness for all sensors (see ESI†).
Structural characterization
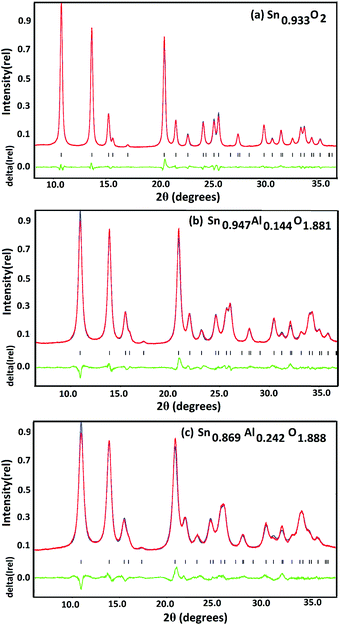
The crystal structure of the samples was elaborately studied by the established method of Rietveld refinement of powder X-ray diffraction data.27,28 Synchrotron based room temperature powder X-ray diffraction measurements were carried out on well ground powder samples at the Extreme Conditions Angle Dispersive/Energy dispersive X-ray diffraction (EC-AD/ED-XRD) beamline (BL-11) at Indus-2 synchrotron source, Raja Ramanna Centre for advanced Technology (RRCAT), Indore, India. For the diffraction measurements, a small amount of sample was finely ground in an agate mortar and filled into borosilicate capillaries of length 80 mm and diameter 0.3 mm. The diffraction pattern was obtained using a photon source of wavelength 0.63707 Å in transmission mode, using an exposure time of 600 s. Quantitative Rietveld refinement32 of the collected data was done using Jana 2006 software.33 Since the samples synthesized were formed in a tetragonal rutile phase (Fig. 3), refinements were carried out using the P42/mnm space group. For background correction of the diffractogram, 35 terms were used and peak profiles were fitted employing pseudo-Voigt polynomials. For the pure tin oxide sample, initial refinements with full occupancy of Sn and O atoms resulted in unphysical isotropic thermal parameters. This issue was resolved by refining total cation occupancy which finally resulted in physically acceptable values of isotropic thermal parameters. For the doped samples, refinements with Sn and O atoms led to a large mismatch between experimental and calculated profiles. This was resolved by introducing Al in the Sn position and allowing the occupancies to refine freely. But this led to negative isotropic thermal parameters for Sn, indicating at over-estimation of the cation occupancy. This issue was resolved by putting some Al atoms at the O position and then allowing the program to refine freely. This resulted in physically acceptable values of isotropic thermal parameters along with the indication of oxygen vacancy. Final refinements including all above parameters resulted in an excellent fit between the experimental and calculated models, hence confirming the accuracy of our model (Table 1 and Fig. 3).| Sample | Sn0.933O2 | Sn0.947Al0.144O1.881 | Sn0.869Al0.242O1.888 |
|---|---|---|---|
| Crystal system | Tetragonal | Tetragonal | Tetragonal |
| Space group | P42/mnm | P42/mnm | P42/mnm |
| Temperature (K) | 298 | 298 | 298 |
| No. of formula units (z) | 2 | 2 | 2 |
| a (Å) | 4.7994(14) | 4.7277(3) | 4.7241(5) |
| c (Å) | 3.2263(11) | 3.1746(2) | 3.1670(3) |
| α = β = γ (degrees) | 90 | 90 | 90 |
| V (Å3) | 74.319(4) | 70.956(8) | 70.677(3) |
| Sn–O bond length (Å) | 2.068(2) | 2.031(2) | 2.013(3) |
| R p/wRp | 3.51/4.46 | 4.30/5.24 | 4.21/5.21 |
| GOF | 0.70 | 0.60 | 0.64 |
| Sn/Al: x | 0 | 0 | 0 |
| y | 0 | 0 | 0 |
| z | 0 | 0 | 0 |
| U iso | 0.0090(2) | 0.0022(14) | 0.0051(15) |
| O: x | 0 | 0 | 0 |
| y | 0.3046(5) | 0.3037(5) | 0.3013(6) |
| z | 0.3046(5) | 0.3037(5) | 0.3013(6) |
| U iso | 0.019(2) | 0.012(18) | 0.031(2) |
| BET surface area (m2 g−1) | 7.2 | 8.9 | 7.5 |
| Average pore size (Å) | 19.6 | 20.3 | 21.3 |
| Average particle size range (nm) from TEM | 20–25 | 16–19 | 14–18 |
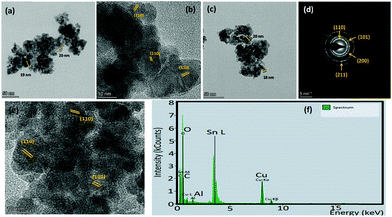
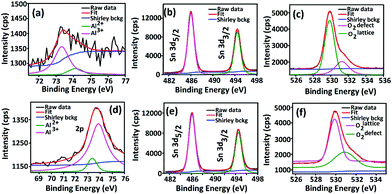
X-Ray photoelectron spectroscopy (XPS) is an established method for analyzing surface electronic compositions.29,30 For XPS, the powder samples (approximately 0.4 g) were pelletized in a hydraulic press into pellets of size 1 cm diameter and then treated at 100 °C to eliminate surface adsorbed moisture. Measurements were carried out in a PHI 5000 VersaProbe II instrument (Make: Physical Electronics) using monochromatic aluminium K-alpha X-ray of photon energy 1486.7 eV as the source at a pass energy of 11.75 eV and step size 0.10 eV. Background correction of core-level spectra was done by employing the Shirley algorithm34 and the chemically distinct species of Al, O and Sn were resolved by a non-linear least-squares fitting method, using the software KoIXPD (Fig. 7, Table 2 and see the ESI†).35 The core level binding energies of individual elements were scaled with the adventitious carbon peak with a binding energy of 284.8 eV (see the ESI†). The incorporation of aluminium in the Sn positions is generally controlled by the compatibility of ionic radii between Sn4+ and Al3+ ions.36 In order to investigate the possible existing oxidation states of Al atoms, the area under 2p signal was deconvoluted (Fig. 7, Table 2 and see ESI†) employing a combination of Gaussian and Lorentzian profile functions. The XPS results quantify the existence of multiple oxidation states of aluminium. An estimation of surface oxygen vacancies was made by deconvoluting the O 1s peak and calculating the area (in arbitrary units) under the peak obtained at higher binding energy, followed by a scaling (Fig. 7, Table 2 and see the ESI†).24 While the XPS studies chemically substantiate doping in the tin oxide samples, Energy Dispersive X-Ray Spectroscopy (EDX) measurements using TEM also confirmed it (Fig. 5 and see the ESI†).
| Sample | Sn0.933O2 | Sn0.947Al0.144O1.881 | Sn0.869Al0.242O1.888 |
|---|---|---|---|
| Elements present with oxidation states | Sn4+, O2− | Sn4+, Al2+, Al3+, O2− | Sn4+, Al2+, Al3+, O2− |
| Surface electronic composition | Sn4+O2− | Sn0.9474+Al0.0202+, Al0.1243+O1.8812− | Sn0.8694+Al0.0272+, Al0.2153+O1.8882− |
| Surface positive charge per formula unit | — | 0.438 | 0.399 (∼1.1 times less than Sn0.947Al0.144O1.881) |
| Sensing response (%) | 15 | 40.9 | 98.2 (∼2.4 times more than Sn0.947Al0.144O1.881) |
| Response & recovery times (s) | 5, 54 | 14, 551 | 4, 607 |
| Capacitance change per formula unit | 0.7 | 2.8 | 3.7 (∼1.3 times more than Sn0.947Al0.144O1.881) |
Electron paramagnetic resonance (EPR) spectroscopic analyses
In order to verify the presence of cation defects in pure and aluminium doped tin oxide samples, EPR spectroscopic studies were performed (Fig. 4). EPR spectra were recorded for all the powder samples in Bruker EMX MicroX instrument using Bruker WinEPR Acquisition Software Version 4.40 Rev 1.1. Powdered samples were loaded into Wilmad Clear Fused-Quartz (CFQ) EPR tubes having a high dielectric constant and no paramagnetic impurities. Samples were measured in the frequency range of 9.43–9.44 Giga Hertz (X-band EPR) at room temperature (293.15 K). Experiments were done using microwave power of 0.818 mW, modulation amplitude of 21.04 G, modulation frequency of 100.00 kHz, conversion time 60.00 ms and time constant 10.24 ms.Electron microscopic and spectroscopic studies
Field Emission Scanning Electron Microscopy (FESEM) studies of the powder samples were carried out on a Carl Zeiss Supra 35VP instrument (Fig. 8 and see the ESI†). For sample preparation, small amounts of powder were thoroughly dispersed in iso-propyl alcohol and drop cast on Si wafers, followed by drying under a UV lamp. The wafers were then carbon coated and tested on the microscope. For color mapping (Fig. 6), small pellets of the powder sample were prepared and attached to a carbon tape mounted on a metallic stub. The chemical composition and uniformity of doping were reassured by color mapping (Fig. 6 and see the ESI†). Grain size and morphology were determined from the microscopic images using the software ImageJ (Fig. 8 and see the ESI†). Transmission Electron Microscopy (TEM) analyses of the samples were carried out on a FEI Tecnai G2 30ST instrument (Fig. 5 and see the ESI†). The average particle size distribution was further analyzed by a Malvern DLS (Dynamic Light Scattering) analyzer (see the ESI†). In order to detect the light absorption and emission characteristics of the sensors, temperature dependent UV-Vis spectroscopic measurements (30 °C to 70 °C) (see the ESI†) were carried out using a CECIL Aquarius 7200 UV-Vis spectrometer and photoluminescence studies (see ESI†) using a Fluoro Max-P (HORIBA JobinYvon) luminescence spectrophotometer. BET surface area37 measurements of the samples were carried out using a Quantachrome AsQwin Surface Area Analyzer using a N2 gas adsorption/desorption method (Table 1 and see the ESI†).Resistive and capacitive gas sensing measurements
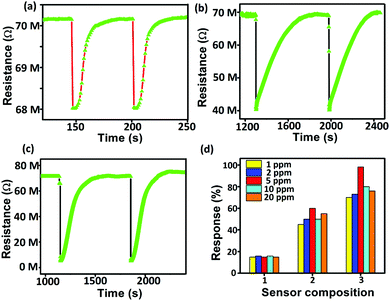
For the resistive gas sensing measurements, the sensors were heated at different temperatures starting from room temperature up to 350 °C using a Keysight DC power supply. The dynamic resistance (Fig. 2) was measured using an Agilent Multimeter interfaced with the Agilent GUI software. The most stable base resistance was observed at 350 °C which corresponds to a voltage of 5 V. For the comparative study, all sensors were aged for 72 hours at same temperature of 350 °C followed by steady state sensing measurements. Calibrated gas cylinders of different gases (in ppm) were connected to the Alicat make Mass Flow Controllers and low ppm dilutions were made with air and nitrogen gases. Gas pulses at a constant flow rate were applied to the sensor for 10 s each, followed by recovery (Fig. 2). Sensing responses were calculated using the standard formula,38,39 response (%) = (Rair − Rgas)/Rair where Rair is the sensor resistance in air/N2 and Rgas is the sensor resistance in the presence of the target gas. The I–V characteristics of the sensors were measured under similar conditions. Capacitive sensing measurements were carried out using an LCR meter (HP 34970A). The frequency was varied from 100 Hz to 1 MHz using a computer-controlled Hewlett–Packard impedance analyzer (HP4192A), both in the presence and in the absence of gases (Fig. 8). Most stable response was observed at the 1 kHz value, at which all the measurements were finally carried out.Calculation of charge leakage based on capacitor model
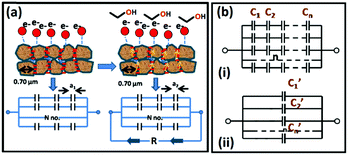
For capacitors in series (Fig. 9b), the equivalent capacitance C′ isfor n capacitors, having the same capacitance (C1 = C2 =…Cn) or
or
In the charged state,
 or
orwhere ε is the permittivity of air, d1, d2…dn is the distance between equivalent capacitors in different parallel branches and n is the total number of capacitors in parallel.
In the discharged state,
Hence,
Assumptions in the capacitor model:
1. “d” spacing for individual capacitors in each branch is the same. This varies for the equivalent capacitors in different branches of the parallel connection.
2. Any criss-cross connections in the capacitor model have been currently avoided which means that the grains have been arranged in a similar pattern/order.
Results and discussion
Gas sensing experiments revealed that out of several gas/VOCs (see the ESI†), the aluminium doped samples (Sn0.947Al0.144O1.881 and Sn0.869Al0.242O1.888) (Table 1) showed an excellent response to ethanol vapor as compared to pure Sn0.933O2 (Table 2 and Fig. 2). In order to optimize the minimum detection limit, tests were performed with different concentrations of ethanol vapor from 1 ppm to 100 ppm (Fig. 2). The maximum stable response of 98.2% for 5 ppm ethanol was exhibited by Sn0.869Al0.242O1.888 followed by 40.9% response of Sn0.947Al0.144O1.881 (Table 2). Investigations into the dynamic sensing response reveal that with the application of pulses of ethanol vapor above the sensor head, the sample resistance decreases. This can explained by the following surface reactions that reveal an electron release mechanism by virtue of ethanol oxidation:40–42| O2 (gas) → O2 (ads) | (1) |
| O2 (ads) + e− → O2− (ads) (Top < 100 °C) | (2) |
| O2− + e− → 2O− (100 < Top < 300 °C) | (3) |
| O− + e− → O2− (Top > 300 °C) | (4) |
| C2H5OH + 6O2− → 2CO2 + 3H2O + 12e− | (5) |
In order to investigate the possible causes behind these improved variable responses, initially, the structural and surface electronic analyses of all the samples were performed. Rietveld refinement results show that aluminium doped tin oxide samples undergo a unit cell contraction by 3.363 and 3.642 Å3 for Sn0.947Al0.144O1.881 and Sn0.869Al0.242O1.888 respectively due to the smaller size of aluminium compared to tin which in turn causes the reduction of Sn–O bond lengths by 0.037 and 0.055 Å respectively for Sn0.947Al0.144O1.881 and Sn0.869Al0.242O1.888 (Table 1 and Fig. 3). As per our previous calculations,24 this unit cell contraction leads to the generation of a maximum of 1019 excess active sites per mm3 of the sample for chemisorption. Since chemiresistive gas sensing is primarily a surface phenomenon and it is the effective concentration of surface active sites that determine the initial rate of surface reaction, the shortening of the unit cell explains the enhanced sensing response of doped samples as compared to pure tin oxide. Hence, it is the combined contribution from the increase in active site density and surface interaction that enhances the sensing performance in Al doped samples. Composition analyses from Rietveld refinements revealed non-stoichiometry in the pure tin oxide sample which has Sn vacancies with the formula Sn0.933O2 (Fig. 3 and Table 1). Also, there are cation vacancies in doped samples with formulae Sn0.947Al0.144O1.881 and Sn0.869Al0.242O1.888 (Fig. 3 and Table 1). This information indicates the presence of non-stoichiometric defects in all samples which was further confirmed by EPR spectroscopic measurements (Fig. 4). Sn0.933O2 has an EPR signal with a g value of 1.9998 corresponding to the presence of paramagnetic Sn3+ and O2− centers.43 In Sn0.947Al0.144O1.881, there were signals with g values 1.9881 and 1.9215 for Sn3+ and Al2+ centers respectively (Fig. 4). And in Sn0.869Al0.242O1.888, signals with g values 1.9926 and 1.9245 were obtained similarly for Sn3+ and Al2+ centers respectively (Fig. 4). The presence of the EPR signal due to Al2+ was confirmed from previous studies where X-ray irradiation on Al3+ impurities in BeO2 lead to the generation of unstable Al2+ species.44
Since chemiresistive gas sensing is dependent on several important factors like particle surface to volume ratio, porosity, morphology and size,13 the role of the mentioned parameters is also necessary to be considered for further analysis of the causes for improved sensing responses. Microstructural studies by FESEM and TEM revealed formation of spherical nanoparticles in the range of 18–20 nm (Table 1, Fig. 5, 6 and see ESI†). HRTEM studies revealed the preferential exposure of energetically favorable 110 planes in both doped and pure tin oxide samples (Fig. 5 and see ESI†). While all particles have similar size and morphology (Fig. 5 and see ESI†), N2 adsorption/desorption experiments indicated the formation of mesopores with similar diameters in all samples with similar BET surface areas (Table 1 and see ESI†).
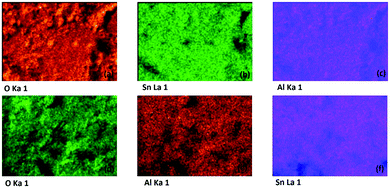 | ||
| Fig. 6 EDX colour mapping of (a–c) Sn0.947Al0.144O1.881 and (d–f) Sn0.869Al0.242O1.888 respectively. The color distribution indicates at uniformity of doping in both doped samples. | ||
Surface electronic structure analyses from XPS results reveal that aluminium has been doped in the 3+ state during synthesis (see the ESI†); for Sn0.947Al0.144O1.881 and Sn0.869Al0.242O1.888, both Al2+ and Al3+ states are present (Table 2 and Fig. 7).42 This presence of variable aluminium valency in tin sites with the 4+ state leads to the generation of excess surface positive charges; Sn0.947Al0.144O1.881 having a 1.1-fold greater surface positive charge than Sn0.869Al0.242O1.888 (Table 2). The concept of lower surface positive charge in the latter is actually a manifestation of the presence of the more unstable Al2+ species, which by shedding electrons intend to achieve the stable 3+ state.45 Considering the surface immobilization of incoming electrons from the surface reaction of oxidizing ethanol vapor, the lower surface positive charge content of Sn0.869Al0.242O1.888 allows greater transport of electrons into the bulk, hence leading to a greater lowering of resistance of the sample (Table 2). This is contrary to Sn0.947Al0.144O1.881 which has a higher tendency of surface immobilization of electrons and hence lower sample response. This tendency is also responsible for different recovery rates of the doped samples where Sn0.947Al0.144O1.881 takes a lower recovery time as compared to Sn0.869Al0.242O1.888 (Fig. 2 and Table 2).
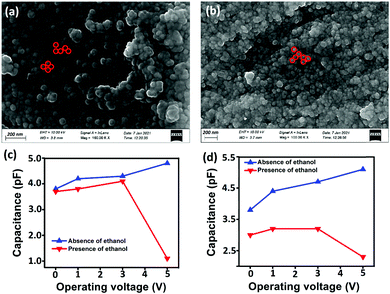
As is evident from the surface electronic structure analysis,24 the ratio of the surface excess positive charge between Sn0.947Al0.144O1.881 and Sn0.869Al0.242O1.888 is of the order of 1.1 (Table 2) while the ratio of ethanol sensing responses between Sn0.869Al0.242O1.888 and Sn0.947Al0.144O1.881 is 2.4 (Table 2). Since all the samples chosen in this study were based on similar particle size, surface area, morphology and surface oxygen vacancy (Tables 1 and 2), the excess surface positive charge values of Sn0.947Al0.144O1.881 and Sn0.869Al0.242O1.888 alone could not explain the enhanced ethanol sensing behavior; some other aspect of the sensors needed to be addressed to resolve this. Using the idea that bulk electrons stored in between adjacent grains of the material could possibly have a role to explain the variation in ethanol sensing, we carried out capacitive sensing measurements of all the samples at different temperatures (room temperature to 350 °C), both in the presence and in the absence of 5 ppm ethanol vapor applied to sensor head (Table 2, Fig. 8 and see ESI†). While for pure Sn0.933O2, the decrease in capacitance on applying ethanol gas at a bias voltage of 1 V was negligible (see ESI†), for Sn0.869Al0.242O1.888 the decrease was 1.3 times more than Sn0.947Al0.144O1.881. This implies that Sn0.869Al0.242O1.888 undergoes a 1.3 times greater volume charge leakage as compared to Sn0.947Al0.144O1.881 during interaction with ethanol. Since all the capacitive measurements were carried at out at the sensor operational temperature of 350 °C, the volume charge mobilization via leakage can be understood from the decrease in capacitance values (Table 2). PL studies have confirmed the absence of additional defect states in aluminium doped samples, thus ruling out contribution from material defects in volume charge mobilization at the sensor operational temperature (see the ESI†).46
According to the grain boundary model,47–50 chemisorption on metal oxide surface leads to change in grain boundary thickness, affecting electron transport. From the room temperature capacitive studies, it has been observed that for all the samples, decrease in capacitance on exposure to ethanol gas is negligible (see the ESI†). Considering the region between two adjacent grains as the space between two plates of a parallel plate capacitor, a thick film coating on a tubular substrate could be considered as a cylindrical capacitor made of numerous small capacitors (Fig. 9 and see the ESI†). At room temperature, the electron transport through the grain boundaries is minimal, thus there is maximum storage of the charge between the grains. At high temperature, on attaining the necessary activation energy, the electron transport is facilitated, which in turn can be interpreted to be the leakage of stored charges between two adjacent grains (Fig. 9). There is also a reduction in band gap as is evident from the high temperature UV-Vis studies (see the ESI†).
The overall decrease in the capacitance is thus a cumulative measure of this charge leakage, which can be considered as the enhancement of charge transport through the grain boundaries (Fig. 9). A calculation based on the total capacitance of the sensor material at 5 V (350 °C) shows that the ratio of the number of capacitors discharged on applying ethanol vapor to the total number of capacitors in the normal steady state is proportional to the ratio of permittivity of the material between the capacitor plates in the presence and in the absence of ethanol vapor (see the Experimental section, Fig. 9). For Sn0.869Al0.242O1.888, the proportionality constant is 1.71 whereas for Sn0.947Al0.144O1.881, the constant is 1.27. Since the ratio of the permittivity terms is calculated for sensing at the same operating temperature of 350 °C, a ratio of the relative population of discharged capacitors in Sn0.869Al0.242O1.888 to the relative population of discharged capacitors in Sn0.947Al0.144O1.881 is nearly 1.3; which is exactly the same ratio of volume charge mobilization during ethanol sensing (see the Experimental section). This correlation is in consonance with the fact that volume charge mobilization during the sensing phenomenon is a manifestation of the leakage of charges stored between adjacent grains, which has been considered here as a network of charged capacitors. The enhanced ethanol sensing by a factor 2.4 in the case of Sn0.869Al0.242O1.888 as compared to Sn0.947Al0.144O1.881 can now be explained by excess volume charge mobilization in Sn0.869Al0.242O1.888 as compared to Sn0.947Al0.144O1.881. During the interaction of ethanol molecules with the chemisorbed surface oxygen layer, the surface charge immobilization in Sn0.869Al0.242O1.888 is hence accompanied by volume charge mobilization, together resulting in a 2.4 times greater sensing response in Sn0.869Al0.242O1.888 than Sn0.947Al0.144O1.881 (Fig. 10).
These phenomena of surface charge immobilization and volume charge mobilization are probably due to crystal termination51 effects which indicate the variable electronic behavior at different profiles of a thick film, subject to different boundary conditions. The electronic distribution on the surface is also subject to the influence of the bulk electronic distribution, together deciding the course of surface specific reactions. Hence, it is the complex interplay of the crystal structure, surface electronic structure and grain charge dynamics that actually determine the improved sensing responses in non-stoichiometric aluminium doped tin oxide systems (Fig. 10). The reduction in the space charge layer concept in the band bending model of chemiresistive sensing is also a manifestation of these, establishing a link between the structural and electrical models of sensing. The increased mobility of electrons through the grain boundaries at high sensing temperatures is also an effect of modification in boundary width assisted by temperature (Fig. 10). Further quantitative analyses in terms of surface electron density and temperature dependent studies on grain dynamics could explain this concept much better.52,53
Conclusions
Aluminium doped tin oxide nanoparticles were synthesized by a sol–gel method followed by ultrasonication. Sensing measurements with 5 ppm ethanol at 350 °C revealed that while aluminium doped samples showed a multi-fold improved response as compared to pure Sn0.933O2, Sn0.869Al0.242O1.888 showed a 2.4 times improved response as compared to Sn0.947Al0.144O1.881. Crystal structure analysis by X-ray diffraction revealed the shrinkage of the unit cell volume in tin oxide due to aluminium doping, leading to an excess generation of maximum active sites up to 1019 mm−3 of the sample. This explains the multi-fold improved ethanol response by doped samples. Surface electronic structure analysis using XPS revealed that surface excess positive charge in Sn0.869Al0.242O1.888 was 1.1 times less than Sn0.947Al0.144O1.881. Considering the concept of charge immobilization, the estimation of surface electron deficiency in Sn0.869Al0.242O1.888 and Sn0.947Al0.144O1.881 could not be solely used for explaining 2.4 times improved sensing responses. Moreover, it was observed that Sn0.869Al0.242O1.888 has 1.3 times more volume charge mobilization at 350 °C as compared to Sn0.947Al0.144O1.881, manifested in terms of a decrease in sample capacitance during interaction with ethanol vapors. Hence we can comprehend that it is the delicate interplay of crystal structure, surface electronic structure and volume electronic mobilization phenomenon that is responsible for the variable sensing patterns in aluminium doped tin oxide systems. It is expected that a similar interplay will be responsible for sensing responses in other doped metal oxide systems also.Conflicts of interest
There are no conflicts to declare.Acknowledgements
The authors are thankful to the Advanced Materials Characterization Unit, CSIR-CGCRI, for the TEM, XPS measurements, Materials Characterization division for the FESEM measurements and the Central Materials Characterization Facility for TGA & DLS experiments. The authors are also thankful to Md. Jalaluddin Mondal and Raju Manna for helping with the sensor fabrication and gas sensing measurements. N. Chakraborty is thankful to the Department of Science and Technology, Govt. of India, for the INSPIRE fellowship (IF170810). S. Mondal would like to acknowledge financial support from SERB Core Research Grant, Government of India (Grant number: CRG/2019/004588). D. J. Mondal would like to thank CSIR, India for research fellowship.Notes and references
- H. Ji, W. Zeng and Y. Li, Gas sensing mechanisms of metal oxide semiconductors: a focus review, Nanoscale, 2019, 11, 22664 RSC.
- J. Zhang, Z. Qin, D. Zeng and C. Xie, Metal-oxide-semiconductor based gas sensors: screening, preparation, and integration, Phys. Chem. Chem. Phys., 2017, 19, 6313 RSC.
- D. Degler, U. Weimar and N. Barsan, Current Understanding of the Fundamental Mechanisms of Doped and Loaded Semiconducting Metal-Oxide-Based Gas Sensing Materials, ACS Sens., 2019, 4, 2228–2249 CrossRef CAS PubMed.
- X. Li, J. H. Cho, P. Kurup and Z. Gu, Novel sensor array based on doped tin oxide nanowires for organic vapor detection, Sens. Actuators, B, 2012, 162, 251–258 CrossRef CAS.
- X. Xiao, L. Liu, J. Ma, Y. Ren, X. Cheng, Y. Zhu, D. Zhao, A. A. Elzatahry, A. Alghamdi and Y. Deng, Ordered Mesoporous Tin Oxide Semiconductors with Large Pores and Crystallized Wall for High-Performance Gas Sensing, ACS Appl. Mater. Interfaces, 2018, 10(2), 1871–1880 CrossRef CAS PubMed.
- Z. Song, H. Chen, S. Bao, Z. Xie, Q. Kuang and L. Zhen, Nanosheets-assembled, Hollowed-out Hierarchical γ-Fe2O3 Microrods for High-performance Gas Sensing, J. Mater. Chem. A, 2020, 8, 3754–3762 RSC.
- R. Purbia, Y. M. Kwon, H. D. Kim, Y. S. Lee, H. Shin and J. Min Baik, Zero-dimensional Heterostructures: N-Doped Graphene Dots/SnO2 for Ultrasensitive and Selective NO2 Gas Sensing at Low Temperatures, J. Mater. Chem. A, 2020, 8, 11734–11742 RSC.
- X. Wan, J. Wang, L. Zhub and J. Tang, Gas sensing properties of Cu2O and its particle size and morphology-dependent gas-detection sensitivity, J. Mater. Chem. A, 2014, 2, 13641 RSC.
- O. L. C. Moreira, W. Y. Cheng, H. R. Fuh, W. C. Chien, W. Yan, H. Fei, H. Xu, D. Zhang, Y. Chen, Y. Zhao, Y. Lv, G. Wu, C. Lv, S. K. Arora, C. O. Coileain, C. Heng, C. R. Chang and H. C. Wu, High Selectivity Gas Sensing and Charge Transfer of SnSe2, ACS Sens., 2019, 4, 2546–2552 CrossRef PubMed.
- L. Wang, J. Li, Y. Wang, K. Yu, X. Tang, Y. Zhang, S. Wang and C. Wei, Construction of 1D SnO2-coated ZnO nanowire heterojunction for their improved n-butylamine sensing performances, Sci. Rep., 2016, 6, 35079 CrossRef CAS PubMed.
- C. C. Li, Z. F. Du, L. M. Li, H. C. Yu, Q. Wan and T. H. Wang, Surface-depletion controlled gas sensing of ZnO nanorods grown at room temperature, Appl. Phys. Lett., 2007, 91, 032101 CrossRef.
- J. Liu, Y. Lu, X. Cui, G. Jin and Z. Zhai, Effect of depletion layer width on electrical properties of semiconductive thin film gas sensor: a numerical study based on the gradient-distributed oxygen vacancy model, Appl. Phys. A: Mater. Sci. Process., 2016, 122, 146 CrossRef.
- H. Liu, S. Xu, M. Li, G. Shao, H. Song, W. Zhang, W. Wei, M. He, L. Gao, H. Song and J. Tang, J. Chemiresistive gas sensors employing solution-processed metal oxide quantum dot films, Appl. Phys. Lett., 2013, 105, 163104 CrossRef.
- A. Mirzaei, J. H. Lee, S. M. Majhi, M. Weber, M. Bechelany, H. W. Kim and S. S. Kim, Resistive gas sensors based on metal-oxide nanowires, J. Appl. Phys., 2019, 126, 241102 CrossRef.
- G. W. Hunter, S. Akbar, S. Bhansali, M. Daniele, P. D. Erb, K. Johnson, C. C. Liu, D. Miller, O. Oralkan and P. J. Hesketh, Choice—Critical Review—A Critical Review of Solid State Gas Sensors, J. Electrochem. Soc., 2020, 167, 037570 CrossRef CAS.
- M. Hübner, C. B. Simion, A. Tomescu-Stanoiu, S. Pokhrel, N. Bârsan and U. Weimar, Influence of humidity on CO sensing with p-type CuO thick film gas sensors, Sens. Actuators, B, 2011, 153, 347–353 CrossRef.
- J. Zhang, P. Tang, T. Liu, Y. Feng, C. Blackman and D. Li, Facile synthesis of mesoporous hierarchical Co3O4–TiO2 p–n heterojunctions with greatly enhanced gas sensing performance, J. Mater. Chem. A, 2017, 5, 10387–10397 RSC.
- C. Wang, L. Yin, L. Zhang, D. Xiang and R. Gao, Metal Oxide Gas Sensors: Sensitivity and Influencing Factors, Sensors, 2010, 10, 2088–2106 CrossRef CAS PubMed.
- K. Suematsu, N. Ma, M. Yuasa, T. Kida and K. Shimanoe, Surface-modification of SnO2 nanoparticles by incorporation of Al for the detection of combustible gases in humid atmosphere, RSC Adv., 2015, 5, 86347–86354 RSC.
- A. I. Khudiar and A. M. Oufi, Influence of the Aluminium Doping on the Physical and Gas Sensing Properties of SnO2 for H2 Gas Detection, Sens. Actuators, B, 2021, 129633 CrossRef CAS.
- E. S. M. Farag, A model for the gas sensing properties of Al-doped SnO2 thin film after annealing, Mater. Lett., 2000, 43, 139–143 CrossRef CAS.
- Y. V. Kaneti, Q. M. D. Zakaria, Z. Zhang, C. Chen, J. Yue, M. Liu, X. Jiang and A. Yua, Solvothermal synthesis of ZnO-decorated a-Fe2O3 nanorods with highly enhanced gas-sensing performance toward n-butanol, J. Mater. Chem. A, 2014, 2, 13283 RSC.
- N. Chakraborty, S. Das, D. Saha and S. Mondal, Material surface – analyte interactions with similar energy rates vary as univariate quadratic function of topological polar surface area of analytes, 2021, arXiv:2104.14867 [physics.chem-ph].
- N. Chakraborty, A. Sanyal, S. Das, D. Saha, S. K. Medda and S. Mondal, Ammonia Sensing by Sn1−xVxO2 Mesoporous Nanoparticles, ACS Appl. Nano Mater., 2020, 3(8), 7572–7579 CrossRef CAS.
- S. Zeinali, S. Homayoonnia and G. Homayoonnia, Comparative investigation of interdigitated and parallel-plate capacitive gas sensors based on Cu-BTC nanoparticles for selective detection of polar and apolar VOCs indoors, Sens. Actuators, B, 2019, 278, 153–164 CrossRef CAS.
- X. J. Li, S. J. Chen and C. Y. Feng, Characterization of silicon nanoporous pillar array as room-temperature capacitive ethanol gas sensor, Sens. Actuators, B, 2007, 123, 461–465 CrossRef CAS.
- S. Mondal, M. Mukherjee, S. Chakraborty and A. K. Mukherjee, A Novel Three-Dimensional Network Containing Pr(III) Ions and Tartrate: Synthesis, Spectroscopic, Thermal, Ab Initio X-ray Powder Structure Analyses, and Photoluminescence Properties, Cryst. Growth Des., 2006, 6(4), 940–945 CrossRef CAS.
- S. Mondal, M. Mukherjee, K. Dhara, S. Ghosh, J. Ratha, P. Banerjee and A. K. Mukherjee, Supramolecular Architecture in an Oxovanadium(V)-Schiff Base Complex: Synthesis, Ab initio Structure Determination from X-ray Powder Diffraction, DNA Binding and Cleavage Activity, Cryst. Growth Des., 2007, 7(9), 1716–1721 CrossRef CAS.
- M. P. Seah, The Quantitative Analysis of Surfaces by XPS: A Review, Surf. Interface Anal., 1980, 2(6), 222–239 CrossRef CAS.
- R. Zanoni, G. Righini, A. Montenero, G. Gnappi, A. Bearzotti, G. Montesperelli and E. Traversa, Surface composition of alkali-doped TiO2 films for sensors investigated by XPS, Sens. Actuators, B, 1995, 24-25, 886–888 CrossRef.
- N. Taguchi, Gas Detecting Devices, US Pat., 363143628, 1971 Search PubMed.
- M. H. Rietveld, A profile refinement method for nuclear and magnetic structures, J. Appl. Crystallogr., 1969, 2, 65–71 CrossRef.
- V. Petricek, M. Dusek and L. Palatinus, Crystallographic Computing System JANA2006: General Features, Z. Kristallogr., 2014, 229(5), 345–352 CAS.
- A. Shirley, High-Resolution X-Ray Photoemission Spectrum of the Valence Bands of Gold, Phys. Rev. B: Condens. Matter Mater. Phys., 1972, 5, 4709–4714 CrossRef.
- A. L. Yang, Y. Yamashita, M. Kobata, T. Matsushita, H. Yoshikawa, I. Píš, M. Imura, T. Yamaguchi, O. Sakata, Y. Nanishi and K. Kobayashi, Investigation of the near-surface structures of polar InN films by chemical-state-discriminated hard X-ray photoelectron diffraction, Appl. Phys. Lett., 2013, 102, 031914 CrossRef.
- R. D. Shannon, Revised Effective Ionic Radii and Systematic Studies of Interatomic Distances in Halides and Chalcogenides, Acta Crystallogr., Sect. A: Found. Adv., 1976, 32, 751–767 CrossRef.
- S. Brunauer, P. H. Emmett and E. Teller, Adsorption of Gases in Multimolecular Layers, J. Am. Chem. Soc., 1938, 60(2), 309–319 CrossRef CAS.
- R. K. Srivastava, P. Lal, R. Dwivedi and S. K. Srivastava, Sensing mechanism in tin oxide-based thick-film gas sensors, Sens. Actuators, B, 1994, 21, 213 CrossRef CAS.
- A. K. Vishwakarma and L. Yadava, Structural and sensing properties of ethanol gas using Pd-doped SnO2 thick film gas sensor, Environ. Sci. Pollut. Res., 2021, 28(4), 3920 CrossRef CAS PubMed.
- Z. U. Abideen, J. H. Kim, A. Mirzaei, H. Woo Kim and S. Sub Kim, Sensing behavior to ppm-level gases and synergistic sensing mechanism in metal-functionalized rGO-loaded ZnO nanofibers, Sens. Actuators, B, 2018, 255, 1884–1896 CrossRef.
- A. Mirzaei, K. Janghorban, B. Hashemi and G. Neri, Metal-core@metal oxide-shell nanomaterials for gas-sensing applications: a review, J. Nanopart. Res., 2015, 17, 1–36 CrossRef CAS.
- L. Liu, T. Zhang, L. Wang and S. Li, Improved ethanol sensing properties of Cu-doped SnO2 nanofibers, Mater. Lett., 2009, 63, 2041–2043 CrossRef CAS.
- M. Ivanovskaya, E. Ovodok and V. Golovanov, The nature of paramagnetic defects in tin(IV) oxide, Chem. Phys., 2015, 457, 98–105 CrossRef CAS.
- R. C. Duvarney, A. K. Garrison and S. B. Harem, Electron Paramagnetic Resonance Study of Al2+ in BeO, Phys. Status Solidi B, 1971, 45, 259 CrossRef CAS.
- M. J. Kang, S. K. Eom, H. S. Kim, C. H. Lee, H. Y. Cha and K. S. Seo, Normally-off Recessed-gate AlGaN/GaN MOS-HFETs with Plasma Enhanced Atomic Layer Deposited AlOxNy Gate Insulator, Semicond. Sci. Technol., 2019, 34, 055018 CrossRef CAS.
- K. Hobson, C. J. Carmalt and C. Bakewell, Recent advances in low oxidation state aluminium chemistry, Chem. Sci., 2020, 11, 6942 RSC.
- D. Liu, Y. Lv, M. Zhang, Y. Liu, Y. Zhu, R. Zong and Y. Zhu, Defects-related photoluminescence and photocatalytic properties of porous ZnO nanosheet, J. Mater. Chem. A, 2014, 2, 15377–15388 RSC.
- X. Wang, S. S. Yee and W. P. Carey, Transition between neck-controlled and grain-boundary-controlled sensitivity of metal-oxide gas sensors, Sens. Actuators, B, 1995, 24-25, 454–457 CrossRef.
- L. Wang, S. Chen, W. Li, K. Wang, Z. Lou and G. Shen, Grain-Boundary-Induced Drastic Sensing Performance Enhancement of Polycrystalline-Microwire Printed Gas Sensors, Adv. Mater., 2019, 31, 1804583 CrossRef PubMed.
- S. Yan and Q. Wu, A novel structure for enhancing the sensitivity of gas sensors – α-Fe2O3 nanoropes containing a large amount of grain boundaries and their excellent ethanol sensing performance, J. Mater. Chem. A, 2015, 3, 5982–5990 RSC.
- D. P. Kumah, A. Malashevich, A. S. Disa, D. A. Arena, F. J. Walker, S. I. Beigi and C. H. Ahn, Effect of surface termination on the electronic properties of LaNiO3 films, Phys. Rev. Appl., 2014, 2, 054004 CrossRef CAS.
- S. Mondal, Charge Transfer and Fractional Bonds in Stoichiometric Boron Carbide, Chem. Mater., 2017, 29, 6191–6194 CrossRef CAS.
- C. J. O’Brien and S. M. Foiles, Exploration of the mechanisms of temperature-dependent grain boundary mobility: search for the common origin of ultrafast grain boundary motion, J. Mater. Sci., 2016, 51, 6607–6623 CrossRef.
Footnote |
| † Electronic supplementary information (ESI) available: The TGA, DLS and BET results are provided along with necessary sample preparation techniques. Surface topography studies, calculations related to inter-granular activation energies, crystallite size estimation, cross sensitivity, PL and UV-Vis analysis have also been provided. See DOI: 10.1039/d1ma00172h |
| This journal is © The Royal Society of Chemistry 2021 |


