DOI:
10.1039/D0MA00614A
(Paper)
Mater. Adv., 2021,
2, 3752-3759
Coupling effects of thermodynamics in multiple ion co-precipitation for precursors towards a layered oxide cathode†
Received
18th August 2020
, Accepted 13th April 2021
First published on 15th April 2021
Abstract
The co-precipitation process is the most frequently employed method to realize the simultaneous stoichiometric crystallization of multiple ions. The precipitation of different elements under a driving force can directly and primarily determine the degree of homogeneity of the co-precipitation product. Unlike individual element crystallization, the multiple ion coexistence co-precipitation process is complicated and a coupling effect is involved, as the thermodynamic behaviour of certain elements is much superior to that of others. This coupling effect can dramatically influence the whole thermodynamic behaviour in the liquid solution. Therefore, in order to achieve a high-quality product or precursor with various elements in a homogeneous distribution, the co-precipitation process can be efficiently controlled and balanced by the coupling effect resulting from the addition of certain elements. In an environment where Co2+, Ni2+, and Mn2+ ions coexist, owing to the thermodynamic coupling effect, the superior high supersaturation of Al3+ and the more negative change in the Gibbs free energy (ΔG) can efficiently balance the whole crystallization reaction by realizing a consistent precipitation driving force among the various ions, accelerating the precipitation of Ni2+ and Mn2+ ions and inhibiting the precipitation of Co2+ ions. Meanwhile, based on the initial formation of the Al(OH)3 seed crystals in the solution, multiple ions in the solution can be adsorbed and thus grow on the surface of Al(OH)3 to completely precipitate. The obtained Li-rich cathode material has demonstrated excellent electrochemical performance which can be attributed to the high quality precursor (0.54MnCO3·0.13NiCO3·0.125CoCO3·0.005Al(OH)3) with a homogeneous distribution of elements.
Introduction
The co-precipitation process is the most conventional and an excellent option when stoichiometric chemistry is involved and has several advantages, including good homogeneity, high purity, high yields of product, high economic efficiency, and a controllable particle size distribution.1–3 By changing different parameters such as the pH value, reaction temperature and time, and concentration of the initial solution and material, the required final product can be accurately optimized and achieved.4–7 Its industrial feasibility and advanced technique mean that this scalable process is commonly employed in the synthesis of functional materials in various fields.8–11 Particularly, in the field of commercial energy storage materials, owing to these inherent advantages, the co-precipitation process is widely utilized to manufacture precursors for final active materials, such as different types of, as well as stoichiometric, LiNixCoyMn1−x−yO2, LiNi0.5Mn1.5O4, and LiNixCoyAl1−x−yO2.12–22 The basic theory of the co-precipitation process is based on aqueous solution thermodynamics, which is closely related to the stability of the substance in aqueous solution. This stability determines the crystallization reaction in the liquid phase and is closely related to the potential, pH value, solution composition and concentration, temperature, and pressure of each substance in the solution.23–25 In addition, the particle size, morphology, and stoichiometry of the precipitated crystalline product can be further affected by a combination of factors, including the precipitation crystallization reaction between the ions in the liquid phase and the deposited crystalline material, the adsorption reaction, and the thermodynamic coupling between the multiple reactions. As the crystal grains gradually grow and new crystal nuclei continuously appear, the coexistence phenomenon causes a competition between the crystallization reaction and the adsorption reaction.26–29 Therefore, how to control the crystallization reaction and adsorption reaction at the same time becomes a key point of the aqueous solution reaction. Crystals form along with the change in the ion concentration in the aqueous solution to form a supersaturated solution. This process can be considered as a Gibbs free energy (ΔG) reduction process. Thermodynamic coupling will be accompanied by and occurs in an environment where multiple ions coexist. The composition of the Gibbs free energy changes (ΔG) can be influenced, for example, accelerated, if one or more of the components of the Gibbs free energy change (ΔG) is very superior to the others.24,30,31 Therefore, in this work, the Gibbs free energy change (ΔG) and coupling coefficient are explored, based on the thermodynamic coupling, ion synergy, and supersaturation. In order to achieve high quality precursors with various elements in a homogenous distribution for Li-rich cathode materials, aluminum (Al) ion doping was employed to control the co-precipitation process and balance the precipitate driving force to realize multiple ion crystallization reactions simultaneously.
Results and discussion
Thermodynamic coupling effects among Mn2+, Ni2+, and Co2+
In the precipitation process under constant temperature and pressure conditions, the crystallization process of Mn2+, Ni2+, and Co2+ can be regarded as a Gibbs free energy (ΔG) reduction process. As shown in Fig. 1, when Mn2+, Ni2+, and Co2+ are separately precipitated using Na2CO3, the following reactions occur, respectively:The corresponding thermodynamic behavior can be described using the Gibbs free energy (ΔG) and reaction temperature (T). Taking MnCO3 as a separate precipitation process, for example, in the early stage of the precipitation reaction, the thermodynamic behavior can be calculated based on eqn (4)–(7):| | ΔG1 = ΔGθ1 − RT![[thin space (1/6-em)]](https://www.rsc.org/images/entities/char_2009.gif) ln(aMn2+·aCO32−) ln(aMn2+·aCO32−) | (4) |
| | ΔG1 = RTKMnCO3 − RT![[thin space (1/6-em)]](https://www.rsc.org/images/entities/i_char_2009.gif) ln(aMn2+·aCO32−) ln(aMn2+·aCO32−) | (5) |
| |  | (6) |
The supersaturation of manganese carbonate can be expressed as:| |  | (7) |
Similarly, for the corresponding processes for CoCO3 and NiCO3, the supersaturation and ΔG can be expressed as:| |  | (8) |
| |  | (9) |
| |  | (10) |
| |  | (11) |
 |
| | Fig. 1 Schematic illustration of the separate precipitation processes for Mn2+, Ni2+, and Co2+, and their corresponding thermodynamic parameters. | |
The separate precipitation parameters can be calculated and confirmed according to eqn (4)–(11) based on the data summarized in Tables S1–S3 in the ESI.† The corresponding values are listed as follows:
| S1 = 8633.3, S2 = 130142.9, S3 = 3.74 |
| ΔG1 = −22466.5 J mol−1, ΔG2 = −29191.5 J mol−1, ΔG3 = −3269.8 J mol−1 |
A similar method was employed when the three elements were co-precipitated simultaneously. When Mn
2+, Ni
2+, and Co
2+ are simultaneously precipitated using Na
2CO
3, the following reactions occur, respectively:
| CO32− + xMn2+ + yNi2+ + (1 − x − y)Co2+ = xMnCO3 + yNiCO3 + (1 − x − y)CoCO3 |
The thermodynamic behavior can be calculated based on
eqn (12)–(17):
| |  | (12) |
| |  | (13) |
| |  | (14) |
| |  | (15) |
| |  | (16) |
| |  | (17) |
The corresponding precipitation parameters can be calculated and confirmed according to eqn (12)–(17) based on the data summarized in Table S4 (ESI†). The corresponding values are listed as follows:
| S4 = 1.4 × 10⁴, S5 = 1.16 × 10⁶, S6 = 69 |
ΔG4 = −23![[thin space (1/6-em)]](https://www.rsc.org/images/entities/char_2009.gif) 664 J mol−1, ΔG5 = −34 664 J mol−1, ΔG5 = −34![[thin space (1/6-em)]](https://www.rsc.org/images/entities/char_2009.gif) 614 J mol−1, ΔG6 = −10 614 J mol−1, ΔG6 = −10![[thin space (1/6-em)]](https://www.rsc.org/images/entities/char_2009.gif) 496 J mol−1 496 J mol−1 |
In
eqn (18), the ratio of Mn to Ni to Co is 3.97
![[thin space (1/6-em)]](https://www.rsc.org/images/entities/char_2009.gif)
:
![[thin space (1/6-em)]](https://www.rsc.org/images/entities/char_2009.gif)
0.93
![[thin space (1/6-em)]](https://www.rsc.org/images/entities/char_2009.gif)
:
![[thin space (1/6-em)]](https://www.rsc.org/images/entities/char_2009.gif)
1,
x = 0.673,
y = 0.158:
| | ΔG = xΔG4 + yΔG5 + (1 − x − y) ΔG6 = −23![[thin space (1/6-em)]](https://www.rsc.org/images/entities/char_2009.gif) 434 J mol−1 434 J mol−1 | (18) |
Δ
G < 0 indicates that the crystallization reaction can be made spontaneous. Meanwhile, based on the summarized data and trend shown in
Fig. 2, it can be concluded that the CoCO
3 precipitation reaction driving force is much stronger than that of MnCO
3, followed by NiCO
3.
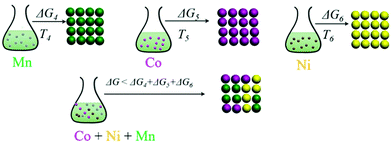 |
| | Fig. 2 Schematic illustration of the simultaneous co-precipitation processes for Mn2+, Ni2+, and Co2+, and the corresponding thermodynamic parameters. | |
It is concluded that CoCO3 is most likely to precipitate during the co-precipitation reaction when multiple ions coexist, followed by MnCO3, and finally NiCO3. Meanwhile, compared with separate precipitation of the metal ions (Fig. 3), ΔG4 < ΔG1, ΔG5 < ΔG2, ΔG6 < ΔG3, it is concluded that the thermodynamic coupling effect exists when the three elements co-precipitate simultaneously. This coupling effect can accelerate the crystallization reaction to a certain extent.
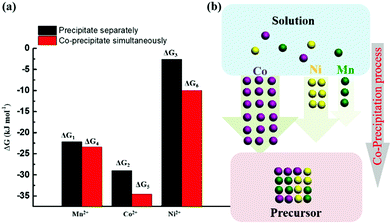 |
| | Fig. 3 (a) ΔG comparison between various elements precipitating separately and co-precipitating simultaneously; (b) schematic diagram of the simultaneous co-precipitation process for Mn2+, Ni2+, and Co2+. | |
Thermodynamic coupling effects caused by Al3+ addition
In a co-precipitation reaction system at constant temperature and pressure, the precursor product is xMnCO3·yNiCO3·zCoCO3·(1 − x − y − z)Al2(CO3)3, which is crystallized by Na2CO3, MnSO4, NiSO4, CoSO4, and Al2(SO4)3. A case study of 1 M xMnCO3·yNiCO3·zCoCO3·(1 − x − y − z)Al2(CO3)3 was produced and the reaction is as follows:| | | xMn2+ + yNi2+ + zCo2+ + (1 − x − y − z)Al3+ + CO32− = xMnCO3 + yNiCO3 + zCoCO3 + (1 − x − y − z)/2Al2(CO3)3 | (19) |
Eqn (19) can be divided into the following individual precipitation reactions:| | | xMn2+ + xCO32− = xMnCO3 | (20) |
| | | yNi2+ + yCO32− = yNiCO3 | (21) |
| | | zCo2+ + zCO32− = zCoCO3 | (22) |
| |  | (23) |
However, Al2(CO3)3 cannot exist in water and tends to produce Al(OH)3 as in eqn (24). The solubility product constant is 3 × 10⁻³⁴.| | | (1 − x − y − z)Al3+ + 3OH− = Al(OH)3 | (24) |
As shown in Fig. 4, individual carbonates or hydroxides can be theoretically achieved. The corresponding thermodynamic behaviour can be described using the Gibbs free energy (ΔG) and reaction temperature (T). Taking the MnCO3 precipitation process for example, in the early stage of the precipitation reaction, the thermodynamic behavior can be calculated based on eqn (25)–(28):| | ΔG7 = ΔGθ7 − RT![[thin space (1/6-em)]](https://www.rsc.org/images/entities/char_2009.gif) ln(aMn2+·aCO32−) ln(aMn2+·aCO32−) | (25) |
| | ΔG7 = RTKMnCO3 − RT![[thin space (1/6-em)]](https://www.rsc.org/images/entities/char_2009.gif) ln(aMn2+·aCO32−) ln(aMn2+·aCO32−) | (26) |
| |  | (27) |
The supersaturation of manganese carbonate can be expressed as:| |  | (28) |
Similarly, for the corresponding processes for CoCO3, NiCO3, and Al(OH)3, the supersaturation and the Gibbs free energy can be expressed as:| |  | (29) |
| |  | (30) |
| |  | (31) |
| |  | (32) |
| |  | (33) |
| |  | (34) |
After chemical analysis and calculations, the concentrations of the various elements in the supernatant are summarized in Table S5 (ESI†) after the co-precipitation reaction, with the Al content being increased from 0.0 to 0.0025, 0.005, and 0.0075. The corresponding ion supersaturation (S) and ΔG values of the reaction processes can be denoted as S0, Sa, Sb, Sc and ΔG0, ΔGa, ΔGb, ΔGc, respectively. All the data were calculated based on the above equations and are summarized in Tables S6 and S7 (ESI†), and the changing trends are described as well in Fig. 5. As shown in Fig. 5(a and b), the Al3+ supersaturation increases first and then decreases while ΔG of Al3+ exhibits an opposite trend with Al3+ content from 0.0025 to 0.0075. Meanwhile, it is obvious that the supersaturation (S) and ΔG values of Mn2+ and Ni2+ change dramatically when even a little amount of Al3+ was added. As shown in the schematic diagram for the precipitation process in Fig. 5c, owing to the thermodynamic coupling effect, the superior high supersaturation of Al3+ and the more negative ΔG represent the driving force to accelerate the precipitation of Ni2+ and Mn2+ ions. Meanwhile, due to the formation of the Al(OH)3 seed crystals and good adsorption capability in the solution, Ni2+ and Mn2+ ions in the solution can be adsorbed and thus grow on the surfaces of Al(OH)3 to completely precipitate. On the other hand, the Co2+ precipitation behavior is opposite to that of Ni2+ and Mn2+ ions. When the Al3+ addition is 0.005, the thermodynamic behavior of the various elements reaches a relatively consistent degree so as to co-precipitate simultaneously. Therefore, it can be concluded that Al3+ doping, even a little amount, can dramatically affect the precipitation of Ni2+, Mn2+, and Co2+ ions. By means of the thermodynamic coupling effect resulting from Al3+ addition, the precipitation consistency of different elements can be balanced and achieved by acceleration or inhibition.
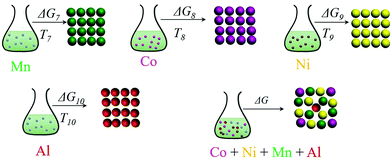 |
| | Fig. 4 Schematic illustration of the precipitation process and the corresponding thermodynamic parameters. | |
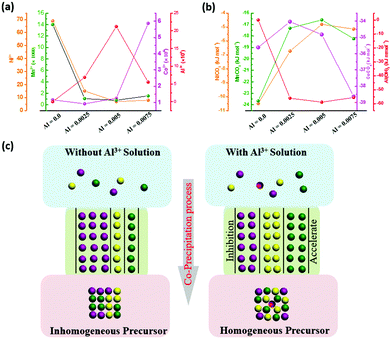 |
| | Fig. 5 (a and b) Trends in the supersaturation (S) and Gibbs free energy (ΔG) change based on the addition of Al3+ ions; and (c) schematic illustration of the co-precipitation process with or without Al3+. | |
The compound produced by the four kinds metal ions crystallization reaction of four kinds of metal ions is xMnCO3·yNiCO3·zCoCO3·(1 − x − y − z)Al(OH)3. ΔG for this reaction can be expressed as:
| | | ΔG = xΔG7 + yΔG8 + zΔG9 + (1− x − y − z)ΔG10 | (35) |
When the Al content is 0, and the corresponding
x = 0.673,
y = 0.158, and
z = 0.169, the result is:
When the Al content is 0.0025, and the corresponding
x = 0.6675,
y = 0.1686, and
z = 0.1635, it follows that:
When the Al content is 0.005, and the corresponding
x = 0.6638,
y = 0.1693, and
z = 0.1660, it follows that:
When the Al content is 0.0075,and the corresponding
x = 0.6670,
y = 0.1693, and
z = 0.1625, it follows that:
With the order is Δ
G0 < Δ
Gc < Δ
Ga < Δ
Gb < 0, it can be concluded that Al
3+ accelerates the whole co-precipitation reaction to a certain extent, and the acceleratory effect is relatively large when the aluminum content is 0.005. With increasing Al content, however, the precipitation of Mn
2+ and Ni
2+ can be slightly enhanced, and it can enhance the Co
2+ precipitation as well until aluminium content reaches 0.005. The element distribution can be investigated by field emission scanning electron microscopy assisted by energy dispersive spectroscopy (FESEM-EDS), as shown in Fig. S1 and S2 (ESI
†). As with the results of thermodynamic calculations, Al
3+ ion addition can dramatically influence the distribution of the various elements in the precursors. By optimizing the amount of Al
3+ addition, the degree of homogeneity of the element distribution changes as well. When the Al
3+ ion addition increases from 0 to 0.005, the distribution of the different elements shows a positive trend, while it becomes negative when the Al
3+ ion addition content reaches as high as 0.0075.
The Li-rich cathode materials were synthesized using the conventional high temperature annealing process from the prepared precursors and stoichiometric Li2CO3. As shown in the X-ray diffraction (XRD) patterns in Fig. 6, all the final Li[Li0.2Mn0.54Ni0.13Co0.13−xAlx]O2 (x = 0, 0.0025, 0.005, 0.0075) samples show similar patterns. The phase of the products is assigned to the α-NaFeO2 layered structure with the rhombohedral R![[3 with combining macron]](https://www.rsc.org/images/entities/char_0033_0304.gif) m space group and a Li2MnO3-like layered structure with the C2/M space group.13,32–35 No diffraction peaks from impurity phases are observed. The Rietveld refinements were based on the XRD patterns. The observed patterns are in good agreement with the calculated pattern, and the parameters Rp, Rwp, and χ2, where Rp and Rwp are the profile and weighted profile R-factors, and χ2 is the goodness-of-fit parameter, are, respectively, 2.82%, 1.75%, and 2.35%, which indicate the satisfactory quality of the Rietveld refinement. The lattice parameters of the sample were calculated and are summarized in Table S8 (ESI†). The morphologies of the samples were examined, and the corresponding FESEM images are shown in Fig. 6 and Fig. S3 (ESI†) as well. The secondary particles, aggregated from a large amount of primary crystals, have sizes in the range of 5–10 μm. In the case of pure sample Li[Li0.2Mn0.54Ni0.13Co0.13]O2, the primary crystals show a regular octahedral structure with sharp edges and corners. The surface of the primary crystal is smooth and intact as well. There is an obvious change, however, once Al3+ ions are added. The sharpness of the octahedral structure becomes weaker with rounded edges and corners. Meanwhile, there is a large number of pores on the surfaces of the primary crystals. For cathode materials for lithium ion batteries, this structure has inherent advantages for electrolyte penetration, which can accelerate the reaction kinetics as well.
m space group and a Li2MnO3-like layered structure with the C2/M space group.13,32–35 No diffraction peaks from impurity phases are observed. The Rietveld refinements were based on the XRD patterns. The observed patterns are in good agreement with the calculated pattern, and the parameters Rp, Rwp, and χ2, where Rp and Rwp are the profile and weighted profile R-factors, and χ2 is the goodness-of-fit parameter, are, respectively, 2.82%, 1.75%, and 2.35%, which indicate the satisfactory quality of the Rietveld refinement. The lattice parameters of the sample were calculated and are summarized in Table S8 (ESI†). The morphologies of the samples were examined, and the corresponding FESEM images are shown in Fig. 6 and Fig. S3 (ESI†) as well. The secondary particles, aggregated from a large amount of primary crystals, have sizes in the range of 5–10 μm. In the case of pure sample Li[Li0.2Mn0.54Ni0.13Co0.13]O2, the primary crystals show a regular octahedral structure with sharp edges and corners. The surface of the primary crystal is smooth and intact as well. There is an obvious change, however, once Al3+ ions are added. The sharpness of the octahedral structure becomes weaker with rounded edges and corners. Meanwhile, there is a large number of pores on the surfaces of the primary crystals. For cathode materials for lithium ion batteries, this structure has inherent advantages for electrolyte penetration, which can accelerate the reaction kinetics as well.
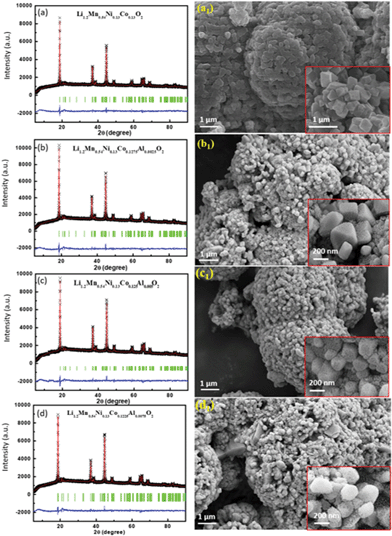 |
| | Fig. 6 XRD patterns with refinements (left, black symbols are the experimental data, the red line is the fitted curve, the green vertical lines are the standard lines, and the blue line is the difference spectrum), and FESEM images (right), with the corresponding enlargements in the insets, of Li[Li0.2Mn0.54Ni0.13Co0.13−xAlx]O2 with different amounts of Al element: 0 (a) to 0.0025 (b), 0.005 (c), and 0.0075 (d). | |
To analyse the surface structure at the atomic scale, high angle annular dark field–scanning transmission electron microscopy (HAADF-STEM) images were employed, as shown in Fig. 7 and Fig. S4 (ESI†). According to the selected area electron diffraction (SAED) patterns in Fig. 7(a and b) and Fig. S3 (ESI†), it is obvious that the Li[Li0.2Mn0.54Ni0.13Co0.13−xAlx]O2 samples show two-phase combination diffraction patterns, which is consistent with the XRD results as well.36 Meanwhile, the distribution of elements in the primary crystals was characterized by high-angle annular dark-field STEM-EDS (HAADF-STEM-EDS) as shown in Fig. 7(e–i) and Fig. S5 (ESI†). All the elements show a similar homogeneous distribution over the entire area.
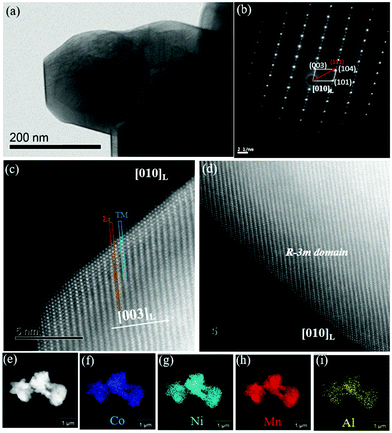 |
| | Fig. 7 (a) STEM image of Li[Li0.2Mn0.54Ni0.13Co0.13−xAlx]O2; (b) the corresponding selected area electron diffraction pattern (SAED); (c and d) the surface structure at the atomic scale in HAADF-STEM images; and (e–i) distributions of various elements. | |
The electrochemical performance was investigated on various samples of Li1.2Mn0.54Co0.13−xNi0.13AlxO2 (x = 0, 0.0025, 0.005, and 0.0075). As shown in Fig. 8(a and b) in the cyclic voltammograms (CVs) in the voltage range of 2.0–4.8 V at various scanning rates, all the samples present the standard lithium-rich cathode pattern.37 Compared with pure Li1.2Mn0.54Co0.13Ni0.13O2 and Li1.2Mn0.54Co0.1225Ni0.13Al0.075O2, Li1.2Mn0.54Co0.1275Ni0.13Al0.0025O2 and Li1.2Mn0.54Co0.125Ni0.13Al0.005O2 show a positive lithiation peak corresponding to a high discharge potential. Fig. 8c shows the initial charge and discharge curves of Li1.2Mn0.54Co0.125Ni0.13Al0.005O2 at different rates over the voltage range of 2.0–4.8 V. They have typical flat voltage plateaus at around 4.5 V, which may be attributed to the two-phase reaction of Li1.2Mn0.54Co0.125Ni0.13Al0.005O2. The Li1.2Mn0.54Co0.125Ni0.13Al0.005O2 sample exhibited discharge capacities of 246.7, 236.6, 210.4, 181.6, and 148.1 mA h g−1 at 0.1C, 0.2C, 0.5C, 1.0C, and 2.0C, respectively. The results demonstrate that Al3+ doping has a significant effect on the discharge capacities of Li1.2Mn0.54Co0.13−xNi0.13AlxO2 at different current rates. This is because the Al element induces changes in the properties of the Li1.2Mn0.54Co0.125Ni0.13Al0.005O2 samples with homogeneous element distributions without impurity phases, which cause more reactions and a shorter distance for fast Li-ion diffusion in the redox reaction process. Fig. 8e and Fig. S6 (ESI†) show the cycling performance of pristine Li1.2Mn0.54Co0.13−xNi0.13AlxO2 (x = 0, 0.0025, 0.005, and 0.0075). Compared with the pure samples, the Al doped materials presented a clearly steady cycling property. The electrochemical impedance spectra of pristine Li1.2Mn0.54Co0.13Ni0.13O2 and Li1.2Mn0.54Co0.13−xNi0.13AlxO2 (x = 0, 0.0025, 0.005 and 0.0075) are shown in Fig. 8f. The impedance spectra with different amounts of Al doping consist of capacitive loops at high frequency and a straight line at low frequency. Impedance values calculated from the equivalent circuits are shown in Table S9 (ESI†). This shows that the Al doping samples exhibit an obvious improvement in the mobility of Li+ diffusion. In general, Al doping has a positive influence on electronic conductivity and the change of the lattice structure in the layered lithium cathode material. As shown by the change of the charge transfer resistance value, the electronic conductivity activation energy of the material is lower. The improvement of electronic conductivity contributes to the better electrochemical performance of the lithium-rich cathode material.
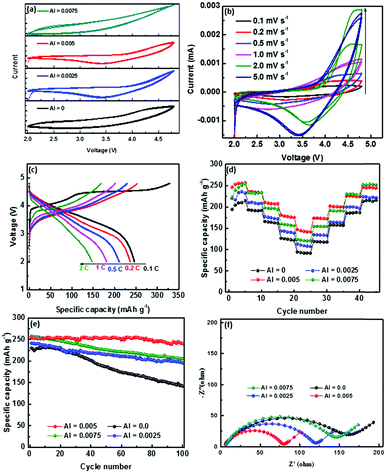 |
| | Fig. 8 (a) CV patterns of Li1.2Mn0.54Co0.13−xNi0.13AlxO2 (x = 0, 0.0025, 0.005, and 0.0075) at 5.0 mV s−1; (b) CV patterns of Li1.2Mn0.54Co0.125Ni0.13Al0.005O2 from 0.1 mV s−1 to 5.0 mV s−1; (c) charge and discharge curves of Li1.2Mn0.54Co0.125Ni0.13Al0.005O2 from 0.1C to 2C; (d) rate performance; (e) cycling performance; and (f) EIS spectra of Li1.2Mn0.54Co0.13−xNi0.13AlxO2 (x = 0, 0.0025, 0.005, and 0.0075). | |
Conclusion
Based on the thermodynamic calculations, it can be concluded that a coupling effect occurs when multiple ions co-exist in the liquid solution and under a simultaneous crystallization reaction. Although there are different driving forces towards precipitation of the various elements, owing to the super-high supersaturation and the more negative ΔG resulting from a small amount of Al3+ addition, the coupling effects can efficiently control and balance the co-precipitation process, accelerating the precipitation of Ni2+ and Mn2+ ions and inhibiting the precipitation of Co2+ ions. Meanwhile, based on the formation of the Al(OH)3 seed crystals in the solution, multiple ions in the solution can adsorb and grow on the surfaces of Al(OH)3 to completely precipitate. When Al3+ addition is 0.005, the obtained (0.54MnCO3·0.13NiCO3·0.125CoCO3·0.005Al(OH)3) precursor has a good homogenous element distribution, which paves the way for the further high electrochemical performance of the Li-rich cathode material.
Experimental section
Synthesis of precursors and Li1.2Mn0.54Ni0.13Co0.13−xAlxO2
Various precursors were synthesized by a co-precipitation process. Stoichiometric amounts of NiSO4·6H2O (>99%), CoSO4·7H2O (>99%), MnSO4·H2O (>99%), and Al2(SO4)3 (>99%) were uniformly mixed and dissolved into deionized water. This mixed metal solution was pumped into a continuously stirred tank reactor. At the same time, Na2CO3 solution as a precipitant and an appropriate amount of NH4OH solution as a pH control agent were also separately fed into the reactor in ambient air. The temperature, pH, and stirring speed of the mixed solution were carefully controlled throughout the entire co-precipitation process. Then, the resultant powders were filtered, washed, and dried at 120 °C in air. Finally, the obtained carbonate precursor was thoroughly mixed with the required Li2CO3 and calcined at 850 °C for 10 h in air. An excess of 5 mol% Li2CO3 was used to compensate for the volatilization of Li during calcination.
Materials characterization
XRD measurements were performed to investigate the crystal structure using a PLXcel 3D X-ray diffractometer with a non-monochromated Cu Kα X-ray source. Crystallographic structure analysis by the Rietveld method was carried out using the Fullprof Suite program. The morphology of the samples was examined using field emission scanning electron microscopy (FE-SEM; JEOL JSM-7500). Transmission electron microscopy (TEM) investigations were performed using a 200 kV JEOL 2011 instrument. Scanning transmission electron microscopy (STEM), EELS, and EDS were performed using a 200 kV JEOL 2011 instrument.
Electrochemical performance measurement
The electrochemical properties were evaluated by using R2032-type coin cells assembled in an argon-filled glove box. Positive electrodes were prepared by mixing 80 wt% active materials, 10 wt% acetylene black, and 10 wt% polyvinylidene fluoride (PVDF) in N-methyl-2-pyrrolidone and coating the slurry on Al foil. The electrodes were dried at 110 °C in vacuum. The mass loading of the electrodes was in the range of 1.2 to 1.5 mg cm−2. The electrolyte was 1 M LiPF6 dissolved in ethylene carbonate (EC)/dimethyl carbonate (DMC) (volume ratio 1![[thin space (1/6-em)]](https://www.rsc.org/images/entities/char_2009.gif) :
:![[thin space (1/6-em)]](https://www.rsc.org/images/entities/char_2009.gif) 1). Li metal was used as the negative electrodes for the half-cells. Celgard 2320 membrane was used as the separator. Galvanostatic charge/discharge tests were performed using a LAND multichannel battery testing system (CT2001A, Wuhan Jinnuo Electronics Co., Ltd). CV curves were acquired with an electrochemical workstation (Bio-logic EC Lab VMP3).
1). Li metal was used as the negative electrodes for the half-cells. Celgard 2320 membrane was used as the separator. Galvanostatic charge/discharge tests were performed using a LAND multichannel battery testing system (CT2001A, Wuhan Jinnuo Electronics Co., Ltd). CV curves were acquired with an electrochemical workstation (Bio-logic EC Lab VMP3).
Conflicts of interest
There are no conflicts to declare.
Acknowledgements
H. Zhao and Q. Zhang made equal contribution to this work. This work was supported by the Fundamental Research Funds for the Central Universities (N2025018) (N2025009), the National Natural Science Foundation of China (No. 51374053), the Iron and Steel Joint Research Fund of the National Natural Science Foundation and China Baowu Steel Group Corporation Limited (No. U1760118). The authors would like to also thank Dr Tania Silver for critical reading of the manuscript, and also acknowledge the use of the facilities in the UOW Electron Microscopy Center, with particular thanks to Dr Gilberto Casillas-Garcia. The manuscript was written through the contributions of all authors. All authors have given approval to the final version of the manuscript.
Notes and references
- Y.-K. Sun, Z. Chen, H.-J. Noh, D.-J. Lee, H.-G. Jung, Y. Ren, S. Wang, C. S. Yoon, S. T. Myung and K. Amine, Nat. Mater., 2012, 11, 942 CrossRef CAS PubMed.
- C. Liu, F. Li, L. P. Ma and H. M. Cheng, Adv. Mater., 2010, 22, E28–E62 CrossRef CAS PubMed.
- J. Deng, W. B. Luo, X. Lu, Q. Yao, Z. Wang, H. K. Liu, H. Zhou and S.-X. Dou, Adv. Energy Mater., 2018, 8, 1701610 CrossRef.
- W. Li, X. Liu, H. Celio, P. Smith, A. Dolocan, M. Chi and A. Manthiram, Adv. Energy Mater., 2018, 8, 1703154 CrossRef.
- J. Zhang, Z. Yang, R. Gao, L. Gu, Z. Hu and X. Liu, ACS Appl. Mater. Interfaces, 2017, 9, 29794–29803 CrossRef CAS PubMed.
- A. Boulineau, L. Simonin, J. F. Colin, E. Canévet, L. Daniel and S. Patoux, Chem. Mater., 2012, 24, 3558–3566 CrossRef CAS.
- J. Zheng, S. Myeong, W. Cho, P. Yan, J. Xiao, C. Wang, J. Cho and J. G. Zhang, Adv. Energy Mater., 2017, 7, 1601284 CrossRef.
- E. A. Olivetti, G. Ceder, G. G. Gaustad and X. Fu, Joule, 2017, 1, 229–243 CrossRef.
- J. Deng, W. B. Luo, S. L. Chou, H. K. Liu and S.-X. Dou, Adv. Energy Mater., 2018, 8, 1701428 CrossRef.
- P. Hou, H. Zhang, Z. Zi, L. Zhang and X. Xu, J. Mater. Chem. A, 2017, 5, 4254–4279 RSC.
- M. H. Lee, Y. J. Kang, S. T. Myung and Y. K. Sun, Electrochem. Acta, 2004, 50, 939–948 CrossRef CAS.
- X. Zeng, C. Zhan, J. Lu and K. Amine, Chem, 2018, 4, 690–704 CAS.
- R. Malik, Joule, 2017, 1, 647–648 CrossRef CAS.
- J. L. Shi, D. D. Xiao, M. Ge, X. Yu, Y. Chu, X. Huang, X. D. Zhang, Y. X. Yin, X. Q. Yang, Y. G. Guo, L. Gu and L. L. J. Wan, Adv. Mater., 2018, 30, 1705575 CrossRef PubMed.
- H. H. Ryu, K. J. Park, C. S. Yoon and Y. K. Sun, Chem. Mater., 2018, 30, 1155–1163 CrossRef CAS.
- H. H. Sun and A. Manthiram, Chem. Mater., 2017, 29, 8486–8493 CrossRef CAS.
- C. S. Yoon, K. J. Park, U. H. Kim, K. H. Kang, H. H. Ryu and Y. K. Sun, Chem. Mater., 2017, 29, 10436–10445 CrossRef CAS.
- W. Yan, Y. Xie, J. Jiang, D. Sun, X. Ma, Z. Lan and Y. Jin, ACS Sustainable Chem. Eng., 2018, 6, 4625–4632 CrossRef CAS.
- M. D. Radin, J. Alvarado, Y. S. Meng and A. VanderVen, Nano Lett., 2017, 17, 7789–7795 CrossRef CAS PubMed.
- X. H. Zhang, W. L. Pang, F. Wan, J. Z. Guo, H. Y. Lü, J. Y. Li, Y. M. Xing, J. P. Zhang and X. L. Wu, ACS Appl. Mater. Interfaces, 2016, 8, 20650–20659 CrossRef CAS PubMed.
- W. L. Pang, X. H. Zhang, J. Z. Guo, J. Y. Li, X. Yan, B. H. Hou, H. Y. Guan and X. L. Wu, J. Power Sources, 2017, 356, 80–88 CrossRef CAS.
- M. Eilers-Rethwisch, M. Winter and F. M. Schappacher, J. Power Sources, 2018, 387, 101–107 CrossRef CAS.
- K. Henzler, E. O. Fetisov, M. Galib, M. D. Baer, B. A. Legg, C. Borca, J. M. Xto, S. Pin, J. L. Fulton, G. K. Schenter, N. Govind, J. I. Siepmann, C. J. Mundy, T. Huthwelker and J. J. DeYoreo, Sci. Adv., 2018, 4, 6283 CrossRef PubMed.
- C. Schwarze, A. Gupta, T. Hickel and R. Darvishi Kamachali, Phys. Rev. B, 2017, 95, 174101 CrossRef.
- A. Carino, A. Testino, M. R. Andalibi, F. Pilger, P. Bowen and C. Ludwig, Cryst. Growth Des., 2017, 17, 2006–2015 CrossRef CAS.
- G. Wang, Y. Liu, C. Gao, L. Guo, M. Chi, K. Ijiro, M. Maeda and Y. Yin, Chem, 2017, 3, 678–690 CAS.
- A. Naillon, P. Joseph and M. Prat, J. Cryst. Growth, 2017, 463, 201–210 CrossRef CAS.
- S. Al-Jibbouri and J. Ulrich, Cryst. Res. Technol., 2001, 36, 1365–1375 CrossRef CAS.
- F. Fu, Q. Wang, Y. P. Deng, C. H. Shen, X. X. Peng, L. Huang and S. G. Sun, J. Mater. Chem. A, 2015, 3, 5197–5203 RSC.
- H. Chen, P. Feng, S. Ye and W. Sun, Constr. Build. Mater., 2018, 185, 391–401 CrossRef CAS.
- S. Shu, P. B. Wells, N. Almirall, G. R. Odette and D. D. Morgan, Acta Mater., 2018, 157, 298–306 CrossRef CAS.
- W. H. Kan, B. Deng, Y. Xu, A. K. Shukla, T. Bo, S. Zhang, J. Liu, P. Pianetta, B. T. Wang, Y. Liu and G. Chen, Chem, 2018, 4(9), 2108–2123 CAS.
- Y. Zuo, B. Li, N. Jiang, W. Chu, H. Zhang, R. Zou and D. Xia, Adv. Mater., 2018, 30, 1707255 CrossRef PubMed.
- J. An, L. Shi, G. Chen, M. Li, H. Liu, S. Yuan, S. Chen and D. Zhang, J. Mater. Chem. A, 2017, 5, 19738–19744 RSC.
- S. Kim, W. Cho, X. Zhang, Y. Oshima and J. W. Choi, Nat. Commun., 2016, 7, 13598 CrossRef CAS PubMed.
- Y. Zhao, J. Liu, S. Wang, R. Ji, Q. Xia, Z. Ding, W. Wei, Y. Liu, P. Wang and D. G. Ivey, Adv. Funct. Mater., 2016, 26, 4760–4767 CrossRef CAS.
- X. Yu, Y. Lyu, L. Gu, H. Wu, S. M. Bak, Y. Zhou, K. Amine, S. N. Ehrlich, H. Li, K. W. Nam and X. Q. Yang, Adv. Energy Mater., 2014, 4, 1300950 CrossRef.
Footnote |
| † Electronic supplementary information (ESI) available: These might include comments relevant to but not central to the matter under discussion, limited experimental and spectral data, and crystallographic data. See DOI: 10.1039/d0ma00614a |
|
| This journal is © The Royal Society of Chemistry 2021 |
Click here to see how this site uses Cookies. View our privacy policy here.  Open Access Article
 b,
Xuan-Wen
Gao
*a,
Jian-Zhong
Li
a,
Hua-Kun
Liu
b and
Wen-Bin
Luo
*ab
![[thin space (1/6-em)]](https://www.rsc.org/images/entities/char_2009.gif) ln(aMn2+·aCO32−)
ln(aMn2+·aCO32−)![[thin space (1/6-em)]](https://www.rsc.org/images/entities/i_char_2009.gif) ln(aMn2+·aCO32−)
ln(aMn2+·aCO32−)


![[thin space (1/6-em)]](https://www.rsc.org/images/entities/char_2009.gif) 664 J mol−1, ΔG5 = −34
664 J mol−1, ΔG5 = −34![[thin space (1/6-em)]](https://www.rsc.org/images/entities/char_2009.gif) 614 J mol−1, ΔG6 = −10
614 J mol−1, ΔG6 = −10![[thin space (1/6-em)]](https://www.rsc.org/images/entities/char_2009.gif) 496 J mol−1
496 J mol−1![[thin space (1/6-em)]](https://www.rsc.org/images/entities/char_2009.gif) :
:![[thin space (1/6-em)]](https://www.rsc.org/images/entities/char_2009.gif) 0.93
0.93![[thin space (1/6-em)]](https://www.rsc.org/images/entities/char_2009.gif) :
:![[thin space (1/6-em)]](https://www.rsc.org/images/entities/char_2009.gif) 1, x = 0.673, y = 0.158:
1, x = 0.673, y = 0.158:![[thin space (1/6-em)]](https://www.rsc.org/images/entities/char_2009.gif) 434 J mol−1
434 J mol−1

![[thin space (1/6-em)]](https://www.rsc.org/images/entities/char_2009.gif) ln(aMn2+·aCO32−)
ln(aMn2+·aCO32−)![[thin space (1/6-em)]](https://www.rsc.org/images/entities/char_2009.gif) ln(aMn2+·aCO32−)
ln(aMn2+·aCO32−)


![[3 with combining macron]](https://www.rsc.org/images/entities/char_0033_0304.gif) m space group and a Li2MnO3-like layered structure with the C2/M space group.13,32–35 No diffraction peaks from impurity phases are observed. The Rietveld refinements were based on the XRD patterns. The observed patterns are in good agreement with the calculated pattern, and the parameters Rp, Rwp, and χ2, where Rp and Rwp are the profile and weighted profile R-factors, and χ2 is the goodness-of-fit parameter, are, respectively, 2.82%, 1.75%, and 2.35%, which indicate the satisfactory quality of the Rietveld refinement. The lattice parameters of the sample were calculated and are summarized in Table S8 (ESI†). The morphologies of the samples were examined, and the corresponding FESEM images are shown in Fig. 6 and Fig. S3 (ESI†) as well. The secondary particles, aggregated from a large amount of primary crystals, have sizes in the range of 5–10 μm. In the case of pure sample Li[Li0.2Mn0.54Ni0.13Co0.13]O2, the primary crystals show a regular octahedral structure with sharp edges and corners. The surface of the primary crystal is smooth and intact as well. There is an obvious change, however, once Al3+ ions are added. The sharpness of the octahedral structure becomes weaker with rounded edges and corners. Meanwhile, there is a large number of pores on the surfaces of the primary crystals. For cathode materials for lithium ion batteries, this structure has inherent advantages for electrolyte penetration, which can accelerate the reaction kinetics as well.
m space group and a Li2MnO3-like layered structure with the C2/M space group.13,32–35 No diffraction peaks from impurity phases are observed. The Rietveld refinements were based on the XRD patterns. The observed patterns are in good agreement with the calculated pattern, and the parameters Rp, Rwp, and χ2, where Rp and Rwp are the profile and weighted profile R-factors, and χ2 is the goodness-of-fit parameter, are, respectively, 2.82%, 1.75%, and 2.35%, which indicate the satisfactory quality of the Rietveld refinement. The lattice parameters of the sample were calculated and are summarized in Table S8 (ESI†). The morphologies of the samples were examined, and the corresponding FESEM images are shown in Fig. 6 and Fig. S3 (ESI†) as well. The secondary particles, aggregated from a large amount of primary crystals, have sizes in the range of 5–10 μm. In the case of pure sample Li[Li0.2Mn0.54Ni0.13Co0.13]O2, the primary crystals show a regular octahedral structure with sharp edges and corners. The surface of the primary crystal is smooth and intact as well. There is an obvious change, however, once Al3+ ions are added. The sharpness of the octahedral structure becomes weaker with rounded edges and corners. Meanwhile, there is a large number of pores on the surfaces of the primary crystals. For cathode materials for lithium ion batteries, this structure has inherent advantages for electrolyte penetration, which can accelerate the reaction kinetics as well.![[thin space (1/6-em)]](https://www.rsc.org/images/entities/char_2009.gif) :
:![[thin space (1/6-em)]](https://www.rsc.org/images/entities/char_2009.gif) 1). Li metal was used as the negative electrodes for the half-cells. Celgard 2320 membrane was used as the separator. Galvanostatic charge/discharge tests were performed using a LAND multichannel battery testing system (CT2001A, Wuhan Jinnuo Electronics Co., Ltd). CV curves were acquired with an electrochemical workstation (Bio-logic EC Lab VMP3).
1). Li metal was used as the negative electrodes for the half-cells. Celgard 2320 membrane was used as the separator. Galvanostatic charge/discharge tests were performed using a LAND multichannel battery testing system (CT2001A, Wuhan Jinnuo Electronics Co., Ltd). CV curves were acquired with an electrochemical workstation (Bio-logic EC Lab VMP3).


