 Open Access Article
Carbon-layered double hydroxide nanocomposite for efficient removal of inorganic and organic based water contaminants – unravelling the adsorption mechanism†
Sukanya
Kundu
ab and
Milan Kanti
Naskar
 *ab
*ab
aCSIR-Central Glass and Ceramic Research Institute, Kolkata 700 032, India. E-mail: milan@cgcri.res.in; Tel: +91 33 2473 3496 (ext. 3516)
bAcademy of Scientific and Innovative Research (AcSIR), Ghaziabad-201002, India
First published on 7th April 2021
Abstract
Carbon-layered double hydroxide (C-LDH) nanocomposites were synthesized by a simple homogeneous co-precipitation process using as-prepared porous carbon and Al, Mg and Ca precursor salts of the LDH. The synthesized adsorbent was used for the removal of inorganic (fluoride, arsenic, and iron) and organic (cationic dye methylene blue, MB, and anionic dye methyl orange, MO) based water contaminants separately and simultaneously from water. Microstructural analysis revealed the formation of nano-flake-like LDH particles (dia. = 10–15 nm and length = 50–100 nm) adhered onto the surface of carbon nanospheres (50–150 nm). The surface area of the products was in the range of 758–477 m2 g−1. It rendered maximum adsorption capacities of 22.37, 20.40, 80, 122.1 and 328.95 mg g−1 for As(V), F−, Fe(II)/Fe(III), MB and MO, respectively. It was used for simultaneous removal of multiple contaminants like As(V), F−, Fe(II)/Fe(III), MB and MO from water with % adsorption up to 99.99%. This study illustrates a synergetic effect of the composition (C![[thin space (1/6-em)]](https://www.rsc.org/images/entities/char_2009.gif) :
:![[thin space (1/6-em)]](https://www.rsc.org/images/entities/char_2009.gif) LDH mol ratio) and surface properties (total surface area and mesopore
LDH mol ratio) and surface properties (total surface area and mesopore![[thin space (1/6-em)]](https://www.rsc.org/images/entities/char_2009.gif) :
:![[thin space (1/6-em)]](https://www.rsc.org/images/entities/char_2009.gif) micropore surface area ratio) of the adsorbent on the relative adsorption of various pollutants.
micropore surface area ratio) of the adsorbent on the relative adsorption of various pollutants.
Introduction
Water pollution by organic and inorganic contaminants has drawn global concern in recent years. Various metal ions and organic toxic pollutants are discharged into the environment, which are very harmful to human beings and aquatic life, leading to severe damage for whole eco-systems.1–3 Over the last few decades, the level of water pollution has increased worldwide at an alarming rate due to rapid industrialization. Different inorganic (arsenic, fluoride, iron, lead, cadmium, chromium etc.) and organic (phenol, pesticides, fungicides, dyes etc.) based contaminants released as agro-industrial wastes are the major sources of water pollution. The presence of arsenic and fluoride, and organic dyes like methylene blue and methyl orange in water causes a serious hazardous effect on living beings.Numerous approaches have been developed for removal of water contaminants like ion exchange,4–6 coprecipitation,7,8 electrocoagulation,9 membrane separation,10–12 adsorption,2,13–15 photocatalysis16etc. However, most methods have limitations due to the high investment cost, secondary pollution and poor efficiency. Accordingly, these methods are restricted towards application in waste water treatment. However, adsorption is considered as the most efficient and promising method due to its large adaptability in small scale treatment plants, low cost, simple design, regeneration ability and ease of operation.17 Several adsorbents including alumina, activated carbon, clay, zeolites etc. have been widely used for removal of water contaminants. Nanomaterials are found to be effective adsorbents for water decontamination due to their high surface to volume ratio. A wide number of studies have reported the removal of water contaminants using carbon-based nano-adsorbents containing a high surface area and the presence of abundant surface functional groups. For the removal of water contaminants, specifically organic pollutants, carbon-based nano-adsorbents are used because of their high surface area.18 However, due to the presence of high microporosity (<2 nm pore size) and absence of any ionic counterparts in carbon, carbon based adsorbents have some limitation for the adsorption of most inorganic water pollutants via electrostatic interactions. In recent time, inorganic layered double hydroxide (LDH) based materials have gained interest due to their unique physicochemical properties.19 Generally, LDHs are represented as [M2+(1−X)M3+(X) (OH)2]x+(An−)X/n·yH2O, where M2+, M3+ and An− represent the divalent (Co2+, Cu2+, Ca2+, Mg2+, Zn2+, Ni2+, Mn2+) metal cations, trivalent metal cations (Al3+, Mn3+, Co3+, Fe3+, Cr3+) and the intercalating anions, respectively. LDH based adsorbents showed effective adsorption efficiency towards the removal of anionic contaminants or cationic pollutants via ion exchange with M2+ ions in the LDH due to the presence of a large interlayer space with exchangeable anions and a positively charged layer.20,21 However, LDH based materials due to their lower surface area than carbon based adsorbents have some restrictions for the removal of organic water pollutants. It is worth mentioning that the multiple oxygenic functional groups on the surface of carbon could help facilitate the formation of carbon based composites in the presence of other adsorbent materials like LDHs. Therefore, carbon based LDH composites (C-LDH) could be effective for the removal of water contaminants via physical adsorption of metal ions on the carbon surface as well as exchange of metal ions with the interlayer anions of the LDH through the formation of chemical bonding with surface hydroxyl groups or other oxygen groups on the carbon surface.22,23 The synergistic effect of both the adsorbents i.e., porous carbon and a layered double hydroxide in the form of a composite could improve their adsorption capacity by removing different inorganic and organic water contaminants simultaneously. Huang et al.24 demonstrated the removal of Pb(II) and humic acid from aqueous solution using layered double hydroxide/hollow carbon microsphere composites. An Fe3O4@C@layered double hydroxide composite was used as a magnetic adsorbent for the removal of uranium.25
With the above motivation, the objective of the present work is to synthesize an effective adsorbent i.e., carbon-layered double hydroxide (C-LDH) nanocomposite for simultaneous removal of inorganic (As(V), Fe(II)/Fe(III) and F−) and organic (methylene blue, MB, and methyl orange, MO, dyes) water contaminants. The efficiency of the nanocomposite materials has been investigated by varying different parameters like time, pollutant concentration, temperature and pH of the solution. In this study, a synergetic effect of the composition (C![[thin space (1/6-em)]](https://www.rsc.org/images/entities/char_2009.gif) :
:![[thin space (1/6-em)]](https://www.rsc.org/images/entities/char_2009.gif) LDH mol ratio) and the surface properties (BET surface area and mesoporous: microporous surface area ratio) of the composite has been illustrated for the adsorption of different water contaminants. A mechanistic understanding of the adsorption process for simultaneous removal of different water pollutants has been highlighted. The present work is significant in developing a unique adsorbent material for the removal of all possible water contaminants originating from industrial effluents as well as contaminated natural ground water to be used for domestic purposes.
LDH mol ratio) and the surface properties (BET surface area and mesoporous: microporous surface area ratio) of the composite has been illustrated for the adsorption of different water contaminants. A mechanistic understanding of the adsorption process for simultaneous removal of different water pollutants has been highlighted. The present work is significant in developing a unique adsorbent material for the removal of all possible water contaminants originating from industrial effluents as well as contaminated natural ground water to be used for domestic purposes.
Materials and methods
Materials
Aluminium nitrate nonahydrate (Al(NO3)3·9H2O, assay >99%), calcium nitrate tetrahydrate (Ca(NO3)2·4H2O, assay 99.0–102.0%), magnesium nitrate hexahydrate (Mg(NO3)2·6H2O, assay ≥98.5%), ammonium hydroxide (NH4OH, 25%), methylene blue, methyl orange, sodium fluoride (NaF, assay ≥97%), ferrous sulphate (FeSO4·7H2O, assay 99.5–102.0%) and arsenic (1000 mg L−1) standard solution were purchased from Merck, India, while sodium arsenate heptahydrate (Na2HAsO4·7H2O, 98–102.0%) was obtained from Loba Chemie. Millipore water was used throughout the experiment.Synthesis procedure
The carbon-layered double hydroxide (C-LDH) composite was synthesized by a simple homogeneous precipitation process. A solution of Al(NO3)2, Mg(NO3)2 and Ca(NO3)2 was prepared with 70 mL Millipore water maintaining their molar ratio of 1![[thin space (1/6-em)]](https://www.rsc.org/images/entities/char_2009.gif) :
:![[thin space (1/6-em)]](https://www.rsc.org/images/entities/char_2009.gif) 1.33
1.33![[thin space (1/6-em)]](https://www.rsc.org/images/entities/char_2009.gif) :
:![[thin space (1/6-em)]](https://www.rsc.org/images/entities/char_2009.gif) 0.66, respectively (Solution A). As-prepared porous carbon (ESI†)26 was added into solution A under stirring for 24 h maintaining different molar concentrations (0.015 to 0.06 mol) with respect to one unit of LDH (as prepared in solution A). 2 mL NH4OH (25 wt%) in 20 mL water was added dropwise into it followed by warming at 60 °C for 4 h under stirring (Solution B). After that, the products (C-LDH nanocomposite) were collected via washing with water and drying at 100 °C. Thus, four different samples were prepared designated as C4x-LDH, C2x-LDH, C3x/2-LDH and Cx-LDH with carbon contents of 0.06, 0.03, 0.02 and 0.015 mol, respectively, where x is the amount of carbon (in mol) with respect to 1 Al3+
0.66, respectively (Solution A). As-prepared porous carbon (ESI†)26 was added into solution A under stirring for 24 h maintaining different molar concentrations (0.015 to 0.06 mol) with respect to one unit of LDH (as prepared in solution A). 2 mL NH4OH (25 wt%) in 20 mL water was added dropwise into it followed by warming at 60 °C for 4 h under stirring (Solution B). After that, the products (C-LDH nanocomposite) were collected via washing with water and drying at 100 °C. Thus, four different samples were prepared designated as C4x-LDH, C2x-LDH, C3x/2-LDH and Cx-LDH with carbon contents of 0.06, 0.03, 0.02 and 0.015 mol, respectively, where x is the amount of carbon (in mol) with respect to 1 Al3+![[thin space (1/6-em)]](https://www.rsc.org/images/entities/char_2009.gif) :
:![[thin space (1/6-em)]](https://www.rsc.org/images/entities/char_2009.gif) 1.33 Mg2+
1.33 Mg2+![[thin space (1/6-em)]](https://www.rsc.org/images/entities/char_2009.gif) :
:![[thin space (1/6-em)]](https://www.rsc.org/images/entities/char_2009.gif) 0.66 Ca2+ (mol ratio) of the LDH.
0.66 Ca2+ (mol ratio) of the LDH.
Characterization
The synthesized products were characterized by XRD (PhilipsX'Pert Pro PW 3050/60, using Ni-filtered Cu-Kα radiation, λ = 0.15418 nm), FTIR (Spectrum Two, PerkinElmer), N2 adsorption–desorption, XPS (ULVAC-PHI), FESEM (model: Zeiss, SupraTM 35VP, Oberkochen, Germany) and TEM (Tecnai G2 30ST (FEI)). In the study of N2 adsorption–desorption, the BET (Brumauer–Emmett–Teller) method was used to measure the specific surface area of the samples, while the BJH (Barrett–Joyner–Halenda) method was adopted to evaluate the pore size distributions of the C-LDH samples. The aluminum, magnesium and carbon contents of the sample were analysed using an inductively coupled plasma atomic emission spectrometer (ICP-AES), ARCOS 130 MV, Spectro Analytical Instruments GmbH, Kleve, Germany, and the carbon content was analysed using a C-600 Carbon Analyser, Leco, USA.To record UV-visible spectra, a UV-vis spectrophotometer (Jasco V-730) was used within the wavelength range of 195 to 1100 nm.
Adsorption experiment
The experiments for the adsorption of arsenate, fluoride, iron, methyl orange and methylene blue on the C-LDH composites were carried out by changing different experimental parameters like the time, adsorbate and adsorbent concentration, pH and temperature (the pollutant concentration, adsorbent dose, time, pH and temperature for each experiment are given in the respective section of the Results and discussion part). After the specified time interval, the adsorbents were separated from the aqueous solution by filtration. The absorbance values were measured at the absorption maxima of the respective pollutants. The concentration of pollutant in the filtrate was measured using a UV-vis spectrophotometer. The adsorption capacity (qt in mg g−1) and % removal of pollutants were estimated by the following equations.| qt = (Co − Ct)·V/m | (1) |
| % of pollutants adsorbed = (Co − Ce)/100 Co | (2) |
Results and discussion
Characterization of the synthesized C-LDH composite
The XRD pattern of the synthesized C-LDH composites is shown in Fig. 1a. The characteristic peaks of layered double hydroxides (LDH) with 2θ values of 11.5, 23.4, 34.9, 39.6, 60.9 and 61.1 corresponding to hkl planes of (003), (006), (101), (012), (015), (110) and (113), respectively, are identified.27 Fig. S1, ESI,† presents the plot of normalized intensity vs. 2θ (degrees). By changing different molar compositions of C![[thin space (1/6-em)]](https://www.rsc.org/images/entities/char_2009.gif) :
:![[thin space (1/6-em)]](https://www.rsc.org/images/entities/char_2009.gif) LDH, there is no significant changes in the XRD peak position of the composites. However, the characteristic peak intensity of the LDH increases with an increase in the content of the LDH in the composites. FTIR spectra of the C-LDH composites are shown in Fig. 1b. The absorption bands at 446 and 654 cm−1 correspond to the Al–O and Mg–O lattice vibrations, whereas the peak position at 1379 cm−1 is due to the presence of nitrate/carbonate anions in the composites.27 The wide absorption band at 3446 cm−1 and the sharp band at 1629 cm−1 are the characteristic stretching and bending vibrations of O–H bonds, respectively.
LDH, there is no significant changes in the XRD peak position of the composites. However, the characteristic peak intensity of the LDH increases with an increase in the content of the LDH in the composites. FTIR spectra of the C-LDH composites are shown in Fig. 1b. The absorption bands at 446 and 654 cm−1 correspond to the Al–O and Mg–O lattice vibrations, whereas the peak position at 1379 cm−1 is due to the presence of nitrate/carbonate anions in the composites.27 The wide absorption band at 3446 cm−1 and the sharp band at 1629 cm−1 are the characteristic stretching and bending vibrations of O–H bonds, respectively.
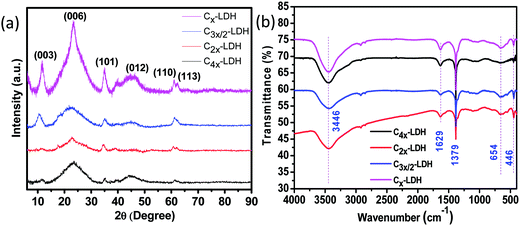 | ||
| Fig. 1 (a) XRD pattern and (b) FTIR spectra of the C-LDH composites: C4x-LDH, C2x-LDH, C3x/2-LDH and Cx-LDH. | ||
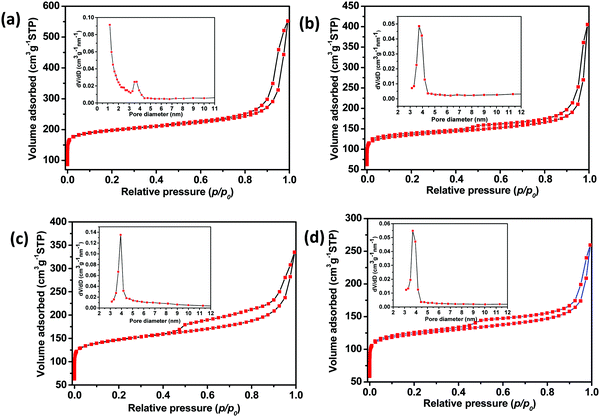
Fig. 2 shows N2 adsorption–desorption isotherms of the four different C-LDH composites; the insets reveal the BJH pore size distribution (desorption) of the respective samples. The isotherms reveal pseudo-type I and pseudo-type IV isotherms, indicating the presence of microporosity and mesoporosity in the samples, respectively. It signifies that both micropores and mesopores are present in each sample. Notably, for all the samples C4x-LDH, C2x-LDH, C3x/2-LDH and Cx-LDH, there occurs a steep rise of the isotherms at lower relative pressure (p/po < 0.01) and at higher relative pressure (p/po < 0.8); the former is due to the presence of microporosity while the latter demonstrates interparticle mesoporosity in the samples. Table 1 gives the BET surface area, pore volume and pore diameter of the samples. The porous carbon sample used for the preparation of the C-LDH composite has a BET surface area and pore volume of 752 m2 g−1 and 1.155 cc g−1, respectively.26 During formation of the C-LDH composite, the molecular species of the LDH precursors could block partly28 the interparticle mesopores of carbon particles, thereby decreasing the BET mesopore surface area and pore volume of the composite (Table 1). The pore diameter of the samples is in the range of 3.6–3.9 nm while sample C4x-LDH shows a bimodal pore size distribution at around 1.2 nm and 3.6 nm (inset of Fig. 2a). It is to be noted that except for sample C3x/2-LDH there is a decreasing trend of the total BET surface area, micropore surface area and mesopore surface area in the order of C4x-LDH > C2x-LDH > Cx-LDH. However, the pore volumes for all the samples decrease in the order of C4x-LDH > C2x-LDH > C3x/2-LDH > Cx-LDH. It is worth mentioning that, with the decrease of the carbon content in the composite, the total BET surface area, micropore surface area, mesopore surface area and pore volume decreased. The anomalous result of sample C3x/2-LDH in terms of total surface area, and mesopore and micropore surface area could be due to the shape of the pore geometry. Interestingly, Fig. 2c shows that the hysteresis loop of sample C3x/2-LDH is more expanded compared to the other samples. It is worth mentioning that all the samples depict H3 type hysteresis loops, indicating slit like mesopores. For sample C3x/2-LDH, the more expanded hysteresis loop of the isotherm indicates a higher degree of capillary condensation of N2 in the mesopores compared to that of sample C2x-LDH, rendering the maximum ratio of the mesopore to micropore surface area (Smesopore/Smicropore) value. As the micropore surface area values of C2x-LDH and C3x/2-LDH are comparable, the higher mesopore surface area of C3x/2-LDH contributed a higher BET surface area than that of sample C2x-LDH. It is worth noting that an optimum concentration of carbon with respect to the LDH showed maximum Smesopore/Smicropore, rendering maximum removal efficiency.
| Sample ID | Surface area (m2g−1) | V p (cm3g−1) | Pore diameter (nm) | |||
|---|---|---|---|---|---|---|
| S BET | S micropore | S mesopore | S mesopore/Smicropore | |||
| Note: SBET = BET surface area, Smicropore = micropore surface area, Smesopore = mesopore surface area and Vp = total pore volume. | ||||||
| C4x-LDH | 758 | 611 | 147 | 0.240 | 0.857 | 1.2/3.6 |
| C2x-LDH | 520 | 424 | 96 | 0.226 | 0.628 | 3.7 |
| C3x/2-LDH | 558 | 430 | 128 | 0.297 | 0.519 | 3.9 |
| Cx-LDH | 477 | 397 | 80 | 0.201 | 0.402 | 3.7 |
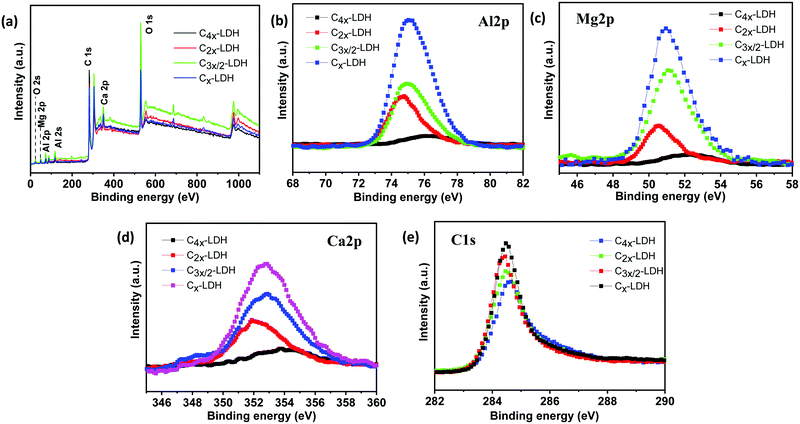
An XPS study was performed to investigate the surface elemental states of the C-LDH composites. Fig. 3a shows the presence of Al, Mg, Ca, O and C in all four samples. Fig. 3b–e reveal that the binding energies of Al2p, Mg2p, Ca2p and C1s are found to be 75.07, 50.94, 352.85 and 284.49 eV, respectively. Interestingly, the binding energies of the above elemental states shifted slightly from their standard values. It could be due to compositional variations and the change in the chemical environment. In this case the sharing of elements with neighboring atoms is different in the composite samples. The binding energy of the deconvoluted peak of Al2p for the four different samples shows that aluminum is present in the form of Al(OH)3 (BE: 74.8 ± 0.1 eV) and AlOOH (BE: 75.2 ± 1.2 eV). AlOOH is formed due to addition of excess ammonium hydroxide (NH4OH) during the synthesis process. Interestingly, the C4x-LDH sample contains mostly AlOOH instead of Al(OH)3. On the other hand, the binding energy of Mg2p and Ca2p for the four different C-LDH shows that magnesium and calcium are present in the form of Mg2+ (Mg(OH)2, BE: 50.49–51.4 eV) and Ca2+ (Ca(OH)2, BE: 352.6–354.12 eV). The quantitative estimation from XPS study for all four samples is shown in Table S1, ESI.† It was observed that the atomic% of carbon increases in the order of C4x-LDH > C2x-LDH > C3x/2-LDH > Cx-LDH. However, a little deviation in the Al![[thin space (1/6-em)]](https://www.rsc.org/images/entities/char_2009.gif) :
:![[thin space (1/6-em)]](https://www.rsc.org/images/entities/char_2009.gif) Mg
Mg![[thin space (1/6-em)]](https://www.rsc.org/images/entities/char_2009.gif) :
:![[thin space (1/6-em)]](https://www.rsc.org/images/entities/char_2009.gif) Ca atomic ratio is noticed for these samples. During the measurement, removal of surface oxides and contaminants by Ar+ ion etching could cause a number of side effects altering the composition of the upper surface.29 During the study of XPS, monoatomic ion guns (Ar+ ions) are used to clean the surface of the sample. Sputtering with single ions may cause sample modification and several types of damage like ion implantation or atomic mixing, which leads to altering the composition of the investigated samples.30–32 However, the ICP-AES technique was applied to confirm the atomic% of Al, Mg and Ca while C% was analysed by a carbon analyser. Table S2, ESI,† shows the C, Al, Mg and Ca contents in the sample. Based on the ICP-AES analysis, it is to be noticed that the Al
Ca atomic ratio is noticed for these samples. During the measurement, removal of surface oxides and contaminants by Ar+ ion etching could cause a number of side effects altering the composition of the upper surface.29 During the study of XPS, monoatomic ion guns (Ar+ ions) are used to clean the surface of the sample. Sputtering with single ions may cause sample modification and several types of damage like ion implantation or atomic mixing, which leads to altering the composition of the investigated samples.30–32 However, the ICP-AES technique was applied to confirm the atomic% of Al, Mg and Ca while C% was analysed by a carbon analyser. Table S2, ESI,† shows the C, Al, Mg and Ca contents in the sample. Based on the ICP-AES analysis, it is to be noticed that the Al![[thin space (1/6-em)]](https://www.rsc.org/images/entities/char_2009.gif) :
:![[thin space (1/6-em)]](https://www.rsc.org/images/entities/char_2009.gif) Mg
Mg![[thin space (1/6-em)]](https://www.rsc.org/images/entities/char_2009.gif) :
:![[thin space (1/6-em)]](https://www.rsc.org/images/entities/char_2009.gif) Ca ratio in the sample was found to be 1
Ca ratio in the sample was found to be 1![[thin space (1/6-em)]](https://www.rsc.org/images/entities/char_2009.gif) :
:![[thin space (1/6-em)]](https://www.rsc.org/images/entities/char_2009.gif) 1.31–1.38
1.31–1.38![[thin space (1/6-em)]](https://www.rsc.org/images/entities/char_2009.gif) :
:![[thin space (1/6-em)]](https://www.rsc.org/images/entities/char_2009.gif) 0.66–0.79, which is comparable to the experimentally calculated value of 1
0.66–0.79, which is comparable to the experimentally calculated value of 1![[thin space (1/6-em)]](https://www.rsc.org/images/entities/char_2009.gif) :
:![[thin space (1/6-em)]](https://www.rsc.org/images/entities/char_2009.gif) 1.33
1.33![[thin space (1/6-em)]](https://www.rsc.org/images/entities/char_2009.gif) :
:![[thin space (1/6-em)]](https://www.rsc.org/images/entities/char_2009.gif) 0.66.
0.66.
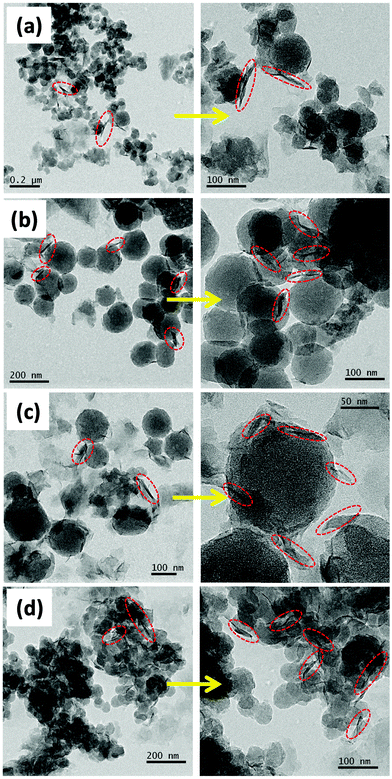
Fig. 4 presents the FESEM images of the samples (a) C4x-LDH, (b) C2x-LDH, (c) C3x/2-LDH and (d) Cx-LDH; the highly magnified images of the corresponding samples are shown by arrows. The LDH particles are highly agglomerated and adhered onto the surface of nanospherical/spheroid shape carbon particles. In the FESEM images, the nanoflake shape LDH is found to be increased with an increase in the concentration of the LDH compared to the carbon content of the C-LDH composites and follows the order of C4x-LDH < C2x-LDH < C3x/2-LDH < CxLDH. The FESEM image of the porous carbon sample is shown in Fig. S2, ESI,† to get a more intuitive comparison between the as-prepared porous carbon sample and carbon-LDH composites (Fig. 4). TEM images (Fig. 5) reveal that the particle size of carbon is in the range of 50–150 nm where overlapping LDH sheets (diameter = 10–15 nm and length = 50–100 nm) are adhered onto the surface of the carbon spheres.
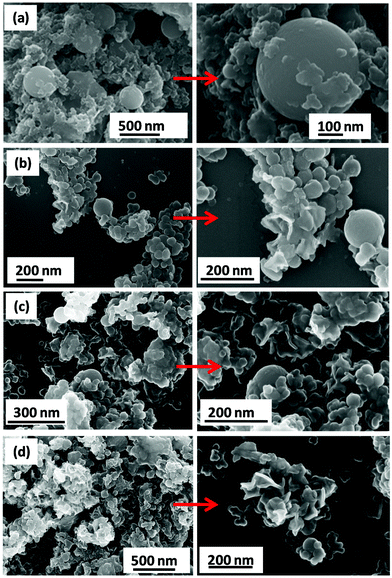 | ||
| Fig. 4 FESEM images of the C-LDH composites: (a) C4x-LDH, (b) C2x-LDH, (c) C3x/2-LDH and (d) Cx-LDH. | ||
Adsorption study of the C-LDH composite for the removal of As(V), F−, Fe(II)/Fe(III), MB and MO
![[thin space (1/6-em)]](https://www.rsc.org/images/entities/char_2009.gif) :
:![[thin space (1/6-em)]](https://www.rsc.org/images/entities/char_2009.gif) micropore surface area ratio (Section 3.1) and also it contained a significant amount of LDH compared to the carbon content. However, sample Cx-LDH having the maximum amount of LDH shows a lower removal % compared to that of C3x/2-LDH, corroborating with the lower mesopore
micropore surface area ratio (Section 3.1) and also it contained a significant amount of LDH compared to the carbon content. However, sample Cx-LDH having the maximum amount of LDH shows a lower removal % compared to that of C3x/2-LDH, corroborating with the lower mesopore![[thin space (1/6-em)]](https://www.rsc.org/images/entities/char_2009.gif) :
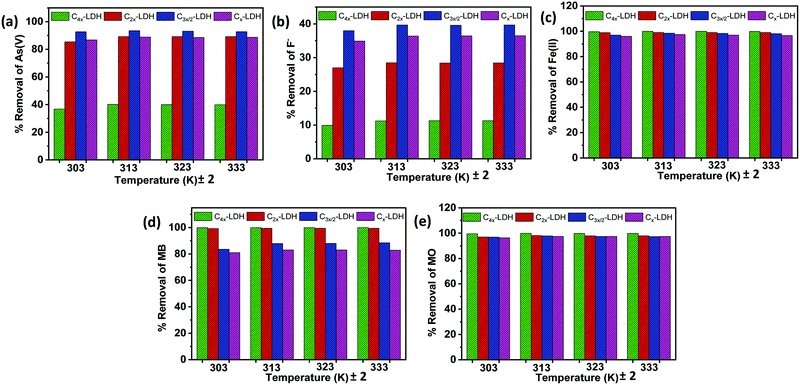
:![[thin space (1/6-em)]](https://www.rsc.org/images/entities/char_2009.gif) micropore surface area. On the other hand, for the removal of Fe(II)/Fe(III), MB and MO, the trend of the adsorption % for the samples is in the order of C4x-LDH > C2x-LDH > C3x/2-LDH > Cx-LDH, which is in tune with the same order of the carbon content and total surface area. In this case both the carbon content and surface area play a significant role for the adsorption efficiency. Interestingly, for the adsorption of anionic (inorganic) water contaminants such as As(V) (in the form of H2AsO4− and HAsO42−) and F−, the LDH plays a favorable role for their adsorption. However, for the adsorption of cationic inorganic water contaminants like Fe(II)/Fe(III) and organic dyes (MB and MO), a highly porous carbon material is the best choice.
micropore surface area. On the other hand, for the removal of Fe(II)/Fe(III), MB and MO, the trend of the adsorption % for the samples is in the order of C4x-LDH > C2x-LDH > C3x/2-LDH > Cx-LDH, which is in tune with the same order of the carbon content and total surface area. In this case both the carbon content and surface area play a significant role for the adsorption efficiency. Interestingly, for the adsorption of anionic (inorganic) water contaminants such as As(V) (in the form of H2AsO4− and HAsO42−) and F−, the LDH plays a favorable role for their adsorption. However, for the adsorption of cationic inorganic water contaminants like Fe(II)/Fe(III) and organic dyes (MB and MO), a highly porous carbon material is the best choice.
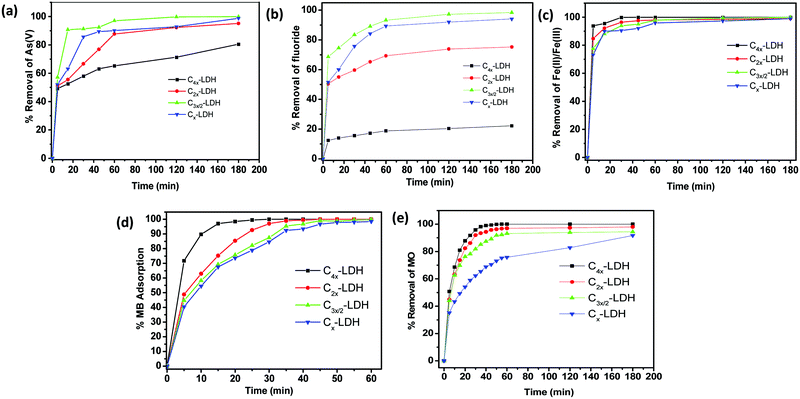 | ||
| Fig. 6 Percentage (%) removal vs. time plot of the different C-LDH composites (C4x-LDH, C2x-LDH, C3x/2-LDH and Cx-LDH) for the adsorption of (a) As(V), (b) F−, (c) Fe(II)/Fe(III), (d) MB and (e) MO. | ||
It is inferred that, for the C-LDH based nanocomposite as an adsorbent, the nature of the adsorbents and their relative concentration in the composite, total surface area and mesopore![[thin space (1/6-em)]](https://www.rsc.org/images/entities/char_2009.gif) :
:![[thin space (1/6-em)]](https://www.rsc.org/images/entities/char_2009.gif) micropore surface area ratio synergistically affect the removal of different inorganic and organic based water contaminants.
micropore surface area ratio synergistically affect the removal of different inorganic and organic based water contaminants.
To determine the leading mechanism for adsorption of the different pollutants, the adsorption data were fitted with different kinetic models. Fig. S3–S7 in the ESI† show (a) pseudo-first order and (b) pseudo-second order kinetic models for the adsorption of As(V), F−, Fe(II)/Fe(III), MB and MO, respectively. Table S4, ESI,† summarizes the kinetics data obtained from the respective curves of the kinetic models. By examining the maximum R2 values (≥0.99) from these data, it is confirmed that pseudo-second order kinetic models were best fitted. The highest adsorption capacity values were obtained from the fitted curve of pseudo-second order kinetics. These results are found to be the same as the experimental data obtained from the plot of percentage removal vs. time (Fig. 6).
![[thin space (1/6-em)]](https://www.rsc.org/images/entities/char_2009.gif) :
:![[thin space (1/6-em)]](https://www.rsc.org/images/entities/char_2009.gif) micropore surface area ratio. It is worth mentioning that C3x/2-LDH showed the maximum As(V) and F− removal capability among all the composites. It is inferred that the combined effects of the LDH content, BET surface area, and mesopore
micropore surface area ratio. It is worth mentioning that C3x/2-LDH showed the maximum As(V) and F− removal capability among all the composites. It is inferred that the combined effects of the LDH content, BET surface area, and mesopore![[thin space (1/6-em)]](https://www.rsc.org/images/entities/char_2009.gif) :
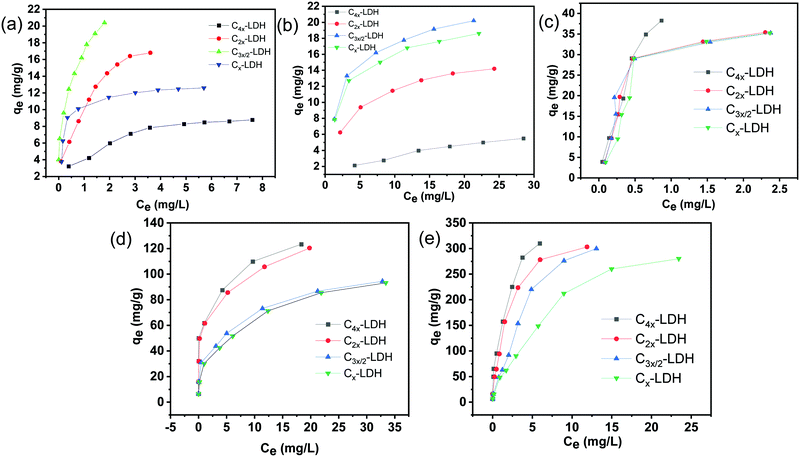
:![[thin space (1/6-em)]](https://www.rsc.org/images/entities/char_2009.gif) micropore surface area in the composites play a critical role for the removal of As(V) and F− from water. In the case of Fe(II)/Fe(III) (Fig. 7c), MB (Fig. 7d) and MO (Fig. 7e) removal, the adsorption capacity follows the order of C4x-LDH > C2x-LDH > C3x/2-LDH > Cx-LDH. Among all the samples, C4x-LDH showed the maximum adsorption capacities due to the maximum carbon content in the composite and highest BET surface area.
micropore surface area in the composites play a critical role for the removal of As(V) and F− from water. In the case of Fe(II)/Fe(III) (Fig. 7c), MB (Fig. 7d) and MO (Fig. 7e) removal, the adsorption capacity follows the order of C4x-LDH > C2x-LDH > C3x/2-LDH > Cx-LDH. Among all the samples, C4x-LDH showed the maximum adsorption capacities due to the maximum carbon content in the composite and highest BET surface area.
In order to investigate the relationship between the adsorbate (pollutant) and adsorbent (C-LDH nanocomposite), the adsorption data is fitted with different isotherm models. Fig. S8–S12 in the ESI† present the plots obtained from the (a) Langmuir and (b) Freundlich isotherm models for the adsorption of As(V) (Fig. S8, ESI†), F− (Fig. S9, ESI†), Fe(II)/Fe(III) (Fig. S10, ESI†), MO (Fig. S11, ESI†) and MB (Fig. S12, ESI†). The detailed fitting parameters of the Langmuir and Freundlich models for the adsorption of the pollutants are shown in Table S5, ESI.† The Langmuir isotherm is expressed by the dimensionless constant separation factor RL.
 | (3) |
| Langmuir isotherm: Ce/qe = Ce/qm + 1/KL·qm | (4) |
Freundlich isotherm: log![[thin space (1/6-em)]](https://www.rsc.org/images/entities/char_2009.gif) qe = logKF + 1/nF qe = logKF + 1/nF![[thin space (1/6-em)]](https://www.rsc.org/images/entities/char_2009.gif) log log![[thin space (1/6-em)]](https://www.rsc.org/images/entities/char_2009.gif) Ce Ce | (5) |
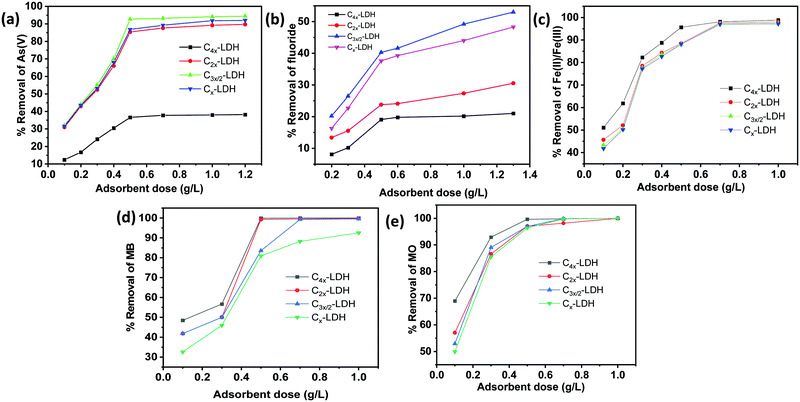 | ||
| Fig. 8 Effect of the adsorbent dose for adsorption of (a) As(V), (b) F−, (c) Fe(II)/Fe(III), (d) MB and (e) MO on the C-LDH composites. | ||
For fluoride removal, with an increase in the adsorbent dose from 0.2 g L−1 to 1.3 g L−1, the rate of removal of fluoride ions is increased. For samples C4x-LDH, C2x-LDH, C3x/2-LDH and Cx-LDH, the % removal increases from 10 to 24%, 15.5 to 36.5%, 26.5 to 53%, and 22.6 to 48.3%, respectively, with the increase in the adsorbent dose. It is found that the maximum adsorption capacity value (qm) reduced with an increase in the adsorbent concentration. As an example, sample C3x/2-LDH with dose 0.2 g L−1 showed a qm and % removal of 25.45 mg g−1 and 20.2%, respectively, while, with an increase in the adsorbent dose to 1.3 g L−1, the respective values were found to be 10.27 mg g−1 and 53%. To get a better adsorption capacity and removal efficiency, the optimum adsorbent dose of 0.5 g L−1 was used for further study for fluoride removal.
For removal of Fe(II)/Fe(III), the above phenomenon was observed, i.e., with increasing the adsorbent dose, the % removal of Fe(II)/Fe(III) increases significantly. For sample C4x-LDH with an adsorbent dose of 0.5 g L−1, the % removal was found to be 95.6%, while it was ∼88% for the other three samples. The adsorption capacity enhances with an increase in the dose of the adsorbent. To achieve the highest adsorption capacity (qm) with good removal efficiency, the optimum adsorbent dose of 0.5 g L−1 was used for further study for Fe(II)/Fe(III) removal.
Similarly, for adsorption of MB (cationic dye) and MO (anionic dye), the adsorption efficiency increased with increasing adsorbent dose up to 1.0 g L−1. The optimum removal efficiency with a better adsorption capacity value is obtained for the adsorbent dose of 0.5 g L−1. This dose amount of 0.5 g L−1 is used for further study for removal of MB and MO.
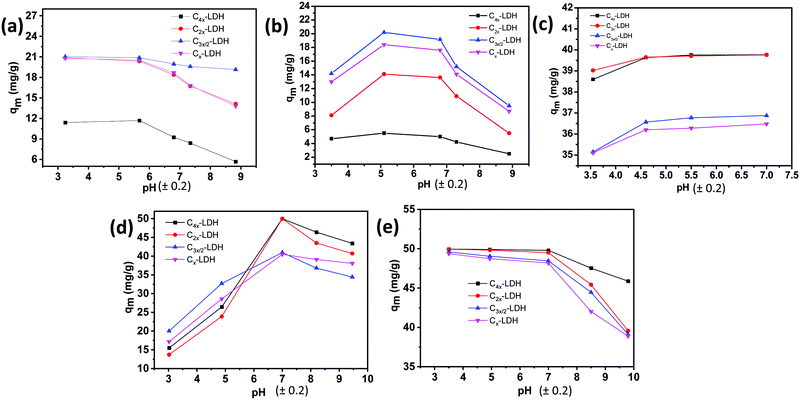
The rate of adsorption for removal of As(V) was found to be higher at lower pH followed by a decreasing trend with an increase in the pH of the solution (Fig. 9a). The decrease of the adsorption percentage at higher pH is due to electrostatic repulsion between negatively charged H2AsO4− in solution and OH− ions. Reversely, at a lower pH the strong coulombic interaction between negatively charged H2AsO4− and the positive charged C-LDH surface plays a key role for adsorption of arsenic. With increasing pH of the solution, the % adsorption decreased by 25.9, 30.8, 7.8 and 32.45% for sample C4x-LDH, C2x-LDH, C3x/2-LDH and Cx-LDH, respectively.
The sorption efficiency for removal of F− was found to be higher in a lower pH range than a basic pH range (Fig. 9b). The reduced adsorption efficiency at basic pH is due to the electrostatic repulsion between the negatively charged C-LDH surfaces and F− ions. The highest F− removal was observed at around pH 5 for all the C-LDH samples. Because of the high anion exchange capacity and high surface-active binding sites, C3x/2-LDH showed high removal efficiency.
The pH effect on the adsorption of Fe(II)/Fe(III) is seen to be increased with an increase in the pH of the solution (Fig. 9c). The maximum adsorption was observed in the pH range of 4.5 to 7. At pH < 4.5, the adsorption capacity is decreased due to competition between H+ ions and positive Fe(II)/Fe(III) ions. When the pH of the surrounding medium increased, the negative charges on the surface of the C-LDH composite increased, leading to greater electrostatic interaction between the adsorbent and Fe(II)/Fe(III) ions. However, a further increase of the pH in the solution (pH > 7) led to precipitation via formation of hydroxide complexes such as Fe(OH)2, Fe(OH)3etc. Therefore, all adsorption experiments for removal of iron are conducted at a pH less than 7 to avoid the effect of precipitation, confirming Fe(II)/Fe(III) ion removal by adsorption only.
To study the effect of the pH on the adsorption of MB, the electrostatic repulsion between cationic dye MB and the positively charged C-LDH surface inhibits the rate of adsorption of MB at lower pH. However, the adsorption efficiency was found to be significantly increased at pH 7 (Fig. 9d). The reason behind this is that the amino group of MB becomes free from protonation at neutral pH, leading to electrostatic attraction with vacant adsorption sites of the C-LDH composites.35 Further, the adsorption of MB decreases at alkaline pH. The negative charge on the C-LDH surface increases at higher pH, causing repulsion between oxyanions of the MB dye (formed through complex formation) and the adsorbent.36
The adsorption capacity of methyl orange on the surface of C-LDH was found to be higher at lower pH (Fig. 9e), which is due to electrostatic attraction between the anionic dye MO and positively charged C-LDH composites. With an increase in the pH of the solution (>7), the adsorption capacity reduces due to electrostatic repulsion between the anionic dye, MO, and the negatively charged surface of the composites.
Simultaneous removal of As(V), F−, Fe(II)/Fe(III), MB and MO
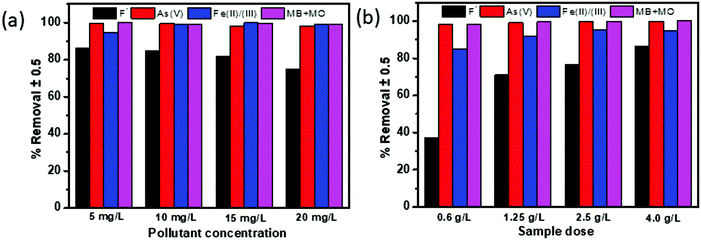
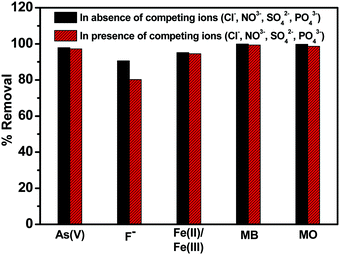
Due to the higher removal efficiency of sample C3x/2-LDH for the adsorption of water contaminants, particularly As(V) and F−, it was used for simultaneous removal of As(V), F−, Fe(II)/Fe(III), MB and MO from water. In this study, the experiments were carried out by changing the concentrations of the adsorbate (Fig. 11a) (keeping sample dose 3.75 g L−1) and the adsorbent dosage (Fig. 11b) (keeping a pollutant concentration of 5 mg L−1) with contact time 180 min, at pH 6.8 ± 0.2, and temperature 30 °C for each. The percentage removal of different pollutants simultaneously by using the C3x/2-LDH composite was compared with the as-prepared carbon sample and LDH sample (Fig. S13 in the ESI†). It is worth noting that a similar experimental procedure was used to synthesize the LDH sample in the absence of carbon. By changing the pollutant (adsorbate) concentrations, it was noticed that the % removal for fluoride decreased from 86.5% to 75% with an increase in the adsorbate concentrations from 5 to 20 mg L−1. However, there were no significant changes in the % removal of As(V) and the dyes (MB + MO) with an increase in the adsorbate concentration; it was ∼99% and >99%, respectively, for an adsorbate concentration in the range of 5–20 mg L−1. For the adsorption of Fe(II)/Fe(III), the % removal increased from 95% to 99% by changing the adsorbate concentration from 5 to 10 mg L−1 followed by no significant change up to an adsorbate concentration of 20 mg L−1. The presence of co-existing ions of As(V) in the solution reduced the fluoride adsorption. It was reported that after adsorption of arsenate (As(V)) the zeta potential of the double layer on the surface is decreased significantly to negative values, and as a result fluoride adsorption on this negatively charged surface is inhibited.15,39 However, the removal of As(V) was not affected significantly in the presence of fluoride on the surface of the C-LDH composite. Generally, fluoride ions are adsorbed by a ligand exchange mechanism via exchange of surface OH− with F−. Therefore, fluoride adsorption should not change the charge and the potential of the surface of C-LDH during As(V) adsorption. Fe(II)/Fe(III) is responsible for the enhanced adsorption capacity of As(V) via formation of arsenate-Fe(II)/Fe(III) complexes.40 In the presence of excess iron, this complex formation tendency is increased and arsenate is precipitated with excess iron. Consequently, removal of iron simultaneously facilitates arsenic removal from water.Fig. 11(b) shows that, with an increase in the adsorbent (sample) dose from 0.625 to 3.75 g L−1, the adsorption efficiency (%) slightly increased from ∼98% to ∼99.9% for the removal of As(V) and the dyes (MB + MO). However, there is a steady increase in the % removal of fluoride and Fe(II)/Fe(III) from 37% to 86% and 85% to 95%, respectively, with an increase in the sample dose from 0.625 to 3.75 g L−1. The increase in the sample dose increases the number of active adsorption sites, which, in turn, enhances the adsorption capacity towards the removal of pollutants.
Mechanism of adsorption
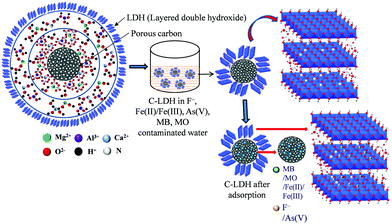
The synthesized composite material C-LDH showed significant adsorption capacity for removal of both inorganic (metal cations, anions and oxyanions) and organic (dyes) water pollutants due to the synergistic effect of the carbon and LDH content. The porous carbon in LDH structure helps improve the surface area, chemical stability and oxygen containing surface functional groups. As a consequence, the effective numbers of active adsorption sites are increased, rendering enhanced adsorption. Adsorption occurred via electrostatic interaction, ion exchange and complex formation mechanisms. Electrostatic attraction of arsenate ions with the C-LDH nanocomposite and complex formation with iron are the major removal mechanisms for arsenic. Fig. S14 in the ESI† shows an FTIR study (before and after adsorption of water pollutants) to understand the adsorption mechanism. The appearance of a peak at around 794 cm−1 signifies As–O bond formation after adsorption of As(V) onto C3x/2-LDH. The reduction of the peak intensity at around 1379 cm−1 of the intercalated anions (NO3−) signifies the partial replacement of interlayer anions of the LDH with arsenate and fluoride. On the other hand, it is observed that, after adsorption of contaminants onto the LDH structure, the intensity of the absorption band at around 654 cm−1 due to Mg–O bonds is found to be diminished. It demonstrates that Mg2+ ions are partially exchanged by the pollutant ions during adsorption.24 Methyl orange is adsorbed on the C-LDH composites by electrostatic attraction between the dye molecules (MB + MO) and the LDH. Additionally, the carbon in the LDH facilitates the formation of H-bonding between anionic dye MO and carbon. Therefore, the cooperative contribution of electrostatic attraction and hydrogen bonding between the dye molecules and C-LDH composites is advantageous for the improvement of the adsorption capacity.41Fig. 14 presents a tentative adsorption mechanism for removal of pollutants using the C-LDH composites. Four different C-LDH composite samples were synthesized by varying the concentration of carbon with respect to the LDH. From the removal study, it was found that sample C4x-LDH (C = 0.06 mol) showed higher adsorption of organic dyes and Fe(II)/Fe(III) compared to As(V) and F− removal. However, a decrease in the mols of carbon with respect to the LDH reduced the adsorption of organic dyes and increased the adsorption of As(V) and F−. For example, Cx-LDH showed higher As(V) and F− removal efficiency. From these findings, it can be mentioned that the porous structure of carbon is responsible for the removal of organic dyes and Fe(II)/Fe(III), whereas the interlayer space of the LDH structure adhered outside of the carbon sphere is utilized for removal of As(V) and F−. The simultaneous removal of pollutants can also be explained by the co-adsorption mechanism.42 The negatively charged arsenate and fluoride could improve the adsorption of positively charged dye MB through electrostatic interactions. On the other hand, the positively charged Fe(II)/Fe(III) facilitates the adsorption of negatively charged MO by electrostatic interactions. At the same time, N-containing groups of the adsorbed MB and MO could enhance the adsorption sites for arsenate, fluoride and iron. Therefore, the simultaneous removal mechanism could be attributed to the (i) presence of N-containing groups on the adsorbed MB and MO and (ii) electrostatic interaction through arsenate, fluoride and iron.Conclusions
A C-LDH nanocomposite was prepared for simultaneous removal of As(V), F−, Fe(II)/Fe(III), MB and MO from water. The textural properties of the C-LDH composites indicate that the BET surface area (SBET) values follow the order of C4x-LDH (758 m2 g−1) > C3x/2-LDH (558 m2 g−1) > C2x-LDH (520 m2 g−1) > Cx-LDH (477 m2 g−1), while the Smesopore/Smicropore values follow the trend of C3x/2-LDH > C4x-LDH > C2x-LDH > Cx-LDH. The compositional variation of C![[thin space (1/6-em)]](https://www.rsc.org/images/entities/char_2009.gif) :
:![[thin space (1/6-em)]](https://www.rsc.org/images/entities/char_2009.gif) LDH has an important role in changing the textural behaviours. The maximum removal % of As(V) and F− for sample C3x/2-LDH could be attributed to the high mesopore
LDH has an important role in changing the textural behaviours. The maximum removal % of As(V) and F− for sample C3x/2-LDH could be attributed to the high mesopore![[thin space (1/6-em)]](https://www.rsc.org/images/entities/char_2009.gif) :
:![[thin space (1/6-em)]](https://www.rsc.org/images/entities/char_2009.gif) micropore surface area ratio. For the removal of Fe(II)/Fe(III), MB and MO, the trend of the adsorption % for the samples is in the order of C4x-LDH > C2x-LDH > C3x/2-LDH > Cx-LDH, which is in tune with the same order of the carbon content and surface area. The maximum adsorption capacity values for As(V) and F− removal are found to be 22.37 and 20.40 mg g−1, respectively, using C3x/2-LDH, while sample C4x-LDH shows the highest adsorption efficiency of 80.00, 122.10 and 328.95 mg g−1 for the adsorption of Fe(II)/Fe(III), MB and MO, respectively, at room temperature. The nature of the adsorbents and their relative concentration in the composite, total surface area and mesopore
micropore surface area ratio. For the removal of Fe(II)/Fe(III), MB and MO, the trend of the adsorption % for the samples is in the order of C4x-LDH > C2x-LDH > C3x/2-LDH > Cx-LDH, which is in tune with the same order of the carbon content and surface area. The maximum adsorption capacity values for As(V) and F− removal are found to be 22.37 and 20.40 mg g−1, respectively, using C3x/2-LDH, while sample C4x-LDH shows the highest adsorption efficiency of 80.00, 122.10 and 328.95 mg g−1 for the adsorption of Fe(II)/Fe(III), MB and MO, respectively, at room temperature. The nature of the adsorbents and their relative concentration in the composite, total surface area and mesopore![[thin space (1/6-em)]](https://www.rsc.org/images/entities/char_2009.gif) :
:![[thin space (1/6-em)]](https://www.rsc.org/images/entities/char_2009.gif) micropore surface area ratio synergistically affect the removal of different inorganic and organic based contaminants from water. For simultaneous removal of As(V), F−, Fe(II)/Fe(III) and the dyes (MB and MO) with concentration 5 mg L−1 each from water, the composite material C3x/2-LDH having a 3.75 g L−1 dosage shows a percentage removal of 99.8%, 86.5%, 94.8% and 99.99%, respectively, at pH 6.8 ± 0.2 and temperature 30 °C. The present work is significant for the development of C-LDH nanocomposites for the removal of toxic water pollutants like As(V), F−, and Fe(II)/Fe(III) and different cationic and anionic dyes from waste water via an eco-friendly process.
micropore surface area ratio synergistically affect the removal of different inorganic and organic based contaminants from water. For simultaneous removal of As(V), F−, Fe(II)/Fe(III) and the dyes (MB and MO) with concentration 5 mg L−1 each from water, the composite material C3x/2-LDH having a 3.75 g L−1 dosage shows a percentage removal of 99.8%, 86.5%, 94.8% and 99.99%, respectively, at pH 6.8 ± 0.2 and temperature 30 °C. The present work is significant for the development of C-LDH nanocomposites for the removal of toxic water pollutants like As(V), F−, and Fe(II)/Fe(III) and different cationic and anionic dyes from waste water via an eco-friendly process.
Conflicts of interest
One patent application covering this work has been filed by CSIR-Central Glass & Ceramic Research Institute (Indian patent application file no. 202011034408, dated 11.08.2020).Acknowledgements
The authors are grateful to the Director of CSIR-CGCRI for his kind permission to pursue this work. The authors would like to acknowledge the financial support rendered by DST-SERB, Government of India, for funding the project (Sanction No. EEQ/2017/000004) under the project No. GAP 0622. An author (SK) is also thankful to CSIR (AcSIR) for granting a research fellowship (Grant No. 31/GATE/15(24)/2015-EMR-I).References
- X. Li, W.-c. Cao, Y.-g. Liu, G.-m. Zeng, W. Zeng, L. Qin and T.-t. Li, ACS Sustainable Chem. Eng., 2017, 5, 179–188 CrossRef CAS.
- J. Wei, M. F. Aly Aboud, I. Shakir, Z. Tong and Y. Xu, ACS Appl. Nano Mater., 2019, 3, 806–813 CrossRef.
- G. Z. Kyzas and K. A. Matis, J. Mol. Liq., 2015, 203, 159–168 CrossRef CAS.
- A. D
![[a with combining cedilla]](https://www.rsc.org/images/entities/char_0061_0327.gif) browski, Z. Hubicki, P. Podkościelny and E. Robens, Chemosphere, 2004, 56, 91–106 CrossRef PubMed.
browski, Z. Hubicki, P. Podkościelny and E. Robens, Chemosphere, 2004, 56, 91–106 CrossRef PubMed. - G. L. Ghurye, D. A. Clifford and A. R. Tripp, J. Am. Water Works Assoc., 1999, 91, 85–96 CrossRef CAS.
- S. Rengaraj, K.-H. Yeon and S.-H. Moon, J. Hazard. Mater., 2001, 87, 273–287 CrossRef CAS PubMed.
- W. Ding, H. Tong, D. Zhao, H. Zheng, C. Liu, J. Li and F. Wu, Chem. Eng. J., 2020, 401, 126102 CrossRef CAS.
- M. Bayat, V. Javanbakht and J. Esmaili, Int. J. Biol. Macromol., 2018, 116, 607–619 CrossRef CAS PubMed.
- N. S. Graça, A. M. Ribeiro and A. E. Rodrigues, Chem. Eng. Sci., 2019, 197, 379–385 CrossRef.
- S. Chakrabortty, M. Roy and P. Pal, Desalination, 2013, 313, 115–124 CrossRef CAS.
- M. Kumar, A. M. Isloor, T. S. Rao, A. F. Ismail, R. Farnood and P. Nambissan, Chem. Eng. J., 2020, 124367 CrossRef CAS.
- J. Shen and A. Schäfer, Chemosphere, 2014, 117, 679–691 CrossRef CAS PubMed.
- M. K. Uddin, Chem. Eng. J., 2017, 308, 438–462 CrossRef CAS.
- Z. Li, L. Wang, J. Meng, X. Liu, J. Xu, F. Wang and P. Brookes, J. Hazard. Mater., 2018, 344, 1–11 CrossRef CAS PubMed.
- C. Jing, J. Cui, Y. Huang and A. Li, ACS Appl. Mater. Interfaces, 2012, 4, 714–720 CrossRef CAS PubMed.
- M. Jourshabani, J. A. Dominic, G. Achari and Z. Shariatinia, Chem. Eng. Sci., 2019, 209, 115181 CrossRef CAS.
- M. M. Sabzehmeidani, S. Mahnaee, M. Ghaedi, H. Heidari and V. A. L. Roy, Mater. Adv., 2021, 2, 598–627, 10.1039/D0MA00087F.
- R. Saxena, M. Saxena and A. Lochab, ChemistrySelect, 2020, 5, 335–353 CrossRef CAS.
- G. Mishra, B. Dash and S. Pandey, Appl. Clay Sci., 2018, 153, 172–186 CrossRef CAS.
- I. Abe, S. Iwasaki, T. Tokimoto, N. Kawasaki, T. Nakamura and S. Tanada, J. Colloid Interface Sci., 2004, 275, 35–39 CrossRef CAS PubMed.
- S. M. Gidado and İ. Akanyeti, Water, Air, Soil Pollut., 2020, 231, 1–18 CrossRef.
- Y. Cao, G. Li and X. Li, Chem. Eng. J., 2016, 292, 207–223 CrossRef CAS.
- H.-P. Chao, Y.-C. Wang and H. N. Tran, Environ. Pollut., 2018, 243, 620–629 CrossRef CAS PubMed.
- S. Huang, S. Song, R. Zhang, T. Wen, X. Wang, S. Yu, W. Song, T. Hayat, A. Alsaedi and X. Wang, ACS Sustainable Chem. Eng., 2017, 5, 11268–11279 CrossRef CAS.
- X. Zhang, J. Wang, R. Li, Q. Dai, R. Gao, Q. Liu and M. Zhang, Ind. Eng. Chem. Res., 2013, 52, 10152–10159 CrossRef CAS.
- S. Kundu, I. H. Chowdhury and M. K. Naskar, J. Chem. Eng. Data, 2018, 63, 559–573 CrossRef CAS.
- S. Kundu and M. K. Naskar, J. Chem. Eng. Data, 2019, 64, 1594–1604 CrossRef CAS.
- L. K. G. Bhatta, S. Subramanyam, M. D. Chengala, U. M. Bhatta, P. Guha, R. P. H. Dinakar and K. Venkatesh, Energy Fuels, 2016, 30, 4244–4250 CrossRef CAS.
- G. Greczynski and L. Hultman, Prog. Mater. Sci., 2020, 107, 100591 CrossRef CAS.
- E. Diler, S. Rioual, B. Lescop, D. Thierry and B. Rouvellou, Corros. Sci., 2012, 65, 178–186 CrossRef CAS.
- E. Diler, B. Rouvellou, S. Rioual, B. Lescop, G. N. Vien and D. Thierry, Corros. Sci., 2014, 87, 111–117 CrossRef CAS.
- R. Steinberger, J. Walter, T. Greunz, J. Duchoslav, M. Arndt, S. Molodtsov, D. Meyer and D. Stifter, Corros. Sci., 2015, 99, 66–75 CrossRef CAS.
- T. Sumathi and G. Alagumuthu, Int. J. Chem. Eng., 2014, 2014, 430417, DOI:10.1155/2014/430417.
- J. S. Noh and J. A. Schwarz, J. Colloid Interface Sci., 1989, 130, 157–164 CrossRef CAS.
- T. Santhi and S. Manonmani, Chem. Eng. Res. Bull., 2009, 13, 1–5 CAS.
- A. A. Moosa, A. M. Ridha and N. A. Kadhim, Am. J. Mater. Sci., 2016, 6, 135–146 Search PubMed.
- S. Rahdar, M. Taghavi, R. Khaksefidi and S. Ahmadi, Appl. Water Sci., 2019, 9, 87 CrossRef.
- N. Gaur, A. Kukreja, M. Yadav and A. Tiwari, Appl. Water Sci., 2018, 8, 98 CrossRef.
- M. Pena, X. Meng, G. P. Korfiatis and C. Jing, Environ. Sci. Technol., 2006, 40, 1257–1262 CrossRef CAS PubMed.
- L. Twidwell, R. Robins and J. Hohn, Arsenic Metall., 2005, 3–24 CAS.
- M. Zhang, Q. Yao, C. Lu, Z. Li and W. Wang, ACS Appl. Mater. Interfaces, 2014, 6, 20225–20233 CrossRef CAS PubMed.
- S. Chen, Y. Huang, X. Han, Z. Wu, C. Lai, J. Wang, Q. Deng, Z. Zeng and S. Deng, Chem. Eng. J., 2018, 352, 306–315 CrossRef CAS.
Footnote |
| † Electronic supplementary information (ESI) available. See DOI: 10.1039/d1ma00064k |
| This journal is © The Royal Society of Chemistry 2021 |

