 Open Access Article
Ge nanocrystals tightly and uniformly distributed in a carbon matrix through nitrogen and oxygen bridging bonds for fast-charging high-energy-density lithium-ion batteries†
Jiayang
Li
a,
Zhenwei
Li
b and
Meisheng
Han
 *ac
*ac
aAdvanced Fibers Group, Songshan Lake Materials Laboratory Dongguan, Guangdong 523808, China. E-mail: hanmeisheng@sslab.org.cn
bShenzhen Engineering Lab for Supercapacitor Materials, Shenzhen Key Laboratory for Advanced Materials, School of Material Science and Engineering, Harbin Institute of Technology, Shenzhen, University Town, Shenzhen 518055, China
cBeijing National Laboratory for Condensed Matter Physics, Institute of Physics, Chinese Academy of Sciences, Beijing 100190, China
First published on 16th February 2021
Abstract
Germanium (Ge) has come into the public interest as a high-capacity and high-rate lithium-ion battery anode. However, its unsatisfactory cycling life is caused by its large volume expansion (∼230%) upon cycling. In order to settle this intractable problem, a highly mesoporous Ge/C nanocomposite, in which Ge nanocrystals (∼20 nm) are evenly dispersed into a N,O co-doped carbon matrix, can be prepared via the pyrolysis of a mixture of bis[2-carboxyethylgermanium(IV)] sesquioxide and dimethylformamide. Vast phase boundaries are induced due to the homogeneously dispersed structure, in which the N and O atoms effectively bridge Ge and C through Ge–O–C and Ge–N–C bonds, to achieve a highly robust structure and a fast ion transport route. Consequently, the Ge/C anode shows a high specific/volumetric capacity of 1607.8 mA h g−1/2090.1 mA h cm−3, prominent cyclability, and a striking rate capability in half cells. Remarkably, a high specific energy density of 481.5/358.7 W h kg−1 at 0.1/5C, and a high volumetric energy density of 1019.1 W h l−1 are obtained in full cells with LiFePO4 as the cathode.
Introduction
Owing to a low capacity1 and poor rate performance,2 a commercial graphite anode cannot meet the requirements of high-energy/power-density lithium-ion batteries (LIBs) for electric vehicles, which need a longer driving mileage and shorter charge time.3,4 Consequently, enormous anodes with higher capacity and better rate capability were fabricated in recent years, such as Si,5 Ge,6 Sn,7 and their corresponding oxides,8–12 and transition metal sulfide,13,14etc. Among them, Ge has come to public concern due to its high specific/volumetric capacity of 1624 mA h g−1/8600 mA h cm−3,15,16 and high Li+ diffusivity6,17 to lead to an amazing rate capability up to 1000 C.18 However, Ge experiences a large volume change of ∼230% on cycling to bring about electrode pulverization, and thus cause poor cyclability.6,15–17 In order to deal with this intractable problem, a lot of work has been done, such as designing Ge nanostructures, including nanoparticles,6 nanofibers,16 nanotubes,19 and nanowires,20 and making Ge/C nanocomposites.20–24 The latter is regarded to be the most effective way because the added carbon not only improves the electrical conductivity (EC) of Ge, but also acts as a buffer layer/matrix to ease volume expansion. Particularly, the doped carbon can induce vast defects and interfacial chemical bonds between Ge and C to heighten electrochemical performances.13,23,24 The Ge/C nanocomposites mainly include three types. The first type is a core–shell structure in which carbon is coated on the surface of Ge nanostructures.20–22 For example, a Ge/graphene nanocomposite was fabricated by growing few-layered graphene on Ge nanowires with a diameter of ∼43 nm using chemical vapor deposition and delivered a high capacity of 1210 mA h g−1 after 200 cycles, with a capacity retention of 95% at a current density of 0.6 A g−1 and 363 mA h g−1 at 24 A g−1.20 A Ge@C/graphene oxide nanocomposite was synthesized by making core–shell Ge@C nanoparticles into a graphene oxide film, which showed a high capacity of 940 mA h g−1 at 0.05 A g−1 after 50 cycles and 380 mA h g−1 at 3.6 A g−1.21 The second type is where Ge nanoparticles are confined on porous carbon.17,23 For example, by confining Ge quantum dots in a porous N-doped carbon framework using a template-confined route, in which Ge–O–C and Ge–C bonds were formed, a high capacity of 1160 mA h g−1 after 200 cycles at 1 A g−1 was obtained.17 By encapsulating Ge nanoparticles into a N-doped carbon nanotube with a size of 80–200 nm, a high capacity of 1080 mA h g−1 after 1200 cycles with a capacity retention of ∼90% at 0.8 A g−1 was obtained.23 The last type is where Ge nanoparticles are uniformly dispersed into the carbon matrix.24 For instance, Ge/C nanospheres with a size of 300–600 nm were obtained by a sol–gel method, and exhibited a high capacity of 684 mA h g−1 after 200 cycles with a capacity retention of 89.6% at 0.2 A g−1 and 472 mA h g−1 at 2 A g−1.24 Although the Li+ storage performances of Ge in the above-mentioned Ge/C nanocomposites have been strengthened, a higher capacity and longer cycle life are needed in practical applications, especially at a high current density. Additionally, their preparation processes are too complex and cumbersome to fulfil the vital importance of an uncomplicated method for obtaining high-capacity, high-rate, and long-cycling-life Ge/doped-C nanocomposites at different current densities.Here, based on these problems, we fabricate a Ge/C nanocomposite via a practical one-step pyrolysis of a mixture of bis[2-carboxyethylgermanium(IV)] sesquioxide (BS, C6H10Ge2O7) and dimethylformamide (DMF, C3H7ON) in a sealed vessel. The Ge/C nanocomposite with a highly mesoporous structure comprises Ge nanocrystals (∼20 nm) homogeneously and tightly embedded into a carbon matrix through chemical bridge bonding of N and O atoms. These characteristics endow the Ge/C nanocomposite with a high capacity, an unprecedented cyclability, and a prominent rate capability as the LIB anode in half/full cells. Markedly, the full cell with a LiFePO4 (LFP) cathode represents a high specific energy density of 481.5 W h kg−1 at 0.1C and 358.7 W h kg−1 at 5C, and a high volumetric energy density of 1019.1 W h L−1.
Experimental section
Synthesis of Ge/C nanocomposites
A vessel containing 0.4 g BS (Tokyo Chemical Industry) and 0.4 g DMF was sealed in an Ar-filled glove box and placed in a tube furnace, which was heated to 650 °C for 2 h at 10 °C min−1 with Ar to obtain the Ge/C nanocomposites with N and O atoms.Characterizations
A scanning electron microscope (SEM, Hitachi S-4700), transmission electron microscope (TEM) with an energy dispersive spectrometer (EDS), X-ray diffractometer (XRD), Raman spectrometer, X-ray photoelectron spectrometer (XPS), thermogravimetric analyzer (TGA), elemental analyzer, and an accelerated surface area and porosimetry system were used to probe the obtained materials.Electrochemical measurements
In half cells, anode electrodes containing 80 wt% active materials, 10 wt% acetylene black, and 10 wt% polyvinylidene fluoride, together with electrolyte (DoDoChem), Li foil, and a 2400 membrane, were assembled into 2032 coin-type cells in an Ar-filled glove box. In full cells, cathode electrodes consist of 94 wt% LFP (MTI Corporation), 3 wt% acetylene black, and 3 wt% polyvinylidene fluoride. A N/P ratio of about 1.1 is achieved by using a Ge/C of 2.2 mg cm−2 to match a LFP of 18.3 mg cm−2. Prior to their assembly, the anode electrodes were first cycled for three cycles in a half cell to increase their first Coulombic efficiency (CE). The electrochemical performances of all the cells including cycling/rate curves, cyclic voltammetry (CV) curves, and electrochemical impedance spectroscopy (EIS) were tested using a Land battery testing system and an electrochemical workstation. The models of the testing equipment in the previous two sections are the as in our previous reports.12,13Results and discussion
As described in the section 2.1, the synthesis process of the Ge/C nanocomposite only requires one-step high-temperature pyrolysis in a sealed system. Clearly, the Ge/C nanocomposite cannot be synthesized in an open system due to evaporation of DMF and loss of decomposition products of BS. Differently, the evaporation and decomposition products can be retained in the sealed system to induce high vapor phase pressure to advance gaseous products to transfer into solid substances.13 The obtained Ge/C shows a bulk morphology with porous structure marked as white circles (Fig. 1a and b), in which abundant nanocrystals with an average size of about 20 nm are dispersed into carbon matrix (Fig. 1c and d). The spacing of 0.326 nm between adjacent lattice fringes corresponds to the (111) crystal plane of Ge (Fig. 1e) to imply the formation of Ge nanocrystals. Debye–Scherrer ring patterns of (111), (220), and (331) crystal planes of Ge appear in the selected area electron diffraction (SAED) pattern (Fig. 1f) to further confirm the presence of Ge crystals. Besides this, the Ge, O, C, and N elements are evenly distributed in the nanocomposite, shown in the high angle annular dark field (HAADF) image and its corresponding EDS elemental mapping images (Fig. 1g–k). The results confirm that Ge nanocrystals are evenly distributed into a N,O co-doped carbon matrix, which is conducive to Li+ storage.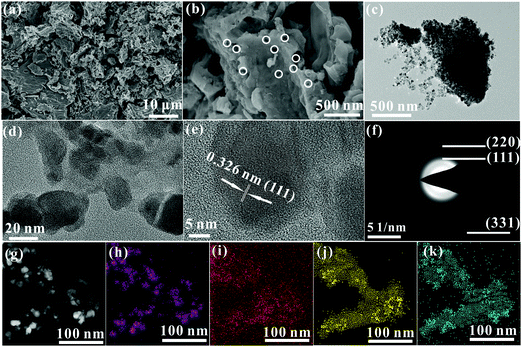 | ||
| Fig. 1 (a and b) SEM images, (c–e) TEM images, (f) SAED pattern, (g) HAADF image and its corresponding EDS elemental mapping images of Ge (h), C (i), N (j), and O (k). | ||
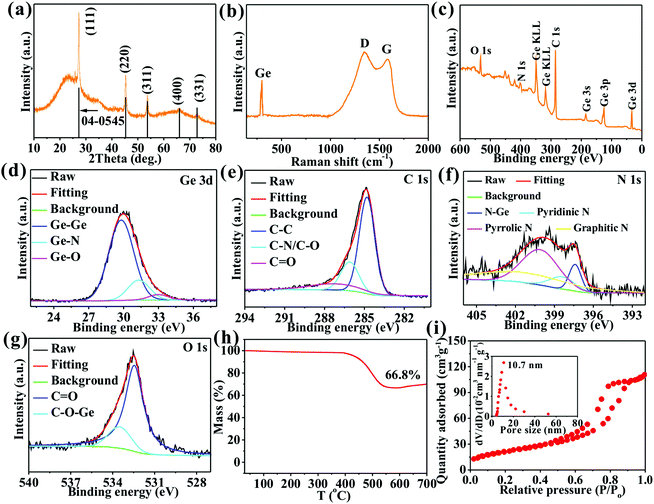
A series of diffraction peaks at 27.3, 45.3, 53.7, 65.9, and 72.8° (Fig. 2a) correspond to (111), (220), (311), (400), and (331) crystal planes, respectively, of Ge (JCPDS#04-0545) to further determine the existence of Ge crystals. The broad peak at 12–39°, an indicator of an amorphous structure, is ascribed to an amorphous carbon matrix. Three Raman peaks at 300.1, 1346.3, and 1585.9 cm−1 (Fig. 2b) correspond to Ge crystals, and D and G peaks of carbon materials, respectively, to further confirm the existence of Ge and carbon.13,17 The high intensity ratio (1.13) of D and G peaks suggests that the carbon contains plentiful defects beneficial for Li+ storage.8,10,13 Four elements of Ge (11.6 at%), C (73.2 at%), N (9.1 at%), and O (6.1 at%) (Fig. 2c) appear to imply high doping amounts of 10.3 and 6.9%, respectively, of N and O in the carbon matrix. The Ge 3d spectrum (Fig. 2d) exhibits three peaks at 29.8, 31.5, and 33.0 eV ascribed to Ge–Ge, Ge–N, and Ge–O, respectively, to imply the presence of elemental Ge, Ge–N–C, and Ge–O–C.17,25 The C 1s spectrum (Fig. 2e) reveals three peaks at 284.8, 286.1, and 287.2 eV attributed to C–C, C–N/C–O, and C![[double bond, length as m-dash]](https://www.rsc.org/images/entities/char_e001.gif) O, respectively,13,17 to confirm the formation of N,O co–doped carbon.13 The N 1s spectrum (Fig. 2f) shows four peaks at 397.4, 398.5, 400.1, and 401.2 eV contributed by N–Ge, pyridinic N, pyrrolic N, and graphitic N, respectively, to further demonstrate the formation of Ge–N–C and N-doped C.13,25 The O 1s spectrum (Fig. 3g) shows two peaks at 532.5 and 533.5 eV arising from C
O, respectively,13,17 to confirm the formation of N,O co–doped carbon.13 The N 1s spectrum (Fig. 2f) shows four peaks at 397.4, 398.5, 400.1, and 401.2 eV contributed by N–Ge, pyridinic N, pyrrolic N, and graphitic N, respectively, to further demonstrate the formation of Ge–N–C and N-doped C.13,25 The O 1s spectrum (Fig. 3g) shows two peaks at 532.5 and 533.5 eV arising from C![[double bond, length as m-dash]](https://www.rsc.org/images/entities/char_e001.gif) O and C–O–Ge bonds, respectively, to further prove the formation of O-doped C and Ge–O–C bonds. The presence of Ge–O–C and Ge–N–C bonds implies that O and N atoms tightly bridge Ge and C. The Ge/C was heated in air to attain the mass percentage of N,O co-doped carbon by TGA (Fig. 2h), during which N,O co-doped carbon can be fully oxidated into gases. The mass loss of 33.2% from 394–586 °C represents a mass percentage of N,O co-doped carbon. The O/N/H and C/S elemental analyzers are used to probe mass percentages of C, O, and N elements, which are 27.9%, 4.0%, and 2.4%, respectively, in agreement with the XPS and TGA results. Additionally, the Ge/C nanocomposite shows a mesoporous structure with a specific surface area of 112.2 m2 g−1, a pore volume of 0.62 cm3 g−1, and a well-defined mesopore centered at 10.7 nm (Fig. 2i), which are favorable for obtaining a high contact area with electrolyte, boosting Li+ transport, storing Li+, and accommodating the volume expansion of Ge upon cycling, thus strengthening the electrochemical performances of the nanocomposite.12,26
O and C–O–Ge bonds, respectively, to further prove the formation of O-doped C and Ge–O–C bonds. The presence of Ge–O–C and Ge–N–C bonds implies that O and N atoms tightly bridge Ge and C. The Ge/C was heated in air to attain the mass percentage of N,O co-doped carbon by TGA (Fig. 2h), during which N,O co-doped carbon can be fully oxidated into gases. The mass loss of 33.2% from 394–586 °C represents a mass percentage of N,O co-doped carbon. The O/N/H and C/S elemental analyzers are used to probe mass percentages of C, O, and N elements, which are 27.9%, 4.0%, and 2.4%, respectively, in agreement with the XPS and TGA results. Additionally, the Ge/C nanocomposite shows a mesoporous structure with a specific surface area of 112.2 m2 g−1, a pore volume of 0.62 cm3 g−1, and a well-defined mesopore centered at 10.7 nm (Fig. 2i), which are favorable for obtaining a high contact area with electrolyte, boosting Li+ transport, storing Li+, and accommodating the volume expansion of Ge upon cycling, thus strengthening the electrochemical performances of the nanocomposite.12,26
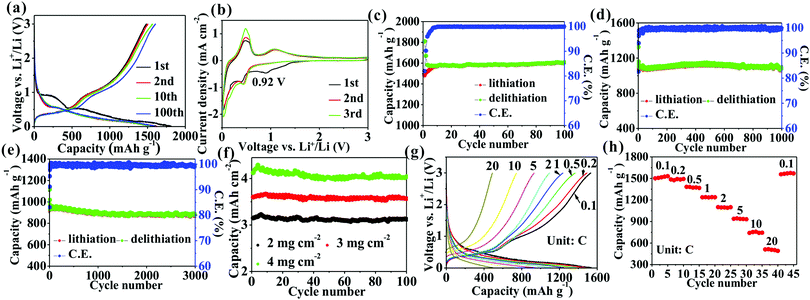
Fig. 3a shows that the first delithiation/lithiation capacities of Ge/C nanocomposites at 0.1C (1C = 1.6 A/g) are 1484.1/1816.1 mA h g−1 to obtain a CE of 81.6%. The 18.4% capacity loss mainly originates from the formation of a solid electrolyte interphase (SEI) layer.17 In addition to the first discharge curve, subsequent other curves exhibit a similar Li+ storage behavior (Fig. 3a) to imply a good stability of the electrode structure. The CV curves (Fig. 3b) represent a series of cathodic/anodic peaks below 0.5 V contributed from the alloying/dealloying of Ge.17,27 Besides these peaks, in the first curve a cathode peak at 0.92 V attributed to the formation of SEI layer disappears in subsequent cycles to confirm a good stability of the SEI layer. The average CE in the following description is calculated from the 3rd to the final cycle. A high specific capacity of 1607.8 mA h g−1, corresponding to a high volumetric capacity of 2090.1 mA h cm−3, is obtained after 100 cycles at 0.1C with a capacity retention of 108.3% and an average CE of 99.91% (Fig. 3c). Such a high capacity retention implies a high stability of the electrode structure, which is investigated by observing an electrode change upon cycling by SEM and TEM. After 100 cycles, the Ge/C electrode shows undamaged morphology (Fig. S1a, ESI†) and a low thickness change of 34.1% compared with pristine electrode (Figs. S1b and c, ESI†). Besides, the Ge nanoparticles without pulverization are observed (Fig. S1d–f, ESI†). These results demonstrate that the electrode structure during cycling is highly stable. However, the average size of Ge nanoparticles changes from pristine ∼20 to ∼24 nm (Fig. S1d and e, ESI†) and Ge nanoparticles become a disordered structure after cycling (Fig. S1f, ESI†). The results show that the size of the Ge nanoparticles increases and their structures change from crystalline to amorphous after cycling, which is consistent with the previous reports.28,29 Therefore, the increase of electrode thickness is mainly caused by the increase of the size of Ge nanoparticles and the formation of a SEI layer. So the small thickness change is from the structural advantages of Ge/C nanocomposites: (i) Ge nanoparticles (∼20 nm) can well accommodate a large strain to lessen volume expansion;8 (ii) N,O co-doped carbon as a buffer matrix can effectively constrain volume expansion;13 (iii) the nanoscopically and evenly distributed structure can make strain uniformly distribute in the nanocomposite to mitigate volume expansion;7,8,10 (iv) the highly mesoporous structure has an accommodation capacity of volume expansion; (v) Bridge effect of N and O atoms between Ge and C via Ge–O–C and Ge–N–C bonds can heighten the interfacial structural stability to ease volume expansion.13,26
The cyclability at a high current density is also investigated. High capacities of 1095.3 mA h g−1 with a 98.8% capacity retention after 1000 cycles at 2C (Fig. 3d) and 926.8 mA h g−1 with a 94.4% capacity retention after 3000 cycle at 5C (Fig. 3e) are obtained. Besides, the cyclability at different mass loadings at 0.1C are also obtained (Fig. 3f), corresponding to the first reversible areal capacities of 3.2, 3.6, and 4.1 mA h cm−2 with a capacity retentions of 99.9, 99.1, and 97.6% after 100 cycles for mass loadings of 2.0, 3.0, and 4.0 mg cm−2, respectively. From these results, the Ge/C has a better excellent cyclability whether in a low or high current density, or high areal capacity than those in recent reports of Ge-based anodes (Table S1, ESI†). It is noteworthy that the reversible capacity (1607.8 mA h g−1) of Ge/C is higher than that in almost all of previous reports (Table S1, ESI†), which may be contributed by the high pseudocapacity confirmed in Fig. S2, ESI.† The contribution percentages of pseudocapacitance increase from 30.1% to 52.5% with an increasing scanning rate from 0.1 to 1 mV s−1 to confirm the momentous part of pseudocapacitance in capacity, especially at a high scan rate, which may be from additional Li+ storage sites, such as defects,26,30 phase boundaries,8,26,30,31 and the mesoporous structure.12,26,31
The rate curves (Fig. 3g) at different current densities show similar lithium ion storage behavior to confirm a good stability of the electrode during rate testing. The reversible capacities of 1531.9, 1493.4, 1368.2, 1238.5, 1099.1, 932.2, 745.3, and 491.7 mA h g−1 are obtained at 0.1, 0.2, 0.5, 1, 2, 5, 10, and 20C, respectively (Fig. 3h). When the current reverts to 0.1C, the initial capacity is regained to further confirm a high stability of the electrode structure. The result implies that the Ge/C anode possesses an outstanding rate capability higher than that in the most recent reports (Table S1, ESI†). In order to determine the positive effect of N and O atoms bridging Ge and C on Li+ storage performances, the Ge/C nanocomposite without N and O atoms is fabricated by only the pyrolysis of BS. It can be seen that the Ge/C nanocomposite in the absence of N and O bridging shows a similar morphology to that of the Ge/C with N and O atoms, but only delivers a capacity of 1472.4 mA h g−1 with an 82.7% capacity retention after 100 cycles at 0.1C and 78.3 mA h g−1 at 20C (Fig. S3, ESI†), which are much lower than those of Ge/C with N and O bridging. Besides this, after 100 cycles, it can be observed that the Ge–O–C and Ge–N–C bonds still exist in the Ge/C nanocomposites (Fig. S4, ESI†). The results fully confirm that N and O atoms closely bridging Ge and C considerably enhance the electrochemical performances of the nanocomposite. The carbon matrix is synthesized by only pyrolysis of DMF (Fig. S5, ESI†). It can be seen that the carbon matrix is amorphous and N,O-codoped and shows a capacity of 614.2 mA h g−1 at 0.1C, 455.2 mA h g−1 with a 101.1% capacity retention after 100 cycles at 1C, and 149.8 mA h g−1 at 20C. The results show that the carbon matrix has a high capacity, a long cyclability, and a good rate capability, which is conducive to the enhancement of lithium–ion storage performances of the hybrid composites.
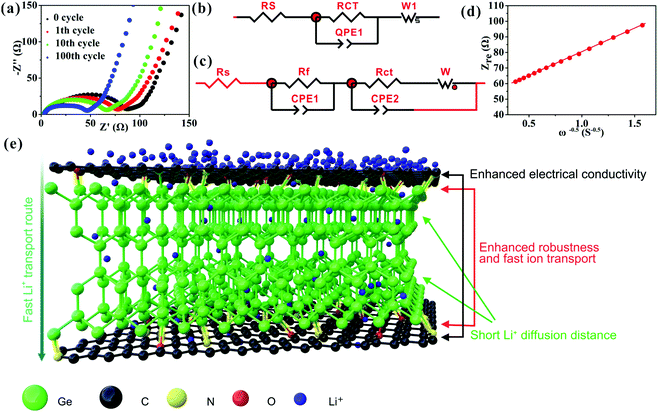
The prominent rate capability of the Ge/C is in connection with its high EC (3.5 × 10³ S m−1), low Li+ transport resistance, and high Li+ diffusion coefficient (DLi+), as discussed below. The EIS (Fig. 4a) of the Ge/C at different cycling numbers are fitted to equivalent circuits (Fig. 4b and c), where Rs is the electrolyte resistance, Rf the SEI layer resistance, Rct the charge transfer resistance and W the Warburg impedance of Li+ diffusion.30 Upon cycling, the value of Rf is basically unchanged (Table S2, ESI†) to further demonstrate the high stability of the SEI layer. Besides this, the reduction of Rct upon cycling (Fig. 4a and Table S2, ESI†) is extremely beneficial for Li+ transport kinetics, which is further explored in the EIS after 100 cycles via the relationship between the real impedance (Zre) and reciprocal square root of lower angular frequencies (ω−1/2) (Fig. 4d). The Warburg impedance coefficient (σω) and DLi+ can be achieved based on Zre = Rs + Rf + Rct + σωω−1/2 and DLi+ = (RT/AF2σωC)2, respectively, where R is the gas constant, T is the absolute temperature, F is the Faraday constant, A is the electrode area, and C is the molar concentration of Li+.30 The calculated σω and DLi+ values of the Ge/C are 30.2 Ω S−1/2 and 3.1 × 10⁻¹⁰ cm2 s−1, respectively. This low σω and high DLi+ can markedly boost the Li+ diffusion rate to ensure exceedingly good rate capability. The excellent cyclability and rate capability of the Ge/C nanocomposite are attributed to its homogeneously dispersed structure at the nanoscale, highly mesoporous structure, and N,O co-doped C (Fig. 4e). Especially, N and O atoms effectively bridge Ge nanocrystals and C via the interfacial bichemical bonds of Ge–O–C and Ge–N–C (Fig. 4e) to enhance the robustness of the composite structure and accelerate the transport rate of Li+ into the composite, thus ensuring outstanding Li+ storage performances.
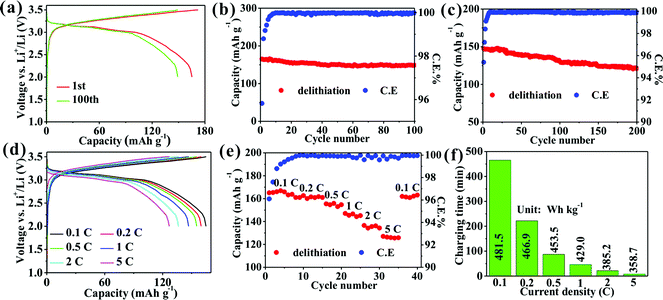
A full cell with LFP as the cathode delivers a high capacity of 165.3 mA h g−1 with a capacity retention of 90.2% after 100 cycles and an average CE of 99.93% at 0.1C (Fig. 5a and b) and 147.5 mA h g−1 with a capacity retention of 81.9% after 200 cycles and an average CE of 99.90% at 1C (Fig. 5c). Such a high capacity retention and CE imply the excellent cyclability and reversibility of the full cell. Clearly, a discharge platform appears from 3.0 to 3.2 V (Fig. 5a) to produce a high nominal voltage of 3.1 V. Remarkably, a series of high capacities of 165.1, 160.1, 155.5, 147.1, 136.5, and 127.1 mA h g−1 are obtained at 0.1, 0.2, 0.5, 1, 2, and 5C, respectively, (Fig. 5d and e). Such a high capacity of 127.1 mA h g−1 is achieved at 5C, which confirms the striking rate capability of the full cell. The calculated gravimetric/volumetric energy densities (introduced in detail in ESI†) at 0.1C are 481.5 W h kg−1/1019.1 W h L−1 higher than those of full cells of graphite/LFP,32 graphite/LiCoO2 (LCO),33 SiOx/C/LCO,34 and Si/C/LCO.35 Importantly, the energy density of 358.7 W h kg−1 at 5C obtained within a charging time of less than 8 minutes (Fig. 5f) reached 74.5% of the energy density obtained at 0.1C, which has been not reported previously and shows the promising practicability of the Ge/C anode for next-generation fast-charging high-energy-density LIBs.
Conclusions
To conclude, a novel Ge/C nanocomposite was fabricated via the one-step pyrolysis of a mixture of BS and DMF in a sealed vessel. The Ge/C nanocomposite possesses a unique structure in that Ge nanocrystals (∼20 nm) are evenly distributed into a highly mesoporous N,O co-doped carbon matrix to form numerous phase boundaries, in which N and O atoms tightly bridge Ge and C via vast interfacial chemical bonds of Ge–N–C and Ge–O–C. The structure endows the Ge/C with a high capacity of 1607.8 mA h g−1, a remarkable cyclability (94.4% capacity retention after 3000 cycles at 5C), and a striking rate capability (491.7 mA h g−1 at 20C) as an LIB anode in half cells. Remarkably, a high energy density of 481.5/358.7 W h kg−1 at 0.1/5C, a high volumetric energy density of 1019.1 Wh L−1, and excellent cyclability (capacity retention of 81.9% after 200 cycles at 1C) were obtained in full cells.Conflicts of interest
There are no conflicts of interest to declare.Acknowledgements
Meisheng Han acknowledges support from the Guangdong Basic and Applied Basic Research Foundation (2020A1515110762). Technical support from the Ceshigo Research Service agency for the TEM, http://www.ceshigo.com is gratefully acknowledged. Thanks to Eric Zhang from ZhongKe BlueOcean (TianJin) Technology Co., Ltd. (http://www.zkbotj.com) for the SEM and BET experimental analysis. Thanks to Jiaojiao Fang from the Shiyanjia Lab (http://www.shiyanjia.com) for the SEM analysis.References
- J. Liu, Z. Bao, Y. Cui, E. J. Dufek, J. Goodenough, P. Khalifah, Q. Li, B. Liaw, P. Liu, A. Manthiram, Y. Meng, V. R. Subramanian, M. Toney, V. Viswanathan, M. Whittingham, J. Xiao, W. Xu, J. Yang, X. Yang and J. Zhang, Nat. Energy, 2019, 4, 180–186 CrossRef CAS.
- Y. Liu, Y. Zhu and Y. Cui, Nat. Energy, 2019, 4, 540–550 CrossRef.
- J. Dahn, T. Zheng, Y. Liu and J. Xue, Science, 1995, 270, 590–593 CrossRef CAS.
- M. Yoshio, H. Wang and K. Fukuda, Angew. Chem., Int. Ed., 2003, 42, 4203–4206 CrossRef CAS.
- C. Chan, H. Peng, G. Liu, K. McIlwrath, X. Zhang, R. A. Huggins and Y. Cui, Nat. Nanotechnol., 2008, 3, 31–35 CrossRef CAS.
- S. Choi, J. Kim, N.-S. Choi, M. Kim and S. Park, ACS Nano, 2015, 9, 2203–2212 CrossRef CAS.
- M. Han, Y. Mu and J. Yu, Energy Technol., 2019, 8, 201901202 Search PubMed.
- M. Han and J. Yu, J. Power Sources, 2019, 414, 435–443 CrossRef CAS.
- M. Han and J. Yu, Energy Technol., 2019, 7, 1900084 CrossRef.
- M. Han, Y. Mu, F. Yuan, J. Liang, T. Jiang, X. Bai and J. Yu, J. Mater. Chem. A, 2020, 8, 3822–3833 RSC.
- D. McNultya, H. Geaneya, D. Buckleya and C. O'Dwyera, Nano Energy, 2018, 43, 11–21 CrossRef.
- M. Han, Y. Mu and J. Yu, Mater. Adv., 2020, 1, 421–429 RSC.
- M. Han, Z. Lin and J. Yu, J. Mater. Chem. A, 2019, 7, 4804–4812 RSC.
- I. Kim, S.-W. Park and D.-W. Kim, Chem. Eng. J., 2019, 375, 122033 CrossRef CAS.
- J. Hwang, C. Jo, M. Kim, J. Chun, E. Lim, S. Kim, S. Jeong, Y. Kim and J. Lee, ACS Nano, 2015, 9, 5299–5309 CrossRef CAS.
- F. Pantò, Y. Fan, S. Stelitano, E. Fazio, S. Patanè, P. Frontera, P. Antonucci, N. Pinna and S. Santangelo, Adv. Funct. Mater., 2018, 28, 1800938 CrossRef.
- Y. Wang, S. Luo, M. Chen and L. Wu, Adv. Funct. Mater., 2020, 30, 2000373 CrossRef CAS.
- J. Graetz, C. Ahn, R. Yazami and B. Fultz, J. Electrochem. Soc., 2014, 151, 698–702 CrossRef.
- M.-H. Park, Y. Cho, K. Kim, J. Kim, M. Liu and J. Cho, Angew. Chem., Int. Ed., 2011, 50, 9647–9650 CrossRef CAS.
- H. Kim, Y. Son, C. Park, J. Cho and H. Choi, Angew. Chem., Int. Ed., 2013, 52, 5997–6001 CrossRef CAS.
- D. Xue, S. Xin, Y. Yan, K. Jiang, Y. Yin, Y. Guo and L. Wan, J. Am. Chem. Soc., 2012, 134, 2512–2515 CrossRef CAS.
- B. Wang, J. Jin and Z. Wen, Chem. Eng. J., 2018, 360, 1301–1309 CrossRef.
- K. Huo, L. Wang, C. Peng, X. Peng, Y. Li, Q. Li, Z. Jin and P. Chu, J. Mater. Chem. A, 2016, 4, 7585–7590 RSC.
- D. Youn, N. Patterson, H. Park, A. Heller and C. Mullins, ACS Appl. Mater. Interfaces, 2016, 8, 27788–27794 CrossRef CAS.
- E. Lewin, M. Parlinska-Wojtan and J. Patscheider, J. Mater. Chem., 2012, 22, 16761–16773 RSC.
- M. Han, Y. Mu, F. Yuan, X. Bai and J. Yu, J. Power Sources, 2020, 465, 228206 CrossRef CAS.
- H. Guo, B. Ruan, L. Liu, L. Zhang, Z. Tao, S. Chou, J. Wang and H. Liu, Small, 2017, 13, 1700920 CrossRef.
- Y. Son, M. Park, Y. Son, J.-S. Lee, J.-H. Jang, Y. Kim and J. Cho, Nano Lett., 2014, 14, 1005–1010 CrossRef CAS.
- X. Liu, S. Huang, S. T. Picraux, J. Li, T. Zhu and J. Huang, Nano Lett., 2011, 11, 3991–3997 CrossRef CAS.
- M. Han, Z. Lin, X. Ji, Y. Mu, J. Li and J. Yu, Mater. Today Energy, 2020, 17, 100445 CrossRef.
- H. Kim, W. Choi, J. Yoon, J. Um, W. Lee, J. Kim, J. Cabana and W.-S. Yoon, Chem. Rev., 2020, 120, 6934–6976 CrossRef CAS.
- Y. Mu, M. Han, J. Li, J. Liang and J. Yu, Carbon, 2021, 173, 477–484 CrossRef CAS.
- M. Ko, S. Chae, J. Ma, N. Kim, H.-W. Lee, Y. Cui and J. Cho, Nat. Energy, 2016, 1, 1–8 Search PubMed.
- Z. Liu, Y. Zhao, R. He, W. Luo, J. Meng, Q. Yu, D. Zhao, L. Zhou and L. Mai, Energy Storage Mater., 2019, 19, 299–305 CrossRef.
- H. J. Kwon, J.-Y. Hwang, H.-J. Shin, M.-G. Jeong, K. Y. Chung, Y.-K. Sun and H.-G. Jung, Nano Lett., 2020, 20, 625–635 CrossRef CAS.
Footnote |
| † Electronic supplementary information (ESI) available. See DOI: 10.1039/d1ma00021g |
| This journal is © The Royal Society of Chemistry 2021 |

