DOI:
10.1039/D0MA00979B
(Paper)
Mater. Adv., 2021,
2, 1302-1312
Nanoconfined growth of lithium-peroxide inside electrode pores: a noncatalytic strategy toward mitigating capacity–rechargeability trade-off in lithium–air batteries†
Received
13th December 2020
, Accepted 7th January 2021
First published on 7th January 2021
Abstract
Capacity–rechargeability trade-off in lithium–air batteries remains as one of the major challenges before their practical realization. As the discharge capacity increases, an uncontrolled growth of lithium-peroxide leads to passivation of the conductive electrode by a thick insulating layer that limits charge transport and results in a high overpotential during recharge. In contrast, deposition of lithium-peroxide inside a spatially confined electrode-space can restrict the growth and improve the rechargeability of the cell. The small crystallite size of spatially confined lithium-peroxide inside a porous framework is expected to show higher charge-transport that should play a crucial role in its facile decomposition. Here, a prototypical approach shows how a controlled increase in pore diameter, pore volume and electrochemically active surface area of a mesoporous carbon produces much higher discharge capacity by improving mass diffusion inside the mesoporous channels, yet simultaneously achieves an efficient rechargeability due to pore-confinement of lithium-peroxide.
Introduction
The highest theoretical specific energy of 3.5 kW h kg−1 makes lithium–air (Li–air) batteries one of the most promising future energy storage technologies for both stationary and mobile applications. Ideally, the overall electrochemical reaction in a nonaqueous Li–air battery involves a two-electron (2e−) redox of oxygen (O2) in the presence of lithium (Li+) ions (2Li+ + O2 + 2e− ↔ Li2O2(s); E0 = 2.96 V vs. Li/Li+) leading to reversible formation (by the oxygen reduction reaction (ORR)) and decomposition (by the oxygen evolution reaction (OER)) of solid lithium peroxide (Li2O2) during discharge (DC) and recharge (RC), respectively.1 However, passivation of the conducting electrode by this ostensibly insulating solid Li2O2 layer (both ionic and electronic conductivities in the range of 10−19 to 10−20 S cm−1 at 25 °C) and diffusion–limitation of electroactive species in the electrode-pores result in lower than theoretically predicted capacity, poor rechargeability, low rate capability etc.2–5 Although an increase in carbon surface area as well as pore volume accessible to both O2 and electrolyte could increase the DC capacity (QDC) of the cell, growth of large insulating crystals of Li2O2 with an increase in QDC often led to deterioration of rechargeability as well as poor cyclability.6–8 The reason behind this low rechargeability is the limitation in charge transport through a thick Li2O2 layer that results in a high RC potential >4 V vs. Li/Li+ and causes decomposition of both the nonaqueous electrolyte and carbon electrode.4,9,10 Worsening the situation, efforts to solve the rechargeability problem in Li–air batteries using solid electrocatalysts could not truly improve the ORR/OER reversibility.11,12 Rather, the use of these “catalysts” exacerbated electrolyte/electrode instabilities. Furthermore, the soluble redox-mediators also seemed to have (in)stability issues and their use on an unprotected anode led to passivation of the Li metal electrode.13,14 Therefore, it is necessary to identify a suitable noncatalytic strategy to increase the capacity without sacrificing the rechargeability of a Li–air battery.
Alternative to the usual uncontrolled growth of Li2O2 on widely used carbon nanotube (CNT) or carbon particle (Ketjen Black (KB), Super P (SP) etc.) based electrodes, confining the nucleation-and-growth of Li2O2 inside the framework-pores of a nanoporous carbon electrode can restrict the spatial growth of the discharge product below electron-tunnelling length and produce a nano-crystalline Li2O2 with small domain size. Compared to bulk crystalline Li2O2, this spatially confined poorly crystalline Li2O2 with a large interface with the carbon electrode is expected to show higher ionic and electronic conductivities that should suppress the recharge overpotential and help to achieve high round-trip energy efficiency in a Li–air battery.15,16 However, at the same time it is necessary to ensure facile mass-transport and enough space inside the porous framework to produce large QDC in the cell. Subsequently, as a result of improved mass and charge transport due to nanoconfinement of Li2O2 in an electrode with sufficient porosity, high rate-capability during both DC and RC of the cell can also be achieved. Based on this idea, herein, we first confirm that compared to the uncontrolled growth of Li2O2 on several commercial carbon electrodes, nanoconfinement of Li2O2 inside a mesoporous carbon results in a much higher round-trip energy efficiency (ratio of energy densities during DC and RC respectively) that does not deteriorate with an increase in the depth of DC in a Li–air battery. Furthermore, we show that a controlled increase in the electrochemically active surface area (ECSA), pore diameter and pore volume of the mesoporous carbon electrode gradually enhances QDC by improving the diffusion of electroactive species inside the mesoporous channels and simultaneously maintains an efficient rechargeability in a Li–air battery due to the decomposition of nanocrystalline Li2O2 confined inside discrete pores of the electrode. It has been found that proper optimization of the physico-chemical properties of the carbon electrode could achieve ∼2.5 times improvement in QDC but at the same time maintained an average RC potential of ∼3.6 V vs. Li/Li+ which is 400 to 700 mV lower than that of several other commercial carbon electrodes under similar conditions. This report demonstrates a prototypical strategy of a simple physico-chemical alteration in a porous carbon electrode as a metal-catalyst/promoter-free solution toward the capacity–rechargeability trade-off in Li–air batteries.
Results and discussion
Effect of pore-confinement of Li2O2 in Li–air cells
In order to verify the effect of pore-confined Li2O2 on suppressing RC overpotential (ηRC = | E0 − ERC |) we begin with comparing the DC/RC profiles of various carbon electrodes, such as CNT, KB, SP and mesoporous CMK-3, which have completely different surface morphologies and pore structures. While KB and SP carbons show particle-like morphology with 40–60 nm diameter, CNTs have tubular morphology with an average outer diameter of 20–40 nm and a length of 5–15 μm. The morphologies of these carbons are shown by the scanning electron microscopic (SEM) images in Fig. S1(a) (ESI†). Despite differences in morphologies, however, all these three commercial carbons give rise to inter-particle porosity with a random distribution of pore-space having diameter in the range of 50–100 nm. In contrast, CMK-3 with bead-like morphology has hexagonally ordered cylindrical mesopores (<4 nm diameter) aligned parallel to each other inside the carbon framework.17 Fig. S1(b) and (c) (ESI†) respectively show nitrogen adsorption/desorption isotherms measured at −196 °C and pore-size distribution by the Barrett–Joyner–Halenda (BJH) method for different carbons. The pore structures are schematically presented in Fig. S1(d) (ESI†). At first, DC/RC of the cells was carried out in dry air (maximum dew point <−60 °C, <11 ppm (v/v) H2O) using 1 M lithium bis(trifluoromethanesulfonyl)imide (LiTFSI) in tetraethylene glycol dimethyl ether (TEGDME or tetraglyme; <20 ppm H2O) as the electrolyte up to a limited QDC of 500 mA h g−1 at the same DC/RC current density (jDC/RC) of 100 mA g−1. The galvanostatic DC/RC profiles in Fig. 1(a) show quite similar DC potentials for all the electrodes, but significantly different RC potentials. Among these carbons, the mesoporous CMK-3 electrode shows the lowest average RC potential of 3.6 V vs. Li/Li+, whereas the same for SP, CNT and KB are 4.28, 4.17 and 3.98 V vs. Li/Li+ respectively. Fig. 1(b) further shows that CMK-3 has the highest overall round-trip energy efficiency of 74% which is 7–14% higher than those of the other carbons. During DC in the non-mesoporous carbons the inter-particle void spaces get filled with a thick film-like crystalline Li2O2 (>50 nm thick) that has very poor ionic as well as electronic conductivities and as a result, the decomposition of this insulating Li2O2 on these non-mesoporous carbons requires very high ηRC (usually, ηRC > 1 V). On the other side, the low ηRC in the CMK-3 electrode can certainly be corroborated to the facile decomposition of nanoconfined Li2O2 inside the mesoporous channels having an average pore diameter of 3.6 nm (see later).
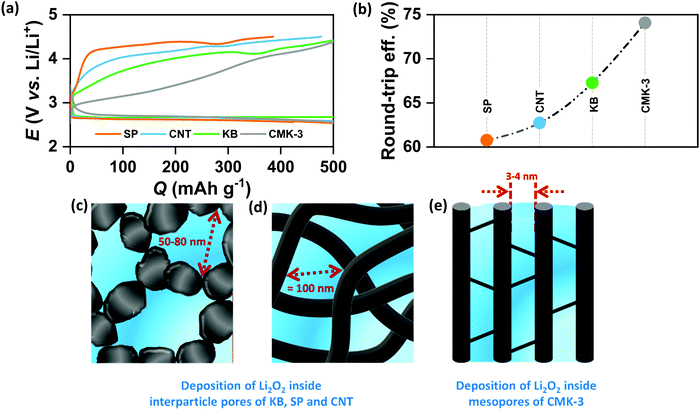 |
| | Fig. 1 (a) Galvanostatic discharge (DC)/recharge (RC) profiles of Li–air cells with different carbon electrodes in 1 M LiTFSI/tetraglyme electrolyte up to a fixed capacity of 500 mA h g−1 at the same current density of 100 mA g−1. (b) Comparison of round-trip efficiencies calculated from the ratio of energy densities during DC and RC respectively for the Li–air cells with different electrodes. Schematic representation of Li2O2 deposition (shown in blue) inside (c) KB/SP, (d) CNT and (e) CMK-3 electrodes. | |
The spatially restricted growth keeps the thickness of Li2O2 well below the electron tunneling limits (∼10 nm) and the small crystallite size results in much higher ionic conductivity compared to crystalline Li2O2.2,15 Therefore, circumvention of charge-transport-limitation by nanoconfinement of Li2O2 should be a definite reason behind the suppression of ηRC in the CMK-3 electrode. The deposition of Li2O2 in these carbon electrodes is shown by the SEM images in Fig. S1(e) (ESI†) and is schematically presented in Fig. 1(c–e). In order to verify the possibility of mass diffusion inside the mesoporous channels of CMK-3, we have precisely determined the hydrodynamic radii of the electroactive species in the electrolyte by using the Stokes–Einstein equation
where
D,
kB,
T,
μ and
r are the diffusion coefficient of the electroactive species, Boltzmann constant, temperature, viscosity of the electrolyte and hydrodynamic radius of the electroactive species in the electrolyte solution, respectively. The hydrodynamic radii of oxygen, Li
+ and TFSI
− species in 1 M LiTFSI/tetraglyme solution under an air atmosphere (∼0.21 bar O
2) are calculated to be ∼1.2, 0.41 and 0.28 nm, respectively, and detailed information with the values of all parameters used in this calculation is provided in the ESI.
† These results confirm that the electroactive species can permeate through the porous channels of the CMK-3 electrode and take part in the electrochemical reactions inside the confined pore-space. However, it should be noted that although the hydrodynamic radii of the electroactive species are smaller than the radii of the mesopores in CMK-3 and additional capillary forces help O
2 and electrolyte solution to diffuse into the mesoporous channels, the deposition of solid Li
2O
2 continuously decreases the porosity and blocks the diffusion channels during DC.
18,19 As a result, the CMK-3 electrode shows much lower
QDC (827 mA h g
−1) than that calculated (1920 mA h g
−1) from full utilization of the mesopore volume (0.71 cm
3 g
−1) (see later). Nonetheless, oxygen diffusion limitation is a general problem in air-electrodes, which are quite sensitive to the partial pressure of oxygen (
pO2) in the feed gas. The effect of
pO2 on
QDC of the electrodes was indeed observed when DC/RC of the cells was carried out in both dry air (
pO2 = 0.21) and pure oxygen (
pO2 = 1). Unsurprisingly, the
QDC of the air-cells has been found to be much lower than that of the cells operated in pure oxygen. Fig. S2(a) and (b) (ESI
†) show the full DC/RC curves of the different carbons under pure oxygen and dry air respectively with the cut-off conditions of 2–4.5 V
vs. Li/Li
+ at
jDC/RC of 100 mA g
−1. In Fig. S2(c) (ESI
†) we have shown a comparison between the
QDC of oxygen and air cells for the respective carbon electrodes and a significantly lower
QDC, roughly in the range of 35–65%, has been observed for all these carbons when air instead of oxygen is used as the feed gas. Nevertheless, practical applications of these batteries require operation in ambient air with simultaneously high energy and power densities as well as efficient rechargeability. Optimistically, the high rechargeability in the CMK-3 electrode is also maintained with ∼73% round-trip efficiency which is 6–13% higher than that of other carbons under an air atmosphere for a full DC up to 2 V
vs. Li/Li
+ and the results are shown in Fig. S2(d) (ESI
†). Owing to this high rechargeability, therefore, an efficient way has to be found out to further enhance the
QDC of the mesoporous electrode toward mitigating the capacity–rechargeability trade-off in Li–air cells. In order to enhance the
QDC of the mesoporous electrode, we adopted two different strategies: one of these was to induce solution mediated DC, while the other was to strategically modify the porosity of the carbon to enhance mass diffusion inside the porous framework.
Promoter assisted increase in QDC of the mesoporous electrode
Lithium nitrate (LiNO3) and 2,5-di-tert-butyl-1,4-benzoquinone (DBBQ) were considered as the two promoters to induce solution mediated growth of Li2O2 and to increase the QDC of the CMK-3 electrode.20,21 Specifically, we used 1 M LiNO3 in tetraglyme and 1 M LiTFSI + 50 mM DBBQ in tetraglyme as the two electrolytes in Li–air cells. Fig. 2(a) shows the full DC/RC curves of CMK-3 electrodes in different electrolytes with or without promoters under dry air with the cut-off conditions of 2–4.5 V vs. Li/Li+ at jDC/RC of 100 mA g−1. It is indeed found that the use of LiNO3 and addition of DBBQ to LiTFSI as a promoter significantly increase the QDC of CMK-3 electrodes. A quantitative comparison of QDC in different electrolytes in Fig. 2(b) demonstrates that the QDC of CMK-3 increases from 827 mA h g−1 in 1 M LiTFSI to 1319 mA h g−1 in 1 M LiNO3 and 1863 mA h g−1 in 1 M LiTFSI + 50 mM DBBQ in tetraglyme electrolyte. However, this gain in QDC due to enhanced solution mediated deposition of Li2O2 is achieved at the cost of round-trip efficiency of the cells. From Fig. 2(b), the round-trip efficiency of ∼73% in 1 M LiTFSI decreases to ∼67% in 1 M LiNO3 and ∼50% in 1 M LiTFSI + 50 mM DBBQ in tetraglyme. The X-ray diffraction (XRD) patterns in Fig. S3(a) (ESI†) confirm the formation of Li2O2 as the discharge product in all these three electrolytes and a detailed analysis of the XRD data in Fig. S3(b) (ESI†) shows a slight increase in the domain size for the (100) reflection and an anisotropic growth of Li2O2 crystals with enhanced solution mediated DC of the CMK-3 electrode. Since the occurrence of parasitic side reactions is thought to be a reason of poor rechargeability, we have also quantified the discharged Li2O2 by titration with TiOSO4 solution.9 A much lower than 100% yield of Li2O2 after DC definitely indicates the occurrence of parasitic side reactions during DC. However, the Li2O2 yields of 71 ± 2, 74 ± 1 and 67 ± 2% in 1 M LiTFSI, 1 M LiNO3 and 1 M LiTFSI + 50 mM DBBQ respectively do not show any correlation with the rechargeability of the cells. Fig. S4 (ESI†) shows the SEM images of the CMK-3 electrodes after full DC up to 2 V vs. Li/Li+ at 100 mA g−1 in these three electrolytes. Much thicker Li2O2 layers on the outer surface of the electrode, owing to enhanced solution mediated deposition, have been observed after DC in LiNO3 and DBBQ containing electrolytes compared to LiTFSI alone. It is quite reasonable to imagine that inducing solution mediated ORR does not improve the access to the mesopores. Rather, solution phase growth of Li2O2 occurs in the inter-particle void spaces and the outer surface of the mesoporous carbon, which nullifies the benefits of mesopores in nano-structuring Li2O2 during DC. Therefore, the lower rechargeability of the cells in LiNO3 and DBBQ containing electrolytes can be attributed to a thicker Li2O2 layer with slightly larger crystallite size inhibiting facile charge-transfer during RC of the cells.22,23 As a result, a solution mediated increase in QDC in the CMK-3 electrode does not help to solve the capacity–rechargeability trade-off in Li–air batteries.
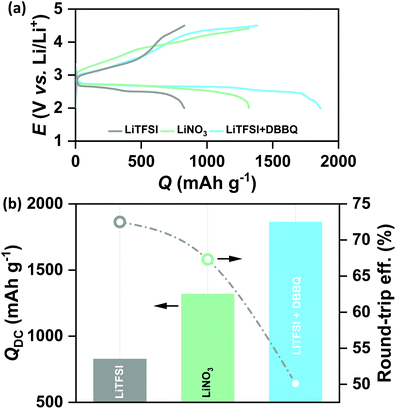 |
| | Fig. 2 (a) Galvanostatic DC/RC profiles of Li–air cells with a mesoporous CMK-3 electrode in different electrolytes and additives in the potential range of 2–4.5 V vs. Li/Li+ at the same current density of 100 mA g−1 and (b) comparison of DC capacity and round-trip efficiency of the cells in (a). | |
Modification of mesoporous carbon for improved mass diffusion
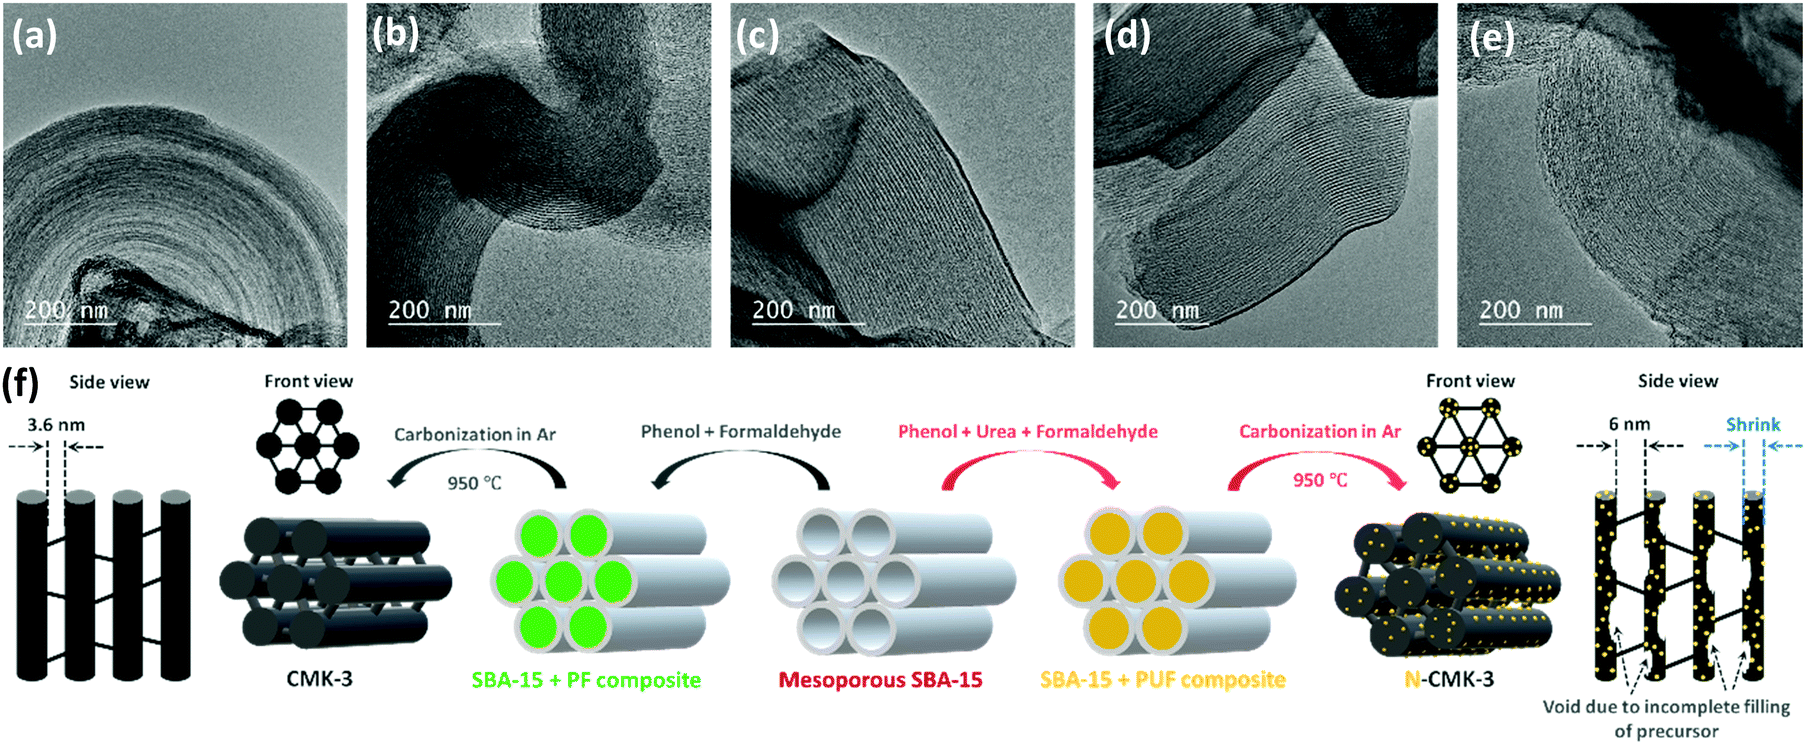
In contrast to promoter assisted uncontrolled growth of Li2O2, modification of the mesoporous carbon in terms of an increase in the pore diameter, pore volume, ECSA and number of ORR active sites should be a better alternative not only to improve mass diffusion inside the porous structure for higher QDC but also to maintain a controlled and restrictive growth of Li2O2 for facile decomposition during RC. Several experimental and theoretical studies have previously demonstrated the activities of N-doped carbons as efficient ORR catalysts that showed higher adsorption energies for both lithium and oxygen and facilitated the nucleation of Li2O2 on the electrode-surface.24–26 Furthermore, compared to precious metal (Pt, Au, Pd and Ru) and transition-metal oxide (MnO2, Mn3O4, Co3O4etc.) catalysts, N-doped carbons are attractive due to their low cost, high electronic conductivity and large surface area. Besides, several N-doped mesoporous carbons were reported to possess bimodal porosity with larger mesopores that can improve mass diffusion during operation of Li–air cells.27,28 For these reasons, and due to relative ease of synthesis, we synthesized N-doped CMK-3 by a hard-templating route using phenol-urea-formaldehyde (PUF) precursor as the carbon source. By changing the concentration of urea, we synthesized four different N-doped CMK-3 carbons which are labelled as N-CMK-3-1 to -4 in the increasing order of N-content. The SEM images of the undoped and N-doped CMK-3 samples showing bulk morphologies and the corresponding elemental mapping by energy dispersive X-ray spectroscopy (EDS) identifying the surface chemical compositions are demonstrated in Fig. S5(a–e) (ESI†). The SEM images show similar morphologies of the CMK-3 and N-CMK-3 samples, whereas the EDS mapping of the N-doped samples confirms quite well dispersed doping of nitrogen in the carbon structure. In addition to nitrogen, high content of oxygen functionalities is also observed in all the carbon samples. In order to provide a quantitative idea about N-doping and to precisely identify the N and O-functionalities, we carried out X-ray photoelectron spectroscopy (XPS) analyses of all the samples. The wide-scan, O1s, N1s and C1s XPS of all the carbon materials are shown in Fig. S6(a–d) (ESI†) and the N/C and O/C values of all the samples are tabulated in Table 1. Deconvoluted N1s XPS show three characteristic peaks at 398.5 ± 0.2, 400.5 ± 0.3 and 403.8 ± 0.3 eV, corresponding to pyridinic, pyrrolic and oxidized nitrogen, respectively, as shown in Fig. S6(c) (ESI†).27 The O1s and C1s XPS of all the samples in Fig. S6(b) and (d) (ESI†), respectively, identify C–O (e.g., phenol, ether, epoxy etc. at C1s ∼286.8 ± 0.3 eV and O1s ∼532.5 ± 0.1 eV), C![[double bond, length as m-dash]](https://www.rsc.org/images/entities/char_e001.gif) O (e.g., carbonyl, quinone etc. at C1s 287.7 ± 0.3 eV and O1s 530.5 ± 0.2 eV) and –COO− (e.g., carboxylic acid, ester, lactone etc. at C1s 289.3 eV) groups to be present as the oxygen functionalities.29 The oxygens present in phenol, formaldehyde and urea are thought to be the sources of these oxygen functionalities in the carbon. The specific surface area (SBET) of all the samples was evaluated by the Brunauer–Emmett–Teller (BET) method from the N2 adsorption/desorption data obtained at –196 °C and the pore structure was analyzed by the Barrett–Joyner–Halenda (BJH) method. The adsorption/desorption isotherms and BJH pore size distributions are shown in Fig. S7(a) and (b) (ESI†) respectively and the corresponding values are summarized in Table 1. In all cases the N2 adsorption/desorption shows a type IV isotherm which is the characteristic of a mesoporous material.30 In the case of CMK-3, a steep N2 adsorption (capillary condensation) takes place in the relative pressure (P/P0) range of 0.45–0.55, indicating the presence of high pore-size uniformity in the framework mesopores.31 The BJH pore size analysis also shows a narrow pore-size distribution with a sharp peak at 3.6 nm. Similar type IV isotherms are observed for all the N-CMK-3 samples except that the capillary condensation takes place at higher P/P0 (>0.6), which indicates the presence of larger mesopores since capillary condensation pressure is a function of pore diameter.30 Furthermore, the H2(b) hysteresis in the isotherms of N-CMK-3 samples evinces the presence of quite complex interconnected ink-bottle-shaped pore networks with a narrow distribution of pore bodies but a wide neck size distribution.32,33 From the BJH pore size analysis it is indeed found that the N-CMK-3 carbons show bimodal porosity and as the N-content increases in the carbon framework, the pore diameter gradually increases and becomes more distributed. Since the samples were synthesized using mesoporous SBA-15 silica as the template, ideally the predominant pore diameter of all the samples should be very close to the wall thickness of SBA-15 (∼4.5 nm). But, due to the shrinkage of the pores in the carbon framework during carbonization of the precursor and template-removal steps, the pore diameter (3.6 nm) of CMK-3 becomes lower than the pore wall thickness of the SBA-15 template. In contrast, the presence of larger mesopores (diameter ∼6 nm) and ink-bottle-like cavities in the N-doped carbons can be explained by the incomplete filling of PUF precursors inside the SBA-15 template during synthesis and partial decomposition of the PUF polymer during the carbonization process, leaving empty space in the carbon backbone. CMK-3 was synthesized by polymerization of the phenol-formaldehyde (PF) mixture and subsequent carbonization of the PF resin. In contrast, for the synthesis of N-CMK-3 samples the PUF precursor was used, where there are possibilities of several individual reactions, such as addition and condensation reactions of phenol, urea, and formaldehyde.34 Therefore, different self-condensation and co-condensation products can be formed during polymerization of the PUF precursor. This difference in the polymerization process can affect the filling level of the SBA-15 template and produce cavities in the resulting N-doped carbons. Furthermore, addition of urea to PF resin results in poor bonding strength and lowers the stability of the resin that can decompose as well as shrink during the carbonization process.35 As a result, the N-CMK-3 samples show larger and more distributed mesopores than the CMK-3 carbon. Consequently, due to this enlargement of pore diameter and formation of interconnected framework cavities, the N-CMK-3 samples exhibit higher pore volume (VBJH) and the values are shown in Table 1. The mesoporous structure of the samples was visualized by transmission electron microscopy (TEM) images which, in Fig. 3(a–e), clearly demonstrate a hexagonally ordered mesopore arrangement for all the samples. Summarizing all these results, it is seen that N-doping of CMK-3 by addition of urea as a precursor not only increases the number of ORR active sites, but also successfully increases the porosity that can be further beneficial for Li–air battery operations. A schematic representation of the synthetic procedure of the mesoporous carbons is shown in Fig. 3(f).
O (e.g., carbonyl, quinone etc. at C1s 287.7 ± 0.3 eV and O1s 530.5 ± 0.2 eV) and –COO− (e.g., carboxylic acid, ester, lactone etc. at C1s 289.3 eV) groups to be present as the oxygen functionalities.29 The oxygens present in phenol, formaldehyde and urea are thought to be the sources of these oxygen functionalities in the carbon. The specific surface area (SBET) of all the samples was evaluated by the Brunauer–Emmett–Teller (BET) method from the N2 adsorption/desorption data obtained at –196 °C and the pore structure was analyzed by the Barrett–Joyner–Halenda (BJH) method. The adsorption/desorption isotherms and BJH pore size distributions are shown in Fig. S7(a) and (b) (ESI†) respectively and the corresponding values are summarized in Table 1. In all cases the N2 adsorption/desorption shows a type IV isotherm which is the characteristic of a mesoporous material.30 In the case of CMK-3, a steep N2 adsorption (capillary condensation) takes place in the relative pressure (P/P0) range of 0.45–0.55, indicating the presence of high pore-size uniformity in the framework mesopores.31 The BJH pore size analysis also shows a narrow pore-size distribution with a sharp peak at 3.6 nm. Similar type IV isotherms are observed for all the N-CMK-3 samples except that the capillary condensation takes place at higher P/P0 (>0.6), which indicates the presence of larger mesopores since capillary condensation pressure is a function of pore diameter.30 Furthermore, the H2(b) hysteresis in the isotherms of N-CMK-3 samples evinces the presence of quite complex interconnected ink-bottle-shaped pore networks with a narrow distribution of pore bodies but a wide neck size distribution.32,33 From the BJH pore size analysis it is indeed found that the N-CMK-3 carbons show bimodal porosity and as the N-content increases in the carbon framework, the pore diameter gradually increases and becomes more distributed. Since the samples were synthesized using mesoporous SBA-15 silica as the template, ideally the predominant pore diameter of all the samples should be very close to the wall thickness of SBA-15 (∼4.5 nm). But, due to the shrinkage of the pores in the carbon framework during carbonization of the precursor and template-removal steps, the pore diameter (3.6 nm) of CMK-3 becomes lower than the pore wall thickness of the SBA-15 template. In contrast, the presence of larger mesopores (diameter ∼6 nm) and ink-bottle-like cavities in the N-doped carbons can be explained by the incomplete filling of PUF precursors inside the SBA-15 template during synthesis and partial decomposition of the PUF polymer during the carbonization process, leaving empty space in the carbon backbone. CMK-3 was synthesized by polymerization of the phenol-formaldehyde (PF) mixture and subsequent carbonization of the PF resin. In contrast, for the synthesis of N-CMK-3 samples the PUF precursor was used, where there are possibilities of several individual reactions, such as addition and condensation reactions of phenol, urea, and formaldehyde.34 Therefore, different self-condensation and co-condensation products can be formed during polymerization of the PUF precursor. This difference in the polymerization process can affect the filling level of the SBA-15 template and produce cavities in the resulting N-doped carbons. Furthermore, addition of urea to PF resin results in poor bonding strength and lowers the stability of the resin that can decompose as well as shrink during the carbonization process.35 As a result, the N-CMK-3 samples show larger and more distributed mesopores than the CMK-3 carbon. Consequently, due to this enlargement of pore diameter and formation of interconnected framework cavities, the N-CMK-3 samples exhibit higher pore volume (VBJH) and the values are shown in Table 1. The mesoporous structure of the samples was visualized by transmission electron microscopy (TEM) images which, in Fig. 3(a–e), clearly demonstrate a hexagonally ordered mesopore arrangement for all the samples. Summarizing all these results, it is seen that N-doping of CMK-3 by addition of urea as a precursor not only increases the number of ORR active sites, but also successfully increases the porosity that can be further beneficial for Li–air battery operations. A schematic representation of the synthetic procedure of the mesoporous carbons is shown in Fig. 3(f).
Table 1 Physico-chemical properties of mesoporous carbons
|
|
N/C |
O/C |
S
BET (m2 g−1) |
V
BJH (cm3 g−1) |
ECSA (m2 g−1) |
| CMK-3 |
0 |
0.093 |
1083 |
0.71 |
20.7 |
| N-CMK-3-1 |
0.029 |
0.072 |
1052 |
1.08 |
26.4 |
| N-CMK-3-2 |
0.032 |
0.091 |
1040 |
1.12 |
27.2 |
| N-CMK-3-3 |
0.04 |
0.087 |
1013 |
1.18 |
28.3 |
| N-CMK-3-4 |
0.051 |
0.09 |
898 |
1.12 |
23.9 |
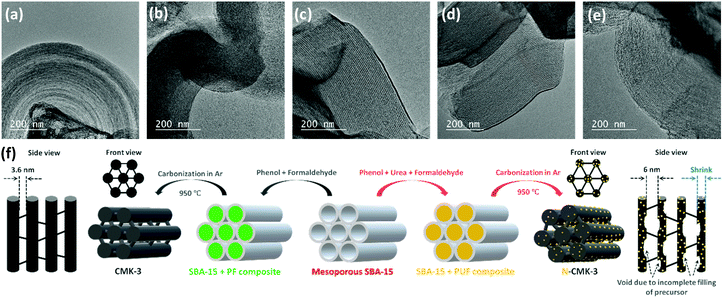 |
| | Fig. 3 Transmission electron microscopy (TEM) images of (a) CMK-3, (b) N-CMK-3-1, (c) N-CMK-3-2, (d) N-CMK-3-3 and (e) N-CMK-3-4. (f) Schematic representation of the synthetic steps for the mesoporous carbons. | |
Discharge of N-CMK-3 electrodes in Li–air cells
All the CMK-3 and N-CMK-3 electrodes were discharged and recharged in 1 M LiTFSI/tetraglyme electrolyte (<20 ppm H2O) under dry air with the cut-off condition of 2–4.5 V vs. Li/Li+ at jDC/RC of 100 mA g−1. Fig. 4(a) shows the galvanostatic DC/RC curves of the undoped and doped CMK-3 electrodes. At a glance, the galvanostatic results demonstrate that N-doping of CMK-3 significantly increases the QDC of the cells. From the quantitative comparison of QDC of doped and undoped CMK-3 electrodes in Fig. 4(b) it is found that with an increase in the N/C atomic ratio, the QDC of the mesoporous carbon gradually increases from 827 mA h g−1 in CMK-3 (N/C = 0) to 1385 (N-CMK-3-1, N/C = 0.029), 1528 (N-CMK-3-2, N/C = 0.032) and 2111 mA h g−1 (N-CMK-3-3, N/C = 0.04) before decreasing to 1668 mA h g−1 in N-CMK-3-4 (N/C = 0.051). Interestingly, the values of QDC do not follow the trend of the N/C ratio and the peak of QDC at 2111 mA h g−1 for N-CMK-3-3 and then a decrease in the value to 1668 mA h g−1 for N-CMK-3-4 certainly indicate that an increase in concentration of nitrogen as the ORR active sites is not the sole reason for capacity enhancement in these N-doped CMK-3 electrodes. In order to understand the reason behind the increase in QDC upon N-doping of the CMK-3 electrode, we thoroughly analyzed the pore structures of these carbon materials. Fig. 4(c) shows a decreasing trend of the SBET with an increase in the N/C ratio. Surprisingly this observation is contradictory to the trend of QDC for these electrodes because intuitively, capacity should be proportional to the surface area of the electrodes. Nonetheless, the pore size and pore volume of these carbons seem consistent with QDC values.
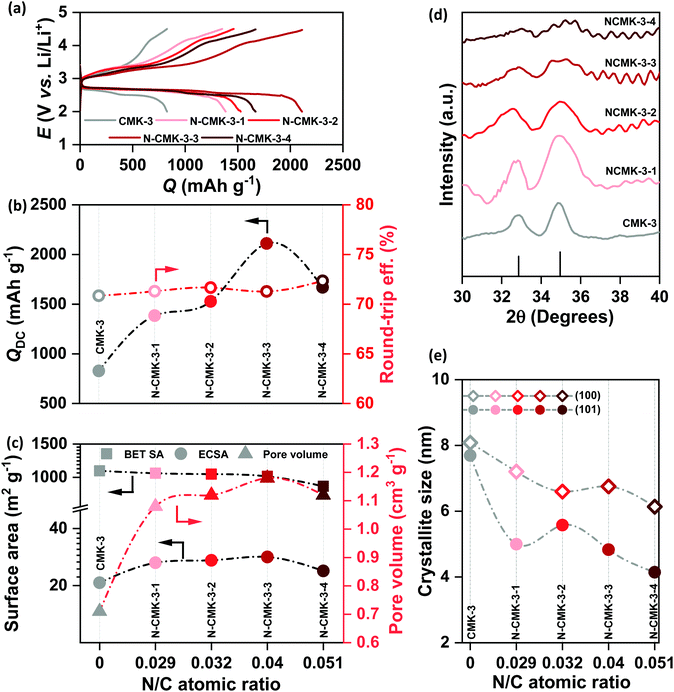 |
| | Fig. 4 (a) Galvanostatic DC/RC profiles of Li–air cells with mesoporous CMK-3 and N-CMK-3 electrodes in 1 M LiTFSI/tetraglyme in the potential range of 2–4.5 V vs. Li/Li+ at the same current density of 100 mA g−1, (b) comparison of DC capacity and round-trip efficiency of the cells in (a), (c) comparison of Brunauer–Emmett–Teller (BET) surface area, electrochemically active surface area (ECSA) and pore volume of the mesoporous carbons, (d) X-ray diffraction (XRD) patterns of the discharged mesoporous electrodes and (e) comparison of lithium-peroxide (Li2O2) crystallite size in different mesoporous electrodes. | |
An increase in the pore diameter from 3.7 to ∼6 nm is certainly expected to enhance mass transport inside the N-CMK-3 electrodes compared to undoped CMK-3. Furthermore, as shown in Fig. 4(c), with an increase in the N/C atomic ratio, the pore volume gradually increases, reaches a peak for N-CMK-3-3 (1.18 cm3 g−1, N/C of 0.04) with ∼66% enhancement from the undoped one (0.71 cm3 g−1, N/C of 0) and then decreases for the N-CMK-3-4 (1.12 cm3 g−1, N/C of 0.051) electrode. As mentioned earlier, during synthesis of these carbons, different filling levels of the pores of the SBA-15 template by the precursors and partial decomposition of PUF resin with relatively low mechanical strength result in higher pore volume in N-CMK-3 samples than in the undoped CMK-3. However, too high fraction of urea for the synthesis of N-CMK-3-4 (urea to phenol ratio of 1![[thin space (1/6-em)]](https://www.rsc.org/images/entities/char_2009.gif) :0.6) might have lowered the mechanical strength of the precursor resin excessively and possible occurrence of several self and co-condensation reactions producing small fragments instead of a continuous polymeric network could lead to partial collapse of the carbon framework during carbonization.34 As a result, N-CMK-3-4 breaks the increasing trend of pore volume with the N/C ratio and shows smaller pore volume than N-CMK-3-3. Since ECSA provides a more precise estimate of the electrode-area available for electrochemical reactions, we measured and plotted the ECSA (see the ESI† for detailed calculation) of these mesoporous carbons in Fig. 4(c). Interestingly, the ECSA values do not follow the trend of SBET, rather show a similar trend of pore volume and correlate with the observed QDC of the electrodes. This correlation can be attributed to enhanced penetration of electroactive species inside the mesoporous framework as the pore diameter and pore volume of the carbon increase. After DC of the cells in air the discharged electrodes were thoroughly analyzed by XPS, infra-red spectroscopy (FTIR) and XRD to identify the predominant DC products. Fig. S8(a and b) (ESI†) show XPS of discharged CMK-3 and N-CMK-3-3 electrodes, respectively. The single component Li1s spectra at ∼55 eV and O1s spectra at ∼532 eV confirm the deposition of Li2O2 as the major DC product.36 Besides, the O1s spectra show additional peaks at >532 eV that can be assigned to –CO3, –CO or SO2 species resulting from parasitic reactions or adsorbed electrolyte residues on the deposited Li2O2 and additionally multiple components in the deconvoluted C1s spectra also indicate the presence of several functionalities, such as C–C, CHx, COxetc., in the discharged electrodes.36 Consistent with the XPS results, the FTIR spectra of the discharged CMK-3 and N-CMK-3 electrodes in Fig. S9 (ESI†) identify Li2CO3 and Li–carboxylates to be the parasitic products during DC. There can be different ways for the formation of parasitic side products in Li–air cells where, in addition to electrolyte and electrode decomposition, the CO2 (0.04%) present in air can also undergo electrochemical reaction during DC to directly produce Li2CO3 as an undesired product.37,38 Nevertheless, the parasitic side reaction between the carbon electrode and the nonaqueous electrolyte with a superoxide intermediate is a persistent problem in a Li–air battery that demands more stable electrolytes and electrode materials.9,10Fig. 4(d) and Fig. S10 (ESI†) show the XRD patterns of the discharged CMK-3 and N-CMK-3 electrodes. These XRD patterns not only confirm Li2O2 as the DC product in these electrodes, but also show a significant decrease in peak intensity at a high N/C ratio in the N-doped carbons. This means lower fractions of crystalline Li2O2 are deposited as the N/C ratio increases. Besides, a gradual broadening of both (100) and (101) reflections of Li2O2 is observed with an increase in the N/C ratio. The broadening of the XRD peaks indicates a decrease in the average Li2O2 crystallite-size which is plotted in Fig. 4(e) for all the samples. It is found that the respective crystallite size for the (100) and (101) reflections of Li2O2 decreases from ∼8 and 7.7 nm in CMK-3 to ∼6.1 and 4.1 nm in N-CMK-3-4. Unlike unrestricted growth of Li2O2 crystals in conventional carbons without framework-porosity, here in the case of these mesoporous carbons the initial nucleation takes place inside a confined porous channel that restricts the spatial growth of Li2O2. As shown earlier in this article, the hydrodynamic radii of the electroactive species are much smaller than that of the mesopores in these N-doped carbons. Furthermore, the interconnected ink-bottle pores in N-CMK-3 electrodes are expected to show more facile mass transport along the mesoporous channels. Once diffuse into the pores, these electroactive species get confined inside the nanoscopic space where heterogeneous interaction between the reactants and the electrode surface is tremendously amplified.39 Consequently, very high interfacial area inside the mesopores significantly enhances the kinetics of the electrochemical reactions. Moreover, the turbostratic structure with considerable defects and N/O-doping enhance the ORR activity in these mesoporous CMK-3 based materials compared to other commercial carbons.26,40 We have compared the ORR activities of all the CMK-3 and N-CMK-3 electrodes by cathodic linear sweep voltammetry (LSV) in the range of 3.2 to 2 V vs. Li/Li+ at a sweep rate of 0.5 mV s−1 using metallic Li as both the counter and reference electrodes. Apparently, the integrated areas under the LSV curves in Fig. S11(a) (ESI†) depicting the amount of charge passed for the ORR show a similar trend of QDC observed in galvanostatic DC. Fig. S11(b) (ESI†) shows the current densities (jORR) of all these electrodes at three different potentials of 2.8, 2.7 and 2.6 V vs. Li/Li+ during LSV scan, where overall a gradual increase in ORR current response has been observed with an increase in the N/C ratio in the N-CMK-3 electrodes. We have also identified the overpotential (η = | 2.96− E|, V) required to reach the jORR of 0.05, 0.1 and 0.15 mA cm−2 in all these undoped and N-doped CMK-3 electrodes and the results in Fig. S11(c) (ESI†) consistently show that with an increase in the N/C ratio the overpotential to reach respective jORR becomes lower. Furthermore, the Tafel plots in Fig. S11(d) (ESI†) yield Tafel slopes of 473, 370, 383, 373 and 443 mV dec−1 for CMK-3 and N-CMK-3-1 to -4 electrodes respectively and these values unequivocally demonstrate an enhancement in ORR activities of the N-CMK-3 electrodes compared to the undoped one. As a result of this good electrocatalytic activity, the strong interaction between depositing Li2O2 and the surface of the N-doped electrode leads to growth of a poorly crystalline thin-film-like Li2O2 on the surface of the carbons, even outside of the porous framework (SEM in Fig. S12, ESI†).41 Therefore, despite higher QDC in N-CMK-3 electrodes, owing to the structural effect of the porous framework as well as the electrocatalytic activities of the N-sites, the size of individual Li2O2 crystallites remains small.
:0.6) might have lowered the mechanical strength of the precursor resin excessively and possible occurrence of several self and co-condensation reactions producing small fragments instead of a continuous polymeric network could lead to partial collapse of the carbon framework during carbonization.34 As a result, N-CMK-3-4 breaks the increasing trend of pore volume with the N/C ratio and shows smaller pore volume than N-CMK-3-3. Since ECSA provides a more precise estimate of the electrode-area available for electrochemical reactions, we measured and plotted the ECSA (see the ESI† for detailed calculation) of these mesoporous carbons in Fig. 4(c). Interestingly, the ECSA values do not follow the trend of SBET, rather show a similar trend of pore volume and correlate with the observed QDC of the electrodes. This correlation can be attributed to enhanced penetration of electroactive species inside the mesoporous framework as the pore diameter and pore volume of the carbon increase. After DC of the cells in air the discharged electrodes were thoroughly analyzed by XPS, infra-red spectroscopy (FTIR) and XRD to identify the predominant DC products. Fig. S8(a and b) (ESI†) show XPS of discharged CMK-3 and N-CMK-3-3 electrodes, respectively. The single component Li1s spectra at ∼55 eV and O1s spectra at ∼532 eV confirm the deposition of Li2O2 as the major DC product.36 Besides, the O1s spectra show additional peaks at >532 eV that can be assigned to –CO3, –CO or SO2 species resulting from parasitic reactions or adsorbed electrolyte residues on the deposited Li2O2 and additionally multiple components in the deconvoluted C1s spectra also indicate the presence of several functionalities, such as C–C, CHx, COxetc., in the discharged electrodes.36 Consistent with the XPS results, the FTIR spectra of the discharged CMK-3 and N-CMK-3 electrodes in Fig. S9 (ESI†) identify Li2CO3 and Li–carboxylates to be the parasitic products during DC. There can be different ways for the formation of parasitic side products in Li–air cells where, in addition to electrolyte and electrode decomposition, the CO2 (0.04%) present in air can also undergo electrochemical reaction during DC to directly produce Li2CO3 as an undesired product.37,38 Nevertheless, the parasitic side reaction between the carbon electrode and the nonaqueous electrolyte with a superoxide intermediate is a persistent problem in a Li–air battery that demands more stable electrolytes and electrode materials.9,10Fig. 4(d) and Fig. S10 (ESI†) show the XRD patterns of the discharged CMK-3 and N-CMK-3 electrodes. These XRD patterns not only confirm Li2O2 as the DC product in these electrodes, but also show a significant decrease in peak intensity at a high N/C ratio in the N-doped carbons. This means lower fractions of crystalline Li2O2 are deposited as the N/C ratio increases. Besides, a gradual broadening of both (100) and (101) reflections of Li2O2 is observed with an increase in the N/C ratio. The broadening of the XRD peaks indicates a decrease in the average Li2O2 crystallite-size which is plotted in Fig. 4(e) for all the samples. It is found that the respective crystallite size for the (100) and (101) reflections of Li2O2 decreases from ∼8 and 7.7 nm in CMK-3 to ∼6.1 and 4.1 nm in N-CMK-3-4. Unlike unrestricted growth of Li2O2 crystals in conventional carbons without framework-porosity, here in the case of these mesoporous carbons the initial nucleation takes place inside a confined porous channel that restricts the spatial growth of Li2O2. As shown earlier in this article, the hydrodynamic radii of the electroactive species are much smaller than that of the mesopores in these N-doped carbons. Furthermore, the interconnected ink-bottle pores in N-CMK-3 electrodes are expected to show more facile mass transport along the mesoporous channels. Once diffuse into the pores, these electroactive species get confined inside the nanoscopic space where heterogeneous interaction between the reactants and the electrode surface is tremendously amplified.39 Consequently, very high interfacial area inside the mesopores significantly enhances the kinetics of the electrochemical reactions. Moreover, the turbostratic structure with considerable defects and N/O-doping enhance the ORR activity in these mesoporous CMK-3 based materials compared to other commercial carbons.26,40 We have compared the ORR activities of all the CMK-3 and N-CMK-3 electrodes by cathodic linear sweep voltammetry (LSV) in the range of 3.2 to 2 V vs. Li/Li+ at a sweep rate of 0.5 mV s−1 using metallic Li as both the counter and reference electrodes. Apparently, the integrated areas under the LSV curves in Fig. S11(a) (ESI†) depicting the amount of charge passed for the ORR show a similar trend of QDC observed in galvanostatic DC. Fig. S11(b) (ESI†) shows the current densities (jORR) of all these electrodes at three different potentials of 2.8, 2.7 and 2.6 V vs. Li/Li+ during LSV scan, where overall a gradual increase in ORR current response has been observed with an increase in the N/C ratio in the N-CMK-3 electrodes. We have also identified the overpotential (η = | 2.96− E|, V) required to reach the jORR of 0.05, 0.1 and 0.15 mA cm−2 in all these undoped and N-doped CMK-3 electrodes and the results in Fig. S11(c) (ESI†) consistently show that with an increase in the N/C ratio the overpotential to reach respective jORR becomes lower. Furthermore, the Tafel plots in Fig. S11(d) (ESI†) yield Tafel slopes of 473, 370, 383, 373 and 443 mV dec−1 for CMK-3 and N-CMK-3-1 to -4 electrodes respectively and these values unequivocally demonstrate an enhancement in ORR activities of the N-CMK-3 electrodes compared to the undoped one. As a result of this good electrocatalytic activity, the strong interaction between depositing Li2O2 and the surface of the N-doped electrode leads to growth of a poorly crystalline thin-film-like Li2O2 on the surface of the carbons, even outside of the porous framework (SEM in Fig. S12, ESI†).41 Therefore, despite higher QDC in N-CMK-3 electrodes, owing to the structural effect of the porous framework as well as the electrocatalytic activities of the N-sites, the size of individual Li2O2 crystallites remains small.
Recharge of N-CMK-3 electrodes in Li–air cells
It is important to note from Fig. 4(a) and (b) that the increase in QDC in the case of N-CMK-3 electrodes does not affect the rechargeability and overall round-trip efficiency of the cells. The average RC potential for all the CMK-3 and N-CMK-3 electrodes has been calculated to be <3.65 V vs. Li/Li+ and Fig. 4(b) shows that >70% round-trip efficiency is maintained in all the N-doped electrodes despite up to ∼2.5 times increase in QDC during full DC/RC in air. These results demonstrate a successful mitigation of capacity–rechargeability trade-off in Li–air battery. A closer look at the galvanostatic curves reveals that the RC at these electrodes starts at potentials very close to 3 V vs. Li/Li+, remains below 3.5 V vs. Li/Li+ up to 50% state of charge (SOC) and goes above 4 V vs. Li/Li+ at 70–75% SOC. Online electrochemical mass spectrometry (OEMS) of N-CMK-3-3 as the representative electrode shows the trend of gas evolution during RC of a cell with N-doped mesoporous carbon. Correlating the RC curve of N-CMK-3-3 in Fig. 5(a) with OEMS data in Fig. 5(b) it is found that O2 gas starts evolving as soon as RC of the cell begins and the onset of O2 evolution is very close to 3 V vs. Li/Li+. The gas evolution trend further shows that as the RC progresses, a copious amount of O2 is evolved below 3.5 V vs. Li/Li+. These observations give direct evidence of a facile decomposition of Li2O2 below 3.5 V vs. Li/Li+ in the case of the N-CMK-3-3 electrode. However, a gradual increase in RC potential and a large amount of carbon dioxide (CO2) evolution at the later part of RC (>4 V vs. Li/Li+) indicate decomposition of deposited parasitic side products, such as lithium carbonate and lithium carboxylate, as evidenced by XPS and FTIR observations. Nevertheless, when compared with OEMS data of the CNT electrode in Fig. S13(a) and (b) (ESI†), this mesoporous N-CMK-3-3 electrode shows much better O2 evolution efficiency and a lower amount of evolved CO2. In the CNT electrode, the onset potential for O2 evolution is >3.5 V vs. Li/Li+ and a significant flux of O2 is achieved only at potentials >4 V vs. Li/Li+. These comparative results definitely confirm the efficiency of N-doped mesoporous carbons for the facile decomposition of Li2O2 during RC of the cell. Interestingly, the efficacy of O2 evolution by the decomposition of Li2O2 seems quite similar for N-CMK-3-3 and CMK-3 electrodes, as shown in Fig. S14(a) and (b) (ESI†). These similarly efficient O2 evolution efficiencies of N-CMK-3-3 and CMK-3 electrodes reaffirm the role of mesopores for the facile decomposition of Li2O2. However, at the same time it indicates no additional contribution from N-sites as an OER catalyst during RC of the Li–air cells. In order to ascertain OER catalytic activity trend with the N/C ratio, we have carried out anodic LSV (0.05 mV s−1) of these electrodes after reduction up to QDC of 0.5 mA h cm−2 as shown in Fig. S15(a) (ESI†) that exhibits two pronounced oxidation peaks, one centered around 3.4 V vs. Li/Li+ and another above 4 V vs. Li/Li+. In order to compare the OER activities of these electrodes, we have analyzed the LSV curves in the ηRC range below 250 mV. The onset potentials for the OER of all the mesoporous electrodes are found to be quite similar and close to 3 V vs. Li/Li+. However, interestingly, the current responses at different overpotentials (see Fig. S15(b), ESI†) and vice versa (see Fig. S15(c), ESI†) do not show any correlation with the N/C ratio. Therefore, the direct role of N-sites in catalyzing the OER cannot be confirmed in these electrodes. Rather, these results evince the predominant effect of nanoconfined Li2O2 in suppressing ηRC of the cells. Although Li2O2 is thought to be a wide-bandgap insulator (band gaps of 5–6.4 eV), electrochemically formed Li2O2 usually possesses several defect sites that act as the charge carriers and improve the overall conductivity.4 Specifically, in the case of mesoporous electrodes, nanocrystalline Li2O2 with a large number of defect-rich interfaces and grain boundaries may play a significant role in enhancing the charge carrier dynamics that should benefit a facile decomposition during RC of the cells.15,22 Moreover, according to density functional theory (DFT) calculations, cohesive interactions of Li and O2 with carbon surfaces during nucleation of Li2O2 lead to electron transfer from the anti-bonding O2 orbitals to the carbon electrode and induce a p-type conductivity at the Li2O2/electrode interface.42 As a result of the strong interaction with carbon, the Li–O bond length in the nucleating Li2O2 may also elongate and diminish the interaction between Li and O atoms resulting in higher mobility of Li+ in the Li2O2 crystal.41 A comparative impedance analysis of discharged KB and N-CMK-3-3 electrodes in Fig. S16 (ESI†) indeed shows more facile charge transport for the latter electrode and supports the hypothesis presented in this work. In the case of N and O-doped carbons, the electron-withdrawing hetero atoms can activate neighboring C atoms for stronger adsorption of Li and O2 and induce deposition of disordered or poorly-crystalline Li2O2 as the discharged product, which is consistent with the XRD results in Fig. 4(d) and (e).43 A prior DFT calculation showed that during DC of the cell the binding of depositing Li2O2 units on top of the initially nucleated disordered Li2O2 layer becomes weak with a lower than expected coordination number and continues building up a disordered structure.16 Therefore, in the cases of N-CMK-3 electrodes depositions of the poorly crystalline Li2O2 having weaker bonding, a lower coordination number and improved ionic/electronic conductivities continue despite an increase in QDC and maintain low ηRC during RC of the cells.
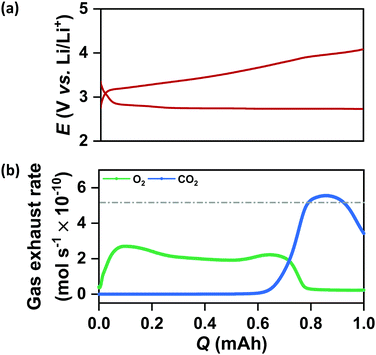 |
| | Fig. 5 (a) Galvanostatic DC/RC profiles of the mesoporous N-CMK-3-3 electrode in 1 M LiTFSI/tetraglyme electrolyte up to a fixed capacity of 1 mAh at 100 mA g−1 and (b) corresponding in situ gas evolution data during recharge of the cell. | |
Comparison of rate capabilities of different electrodes in Li–air cells
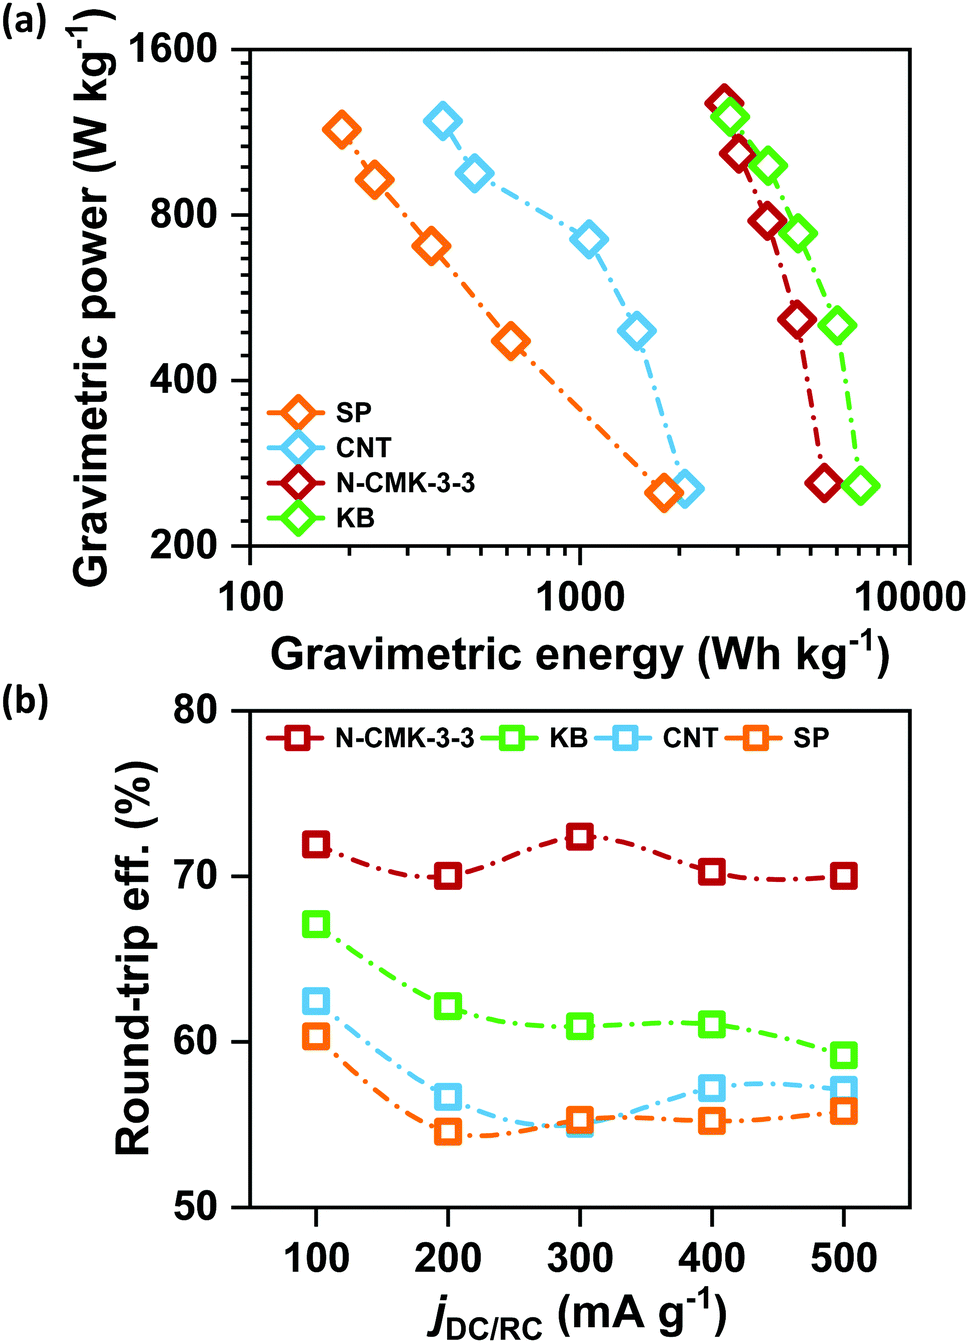
Retention of high QDC together with low ηRC at high current densities is significantly important for the development of practical Li–air batteries. Fig. S17(a)–(d) (ESI†) respectively show the galvanostatic DC/RC curves of Li–air cells with N-CMK-3-3, KB, CNT and SP electrodes at different jDC/RC from 100 to 500 mA g−1. From these DC/RC curves, we have calculated and compared the gravimetric energy and power densities of these electrodes during DC and the results are shown by the Ragone plots in Fig. 6(a). Expectedly, all the electrodes show an apparent anticorrelation between gravimetric energy and power capabilities due to charge transport as well as oxygen diffusion limitations at high jDC. Build-up of an insulating Li2O2 layer during DC increases the electronic resistivity of the carbon electrode and at the same time blocks the oxygen diffusion paths resulting in lower QDC at higher jDC.2,5 Nonetheless, among these carbon electrodes, N-CMK-3-3 and KB show much better retention of gravimetric energy at high power compared to the other two electrodes. Higher surface area (both SBET and ECSA) and pore volume of N-CMK-3-3 and KB than those of CNT and SP can be attributed to this higher energy and power capabilities. Therefore, consistent with a previous report, high surface area and large pore volume in a carbon electrode seem to be essential requirements to achieve simultaneously high energy and power densities during DC of a Li–air battery.5 However, Fig. 6(b) shows that the trend of DC performances in these electrodes does not correlate with the rechargeability of the cell. Considering rechargeability, the performance of N-CMK-3-3 profoundly stands out from the other three electrodes. The N-CMK-3-3 electrode consistently maintains a round-trip energy efficiency of >70% at high jDC up to 500 mA g−1, which is 5–15% higher than those of KB, CNT and SP. This significantly higher rechargeability of the N-CMK-3-3 electrode at a high rate can again be ascribed to the formation of spatially restricted poorly crystalline Li2O2 with better Li+ mobilities that can transport charges more rapidly than bulk crystalline Li2O2 formed in other electrodes.15 These results indicate that high surface area and large pore volume coupled with a mesoporous framework help the N-CMK-3-3 electrode to produce high capacity with efficient rechargeability even at high current rates during both DC and RC, respectively. The efficient rechargeability of the N-CMK-3-3 electrode was tested over repeated cycles and was also compared with the cyclability of the KB electrode under same conditions and the results are shown in Fig. S18 (ESI†). The cycling data further show better performance for the N-CMK-3-3 electrode in suppressing the ηRC over several cycles. However, deterioration in cycling stability is evident for both these electrodes and this can be attributed to parasitic side reactions as explained before.
 |
| | Fig. 6 (a) Ragone plot for Li–air cells with different electrodes in 1 M LiTFSI/tetraglyme and (b) round-trip efficiencies of the Li–air cells cycled in 1 M LiTFSI/tetraglyme in the potential range of 2–4.5 V vs. Li/Li+ at different current densities. | |
Conclusions
In summary, we have successfully demonstrated a noncatalytic strategy to improve the discharge capacity of a Li–air battery without sacrificing the rechargeability and overall energy efficiency of the cell. To do so, we have chosen mesoporous carbon as the electrode material that offers a confined pore-space for spatially restricted growth of Li2O2. Unlike the uncontrolled growth of Li2O2 in conventional high surface area electrodes, the confined growth inside the mesopores produces nano-structured Li2O2 that is benefited with high mobility of Li+ and other charge carriers for facile decomposition during recharge. We have further shown that a controlled increase in electrochemically active surface area, pore width and pore volume of the carbon, while maintaining the mesoporous framework, can significantly enhance the discharge capacity and at the same time retain high rechargeability. In our study, we followed a wet chemical pathway for the synthesis of mesoporous carbons using mesoporous silica as the hard template that was impregnated with a phenol–formaldehyde mixture with or without urea as the carbon precursor. Our results have shown that addition of urea not only introduces nitrogen as a dopant in the carbon skeleton but also increases the porosity in the framework. For a certain dopant concentration, the porosity reaches a maximum and the electrode produces a discharge capacity that is nearly 2.5 times higher than that of the undoped carbon. Interestingly, despite this significant increase in discharge capacity, the electrode still maintains a round-trip energy efficiency of >70% which is up to 15% higher than that in the conventional electrodes. Detailed investigations have found that, although enhanced porosity accommodates a larger amount of Li2O2 and gives higher discharge capacity, the mesoporous framework in the N-doped carbons produces spatially restricted nano-sized and poorly crystalline Li2O2 that decomposes at low recharge potential. Our study demonstrates a prototypical strategy of electrode modification for the controlled growth of Li2O2 in order to achieve high capacity with simultaneously high rechargeability and provides crucial insights into electrode design for future development of efficient Li–air batteries.
Author contributions
A. D. conceived the research, synthesized the materials, carried out the electrochemical measurements and wrote the manuscript. K. I. carried out the OEMS experiments and Y. K. supervised the overall research and contributed to scientific discussions and writing of the manuscript.
Conflicts of interest
The authors declare no conflict of interest.
Acknowledgements
This work was financially supported by JST ALCA-SPRING Grant Number JPMJAL1301, Japan. The authors thank Battery Research Platform for experimental facilities.
Notes and references
- P. G. Bruce, S. A. Freunberger, L. J. Hardwick and J.-M. Tarascon, Nat. Mater., 2012, 11, 19–29 CrossRef CAS.
- V. Viswanathan, K. S. Thygesen, J. S. Hummelshøj, J. K. Nørskov, G. Girishkumar, B. D. McCloskey and A. C. Luntz, J. Chem. Phys., 2011, 135, 214704 CrossRef CAS.
- O. Gerbig, R. Merkle and J. Maier, Adv. Mater., 2013, 25, 3129–3133 CrossRef CAS.
- M. D. Radin and D. J. Siegel, Energy Environ. Sci., 2013, 6, 2370–2379 RSC.
- A. Dutta, K. Ito and Y. Kubo, J. Mater. Chem. A, 2019, 7, 23199–23207 RSC.
- S. Meini, M. Piana, H. Beyer, J. Schwämmlein and H. A. Gasteiger, J. Electrochem. Soc., 2012, 159, A2135–A2142 CrossRef CAS.
- W. Pan, X. Yang, J. Bao and M. Wang, J. Electrochem. Soc., 2017, 164, E3499–E3511 CrossRef CAS.
- C. Xia, M. Waletzko, L. Chen, K. Peppler, P. J. Klar and J. Janek, ACS Appl. Mater. Interfaces, 2014, 6, 12083–12092 CrossRef CAS.
- B. D. McCloskey, D. S. Bethune, R. M. Shelby, T. Mori, R. Scheffler, A. Speidel, M. Sherwood and A. C. Luntz, J. Phys. Chem. Lett., 2012, 3, 3043–3047 CrossRef CAS.
- M. M. Ottakam Thotiyl, S. A. Freunberger, Z. Peng and P. G. Bruce, J. Am. Chem. Soc., 2013, 135, 494–500 CrossRef CAS.
- R. A. Wong, C. Yang, A. Dutta, M. O. M. Hong, M. L. Thomas, K. Yamanaka, T. Ohta, K. Waki and H. R. Byon, ACS Energy Lett., 2018, 3, 592–597 CrossRef CAS.
- B. D. McCloskey, R. Scheffler, A. Speidel, D. S. Bethune, R. M. Shelby and A. C. Luntz, J. Am. Chem. Soc., 2011, 133, 18038–18041 CrossRef CAS.
- W.-J. Kwak, J. Park, H. Kim, J. M. Joo, D. Aurbach, H. R. Byon and Y.-K. Sun, ACS Energy Lett., 2020, 5, 2122–2129 CrossRef CAS.
- Y. Lin, C. Martinez-Martinez, J.-W. Kim and J. W. Connell, J. Electrochem. Soc., 2020, 167, 080522 CrossRef CAS.
- F. Tian, M. D. Radin and D. J. Siegel, Chem. Mater., 2014, 26, 2952–2959 CrossRef CAS.
- A. Dutta, R. A. Wong, W. Park, K. Yamanaka, T. Ohta, Y. Jung and H. R. Byon, Nat. Commun., 2018, 9, 680 CrossRef.
- S. Jun, S. H. Joo, R. Ryoo, M. Kruk, M. Jaroniec, Z. Liu, T. Ohsuna and O. Terasaki, J. Am. Chem. Soc., 2000, 122, 10712–10713 CrossRef CAS.
- M. Choi and R. Ryoo, Nat. Mater., 2003, 2, 473–476 CrossRef CAS.
- V. Y. Nimon, S. J. Visco, L. C. De Jonghe, Y. M. Volfkovich and D. A. Bograchev, ECS Electrochem. Lett., 2013, 2, A33–A35 CrossRef CAS.
- X. Gao, Y. Chen, L. Johnson and P. G. Bruce, Nat. Mater., 2016, 15, 882–888 CrossRef CAS.
- C. M. Burke, V. Pande, A. Khetan, V. Viswanathan and B. D. McCloskey, Proc. Natl. Acad. Sci. U. S. A., 2015, 112, 9293 CrossRef CAS.
- A. Dunst, V. Epp, I. Hanzu, S. A. Freunberger and M. Wilkening, Energy Environ. Sci., 2014, 7, 2739–2752 RSC.
- Y. Yin, C. Gaya, A. Torayev, V. Thangavel and A. A. Franco, J. Phys. Chem. Lett., 2016, 7, 3897–3902 CrossRef CAS.
- Z. Zhang, J. Bao, C. He, Y. Chen, J. Wei and Z. Zhou, Adv. Funct. Mater., 2014, 24, 6826–6833 CrossRef CAS.
- J. Shui, F. Du, C. Xue, Q. Li and L. Dai, ACS Nano, 2014, 8, 3015–3022 CrossRef CAS.
- Y. Jing and Z. Zhou, ACS Catal., 2015, 5, 4309–4317 CrossRef CAS.
- T. Lin, I. W. Chen, F. Liu, C. Yang, H. Bi, F. Xu and F. Huang, Science, 2015, 350, 1508 CrossRef CAS.
- S. N. Talapaneni, S. Anandan, G. P. Mane, C. Anand, D. S. Dhawale, S. Varghese, A. Mano, T. Mori and A. Vinu, J. Mater. Chem., 2012, 22, 9831–9840 RSC.
- Z. R. Yue, W. Jiang, L. Wang, S. D. Gardner and C. U. Pittman, Carbon, 1999, 37, 1785–1796 CrossRef CAS.
- M. Kruk and M. Jaroniec, Chem. Mater., 2001, 13, 3169–3183 CrossRef CAS.
- D. D. Asouhidou, K. S. Triantafyllidis, N. K. Lazaridis, K. A. Matis, S.-S. Kim and T. J. Pinnavaia, Microporous Mesoporous Mater., 2009, 117, 257–267 CrossRef CAS.
- A. Grosman and C. Ortega, Langmuir, 2008, 24, 3977–3986 CrossRef CAS.
- Y. Zeng, C. Fan, D. D. Do and D. Nicholson, Ind. Eng. Chem. Res., 2014, 53, 15467–15474 CrossRef CAS.
- D.-B. Fan, G.-Y. Li, T.-F. Qin and F.-X. Chu, Polymers, 2014, 6, 2221–2231 CrossRef.
- B. Pang, M.-K. Li, S. Yang, T.-Q. Yuan, G.-B. Du and R.-C. Sun, ACS Omega, 2018, 3, 8521–8528 CrossRef CAS.
- A. Guéguen, P. Novák and E. J. Berg, J. Electrochem. Soc., 2016, 163, A2545–A2550 CrossRef.
- D. Geng, N. Ding, T. S. A. Hor, S. W. Chien, Z. Liu, D. Wuu, X. Sun and Y. Zong, Adv. Energy Mater., 2016, 6, 1502164 CrossRef.
- H.-K. Lim, H.-D. Lim, K.-Y. Park, D.-H. Seo, H. Gwon, J. Hong, W. A. Goddard, H. Kim and K. Kang, J. Am. Chem. Soc., 2013, 135, 9733–9742 CrossRef CAS.
- J. H. Bae, J.-H. Han and T. D. Chung, Phys. Chem. Chem. Phys., 2012, 14, 448–463 RSC.
- R. A. Wong, A. Dutta, C. Yang, K. Yamanaka, T. Ohta, A. Nakao, K. Waki and H. R. Byon, Chem. Mater., 2016, 28, 8006–8015 CrossRef CAS.
- Y. Yang, T. Zhang, X. Wang, L. Chen, N. Wu, W. Liu, H. Lu, L. Xiao, L. Fu and L. Zhuang, ACS Appl. Mater. Interfaces, 2016, 8, 21350–21357 CrossRef CAS.
- Y. Zhao, C. Ban, J. Kang, S. Santhanagopalan, G.-H. Kim, S.-H. Wei and A. C. Dillon, Appl. Phys. Lett., 2012, 101, 023903 CrossRef.
- A. Dutta, K. Ito, A. Nomura and Y. Kubo, Adv. Sci., 2020, 7, 2001660 CrossRef CAS.
Footnote |
| † Electronic supplementary information (ESI) available: Experimental procedure, additional DC/RC curves, XRD, XPS, FTIR, SEM, LSV, OEMS, and impedance data. See DOI: 10.1039/d0ma00979b |
|
| This journal is © The Royal Society of Chemistry 2021 |
Click here to see how this site uses Cookies. View our privacy policy here. 
 Open Access Article
 This Open Access Article is licensed under a
  *a,
Kimihiko
Ito
a and
Yoshimi
Kubo
*ab
*a,
Kimihiko
Ito
a and
Yoshimi
Kubo
*ab