 Open Access Article
Two routes for sonochemical synthesis of platinum nanoparticles with narrow size distribution†
Henrik E.
Hansen
 ab,
Frode
Seland
a,
Svein
Sunde
 a,
Odne S.
Burheim
b and
Bruno G.
Pollet
 *b
*b
aElectrochemistry Group, Department of Materials Science and Engineering, Faculty of Natural Sciences. Norwegian University of Science and Technology (NTNU), NO-7491 Trondheim, Norway
bHydrogen Energy and Sonochemistry Research Group, Department of Energy and Process Engineering, Faculty of Engineering, Norwegian University of Science and Technology (NTNU), NO-7491 Trondheim, Norway. E-mail: bruno.g.pollet@ntnu.no
First published on 26th January 2021
Abstract
A novel sonochemical approach to synthesize platinum (Pt) nanoparticles has been developed to produce smaller, and more monodisperse particles than traditional chemical reduction methods such as the sodium borohydride (NaBH4) reduction method. It was also found that careful experimental manipulation of the ultrasonic conditions such as the ultrasonic frequency (f), the acoustic power (Pacoustic) and the solution volume (V) may be employed to tailor the sonochemical radical yield to the same value for two different ultrasonic systems (20 kHz provided by an ultrasonic probe or sonifier, and 408 kHz by an ultrasonic plate transducer) leading to a similar reduction rate, and as a consequence, to Pt-nanoparticles with similar sizes. The reduction of Pt(IV) was found to be a first order reaction with a rate constant (k) of 0.062 min−1 for both ultrasonic systems, and the particle sizes from TEM measurements were found to be (2.2 ± 0.5) nm and (2.3 ± 0.4) nm for the 20 kHz and the 408 kHz samples, respectively. In comparison, the chemical reduction method resulted in particle sizes of (3.0 ± 0.5) nm. It was also found that the sonochemical synthesis at 408 kHz was more efficient than at 20 kHz with an initial sonochemical efficiency of (0.20 ± 0.04) μmol kJ−1 at 408 kHz and (0.060 ± 0.004) μmol kJ−1 at 20 kHz. The sonochemical synthesis at 408 kHz also yielded nanoparticles of higher purity. Interestingly, direct sonication into the reaction vessel using the 20 kHz sonication probe produced impurities of Ti, V and Al in the solution, indicating that direct sonication at lower frequencies led to (i) probe material (made of Ti alloy – Ti-6Al-4V) erosion induced by cavitation and (ii) a continuous supply of micro meter sized impurities. It was also observed that the introduction of impurities increased the reduction rate constant of Pt(IV) through heterogeneous nucleation (k = 0.12 min−1) as was demonstrated for the 408 kHz system under controlled addition of Ti/Al/V seed microparticles. Direct sonication using a sonifier should therefore be avoided when high purity catalytic materials are required.
1 Introduction
In the last few years, many research works have been focused on developing new technologies which can replace fossil fuels and other greenhouse gas emitting sources. One such a technology is connected to electrochemical energy conversion where the electrical energy is generated from the oxidation of a fuel (H2(g) – hydrogen oxidation reaction, HOR), and the reduction of an oxidant (O2(g) – oxygen reduction reaction, ORR) in the presence of a catalyst to produce water. This device is referred to as a fuel cell. The reverse reactions are also possible, where H2(g) and O2(g) are produced via the hydrogen evolution (HER) and oxygen evolution reactions (OER) at the expense of electrical energy, and this device is called an electrolyzer.In order for fuel cells and electrolyzers to work efficiently, catalysts present at the anode and cathode must improve the slow kinetics associated with the anode and cathode electrochemical reactions for both fuel cells and electrolyzers.1 Platinum (Pt), a Platinum Group Metal (PGM), has been proven to be an excellent catalyst for these reactions, and is therefore the material of choice in already available commercial products.2 Improvements of these technologies therefore lies in either developing low-cost, highly-performing and durable materials with better or similar catalytic activity, or improving the catalytic activity of the Pt-catalysts.
As the overall catalytic activity is closely related to the surface area of the catalyst, synthesis of Pt-nanoparticles with high surface areas has been investigated.2,3 A common method for such a synthesis is by chemical reduction of Pt-salts (e.g. PtCl4) using for example, NaBH4.3 NaBH4 is a strong reducing agent that allows for a simple and fast synthesis procedure, which is ideal for industrial applications. However, the chemical reduction method has limitations, e.g. in controlling the particle size without the addition of additives such as surfactants (e.g. polyvinyl pyrrolidone, PVP).4 Moreover, these surfactants must also be removed from the nanoparticles after the synthesis as they are known to block the active sites at the catalyst surface,4 thus adding more complexity to the synthesis procedure. Methods involving co-precipitation,5 microwave irradiation,5 refluxing,5,6 spray drying pyrolysis,7 and hydrothermal synthesis5,8 have also been used successfully to synthesize a range of nanomaterials.
Alternatively, a sonochemical method,5,9–13 can offer an additive-free synthesis with improved control over particle size. This synthesis method employs low-frequency high-power ultrasound (20 kHz−1 MHz) in order to generate highly reactive radicals (H˙ and OH˙, produced via sonolysis14) in the solution, which act as reducing agents (H˙) for metal ions (Mn+) in the solution. These mechanisms have been described in several works,10,11,15 as follows:
| H2O → H˙ + OH˙ | (1) |
| Mn++ reducing radicals → M0 | (2) |
Such an in situ generation of reducing radicals at room-temperature is a major advantage over traditional methods as it removes the cost of adding expensive reducing agents, provides an easy way to adjust reduction rates, and reduces the HSE-risks typically associated with powerful reducing agents.
It has been found that the metal nanoparticle sizes depend on the ultrasonic parameters used during the sonochemical synthesis.10,11,15 Ultrasonic frequency, type of alcohols and surfactants, as well as atmospheric gasses have been shown to contribute to the final nanoparticle size.12 In the case of atmospheric gasses, Merouani et al. recently simulated free radical production in acoustically driven bubble systems and showed that a low thermal conductivity and high polytropic ratio are favoured in order to achieve a higher radical yield, and therefore smaller particle sizes.16
Surfactants and alcohols may also be used in order to adjust the final particle size as these act as radical scavengers. Due to the hydrophobic nature of the alcohols and surfactants, they are situated on the bubble/solution interface, and upon bubble collapse they usually are in the most immediate proximity of the radicals generated in the collapse. The alcohols and surfactants (RH) therefore react with these radicals and become secondary radicals (R˙). Afterwards, these secondary radicals diffuse into the bulk solution where reactions with the metal ions (Mn+) proceed as follows:11,15
| RH + OH˙ (H˙) → R˙ + H2O(H2) | (3) |
| Mn+ + reducing species(R˙,H˙,etc.) → M0 | (4) |
The presence of such additives therefore increases the reduction rate constant (k), and decreases the particle size as previously shown in several works.10–12 It has also been found that the role of the surfactant in the sonochemical synthesis is to improve the radical yield, and not to act as steric hindrance as it is for the chemical reduction method.
The effect of ultrasonic frequency (f), however, is one of the main contributors to the final nanoparticle size and is of great interest as it is tuneable (up to 1 MHz). Okitsu et al.15 showed that the reduction rate exhibited a maximum value around an ultrasonic frequency of 213 kHz. This maximum value resulted from a higher yield of radicals per bubble at lower frequencies, and a higher number of bubbles generated at higher frequencies. Careful considerations of the ultrasonic frequency for a given system can therefore be used to achieve the preferred nanoparticle size.
Using ultrasound to synthesize nanoparticles of specific sizes and shapes can be an important step when attempting to improve the catalytic activity of catalysts for applications such as fuel cells and electrolyzers. Much research has already been published on sonochemical synthesis of PGMs where the main focus has been on exploring the contributions from the individual ultrasonic parameters on the overall reduction rate and yield. Okitsu et al.15 also investigated the effect of ultrasonic frequency on the reduction rate and particle size of gold (Au) nanoparticles and found that the highest reduction rate and the smallest nanoparticles were achieved using an ultrasonic frequency of 213 kHz. The same group11 also investigated the sonochemical synthesis of Ag, Pd, Au, Pt and Rh. Caruso et al.10 demonstrated that the reduction rate of Pt can be increased by adding alcohols to the solution. Much work has therefore been carried out on the fundamental understanding of how sonochemical reduction occurs for these noble metals, and thus, the next step is to explore its potential for industrial applications. Here, it is important to assess whether the sonochemical route can compete with the well established chemical reduction methods in terms of achieving the target size and shape of the final nanoparticles, obtaining a monodisperse particle system, and the possibility of scaling up the process.
The scope of this study is to assess whether two ultrasonic reactors generating different frequencies (20 kHz and 408 kHz) can result in the same size of Pt-nanoparticles when the radical yield from the sonolysis is tuned to the same value. Taking into account the solution volume (V) and the applied acoustic power (Pacoustic), we can therefore determine which sonochemical reactor is more efficient for potential industrial scale production. To quantify the radical yield, the potassium iodide (KI) dosimetry method was used (also known as the Weissler method17), while the reduction rate of Pt(IV) was monitored with a colorimetric technique involving UV-Vis spectroscopy. Pt-nanoparticles were also synthesized by the chemical reduction route using NaBH4, and then compared to the sonochemical method. Additionally, the use of seed Ti/V/Al microparticles to enhance the reduction rate of Pt(IV) in the sonochemical method was also explored as a possible solution for scaling up the production of Pt-nanoparticles. The chemical composition and the particle sizes were investigated using X-ray diffraction (XRD), scanning (SEM) and transmission electron microscopy (TEM) and dynamic light scattering (DLS).
2 Experimental methods
2.1 Synthesis
For the sonochemical synthesis of Pt-nanoparticles, an aqueous solution of 2.0 mmol dm−3 PtCl4 (99.9% metal basis) was prepared using a solution of 0.8 mol dm−3 96% ethanol. Milli-Q water with a resistivity of 18.2 MΩ at 25 °C was used for preparing the ethanol solution. The solution was then stirred with an electromagnetic stirrer for 10 min to ensure a homogeneous solution.Sonication was performed using a 20 kHz sonicator probe (sonifier) and a 408 kHz plate transducer, both described in detail in Section 2.2. For the 20 kHz sonicator, 50 mL of the prepared solution was purged with Ar–gas for 10 min before being sonicated using an on:off cycle of 1s![[thin space (1/6-em)]](https://www.rsc.org/images/entities/char_2009.gif) :
:![[thin space (1/6-em)]](https://www.rsc.org/images/entities/char_2009.gif) 1s to prevent excessive heating. An Ar-atmosphere was also maintained above the solution. Samples of 4 mL were extracted after 0 min, 5 min, 10 min, 20 min, and 40 min of sonication for the determination of the reduction rate constants. The temperature was maintained at 5 °C by active cooling of the solution. For the 408 kHz plate transducer, 200 mL of the prepared solution was purged with Ar-gas for 10 min before being sonicated continuously for 80 min. An Ar-atmosphere was maintained above the solution throughout the sonication, and the temperature was maintained at 20 °C due to practical limitations. 4 mL samples were extracted after 0 min, 5 min, 10 min, 20 min, 40 min, 60 min, and 80 min of sonication. The sonochemical syntheses were repeated three times for each of the two ultrasonic systems used in this study.
1s to prevent excessive heating. An Ar-atmosphere was also maintained above the solution. Samples of 4 mL were extracted after 0 min, 5 min, 10 min, 20 min, and 40 min of sonication for the determination of the reduction rate constants. The temperature was maintained at 5 °C by active cooling of the solution. For the 408 kHz plate transducer, 200 mL of the prepared solution was purged with Ar-gas for 10 min before being sonicated continuously for 80 min. An Ar-atmosphere was maintained above the solution throughout the sonication, and the temperature was maintained at 20 °C due to practical limitations. 4 mL samples were extracted after 0 min, 5 min, 10 min, 20 min, 40 min, 60 min, and 80 min of sonication. The sonochemical syntheses were repeated three times for each of the two ultrasonic systems used in this study.
For the chemical reduction of Pt-nanoparticles, a method described by Morales et al.18 involving sodium borohydride (NaBH4) as the reducing agent was used. 1 mL of 44 mmol dm−3 NaBH4 (granular, 10–40 mesh, 98%) from Sigma Aldrich was added to 50 mL of 2.0 mmol dm−3 (99.9% metal basis) PtCl4 prepared in 0.8 mol dm−3 96% ethanol. The solution was then stirred with an electromagnetic stirrer for 30 min.
Pt-nanoparticles were then removed from the remaining solution by centrifugation at 12![[thin space (1/6-em)]](https://www.rsc.org/images/entities/char_2009.gif) 000 rpm for 15 min, and redispersed in ethanol in preparation for SEM, TEM and XRD measurements. For all other measurements, the original solution was used.
000 rpm for 15 min, and redispersed in ethanol in preparation for SEM, TEM and XRD measurements. For all other measurements, the original solution was used.
2.2 Sonochemical setup
The experimental setup for the 20 kHz sonicator probe is shown in Fig. 1a. It uses a Q700 sonicator system from QSonica with a maximum power output of 700 W along with a probe measuring 19 mm in diameter. The temperature was maintained using a compact recirculating chiller from QSonica in combination with a water bath surrounding the beaker containing the solution. An ultrasonic amplitude of 50% was used. The acoustic power of the system was determined calorimetrically19 and was found to be (42.9 ± 0.3) W. The ultrasonic probe was immersed directly into the reaction vessel.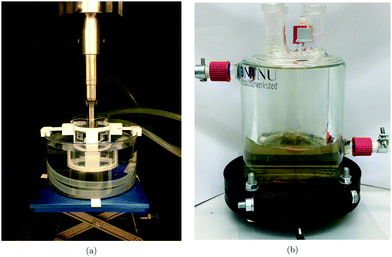 | ||
| Fig. 1 Ultrasonic setup for the QSonica Q700 20 kHz sonicator probe (a), and the 408 kHz plate transducer (b). | ||
The plate transducer used at a frequency of 408 kHz is shown in Fig. 1b. This setup differs from the QSonica system in that a plate transducer at the bottom of the reactor supplies the ultrasonic power, and that the atmosphere inside the reactor is isolated from the external environment. The temperature was maintained using a cooling jacket around the reactor where water was circulated from a cooling bath. An ultrasonic amplitude of 100% was employed and the acoustic power was determined calorimetrically and found to be (54 ± 2) W. The ultrasonic plate transducer was directly in contact with the reaction solution.
2.3 Physical characterizations
In order to observe if exposure to ultrasound affected the PtCl4-solution, samples were extracted at selected time intervals and subjected to UV-Vis spectroscopy using a Thermo Scientific Evolution 220 UV-Vis spectrophotometer. The absorbance of the samples was measured over a wavelength range of 200–800 nm with a scan rate of 100 nm min−1.Further investigations into the reduction of PtCl4 were also performed using a colorimetric technique based upon potassium iodide (KI). This technique involves mixing a PtCl4-solution and an excess of KI which allows the remaining Pt(IV) in the solution to react with I− ions forming PtI62−.20 Using this technique for the samples extracted at different sonication times allowed us to determine the changes in the Pt(IV)-concentration and therefore also the reduction rate constant of PtCl4. This was achieved by plotting the concentration of Pt(IV) as obtained by UV-Vis spectroscopy against sonication time, and fitting the resulting curve to an exponential function. Semi-logarithmic plots were also used to easily identify any deviations from the exponential fit. These semi-logarithmic plots were also normalized against the respective initial concentrations of Pt(IV) for both samples. In order to avoid interference from any Pt-nanoparticles formed during the sonication, the original UV-Vis spectra of the samples were subtracted from their respective colorimetric spectrum.
The Pt(II)-concentration was also determined using the same colorimetric technique. However, due to the overlap of the Pt(II) peaks with the rest of the spectrum, the Pt(IV) spectrum had to be subtracted before quantification at 388 nm could be performed. Assuming that the sum of the Pt(IV)- Pt(II)- and Pt(0)-concentration equals the initial concentration of Pt(IV), the yield of Pt-nanoparticles from the sonochemical methods could be determined.
For X-ray diffraction (XRD), measurements were performed using a Bruker D8 A25 DaVinci X-ray Diffractometer with CuKα radiation. The samples were drop cast onto a flat Si wafer and covered with a Kapton film to prevent unwanted exposure to the surrounding environment. The measurements were carried out using a scan rate of 0.044° per step for 2θ-angles between 15°–75° and a 0.3° fixed slit for 60 min. The resulting diffractograms were then compared to the COD database using the DIFFRAC.EVA software before undergoing Rietveld refinement using the Topas software.
The sample preparation for dynamic light scattering (DLS) involved diluting the samples in Milli-Q water until the particle count was sufficient (below 2 × 10⁶ cps). The samples were then sonicated in the Elmasonic P ultrasonic bath for 1 min with a frequency of 80 kHz to obtain a homogeneous dispersion. The DLS-measurements were performed in an ISO 7 cleanroom using a Beckmann Coulter N5 submicron particle size analyzer. The cuvettes used for the measurements were cleaned with Milli-Q water filtered through a 0.2 μm particle filter. The particle dispersions were then transferred to the cuvettes using a syringe with a 2.7 μm particle filter. The detector angle was chosen to be 90° for all measurements. Ten measurements were performed for each sample. Using the obtained autocorrelation function, the Beckmann Coulter PCS software calculated the mean particle size, standard deviation and polydispersity index for every measurement.
Sample preparation for scanning (SEM) and transmission electron microscopy (TEM) was performed by dispersing the particles in ethanol (96%). The samples were then drop cast onto a Formvar, Copper TEM-grid, before being allowed to dry over night. SEM images were acquired with an APREO SEM using an acceleration voltage of 30 kV and an emission current of 0.4 nA, while TEM images were acquired with a JEOL JEM-2100 TEM with an acceleration voltage of 100 kV.
2.4 Dosimetry determination
Measuring the sonochemical formation of radicals (H˙ and OH˙) in an aqueous solution during sonication is challenging due to the radicals’ short lifespan. There are several chemical dosimetry methods (e.g. terephthalic acid, Fricke and Weissler methods) for determining the hydrogen peroxide (H2O2) or the hydroxyl radical (OH˙) formation during sonication. In this study, we used the Weissler dosimetry method, i.e. the sonication of pure aqueous potassium iodide (KI) solution. 0.1 mol dm−3 KI solution saturated with Ar-gas for 10 min was sonicated for 20 min, as described by Iida et al.,21 Son et al.,22 and La Rochebrochard d’Auzay et al.,23 to determine OH˙ radical concentrations. The resulting I3− formation was monitored by a Thermo Scientific Evolution 220 UV-Vis spectrophotometer at a wavelength of 350 nm (λmax), using a molar extinction coefficient (ε) of 26![[thin space (1/6-em)]](https://www.rsc.org/images/entities/char_2009.gif) 000 dm3 mol−1 cm−1.
000 dm3 mol−1 cm−1.
For the Weissler dosimetry, the reaction pathway is the direct oxidation of iodide ions I− in solution by OH˙ forming iodine I (eqn (5)).
| OH˙ + I− → OH− + I | (5) |
The iodine reacts with I− to produce I2− (eqn (6)) which subsequently give rises to I2 (eqn (7)).
| I + I− → I2− | (6) |
| 2I2− → I2 + 2I− | (7) |
Molecular iodine produced from these reaction pathways reacts with excess I− to form triiodide ions, I3− (eqn (8)).
| I2 + I− → I3− | (8) |
This method also allows the determination of the rate of triiodide anion formation ν(I3−) (mol s−1) and thus the rate of formation of OH˙, i.e. assuming that ν(I3−) = ν(OH˙). However, in order to assess the sonochemical effects of an ultrasound system, the sonochemical efficiency (SE) must be calculated as shown by Koda et al.24
 | (9) |
2.5 Acoustic power determination
The ultrasonic or acoustic powers were determined calorimetrically using the methods of Margulis et al.19 and Contamine et al.25 and using eqn (10): | (10) |
3 Results
3.1 Synthesis
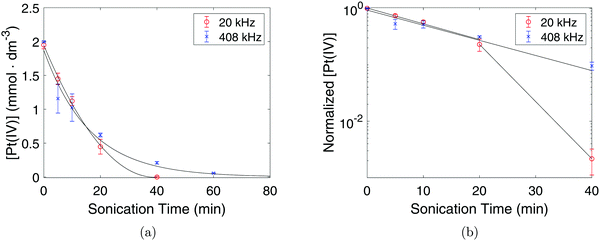
To monitor the Pt(IV) concentration throughout the sonication process a colorimetric technique was used (as the method enhances the Pt(IV) peaks in the spectrum). Such a procedure involves adding an excess of KI to the PtCl4-solution which leads to the formation of PtI6−2 which has a characteristic peak at 495 nm with a molar extinction coefficient of 9400 dm3 mol−1 cm−1.20 The resulting UV-Vis spectra obtained after adding KI can be seen in Fig. 2a for the chemically synthesized Pt-nanoparticles, and in Fig. 2b and Fig. 2c for the sonochemical synthesis at frequencies of 20 kHz and 408 kHz respectively. The spectra also reveal the appearance of a peak at 388 nm which can be attributed to PtI4−2.20 This peak is observed to reach a maximum point at intermediate sonication times, which indicates that Pt(IV) is first reduced to Pt(II) before finally being reduced to Pt-nanoparticles during the sonochemical synthesis. This is in good agreement with previous studies on the sonochemical reduction of Pt(IV).20 Based on the concentrations of Pt(IV) and Pt(II), as well as the initial concentration of PtCl4, the yield of Pt-nanoparticles was determined to be 65% and 46% for the 20 kHz system and 408 kHz system respectively.From these UV-Vis spectra, the concentration of Pt(IV) in the solution was calculated and plotted against sonication time as can be seen in Fig. 3a. The linear behavior of the semi-logarithmic plots in Fig. 3b also reveal that the reduction of Pt(IV) is a first order reaction. For the first 10 minutes of sonication, no significant differences in the reduction rate constants were observed for the two systems, as k = 0.062 min−1 in both cases. However, in the range of 20–80 min, the reduction rate constant in the 20 kHz system (k = 0.23 min−1) was much higher than the one at 408 kHz (k = 0.062 min−1), and the curve started deviating from the exponential fit.
3.2 Physical characterization
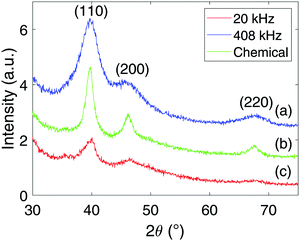
X-ray diffractograms for the Pt-nanoparticles are shown in Fig. 4. Pt is observed for all samples at 39.8°, 46.3°, and 67.6°, while the 20 kHz sample also display Ti at 38.4° and 40.2°. Rietveld refinement of the diffractogram obtained at 20 kHz revealed that the Pt- and Ti-content was 86% and 14% respectively. For the other samples, only fcc Pt was found to match the diffractograms. Another interesting observation is that the diffractograms of the sonochemically synthesized particles display much wider peaks compared to those of the chemical reduction. This was also confirmed through Rietveld refinement, where the peak widths were related to the crystallite sizes. The size of the particles synthesized sonochemically with a frequency of 408 kHz was found to be 1.4 nm, at 20 kHz it was found to be 2.7 nm, while the particles synthesized through chemical reduction was found to be 4.1 nm. Thus, the sonochemical synthesis appears to produce nanoparticles of smaller crystallite sizes than the chemical reduction method. A final remark on the diffractograms is the difference in peak heights from one sample to another. This is simply a result of the sample preparation where the higher volume of Pt-nanoparticles produced at 408 kHz was more concentrated upon re-dispersion in ethanol compared to the 20 kHz sample. In addition, the nearly complete reduction of Pt(IV) to Pt-nanoparticles for the chemical reduction also provided the chemical reduction sample with a higher Pt-nanoparticle concentration than the 20 kHz sample, and therefore also higher peaks.Normal distributions of the agglomerate sizes for the Pt-nanoparticles were obtained from dynamic light scattering, and are shown in Fig. 5. From these results, the mean agglomerate size was found to be (143 ± 85) nm for the chemical reduction, (198 ± 50) nm for the sonochemical synthesis at 20 kHz, and (255 ± 105) nm at 408 kHz. The polydispersity of the agglomerates was also found to be significantly smaller for the chemical reduction as compared to the sonochemical synthesis. This suggests that the chemical reduction method leads to smaller agglomerates of more uniform sizes than the sonochemical synthesis.
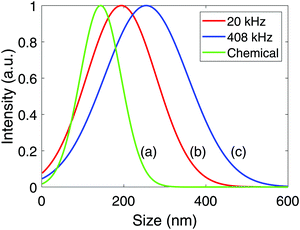 | ||
| Fig. 5 Average agglomerate size distributions for Pt-nanoparticles synthesized chemically using sodium borohydride (a), and sonochemically with ultrasonic frequencies of 20 kHz (b), and 408 kHz (c). | ||
TEM images for Pt-nanoparticles of all samples are shown in Fig. 6a–c. Both samples that were produced sonochemically displayed a structure with small, spherical nanoparticles clearly connected in larger agglomerates. The particles also appear to be fairly monodispersed. For the sample which was produced chemically, however, the microstructure shows a larger network consisting of particles of different sizes and shapes with most of the particles being agglomerated. Lone particles were used to determine the average sizes which were found to be (2.2 ± 0.5) nm for the 20 kHz sample, (2.3 ± 0.4) nm for the 408 kHz sample, and (3.0 ± 0.5) nm for the chemical reduction sample. As very few lone particles were found for the chemical reduction sample, the estimated particle size was less certain than for the other samples where lone particles were found in abundance.
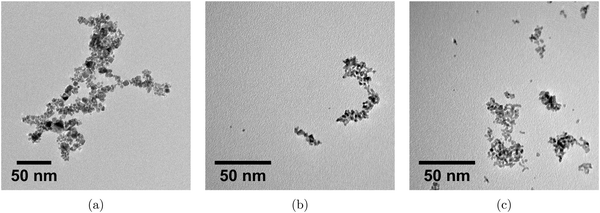 | ||
| Fig. 6 Transmission electron microscopy images of the Pt-nanoparticles synthesized chemically (a), and sonochemically at frequencies of 20 kHz (b), and 408 kHz (c). | ||
EDX analyses revealed that the particles consisted of Pt in all cases. For the 20 kHz samples, micrometer sized particles comprised of Ti, Al, and V were also found distributed among the smaller Pt-nanoparticles (Fig. 7a–c). Closer inspection of these micrometer sized impurities showed that Pt particles were supported on the surface as can be seen in Fig. 7b and from the elemental maps in Fig. 7c.
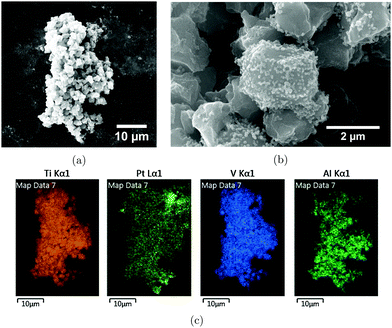 | ||
| Fig. 7 Scanning electron microscopy image of impurities for the 20 kHz sample (a and b), and EDX-maps of the same impurities (c). | ||
3.3 Calorimetry and dosimetry
Measurements of the acoustic power (W) as a function of applied amplitude (%) for the 20 kHz probe sonicator and the 408 kHz plate transducer are shown in Fig. 8. Curves fitted to the measured data are also plotted along with error bars for the individual measurements. For the 20 kHz probe sonicator, an amplitude of 50% was used during the synthesis, and the corresponding acoustic power was measured to be (42.9 ± 0.3) W. For the 408 kHz system, an amplitude of 100% was used during the synthesis, and the corresponding acoustic power was found to be (54 ± 2) W.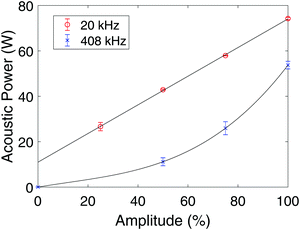 | ||
| Fig. 8 Acoustic power as a function of applied amplitude for the 20 kHz probe sonicator (○), and for the 408 kHz plate transducer (×). The error bars are equal to the respective standard deviations. | ||
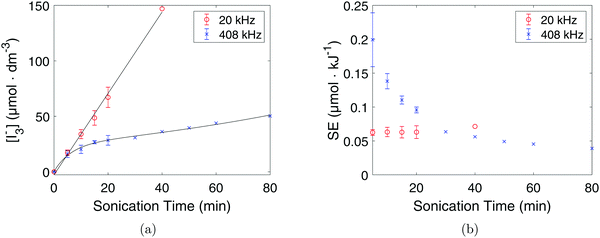
KI dosimetry results from the 20 kHz probe sonicator and the 408 kHz plate transducer are shown in Fig. 9a. The 20 kHz probe sonicator displayed an initial oxidation rate of (3.1 ± 0.3) μmol dm−3 min−1 while the 408 kHz plate transducer showed an initial oxidation rate of (2.9 ± 0.8) μmol dm−3 min−1. The results show that the I3− concentration is linear with respect to sonication time for the 20 kHz probe sonicator, while for the 408 kHz plate transducer the I3− concentration flattens out over time. Consequently, the I3− concentration is higher at longer sonication times for the 20 kHz probe sonicator than for the 408 kHz plate transducer even though there is no significant difference before 5 minutes of sonication.
However, when accounting for the volume and the applied acoustic power, the initial sonochemical efficiency was found to be (0.20 ± 0.04) μmol kJ−1 at 408 kHz and (0.060 ± 0.004) μmol kJ−1 at 20 kHz by using eqn (9). The 408 kHz plate transducer is therefore much more efficient than the 20 kHz probe sonicator as can also be seen in Fig. 9b.
Investigations into the effect of bulk temperature, acoustic power, and solution volume on the sonochemical efficiency were also performed. For temperature, no significant differences in sonochemical efficiency were observed between 5 °C and 20 °C for the 408 kHz system. As for the acoustic power, no significant differences in the sonochemical efficiency were found between 43 W and 54 W (corresponding to the acoustic power used for the 20 kHz and 408 kHz ultrasound systems, respectively) for the 408 kHz system, but for much lower acoustic powers (11 W) the sonochemical efficiency improved. For the solution volume, volumes of 200 mL and 50 mL were compared at the same conditions using the 20 kHz probe sonicator, and it was found that increasing the volume leads to a lower sonochemical efficiency. Additional information is provided in Fig. S10 and Table S1 in the ESI.†
4 Discussion
4.1 Reduction rate constant (k)
The observed increase in the reduction of Pt(IV) after 20 min of sonication using the 20 kHz system can be attributed to the continuous supply of micrometer sized eroded particles. The strong mechanical forces originating from the 20 kHz ultrasonic probe (made of a Ti alloy) is eroding the probe itself leaving large particles (sizes up to 3 μm) comprising of Ti, V, and Al (probe elements) dispersed throughout the solution as was confirmed by EDX. No evidence of such erosion processes were found for the 408 kHz system. The amount of these eroded microparticles increased with increased sonication time, and was also independent on the solution being sonicated as the same phenomenon occurred when sonicating pure water. The presence of impurities, such as these eroded particles, during the synthesis of nanomaterials could lead to heterogeneous nucleation on the surface of these particles due to a significantly reduced nucleation energy required and enhanced reduction kinetics.26 The gradual introduction of such nucleation sites for the 20 kHz system can therefore explain why the rate constant for Pt(IV)-reduction increases after 20 minutes of sonication. As Pt was confirmed to be present on the surface of the eroded particles through SEM and EDX, this indicates a possible heterogeneous nucleation process. In order to verify this hypothesis, 200 mL of Milli-Q water was sonicated for 40 minutes with the 20 kHz probe. The resulting water (containing eroded particles) was used to prepare a 200 mL PtCl4 solution which was then sonicated with the 408 kHz system (where no erosion processes occur) in the same manner as before, and the reduction rate was determined colorimetrically (Fig. S11, ESI†). From these results it was found that the Pt(IV) concentration decays exponentially, albeit with two times higher rate constant (k = 0.12 min−1) compared to when no nucleation sites were added (k = 0.062 min−1).In addition, slow degassing of the solution sonicated at 408 kHz could also have affected the reduction rate over the sonication period. Since the dosimetry results of the two systems are similar in the initial stages of sonication, the initial conditions of the two systems appear to offer the same reduction rate, as was intended. However, as sonication proceeds, these conditions are changed especially for the 408 kHz system as can be seen from the deviation from linearity in the dosimetry results (Fig. 9a). A similar phenomenon was described by Iida et al.21 for Ar saturation during sonication and was attributed to the degassing effect caused by ultrasound. As a result, the high collapse temperatures and pressures caused by Ar saturation decrease in turns leading to a lower radical yield and therefore a deviation from linearity. However, the 20 kHz system does not exhibit the same deviation from linearity, indicating that, whatever gas, or composition of gas, the solution is saturated with, is unchanged during the course of sonication. As pulsed sonication was used in a relatively small volume using a lower frequency, one may expect degassing to occur to a much larger extent than for the 408 kHz system. As a result, Ar would be degassed almost immediately leaving behind only water vapour. If all the gases were to be purged away from solution in the first few ultrasonic cycles, a linear behaviour would also be expected as no degassing would take place over an extended period of time.
Comparing the yield of the two sonochemical methods (65% at 20 kHz and 46% at 408 kHz) clearly reveals that more of the precursor was converted to Pt-nanoparticles at 20 kHz when compared to that at 408 kHz. However, due to the different solution volumes used for the two systems (50 mL at 20 kHz and 200 mL at 408 kHz), the yield was not an obvious indication of which system performed better.
The supply of eroded particles to the 20 kHz system might therefore increase the reduction rate over the sonication period, while the degassing of Ar in the 408 kHz system could slightly decrease the reduction rate. This does not seem to affect the final particle sizes in any significant ways as indicated by the TEM results (Fig. 6a–c). However, the agglomerate sizes and crystallite sizes as measured by dynamic light scattering and XRD respectively, do seem to differ for the two ultrasonic systems. Regarding the XRD, the evaluation of the crystallite size for the 20 kHz system might have been influenced by the presence of Ti as it overlaps with the Pt-peak in the diffractogram. As for the agglomerate size, smaller particles tend to form larger agglomerates due to the higher surface free energy associated with the higher specific surface area. It is therefore expected that the Pt-nanoparticles which were produced chemically also display the smallest agglomerate size. However, the significant difference in particle size and standard deviation observed between the particles produced sonochemically could be due to the presence of larger eroded particles in the 20 kHz system during synthesis and/or due to the mechanical effects dominating at lower ultrasonic frequencies. The smaller agglomerates observed at 20 kHz compared to 408 kHz are therefore as expected.
4.2 Comparison of synthesis methods
The sonochemical method and the chemical reduction method both offer their set of advantages for the production of Pt-nanoparticles. For the chemical reduction method, the most prominent advantage lies in the near instantaneous reduction of Pt(IV) to Pt-nanoparticles. In comparison, the sonochemical method takes around 40 minutes to achieve complete reduction at the conditions used in this work. However, as no attempts were made to optimize the sonochemical processes, there are multiple ultrasonic parameters which can be tuned to achieve faster reduction and in turns making the sonochemical process more efficient.10,11 The use of additives such as surfactants, seed particles, higher acoustic powers, and optimized ultrasound frequency or other saturation gasses have all been shown to influence the reduction rate.11,12,15 Even though the reduction rate of the sonochemical method would not be as fast as for the chemical reduction, the large difference that we have observed in our study can definitely be improved upon.The advantages of the sonochemical method are mainly rooted in the ability to control the reduction rate, and as a consequence, the particle properties such as the size. In this investigation, we have shown that two very different setups operating at two distinct frequencies were able to give the same reduction rate and therefore a similar particle size. Simply by changing some of the ultrasonic conditions, we were able to tune the particle size. The fact that similar results from two completely different ultrasonic reactors can be achieved, also provides the industry with a much higher degree of freedom when it comes to designing the sonochemical reactors and thus, can lead to a more cost effective catalytic material production. In addition, the size and shape of the nanoparticles were found to be very uniform and spherical for the sonochemical method, whereas the chemical reduction method displayed a much wider range of sizes and shapes as is shown in the TEM results. The sonochemical synthesis is therefore very well suited for applications which requires uniform particle properties. In addition, no use of reducing agents or surfactants, posing HSE risks, were necessary to achieve the desired particle properties as is the case for the chemical reduction.
As for the efficiency of the two ultrasonic setups, it is apparent from the sonochemical efficiency ((0.20 ± 0.04) μmol kJ−1 at 408 kHz and (0.060 ± 0.004) μmol kJ−1 at 20 kHz) that the higher frequency delivers the highest number of nanoparticles per unit energy spent. In addition, by using a 20 kHz sonication probe directly into the reaction vessel, eroded materials (induced by cavitation) are generated and contaminate the sonochemically produced material of interest. The accelerated reduction rate observed when adding such seed microparticles (Ti, V and Al) can also be replicated under more controlled circumstances when turning to higher ultrasonic frequencies. Using direct sonication, especially at low ultrasonic frequencies, for sonochemical synthesis therefore introduces unnecessary complications, which can be avoided by either using higher ultrasonic frequency systems or by separating the ultrasonic probe from the reaction vessel.
5 Conclusion
The sonochemical approach at two ultrasonic frequencies led to Pt-nanoparticles of similar sizes when the radical yield was tuned to the same initial value. The sonochemical method produced Pt-nanoparticles which were significantly smaller and more monodisperse than the chemical reduction method. The nanoparticles were found to be spherical when using the sonochemical method whereas different shapes were found in the chemical approach. Being able to tune the ultrasonic parameters in order to obtain a specific particle size offers more control over the synthesis without the use of stabilizing agents. This finding is in good agreement with previous works where the nanoparticle size was found to be directly related to the reduction rate, and the radical yield. From an industrial perspective, the higher ultrasonic frequency offers more particles per unit energy and is also free of impurities which is important for electrochemical applications. Direct sonication at lower frequencies (20 kHz) should therefore be avoided if the target catalytic material needs to be of high purity. The gradual introduction of impurities at low frequencies also resulted in complications related to the rate of reduction as the impurities were found to accelerate the reduction of Pt(IV) through heterogeneous nucleation. Controlled addition of such seed Ti, V, and Al microparticles did confirm an increase in reduction rate at higher ultrasonic frequencies as well and could be an important contributor when scaling up the synthesis for industrial purposes.Conflicts of interest
There are no conflicts to declare.References
-
K. B. Oldham, J. C. Myland and A. M. Bond, Electrochemical Science and Technology: Fundamentals and Applications. eng, John Wiley & Sons, Ltd, Chichester, UK, 2011. ISBN: 9780470710852 Search PubMed
.
-
X. Ren
et al., Current progress of Pt and Pt-based electrocatalysts used for fuel cells, Sustainable Energy Fuels, 2020, 4(1), 15–30 10.1039/C9SE00460B
.
-
S. A. Gama-Lara
et al., Synthesis, Characterization, and Catalytic Activity of Platinum Nanopar-ticles on Bovine-Bone Powder: A Novel Support. J. Nanomater. 2018 (2018), ISSN: 1687-4110 Search PubMed
.
- Z. Niu and Y. Li, Removal and Utilization of Capping Agents in Nanocatalysis, Chem. Mater., 2014, 26(1), 72–83 CrossRef CAS
, ISSN: 0897-4756.
- S. Gholamrezaei,
et al., Multidisciplinary methods (co-precipitation, ultrasonic, microwave,reflux and hydrothermal) for synthesis and characterization of CaMn3O6 nanostructures and its photocatalytic water splitting performance, Int. J. Hydrogen Energy, 2019, 44(48), 26373–26386 CrossRef CAS
, ISSN: 0360-3199.
- M. Ghiyasiyan-Arani and M. Salavati-Niasari, New Nanocomposites Based on Li–Fe–Mn Double Spinel and Carbon Self-Doped Graphitic Carbon Nitrides with Synergistic Effect for Electrochemical Hydrogen Storage Application, Ind. Eng. Chem. Res., 2019, 58(51), 23057–23067 CrossRef CAS
, ISSN: 0888-5885.
- J. Zhang,
et al., Polyimide Encapsulated Lithium-Rich Cathode Material for High Voltage Lithium-Ion Battery, ACS Appl. Mater. Interfaces, 2014, 6(20), 17965–17973 CrossRef CAS
, ISSN: 1944-8244.
- M. Ghiyasiyan-Arani and M. Salavati-Niasari, Strategic design and electrochemical behaviors of Li-ion battery cathode nanocomposite materials based on AlV3O9 with carbon nanostructures, Composites, Part B, 2020, 183, 107734 CrossRef CAS
, ISSN: 1359-8368.
- M. Masjedi-Arani,
et al., CdSnO3-graphene nanocomposites: Ultrasonic synthesis using glucose as capping agent and characterization for electrochemical hydrogen storage, Ultrason. Sonochem., 2020, 61, 104840 CrossRef CAS
, ISSN: 1350-4177.
- R. A. Caruso, M. Ashokkumar and F. Grieser, Sonochemical formation of colloidal platinum, Colloids Surf., A, 2000, 169(1–3), 219–225 CrossRef CAS
, ISSN: 0927-7757.
- K. Okitsu,
et al., Sonochemical preparation of ultrafine palladium particles, Chem. Mater., 1996, 8(2), 315–317 CrossRef CAS
, ISSN: 0897-4756.
- B. G. Pollet, The use of ultrasound for the fabrication of fuel cell materials, Int. J. Hydrogen Energy, 2010, 35(21), 11986–12004 CrossRef CAS
, ISSN: 0360-3199.
- M. H. Khorasanizadeh,
et al., Ultrasound-accelerated synthesis of uniform DyVO4 nanoparticles as high activity visible-light-driven photocatalyst, Ultrason. Sonochem., 2019, 59, 104719 CrossRef CAS
, ISSN: 1350-4177.
-
B. G. Pollet. Introduction to Ultrasound, Sonochemistry and Sonoelectrochemistry. Cham, 2019 Search PubMed
.
- K. Okitsu, M. Ashokkumar and F. Grieser, Sonochemical synthesis of gold nanoparticles: effects of ultrasound frequency, J. Phys. Chem. B, 2005, 109(44), 20673 CrossRef CAS
, ISSN: 1520-6106.
- S. Merouani,
et al., Sensitivity of free radicals production in acoustically driven bubble to the ultrasonic frequency and nature of dissolved gases, Ultrason. Sonochem., 2015, 22(2), 41–50 CrossRef CAS
, ISSN: 1350-4177.
- T. Kimura, Standardization of ultrasonic power for sonochemical reaction, Ultrason. Sonochem., 1996, 3(3), S157–S161 CrossRef CAS
, ISSN: 1350-4177.
- B. Escobar Morales,
et al., Synthesis and characterization of colloidal platinum nanoparticles for electrochemical applications, Int. J. Hydrogen Energy, 2010, 35(9), 4215–4221 CrossRef CAS
, ISSN: 0360-3199.
- M. A. Margulis and I. M. Margulis, Calorimetric method for measurement of acoustic power absorbed in a volume of a liquid, Ultrason. Sonochem., 2003, 10(6), 343–345 CrossRef CAS
, ISSN: 1350-4177.
- Y. Mizukoshi,
et al., Preparation of platinum nanoparticles by sonochemical reduction of the Pt(IV) ions: role of surfactants, Ultrason. Sonochem., 2001, 8(1), 1–6 CrossRef CAS
, ISSN: 1350-4177.
- Y. Iida,
et al., Sonochemistry and its dosimetry, Microchem. J., 2005, 80(2), 159–164 CrossRef CAS
, ISSN: 0026-265X.
- Y. Son,
et al., Geometric Optimization of Sonoreactors for the Enhancement of Sono-chemical Activity, J. Phys. Chem. C, 2011, 115(10), 4096–4103 CrossRef CAS
, ISSN: 1932-7447.
- S. de La R. D’auzay, J.-F. Blais and E. Naffrechoux, Comparison of characterization
methods in high frequency sonochemical reactors of differing configurations, Ultrason. Sonochem., 2010, 17(3), 547–554 CrossRef
, ISSN: 1350-4177.
- S. Koda,
et al., A standard method to calibrate sonochemical efficiency of an individual reaction system, Ultrason. Sonochem., 2003, 10(3), 149–156 CrossRef CAS
, ISSN: 1350-4177.
- R. F. Contamine,
et al., Power measurement in sonochemistry, Ultrason. Sonochem., 1995, 2(1), S43–S47 CrossRef
, ISSN: 1350-4177.
- N. T. K. Thanh, N. Maclean and S. Mahiddine, Mechanisms of Nucleation and Growth of Nanoparticles in Solution, Chem. Rev., 2014, 114(15), 7610–7630 CrossRef CAS
, ISSN: 0009-2665.
Footnote |
| † Electronic supplementary information (ESI) available. See DOI: 10.1039/d0ma00909a |
| This journal is © The Royal Society of Chemistry 2021 |


