 Open Access Article
An ultra-lithiophilic oxidation layer in a Ni-foam-based anode for lithium metal batteries†
Yusong
Choi
 *a,
Tae-Young
Ahn
 a,
Eun Hye
Lee
 a,
Tae-Uk
Hur
 a,
Sang-Hyeon
Ha
 ab,
Jae-In
Lee
 ab,
Tae Ryong
Park
 a,
Chi Hun
Choi
 a,
Ji-Youn
Kim
 a and
Jang-Hyeon
Cho
 a
a
aAgency for Defense Development, P.O. Box 35, Yuseong, Daejeon 34186, Republic of Korea. E-mail: richpine87@gmail.com; Fax: +82-10-823-3400; Tel: +82-42-821-2457
bDepartment of Electrical Engineering, KAIST, 291 Daehak-ro, Yuseong-gu, Daejeon 34141, Republic of Korea
First published on 1st March 2021
Abstract
High-energy-density rechargeable batteries have been gaining considerable importance in the field of renewable energy, and Li-infused anodes are potential candidates for the development of such batteries. However, the poor cycling and dimensional stability of Li affects their performance. As most materials used in battery manufacturing are lithiophobic to molten Li, infusion of Li into the porous structures with an intrinsically lithiophobic surface presents challenges in the development of Li batteries. Optimising and improving the wettability of molten Li is one approach to address this. Herein, we propose a very practical and straightforward oxidation method for achieving an ultra-lithiophilic NiO layer on the surface of a three-dimensional Ni-foam. Oxidation of the Ni-foam in air resulted in a remarkable increase in the wettability of molten Li on the Ni surface, with a decrease in the wetting angle from 120° to 0°. A NiO layer was epitaxially grown on the surface of the Ni-foam, with a thickness of several hundreds of nanometres. This layer was lithiophilic and showed high electrical conductivity. An anode prepared using Li-infused oxidised Ni-foam showed no evidence of short circuits or dendrite formation after 1000 cycles of stripping and plating at 0.1 and 0.5 mA cm−2, whereas a pure Li anode showed unstable stripping and plating behaviour at 0.5 mA cm−2. The proposed surface-treatment method is considered the most simple and practical method among those reported to date, and the Ni-foam produced using this method showed excellent anode performance. Hence, the proposed method will facilitate further development of rechargeable lithium-metal battery technology.
Introduction
The demand for renewable and eco-friendly energy sources and the assigned-energy storage systems is driving the intensive research on high-energy-density rechargeable batteries.1–3 Recently, Li-infused metal anodes have been intensively investigated for the production of high energy density Li batteries. Pure Li can theoretically extract high specific energy (3860 mA h g−1), while exhibiting a low electrochemical potential (−3.04 V vs standard hydrogen electrode).4–7 However, it has poor cycling stability due to dendrite formation and dimensional instability for stripping and plating during cycling.8–11 Consequently, optimising the wettability of molten Li is of considerable importance in the field of Li metal batteries.9 Theoretically, good spreading of molten Li requires a substrate with high lithiophilicity.9 However, most materials used in battery manufacturing, including metals and carbon-containing materials, are lithiophobic to molten Li and aggressively react during Li infusion. In general, the non-wettability of molten Li results in the formation of a liquid hemisphere on the substrates,12–14 which cannot be directly used for the infusion of Li in metal anodes.Porous metal anodes infused with molten Li, as well as those containing a binder material, have been intensively investigated in recent years.1–3 Molten lithium infusion into highly porous Ni-foam seems to be the most promising technology.15 However, challenges related to molten Li infusion into the porous structure with an intrinsically lithiophobic surface hinders its use for rechargeable lithium batteries.16
To date, remarkable improvements in the wetting of molten Li on highly porous Ni-foam have been reported.15,17 In general, this is achieved by applying a thin interlayer (nanolayer) to lower the surface energy; the interlayer materials studied include: Ag,11,18 Al,19 Al2O3,20 Si,21 organic functional coatings,16 CuO,22 ZnO,23–25 and Au.26 Methods for synthesizing such nanolayers on the surface of Ni-foam or current collectors include hydrothermal synthesis, atomic layer deposition, and chemical vapour deposition (CVD).15 However, most of these surface treatments require high vacuum (such as CVD) and are labour-intensive, time-consuming, and expensive.27 Therefore, effective and straightforward methods for increasing the wettability of molten Li must be developed. Recently, Wu et al. reported the method of converting a lithiophobic Cu surface to lithiophilic via thermal oxidation.28 However, thermal oxidation takes 6 h to form a lithiophilic Cu–O layer of 635 nm. Moreover, Cu shows poor stability against molten Li during infusion. In addition, great care must be taken during the molten Li infusion to prevent the melting of Cu along with Li during the process.29
Therefore, herein, we report the improved wettability of molten Li using a remarkably practical and straightforward method of oxidising the Ni-foam in air. The developed NiO nanolayer can completely solve the problem of poor wettability of molten Li. The NiO layer can be used to modify the surface energy of molten Li, thereby facilitating homogeneous spreading of metallic Li on the Ni-foam substrate. We demonstrated its applicability for producing Li-infused Ni-foam anodes by performing cyclic testing. We propose that this method is the most simple and practical among those published to date, and could facilitate the use of porous metal anodes for rechargeable Li-metal batteries.
Results and discussion
Effect of oxidised Ni-foam on the wettability of molten Li
The effect of Ni-foam oxidised in air on the wettability of molten Li on the surface of the former was investigated by changing the oxidation temperature (600, 700, and 800 °C) and oxidation time (5, 10, and 15 min). Below 600 °C, the Ni-foam showed an uneven oxidation layer, indicating partial oxidation of the surface. Above 800 °C, the Ni-foam showed a red hue during the heat-treatment. The Ni-foam sample oxidised at 600 °C for 5 min was used for molten Li infusion experiments, as discussed later. The as-received Ni-foam before oxidation was shiny and silver, which changed to dark grey after oxidation, as shown in Fig. 1. With increasing oxidation temperature and time, the colour of the oxidised Ni-foam changed to dark-grey and then to dark-green, as shown in Fig. S1 and S2 (ESI†). This was attributed to the oxide layer becoming thicker, as well as to changes in the NiO species (Ni2O3 (nickel(III) oxide) is blackish, while NiO (nickel(II) oxide) is greenish). | ||
| Fig. 1 (a) Schematic diagram of the oxidation of Ni-foam, (b) photographs of the as-received and oxidised Ni-foam samples. | ||
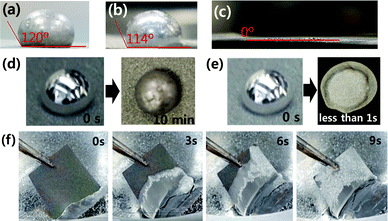
The wettability was investigated by measuring the contact angle between the molten Li and oxidised Ni-foam. Molten Li (melted at 370 °C) was dropped onto the oxidised Ni-foam, as shown in Fig. 2. Molten Li on the non-oxidised Ni-foam showed hemispherical Li droplet on the surface, as shown in Fig. 2(a, b and d). The contact angle was measured after 10 min when wetting was complete and molten Li was cooled (Fig. 2(d)). The contact angles of Li on pressed and un-pressed non-oxidised Ni-foam were 120° and 114°, respectively, as shown in Fig. 2(a) and (b), respectively. Wang et al. reported that the contact angles of Li on pressed and un-pressed (non-oxidised) Ni-foam were 91° and 129°, respectively.26 The difference observed between this study and that of Wang et al. can be attributed to the experimental condition of the Ni-foam surface. It is worth mentioning that non-oxidised Ni-foams show highly lithiophobic properties (contact angle >90°). In contrast, when molten Li was dropped onto the oxidised Ni-foam, the droplet quickly infused into the foam in less than 1 s, as shown in Fig. 2(e) and ESI,† Supplementary Movie Clip 1 (Molten Li infusion into the oxidised Ni-foam). This infusion occurred immediately after placing the molten Li on the oxidised Ni-foam, which thoroughly coated the inside surface of the Ni-foam. Therefore, the contact angle was 0° immediately after the drop was placed, as shown in Fig. 2(c). Wang et al. mentioned that surface topography plays a vital role in the wetting of liquid Li. In their study, the wettability of Ni-foil was highly superior to that of Ni-foam (the contact angles for Ni-foil, Ni-foam and pressed Ni-foam were 67°, 129° and 91°, respectively).26 However, oxidation of Ni-foam shows drastically improved wetting, which is contradictory to that reported by Wang et al.
To investigate the infusion of molten Li into the oxidised Ni scaffold, oxidised Ni-foam (600 °C, 5 min) was touched lightly to the surface of molten Li (370 °C), and the infusion behaviour was observed over time, as shown in Fig. 2(f). The oxidised Ni-foam sample (50 mm × 50 mm) soaked up the molten Li in the entire structure within 9 s, which is the fastest infusion reported to date.
The mechanism by which Li wetting was improved in this study via the oxidation of Ni is shown in Fig. 3. The as-received Ni-foam was lithiophobic, which prevented the molten Li from infusing into the pores of the foam. In contrast, the oxidised Ni-foam was ultra-lithiophilic, which allowed the molten Li to quickly and efficiently infuse into the pores of the Ni-foam (Fig. 3(a)). The improved wetting is more clearly explained in Fig. 3(b), where the oxide layer on the Ni-foam acts like a wetting agent to allow the molten Li to wet the surface and be infused into the foam. The wetting mechanism is discussed in more detail later.
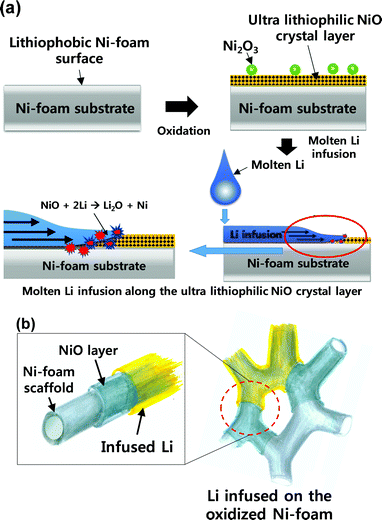 | ||
| Fig. 3 Schematic diagrams of the process of molten Li wetting the oxidised Ni-foam: (a) substrate surface and (b) microscopic surface of the scaffold. | ||
Structure of the ultra-lithiophilic NiO layer
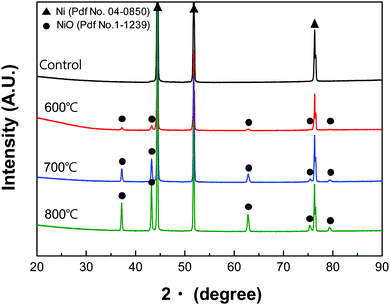
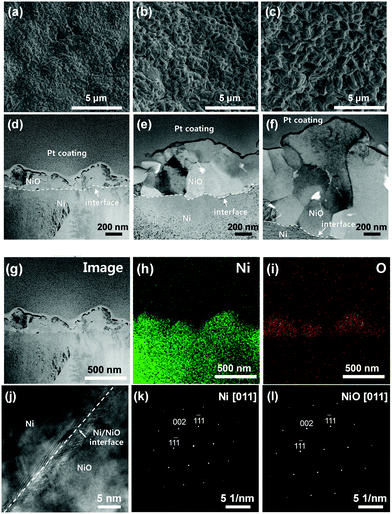
Interestingly, XRD analysis (Fig. 4) showed NiO crystal growth on the oxidised Ni-foam for all oxidation temperatures. Before oxidation, XRD peaks at 44.5°, 51.8°, and 76.4° were observed, which were attributed to the (111), (200), and (220) planes of pure Ni (2θ =, PDF-# No. 04-0850).29,30 In contrast, the oxidised Ni-foam showed NiO peaks at 37.3°, 43.3°, 63°, 75.4°, and 79.4°, which correspond to crystal planes of (111), (200), (220), (311), and (222), respectively. It should be noted that the NiO peaks were observed only after oxidation. With increasing oxidation temperature, the NiO peaks increased in intensity and became sharper, thereby indicating enhanced crystallinity.As shown in Fig. 5, scanning electron microscopy (SEM) and transmission electron microscopy (TEM) analyses were conducted to investigate the microstructure of heat-treated Ni-foam. Fig. 5(a)–(c) show SEM images of the heat-treated Ni-foams. As the oxidation temperature increased from 600 to 800 °C, the NiO particles on the Ni-foam coarsened. Fig. 5(d)–(f) show bright-field scanning TEM (STEM) images of the oxidised Ni-foams, which show that the lithiophilic NiO layer increased in thickness with increasing oxidation temperature from 600 °C to 800 °C.
The measured thicknesses of the oxide layer at oxidation temperatures of 600, 700, and 800 °C were approximately 0.2, 1, and 2 μm, respectively. These results indicate that the increase in the oxide layer thickness was due to coarsening of the grains with increasing oxidation temperature. Fig. 5(g)–(i) show a bright-field TEM image and elemental maps of the sample oxidised at 600 °C. The oxygen map identified the oxide layer and the Ni matrix. Fig. 5(j) shows a high-resolution TEM (HRTEM) image of the sample oxidised at 600 °C. The interface between Ni and the oxide layer was distinguished. It seemed that a strain occurred at the interface of Ni/NiO due to the difference in lattice parameters of Ni and NiO. Fig. 5(k) and (l) (Fig. S3 and S4, ESI†) show the selected area electron diffraction (SAED) patterns of Ni and the oxide layer formed at 700 °C and 800 °C, respectively. The results indicate that the NiO layer grows epitaxially on the Ni matrix, where identical planes of the two phases, such as (111) and (200), are parallel.
We propose a mechanism for the generation of the NiO layer based on the XPS, TEM, and XRD results. First, the as-received Ni was oxidised at 600 °C to form a thin layer of epitaxially grown NiO on the surface of the Ni matrix. Subsequently, an approximately 200 nm-thick NiO layer was formed in 5 min. With further increase in temperature, the NiO layer thickens even more to form coarser NiO of 2 μm thickness.
Mechanism of improved wettability via oxidation
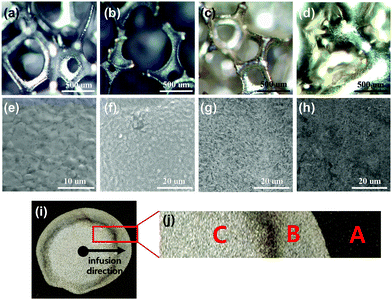
Wang et al. reported that the Li2O passivation layer hinders the wetting of molten Li, as the metal foam with a rough surface is highly lithiophobic (wetting angle >90°).26 However, our analysis of the oxidation of Ni-foam showed improved wettability of molten Li on the Ni-foam surface. In contrast to the findings of Wang et al., the mechanism by which molten Li wetting improved on the oxidised Ni-foam was attributed to the oxide layer formed on the Ni-foam (see Fig. 3). The as-received Ni-foam (pure Ni) is very lithiophobic.26 However, after the oxide layer is formed on its surface, Ni becomes lithiophilic (Fig. 2(c), (e) and (f), e.g. contact angle = 0°). The oxide layers were several hundreds of nanometres thick and consisted of a single layer, as shown by the EDS maps in Fig. 7(h) and (i). Wang et al. reported that coating a surface with gold via plasma coating improved the wettability of molten Li on the substrate.26 However, plasma coating is practical only for flat 2D substrates and does not effectively coat the internal structure of complex 3D metal foams. The deposition of Si layers by CVD is also not effective for 3D metal foams.15 In contrast, oxidation of Ni in the air can form a nanoscale oxide layer with highly lithiophilic behaviour, which can be used as a substrate to form molten-Li-infused Ni-foam anodes in only a few seconds.Microscopy analysis was conducted to study the oxide layer structure in more detail. Fig. 6 shows the wetting and infusion mechanism of molten Li on the oxidised Ni-foam in detail. The lithiophobic Ni-foam control sample (silver coloured, Fig. 6(a)) changed into a lithiophilic Ni-foam with a tarnished surface after oxidation (Fig. 6(b)). The SEM image in Fig. 6(e) shows that the surface of the oxidised Ni-foam had more densely packed grains than those of the control sample, which was attributed to the presence of the NiO layer. When molten Li was dropped onto the lithiophilic oxidised Ni-foam, it easily wetted the surface to form an even coating (Fig. 6(c)). This is an intriguing observation, as a previous study reported that Li2O hinders the wetting and infusion of molten Li.22
In contrast, the excellent wetting of molten Li on the oxidised Ni-foam surface is the prerequisite for the rapid infiltration of molten Li into the entire Ni-foam structure. It should be noted that the molten Li could uniformly wet the surface of the Ni-foam scaffold due to the lithiophilic oxide layer. The lithiophilic NiO layer has lower surface energy than that of the pure Ni-foam, which resulted in the formation of a lithiophilic surface that allows an effective infusion of molten Li into the porous structure. This mechanism increases the feasibility and practicality of the fabrication of Li-infused Ni-foam anodes for Li batteries (in terms of reduced thermal oxidation time), which can achieve a high energy density and stable performance without dendrite growth.
Molten Li infusion as a function of oxidation temperature
Thickening of the oxide layer was investigated using TEM after focused ion beam (FIB) milling of Ni-foam samples oxidised at 600, 700, and 800 °C for 5 min, as shown in Fig. 5(d)–(f). The thickness of the oxide layer formed after oxidation at 600 °C for 5 min was approximately 200 nm, while it was up to 2 μm after oxidation at 800 °C for 5 min.The infusion of molten Li into Ni-foam oxidised at different temperatures was investigated. A thick NiO layer, with nickel(II) oxide as the main oxide type, was formed at 800 °C. Ni-foam oxidised at 600 °C shows mild and very fast (less than 1 s, ESI,† Supplementary Movie Clip 2 (molten Li infusion into the oxidized Ni-foam at 600 °C)) Li infusion. However, Ni-foam oxidised at 700 and 800 °C undergoes burning during Li infusion. This exothermic reaction (burning) is attributed to the reaction between the thicker NiO and Li to form Li2O and Ni (as shown in Fig. 3(a)). Due to the high amount of heat generated during the reaction (oxidation of Ni-foam at 700 and 800 °C; ESI,† Movie Clip 1 and Fig. S5) the periphery of the Ni-foam infused with molten Li was observed to blacken. The resistivity of the region infused with molten Li in the samples oxidised at 700 and 800 °C increased from 0 and 0.1 Ω to approximately 1.0 Ω; this result was ascribed to the formation of Li2O, which is non-conductive due to the excess oxygen in NiO. In addition, the Ni-foam oxidised at 800 °C became extremely brittle as a result of the development of a thick NiO layer. Based on these results, we concluded that the samples oxidised at 700 and 800 °C resulted in the formation of high quantities of NiO; subsequently, instead of a mild and gentle infusion of molten Li, a vigorous reaction between the oxygen of NiO and the molten Li was observed during wetting. Therefore, oxidation of the Ni-foam at temperatures over 600 °C should be avoided, and the oxidation time should be limited to less than 5 min.
Haugsrud studied the oxidation mechanisms of pure Ni at high temperatures under oxygen and air atmospheres,31 and presented cross-sectional images of the oxide scales formed at 700, 800, 900, and 1200 °C in air. At 700 °C, a relatively fine-grained oxide was formed both at the oxide–metal and oxide–gas interfaces, while the intermediate layer had a coarse columnar microstructure. With increasing oxidation temperature, a familiar duplex structure appeared with a coarse outer region and a fine-grained inner region that was slightly porous. At the intermediate oxidation temperature, the surface of the oxide showed a ridge-like morphology. The microstructures of our samples shown in Fig. 6(a)–(c) were consistent with those described in the previous study.30 The microstructural evolution as a function of the oxidation temperature is attributed to the nickel ion transport along the grain boundaries and/or dislocations in the nickel substrate. The duplex oxide scale coarsening observed in Fig. 6(a)–(c) as a function of increasing oxidation temperature was due to micro-fissures and inward growth of NiO as reported by Hafez et al.28 A detailed discussion of the mechanism of NiO formation is beyond the scope of this study. Taking advantage of this mechanism, metal foam with a low Li coverage was fabricated, and the stripping and plating properties were investigated, as reported by Hafez et al.28 For comparison, a foam with a high Li coverage was fabricated by complete infusion of molten Li (Fig. 6(d and h). The SEM image of the surface of an oxidised Ni-foam infused with Li nickel foam (Fig. 6(g)) shows a fluffy carpet-like coating, which is believed to be composed of lithium oxides. The molten Li completely infused into the porous Ni-foam structure, as shown in Fig. 6(d and h).
Mechanism of molten Li infusion into oxidised Ni-foam
To investigate the new chemical compounds formed between the molten Li and the NiO layer, XRD analysis was conducted on Li-infused Ni-foam. Both Ni and Li peaks were observed in the diffraction pattern shown in Fig. 7(a) and Fig. S6 (ESI†). The high penetration depth of the XRD beam allowed the Ni scaffold under the Li layer to be detected, as indicated by the strong Ni peaks. In addition, Li peaks were observed at 32.67°, 36.15°, 52.16°, and 64.56°.32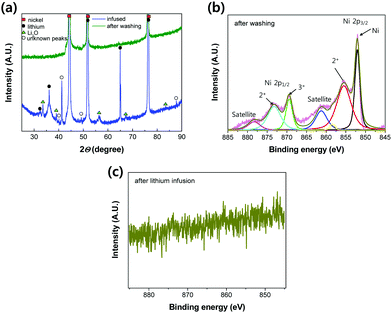 | ||
| Fig. 7 (a) XRD pattern of Ni-foam after molten Li infusion and after removing the infused Li. (b) XPS spectra of after removing the infused Li. (c) XPS spectrum of Ni-foam after molten Li infusion. | ||
Interestingly, the NiO peaks observed after the oxidation of Ni were not observed after Li infusion, which was attributed to the reaction between the oxygen in NiO and molten Li. This reaction is thought to have formed Li2O; this was because peaks at 33.70°, 39.21°, 56.37°, 67.51°, and 84.04° were observed, corresponding to the (100), (200), (220), (311), and (400) planes of Li2O (PDF-#15-254), respectively. The XRD pattern after removing the infused Li by washing with water shows no peaks corresponding to Li2O, Li, and NiO; this result strongly supports the reaction mechanism of molten Li infusion into oxidised Ni-foam. Namely, after molten Li infusion, the reactants on the surface of the oxidised Ni-foam are observed to be Li, Li2O and Ni. Li and Li2O are easily washed by dipping the foam in water. Therefore, only pure Ni remains, which is a clear indication of the chemical reaction proposed in Fig. 3(a) (e.g. NiO + 2Li → Li2O + Ni).
As reported by Wang et al., the improved wettability can be attributed to new chemical bonds that are formed as a result of the reaction between molten Li and lithiophilic substances.26
 | (1) |
The rapid and spontaneous reaction between molten Li and oxygen is reflected by a negative ΔG value. This change in the Gibbs free energy by either surface treatment or addition of functional groups can be analysed by measuring the contact angle. Another hypothesis for explaining the improved wetting on the oxidised Ni-foam is that the oxygen in NiO reacts to form Li2O immediately upon the infusion of molten Li into the foam scaffold. Therefore, new chemical compounds form, such as Li2O, because of the reaction between molten Li and the NiO layer.
To elucidate the mechanism of molten Li infusion into the oxidised Ni-foam thoroughly, Gibbs free energy calculations were conducted. The most common method for this is the contact angle measurement; however, in this study,26 oxidised Ni-foams show a contact angle of 0° with molten Li. Therefore, the Gibbs free energy (ΔG) was theoretically calculated using the density functional theory (DFT). Table 1 compares the specific Gibbs free energy per unit area (ΔGspecific) of the reaction between Li and a few promising coated materials, which are calculated using a CASTEP module in Materials Studio and a Vienna ab initio Software Package (VASP) code, respectively. The ΔGspecific of Li–NiO calculated by the CASTEP was −50.8 × t × 109 J cm−2, indicating a negative value that is smaller than approximately 2.5 times that for ZnO (−20.4 × t × 109 J cm−2), which is the best value reported thus far. Wang et al. mentioned that the hindering effect of Li2O films leads to inferior wettability.26 However, based on the DFT calculation and XRD analysis, a significantly high ΔGspecific of the Li–NiO reactions generating Li2O results in the drastic improvement of molten Li infusion into oxidised Ni-foam.
| Layer materials | Reaction | CASTEP ΔGspecific (109 J m−2) | VASP ΔGspecific (109 J m−2) |
|---|---|---|---|
| Note: t is the layer thickness | |||
| NiO | NiO + 2Li → Li2O + Ni | −50.8 × t | −56.1 × t35 |
| Au | Au + 3.75Li → 0.25Li15Au4 | −17.1 × t | −15.8 × t36 |
| ZnO | ZnO + 5Li → Li3Zn + Li2O | −20.2 × t | −20.4 × t37 |
| Si | 4.2Li + Si → 0.2Li21Si5 | — | −9.3 × t |
To elucidate the new bonds formed after molten Li infusion into the oxidised Ni-foam, XPS analysis was conducted, as shown in Fig. 7(b). For these measurements, Li was removed from the surface of the oxidised Ni-foam by soaking it in water to dissolve the Li. A strong Ni peak at 851.2 eV was observed, corresponding to metallic Ni, which had a higher intensity than that of the control Ni-foam. No evidence of peaks related to Ni2O3 (e.g., Ni3+ in Ni 2p3/2) was observed after Li was removed; however, a weak Ni2O3 peak was observed. The Ni–O peaks of Ni2+ and Ni3+ indicate the residual oxygen functional group on the surface of Ni-foam. This is because the 10 keV XPS beam probes only 0.37 nm of the particle surface layer, and not whole bulk-oxidised nickel oxide layers.38 After removing Li, Li2O peaks were not observed in either the XPS or XRD data (Fig. 7(b) and (c)). However, Li2O peaks were observed in the XRD pattern for the Li-infused Ni-foam. Based on the XRD patterns shown in Fig. 7(a), we confirmed that the chemical bonding between Li and O was the main reason for the improved wettability of the oxidised Ni-foam.
To investigate Ni on the surface of the Li-infused Ni-foam, XPS analysis was conducted in the Ni 2p peak region (Fig. 7(c)). No Ni signal was observed as the XPS is a surface technique, and the Ni-foam was thoroughly coated with Li.
Electrochemical testing of Li-infused Ni-foam
Before conducting the electrochemical testing of Li-infused Ni-foam, the electrical conductivity was measured, as shown in Fig. S7 and S8 (ESI†). The control Ni-foam showed an extremely high conductivity (resistance of 0–0.1 Ω). The resistance of the Li-infused Ni-foam was similar to that of the control Ni-foam. Kim et al. reported that NiO is also conductive.34,38 Hence, the NiO layer was synthesized during oxidation and the Li-infused Ni-foam showed good electrical conductivity.39 Therefore, the proposed oxidation method is suitable for preparing electrode materials for Li-metal anodes for next-generation high-performance Li-battery applications.The Li-infused Ni-foam anode showed higher electrical conductivity as compared to that of a pure Li electrode foam due to the NiO layer on the Ni, as shown by the impedance results in Fig. S8 (ESI†). The Nyquist plots of the Li-infused Ni-foam and pure Li electrodes before stripping and plating are shown in Fig. S8 (ESI†). The semicircle representing the interfacial resistance between the electrode and electrolyte was smaller for the Li-infused Ni-foam than that for pure Li; this was attributed to the Ni scaffold in the former, which acts as an effective network for conducting electrons inside the foam. As shown in Fig. S9 (ESI†), both the overpotential and hysteresis were smaller for the Li-infused Ni-foam than those of pure Li after applying a current of 0.1 mA cm−2. At the current density of 0.1 mA cm−2, both pure Li and Li-infused Ni-foam show insignificant differences at around 250 cycles (at 500 h); however, at around 1000 cycles, the overpotential of Li-infused Ni-foam slightly reduced to 0.01 V. On the other hand, the overpotential of pure Li shows a slight increase to 0.018 V as compared to that observed at 250 cycles (0.015 V). However, the enhanced overpotential and hysteresis were more significant at 0.5 mA cm−2. In stripping and plating comparison shown in Fig. 8, pure Li has been cycled for 2121 h until a cut-off potential of 0.115 V is achieved; meanwhile, Li-infused Ni-foam has been cycled for 2268 h until it achieves the same cut-off potential (0.115 V). The overpotential of pure Li continued to increase at 0.5 mA cm−2, which was attributed to the formation of lithium dendrites (as shown in Fig. S10, ESI†) and dead lithium particles.15 However, the Li foam was stable because of the high electron conductivity provided by the Ni-foam scaffold.
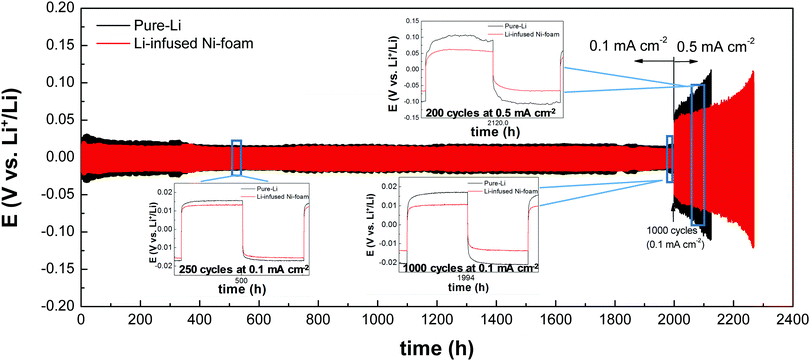 | ||
| Fig. 8 Comparison of stripping and plating performance of oxidised Ni–Li (Li-infused Ni-foam) and pure-Li electrodes in symmetric cells. | ||
The results of the impedance analysis for 100 and 1000 cycles reveal that the semicircle of pure Li was smaller than that observed before stripping and plating probably due to the stabilization reactions occurring on the surface and the formation of the SEI layer. However, the Nyquist plot for the Li infused Ni-foam was very similar to that before stripping and plating, which clearly indicates its better stability as compared with that of the pure Li electrode. The surface infused with molten Li on the oxidised Ni-foam shows instability during the stripping and plating test (Fig. S11, ESI†), which will be investigated further.
Moreover, the NiO formed on the surface of the Ni-foam scaffold is electrically conducting, allowing this layer to conduct electrons between the infused Li and Ni scaffold. The hybrid effect of electron conduction in the Ni-foam network and NiO layer synergistically enhanced the stability, which is indicated by the low hysteresis and overpotential during the stripping and plating of the Li infused Ni-foam. Hence, the electrochemical properties were significantly enhanced as compared to those of the pure Li metal anode. Therefore, the Li infused Ni-foam formed via the practical and efficient oxidation of the Ni scaffold showed desirable electrochemical behaviour for use as an anode in Li-ion batteries. Moreover, the oxidation method is thought to be time- and cost-effective for producing anodes.
Conclusion
We observed a remarkable increase in the wettability of molten Li on Ni-foam after the foam was oxidised in air. The formation of Li2O was spontaneous, and among the fastest formations that have been reported thus far. The oxidation resulted in the formation of a highly conductive NiO layer that was several hundreds of nanometres thick. Moreover, the oxide layer was ultra lithiophilic; the contact angle of molten Li on the Ni-foam reduced from 120° (before oxidation) to 0° (after oxidation). The low contact angle and easy diffusion of Li into the Ni-foam were attributed to the chemical reaction between Li and O to form Li2O. The driving force for molten Li wetting is governed by the Gibbs free energy. The Gibbs free energy for the Li–NiO reaction (−50.8 × 10⁹ J cm−3) was calculated to be 2.5 times lower than the Gibbs free energy of promising materials such as Au, ZnO and Al2O3. It is also the lowest reported value thus far. The lowest Gibbs free energy of the reaction is attributed to the excellent wettability of molten Li on the oxidised Ni-foam. Indeed, the cycling tests of the Li foam anodes showed no evidence of short circuits or dendrite formation during stripping and plating. The simple and practical oxidation method is thought to be superior to other existing methods for improving the wettability of Li anodes, and it can be valuable in the development of rechargeable Li batteries. The long-term stability of the Li infused Ni-foam anode using the full cell cycle test will be determined for these batteries.Methods
Ni-Foam oxidation
Nickel foam (porosity: 90%, pore size: 450 μm, thickness: 1.5 mm; Alantum Corporation, South Korea) was used without being subjected to any treatment. The as-received Ni-foam, which contained pure Ni, appeared to have an embossed surface with convex features. The Ni-foam sheets were cut into 50 × 50 mm2 pieces and then roll-pressed (MH4389, Dong-Jin Instrument, South Korea) to achieve a thickness of 0.8 mm. The pressed Ni-foam samples were ultrasonicated in acetone (99.8% purity; Daejung, South Korea) and anhydrous ethanol (99.9% purity; Daejung, South Korea) for 30 min each. The pressed Ni-foam samples were then dried at 90 °C in an oven overnight. The dried Ni-foam samples were oxidised in a furnace (Electronic furnace C-109, Hantech Co., South Korea) in air to modify their surface properties. The oxidised Ni-foam samples were impregnated with Li in a glove box (KK-021AD, Korea Kiyon, South Korea) containing less than 0.1 ppm of H2O and O2. In a mantle furnace purged with Ar (99.999% purity), Li (99.9% purity) was melted in a 200 mL stainless steel crucible in a mantle furnace at 400 °C. To avoid the nitration of the Li, the system was purged with Ar at 50 sccm.Molten lithium wettability
The as-received and oxidised foam samples were placed on a graphite plate at room temperature inside an Ar-filled glove box (KK-AD, Korea Kiyon, South Korea) under conditions of less than one part per million (ppm) of H2O and O2 respectively; subsequently, molten Li was dropped onto the sample surfaces. Photographs of the Li droplet were taken 10 min after the molten Li was placed on the surface to determine the contact angle.Electrochemical measurements
The electrochemical properties of the samples were investigated using a CR2032 asymmetric coin cell structure. First, Li-infused oxidised Ni-foam sheets were punched to form anode samples with a diameter of 1.6 mm. For comparison, a pure Li disc was used as a control anode. Celgard® 2500 (Celgard, USA) material was used as a separator. The electrolyte was 0.5 M bis(trifluoromethane)sulfonamide lithium (LiTFSI) in triethylene glycol dimethyl ether (TEGDME), purchased from Wellcos Corp. (South Korea). All electrode samples were stored under dry conditions (R.H. < 0.2%) and assembled in an Ar-filled glove box (KK-AD, Korea Kiyon, South Korea) under conditions of less than one part per million (ppm) of H2O and O2. The electrode samples were dried just prior to assembly. After assembly, the voltage measurements were performed during stripping and plating at a current density of 0.1 mA cm−2 (0.1 mA h cm−2) for 2000 h (1000 cycles) and then at 0.5 mA cm−2 (0.1 mA h cm−2).Specific Gibbs free energy calculations
ΔGspecific calculations were conducted using ΔG calculated using the CASTEP (ΔGCASTEP) module in the Materials Studio package and the VASP (ΔGVASP). ΔGVASP for each reaction was calculated using the final energy per atom for the experimentally determined crystal models with the lowest formation energy, except for Li3Zn, as indicated in the Materials Project (materialsproject.org). To confirm the values of ΔGVASP, the ΔGCASTEP was calculated using the same models as those used for the ΔGVASP calculations. The generalised gradient approximation (GGA) of Perdew–Burke–Ernzerhof (PBE) was used as the exchange–correlation functional, and the core electrons were treated using ultrasoft pseudopotentials. The convergence tolerance for the geometry optimisation of each crystal structure was an energy of 2.0 × 10⁻⁵ eV atom−1, a maximum force of 0.05 eV Å−1, a maximum stress of 0.1 GPa, and a maximum displacement of 0.002 Å. An energy cut-off of 400 eV was used. The k-points in Brillouin zone according to the Monkhorst–Pack method were set to a 4 × 4 × 4 grid. All energies were obtained using spin-polarisation. For the NiO calculation, a DFT+U method with an effective U value of 6.2 eV for the Ni 3d electrons was used. The ΔGspecific was calculated using the molar mass and density at room temperature for each coated material.XPS analysis
The surface chemistries for oxidised Ni-foam, Li-infused Ni-foam, and Ni-foam after water washing were analysed using XPS (Thermo Fischer Scientific K-Alpha+ XPS, the X-ray source is Kα 200 μm). The surface was Ar etched before XPS analysis.SEM and TEM analyses
After the samples were prepared, their chemical compositions and microstructures were observed via scanning electron microscopy (SEM; FEI-QUANTA650). The specimens for the TEM analysis were prepared using a focused ion beam (FIB, JEOL, JIB-4601F). The chemical compositions and crystal structure of the oxide layer on the Ni-foam were characterized using a TEM (JEOL, JEM-2100F) with energy dispersive spectroscopy (EDS; Oxford, X-Max 80T).Conflicts of interest
There are no conflicts to declare.References
- J. Lu, Z. Chen, F. Pan, Y. Cui and K. Amine, Electrochem. Energy Rev., 2018, 1, 35 CrossRef CAS.
- J. B. Goodenough and K. S. Park, J. Am. Chem. Soc., 2013, 135, 1167 CrossRef CAS.
- P. Albertus, S. Babinec, S. Litzelman and A. Newman, Nat. Energy, 2018, 3, 16 CrossRef CAS.
- C. Liu, Z. G. Neale and G. Cao, Mater. Today, 2016, 19, 109 CrossRef CAS.
- M. D. Tikekar, S. Choudhury, Z. Tu and L. A. Archer, Nat. Energy, 2016, 1, 16114 CrossRef CAS.
- W. Li, H. Yao, K. Yan, G. Zheng, Z. Liang, Y.-M. Chiang and Y. Cui, Nat. Commun., 2015, 6, 7436 CrossRef CAS.
- X. Liang, Q. Pang, I. R. Kochetkov, M. S. Sempere, H. Huang, X. Sun and L. F. Nazar, Nat. Energy, 2017, 2, 17119 CrossRef CAS.
- J. Zheng, M. H. Engelhard, D. Mei, S. Jiao, B. J. Polzin, J.-G. Zhang and W. Xu, Nat. Energy, 2017, 2, 17012 CrossRef CAS.
- D. Lin, Y. Liu and Y. Cui, Nat. Nanotechnol., 2017, 12, 194 CrossRef CAS.
- R. Zhang, X. R. Chen, X. Chen, X. B. Cheng, X. Q. Zhang, C. Yan and Q. Zhang, Angew. Chem., Int. Ed., 2017, 56, 7764 CrossRef CAS.
- C. Yang, Y. Yao, S. He, H. Xie, E. Hitz and L. Hu, Adv. Mater., 2017, 29, 1702714 CrossRef.
- C. Wang, H. Xie, L. Zhang, Y. Gong, G. Pastel, J. Dai, B. Liu, E. D. Wachsman and L. Hu, Adv. Energy Mater., 2018, 8, 1701963 CrossRef.
- Y. Liu, D. Lin, Z. Liang, J. Zhao, K. Yan and Y. Cui, Nat. Commun., 2016, 7, 10992 CrossRef CAS.
- J. Kang, H. V. Kim, S. A. Chae and K. H. Kim, Small, 2018, 14, 1704394 CrossRef.
- S.-S. Chi, Y. Liu, W.-L. Song, L.-Z. Fan and Q. Zhang, Adv. Funct. Mater., 2017, 27, 1700348 CrossRef.
- S.-H. Wang, J. Yue, W. Dong, T.-T. Zuo, J.-Y. Li, X. Liu, X.-D. Zhang, L. Liu, J.-L. Shi, Y.-X. Yi and Y.-G. Guo, Nat. Commun., 2019, 10, 4930 CrossRef.
- Y. S. Choi, H. R. Yu and H. W. Cheong, J. Power Sources, 2015, 276, 102 CrossRef CAS.
- R. Zhang, X. Chen, X. Shen, X.-Q. Zhang, X.-R. Chen, X.-B. Cheng, C. Yan, C.-Z. Zhao and Q. Zhang, Joule, 2018, 2, 764 CrossRef CAS.
- K. K. Fu, G. Yunhui, L. Boyang, Z. Yizhou, X. Shaomao, Y. Yonggang, L. Wei, W. Chengwei, L. D. Steven, D. Jiaqi, C. Yanan, M. Yifei, W. Eric and H. Liangbing, Sci. Adv., 2017, 3, 1601659 CrossRef.
- X. Han, Y. Gong, K. K. Fu, X. He, G. T. Hitz, J. Dai, A. Pearse, B. Liu, H. Wang, G. Rubloff, Y. Mo, V. Thangadurai, E. D. Wachsman and L. Hu, Nat. Mater., 2017, 16, 572 CrossRef CAS.
- Z. Liang, D. Lin, J. Zhao, Z. Lu, Y. Liu, C. Liu, Y. Lu, H. Wang, K. Yan, X. Tao and Y. Cui, Proc. Natl. Acad. Sci. U. S. A., 2016, 113, 2862 CrossRef CAS.
- C. Zhang, W. Lu, G. Zhou, Z. Huang, Y. Zhang, R. Lyu, H. Wu, Q. Yun, F. Kang and Q.-H. Yang, Adv. Energy Mater., 2018, 8, 1703404 CrossRef.
- H. Zhang, X. Liao, Y. Guan, Y. Xiang, M. Li, W. Zhang, X. Zhu, H. Ming, L. Lu, J. Qiu, Y. Huang, G. Cao, Y. Yang, L. Mai, Y. Zhao and H. Zhang, Nat. Commun., 2018, 9, 3729 CrossRef.
- C. Sun, Y. Li, J. Jin, J. Yang and Z. Wen, J. Mater. Chem. A, 2019, 7, 7752 RSC.
- Y. Zhanga, W. Luoa, C. Wanga, Y. Lia, C. Chena, J. Songa, J. Daia, E. M. Hitza, S. Xua, C. Yanga, Y. Wanga and L. Hua, Proc. Natl. Acad. Sci. U. S. A., 2017, 114, 3584 CrossRef.
- J. Wang, H. Wang, J. Xie, A. Yang, A. Pei, C.-L. Wu, F. Shi, Y. Liu, D. Lin, Y. Gong and Y. Cui, Energy Storage Mater., 2018, 14, 345 CrossRef.
- X.-B. Cheng, R. Zhang, C.-Z. Zhao and Q. Zhang, Chem. Rev., 2017, 117, 10403 CrossRef CAS.
- A. M. Hafez, Y. Jiao, J. Shi, Y. Ma, D. Cao, Y. Liu and H. Zhu, Adv. Mater., 2018, 30, 1802156 CrossRef.
- D. W. Jeppson, J. L. Ballif, W. W. Yuan and B. E. Chou, Hanford Engineering Development Laboratory, Richland, WA, USA, 1978 Search PubMed.
- M. Zhang, P. Li, Z. Tian, M. Zhu, F. Wang, J. Li, B. Dai, F. Yu, H. Qiu and H. Gao, Catalysts, 2018, 8, 293 CrossRef.
- R. Haugsrud, Corros. Sci., 2003, 45, 211 CrossRef.
- M. K. Trivedi, R. M. Tallapragada, A. Branton, D. Triveldi, G. Nayak, O. Latiyal and S. Jana, J. Adv. Chem. Eng., 2015, 5(4), 1000136 Search PubMed.
- A. Meier, D. A. Javernick and G. R. Edwards, JOM, 1999, 51, 44 CrossRef CAS.
- I. A. Aksay, C. E. Hoge and D. A. Pask, J. Phys. Chem., 1974, 78, 1178 CrossRef CAS.
- V. G. Kienast, J. Verma and M. W. Klemm, Z. Anorg. Allg. Chem., 1961, 310, 143 CrossRef.
- H. X. Bi, S. T. Zhang, S. B. Wei, J. Y. Wang, D. Zhou, Q. Li and Y. M. Ma, Phys. Chem. Chem. Phys., 2016, 18, 4437 RSC.
- A. Nail, J. M. Fields, J. Zhao, J. Wang, M. J. Greaney, R. L. Brutchey and F. E. Osterloh, ACS Nano, 2015, 9(5), 5135 CrossRef.
- H.-S. Kim, J. E. Park, M. Patel, H. Kim, D. S. Kim, S. K. Byeon, D. Lim and J. Kim, Mater. Lett., 2016, 174, 10 CrossRef CAS.
- M. S. Park, S. B. Ma, D. J. Lee, D. Im, S.-G. Doo and S. Yamamoto, Sci. Rep., 2014, 4, 1 Search PubMed.
Footnote |
| † Electronic supplementary information (ESI) available. See DOI: 10.1039/d1ma00065a |
| This journal is © The Royal Society of Chemistry 2021 |

