
 Open Access Article
 This Open Access Article is licensed under a
 Creative Commons Attribution 3.0 Unported Licence
Scalable Gaussian processes for predicting the optical, physical, thermal, and mechanical properties of inorganic glasses with large datasets†
Suresh
Bishnoi
a,
R.
Ravinder
a,
Hargun Singh
Grover
a,
Hariprasad
Kodamana
*b and
N. M. Anoop
Krishnan
 *ac
*ac
aDepartment of Civil Engineering, Indian Institute of Technology Delhi, Hauz Khas, New Delhi 110016, India. E-mail: krishnan@iitd.ac.in
bDepartment of Chemical Engineering, Indian Institute of Technology Delhi, Hauz Khas, New Delhi 110016, India. E-mail: kodamana@iitd.ac.in
cDepartment of Materials Science and Engineering, Indian Institute of Technology Delhi, Hauz Khas, New Delhi 110016, India
First published on 15th December 2020
Abstract
Among machine learning approaches, Gaussian process regression (GPR) is an extremely useful technique to predict composition–property relationships in glasses. The GPR's main advantage over other machine learning methods is its inherent ability to provide the standard deviation of the predictions. However, the method remains restricted to small datasets due to the substantial computational cost associated with it. Herein, using a scalable GPR algorithm, namely, kernel interpolation for scalable structured Gaussian processes (KISS-GP) along with massively scalable GP (MSGP), we develop composition–property models for inorganic glasses. The models are based on a large dataset with more than 100![[thin space (1/6-em)]](https://www.rsc.org/images/entities/char_2009.gif) 000 glass compositions, 37 components, and nine crucial properties: density, Young's, shear, bulk moduli, thermal expansion coefficient, Vickers’ hardness, refractive index, glass transition temperature, and liquidus temperature. We show that the models developed here are superior to the state-of-the-art machine learning models. We also demonstrate that the GPR models can reasonably capture the underlying composition-dependent physics, even in the regions where there are very few training data. Finally, to accelerate glass design, the models developed here are shared publicly as part of a package, namely, Python for Glass Genomics (PyGGi, see: http://pyggi.iitd.ac.in).
000 glass compositions, 37 components, and nine crucial properties: density, Young's, shear, bulk moduli, thermal expansion coefficient, Vickers’ hardness, refractive index, glass transition temperature, and liquidus temperature. We show that the models developed here are superior to the state-of-the-art machine learning models. We also demonstrate that the GPR models can reasonably capture the underlying composition-dependent physics, even in the regions where there are very few training data. Finally, to accelerate glass design, the models developed here are shared publicly as part of a package, namely, Python for Glass Genomics (PyGGi, see: http://pyggi.iitd.ac.in).
Introduction
Despite the discovery of over 200000 glass compositions, the knowledge of composition–property relationships remains restricted to a few selected compositions.1,2 Development of reliable composition–property maps for a large class of glass components is the bottleneck impeding the design of new glass compositions. Machine learning (ML) methods3–8 have been used to predict properties such as Young's modulus,9,10 liquidus temperature,11 solubility,12 glass transition temperature,4,13 dissolution kinetics,5,14–16 and other properties.17,18 Most of these works employ traditional glass compositions as descriptors, while some other works employ physics-based descriptors.14,19,20 A recent work developed deep learning models to predict composition–property maps of inorganic glasses with 37 input components and eight properties, largest thus far.21 However, most of these studies employ deterministic models in predictions such as neural networks (NN), random forest, or simple regression models. These models cannot provide any information about the reliability of the predictions for any new test data.
Since the ML methods are primarily data-driven predictions, the model's reliability is highly dependent on the available data. To this extent, Gaussian process regression (GPR),22 a nonparametric ML model, presents an excellent candidate. GPR employs a probabilistic approach which makes the inference on new data by learning the underlying distribution (mean and covariance) of the available data.22 Note that various problems in mechanics and materials science employ a probabilistic framework (including GPR and Bayesian inference) to estimate material parameters.9,23–27 It has been shown that for small datasets, GPR models are more suitable in comparison to NN models for providing accurate composition–property predictions along with its confidence intervals in oxide glasses.9 However, for large datasets available in materials science, training the conventional GPR, which has  time and
  space complexity for a dataset of size n, is computationally prohibitive.
Herein, using scalable GPR algorithms, namely, kernel interpolation for scalable structured Gaussian processes (KISS-GP)28 and massively scalable Gaussian processes (MSGP),29 we address the challenge of developing reliable GPR models for predicting nine relevant properties of functional glasses: density, Young's, shear, and bulk moduli, thermal expansion coefficient (TEC), Vickers’ hardness, refractive index, glass transition temperature (Tg), and liquidus temperature. The models are developed based on a large dataset with more than 100000 glasses and 37 components. These are the largest models developed to predict composition–property relationships in inorganic glasses. We show that KISS-GP, along with MSGP, provides rigorous models for large datasets superior to the state-of-the-art deep neural network (DNN) models.21 Further, the models provide estimates of the uncertainty associated with the predictions, making these models more reliable and robust compared to DNN models. Overall, we show that the methodology presented here can be used for developing GPR models for problems with large training datasets. Finally, the models developed here are made available as part of a software package designed for accelerating glass discovery, namely, Python for Glass Genomics (PyGGi, see: http://pyggi.iitd.ac.in).
Methodology
Dataset preparation
The raw dataset consisting of nine properties, namely, density, Young's modulus, bulk modulus, shear modulus, Vickers’ hardness, glass transition temperature, liquidus temperature, thermal expansion coefficient, and refractive index of inorganic glasses are obtained from the literature and commercial databases such as INTERGLAD Ver. 7. Here, we follow a rigorous dataset preparation employed earlier to develop deep learning models for glass property models.21 The steps involved in the methodology are as follows. (i) Remove duplicate entries from the raw dataset—the duplicate entries are first identified in terms of the input components. For the duplicate entries, the mean value of the output property is computed. If all the output values for a given composition with duplicate entries are within ±2.5%, the output is replaced with the mean value. Further, the points beyond ±2.5% are removed as an outlier. Similarly, the outliers in the extreme values are removed by considering the standard deviation of the properties. Specifically, data points lying beyond ±3σ are considered as outliers and removed. (ii) Check if the components add up to 100%—after removing the duplicates and outliers, check if all the compositions add up to 100% with respect to the input components. The components that do not add up are removed. (iii) Use LAR to select to reduce dimensionality—the raw dataset consists of glass compositions with approximately 270 components. However, many of these components out of the 270 are present in a few glass compositions only. Such a sparse dataset may lead to a poorly trained model, as enough representative samples may not be present in the training and test set. To overcome this challenge, we employ the least angle regression (LAR) for dimensionality reduction. In particular, the input parameters (that is, glass components) are chosen based on the dataset's covariance, thereby drastically reducing the glass components, while still preserving a proper training set for accurate predictions (see ESI† for details). (iv) Select the relevant components from LARS—after performing LAR, a threshold in terms of the number of components is chosen until which the model exhibits a notable increase in R2. The input components beyond the threshold are ignored. Further, the glass compositions having those input components are also removed. (v) Check if components add up to 100%—finally, recheck if the sum of the input components in each of the final compositions add up to 100%. Only those compositions, for which the sum adds up to 100 ± 0.1%, are selected. The final number of glasses consists of oxide components ranging from 32 to 37. The frequency of glasses corresponding to each of the components is provided in the ESI.† The final dataset consists of 37 components, namely, SiO2, B2O3, Al2O3, MgO, CaO, BaO, Li2O, Na2O, K2O, Ag2O, Cs2O, Ti2O, BeO, NiO, CuO, ZnO, CdO, PbO, Ga2O3, Y2O3, La2O3, Gd2O3, Bi2O3, TiO2, ZrO2, TeO2, P2O5, V2O5, Nb2O5, Ta2O5, MoO3, WO3, H2O, Sm2O3, MgF2, PbF2, and PbCl2, and nine properties, namely, density, Young's, shear, and bulk moduli, TEC, Vickers’ hardness, refractive index, Tg, and liquidus temperature.Gaussian process regression (GPR)
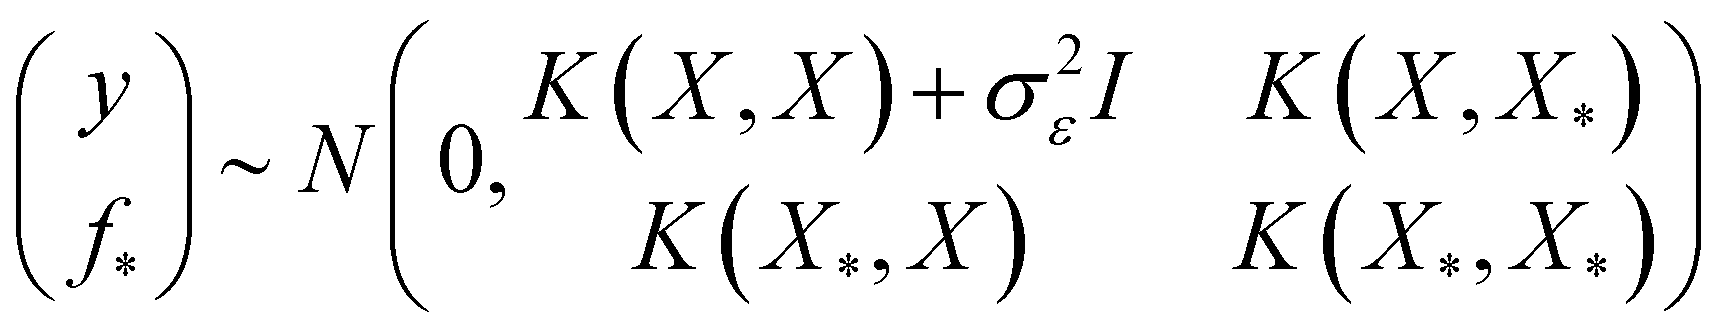
Gaussian processes (GPs) are models that are capable of modeling datasets in a probabilistic framework. The main advantages of GP models are: (i) its unique ability to model any complex data sets; (ii) estimate the uncertainty associated predictions through posterior variances computations. A GP is a joint distribution of any finite set of random variables that follow Gaussian distributions. As a result, the GPR modeling framework tries to ascribe a distribution over a given set of input (x) and output datasets (y).22 A mean function m(x) and a covariance function k(x,x′), the two degrees of freedoms that are needed to characterize a GPR fully, are as shown below.| y = f(x) +ε; where ε ∼ N(0, σε2), and f ∼ GP(m(x), k(x,x′)) | (1) |
| k(x, x′) = E[f(x) − m(x), f(x′) − m(x′)] | (2) |
In the GP literature, k(x,x′) is also termed as the kernel function of the GP. A widely used rationale for the selection of kernel function is that the correlation between any points decreases with an increase in the distance between them. Some popular kernels in the GP literature are
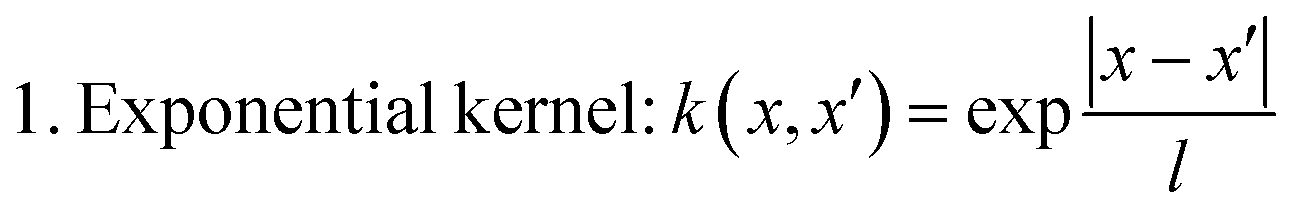 | (3) |
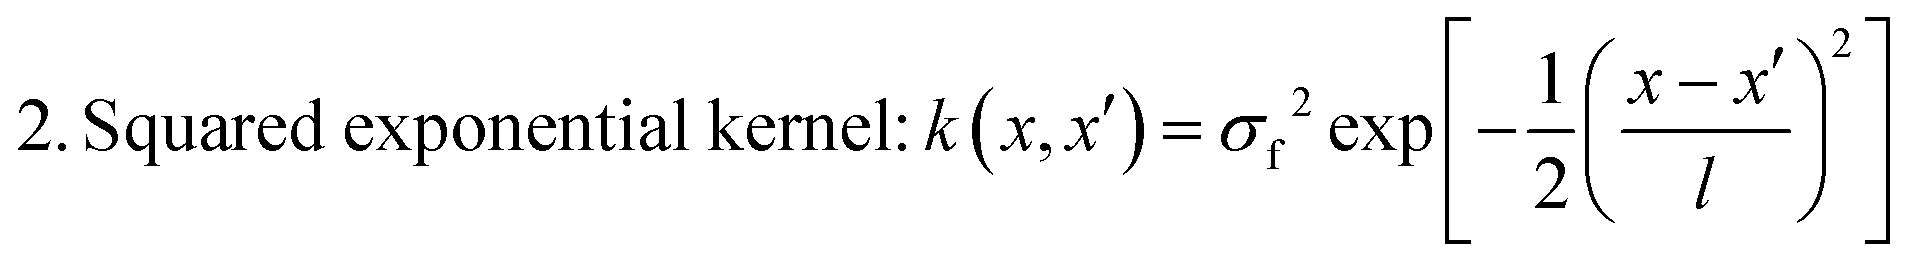 | (4) |
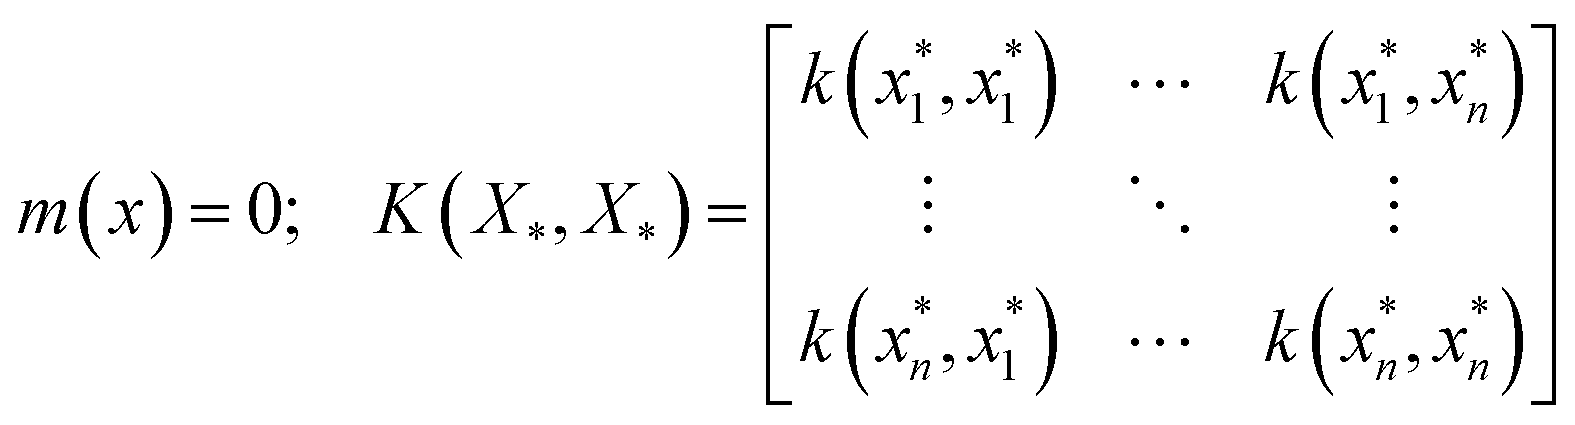
Suppose we have a set of test inputs X* for which we are interested in computing the output predictions. This would warrant sampling as a set of f* ≜ [f(x1*),…,f(xn*)], such that f* = N(0, K(X*, X*)) with the mean and covariance as
 | (5) |
By the definition of GP, the new and the previous outputs follow a joint Gaussian distribution as
 | (6) |
| Mean(f*) = K(X*,X)(K(X,X) + σε2I)−1y | (7) |
| Covariance(f*) = K(X*,X*) − K(X*,X)(K(X,X) + σε2I)−1K(X,X*) | (8) |
Eqn (7) and (8) are employed to make new predictions using the GPR. It should be noted that the experimental values itself may contain errors, which may not be normally distributed. For example, the errors in the liquidus temperature may predominantly be in one direction due to the kinetics involved with crystallization at temperatures below the liquidus temperature. The present model does not take into account such variations, and the noise in the experimental values is modeled as a normal distribution.
Kernel interpolation for scalable structured Gaussian processes (KISS-GP)
The kernel of GP implicitly depends on the kernel hyperparameters, such as the length-scale, signal variance, and noise variance (collectively denoted as θ), which are unknown and are inferred from the data. The fully Bayesian posterior inference of θ is non-trivial and often intractable. Hence, to avoid complexity, the standard practice is to obtain point estimates of θ by maximizing the marginal log-likelihood as| logp(y|θ)μ − [yT(Kθ + σ2I)−1y + log|Kθ + σ2I] | (9) |
However, evaluation of (Kθ + σ2I)−1y and Kθ + σ2I require O(n3) and O(n2) operations, respectively.
Approaches like the subset of regressors (SoR)30 and fully independent training conditional (FITC)31 are the traditional approaches that are used to scale the GP inference. Recently, Wilson et al.28 introduced a structured kernel interpolation (SKI) framework, which generalizes point estimate methods such as FITC and SoR for scalable GP inference. For instance, the kernel in the SoR approach, kSOR, is computed as
| kSOR(x,x′) = kxUKUU−1KUxT | (10) |
where, kxU (size 1 × n), KUU−1 (size m × m), KUxT (size n × 1)are covariance matrices generated from the exact kernel k(x,x′) for a set of m inducing points [u1,…,um]. Under the SKI framework, the exact kernel is replaced with an approximate kernel for fast computation by modifying kSOR considering kxU ≈ WKUU, where W is an n × m matrix of interpolation, which is too sparse. Therefore eqn (10) can be rewritten as
| kSOR(x,x′) ≈ KxUKUU−1KUxT ≫ WKUUKUU−1KUUWT = WKUUWT = KSKI | (11) |
This general approach to approximating GP kernel functions is the basic framework of SKI,40 which in turn reduces the computation expense considerably, up to O(n).
Massively scalable Gaussian process (MSGP)
While KISS-GP makes learning faster up to O(n), test predictions computational complexity is the same as in the traditional GP. Wilson et al.29 introduced MSGP, which extends KISS-GP to: (i) make test predictions significantly faster up to O(1), (ii) scale marginal likelihood evaluations without requiring any grid structure, and (iii) project input data to lower dimensional space to avoid the curse of dimensionality. In MSGP predictions, the predictive mean is computed as| Mean(f*) ≈ W*K(U,U)WT(K(X,X) + σε2I)−1y | (12) |
This is done by approximating K(X*,X) employing SKI as given by eqn (11).36 Here, we have to pay attention to the fact that the term K(U,U)WT(K(X,X) + σε2I)−1y is pre-computed during training reducing the cost of online computations to O(1). In similar lines, predictive covariance is computed as
| Covariance(f*) ≈ diag(K(X*,X*)) − diag({K(X*,X)(K(X,X) + σε2I)−1K(X,X*)}) | (13) |
The diagonal operator in eqn (13) is the consequence of the fact the kernel matrices are highly sparse in the non-diagonal directions. Covariance computations in eqn (13) can be further simplified utilizing SKI as follows
| Covariance(f*) ≈ diag(K(X*,X*)) − W*diag({K(U,X)(K(X,X) + σε2I)−1K(X,U)}) | (14) |
Here, the term diag(K(U,X)(K(X,X) +σε2I)−1K(X,U)) can also be pre-computed,36 leading to the overall computational cost of evaluating the predictions reducing to O(1).
Model training and hyperparametric optimization
The model training for GPR was carried out using the GPytorch32 python library. In order to train the GPR model, the dataset is 60:20:20 as training, validation, and test set. The test set was maintained as the holdout set and was used only at the end to test the model performance. Thus, the model selection was carried out using the training and validation set. Fivefold cross validation was employed for the training and validation set to avoid overfitting. Finally, for each of the folds, the GPR model was trained for 100 random states. Finally, the best GPR model was chosen after the cross-validation considering the following points: (i) training loss is minimum, (ii) training R2 should be comparable to validation R2. Further, hyperparametric optimization was carried out by varying (i) learning rate, (ii) weight decay, and (iii) considering various kernel functions. We observed that the radial basis functions provided the best predictions. Hence, this kernel function was implemented for all the properties.
Results and discussions
Fig. 1 shows the distribution of the nine properties in the processed dataset used for training the GPR models. We observe that all the properties in the dataset are distributed over a wide range, most of them spanning over an order of magnitude. Note that an exhaustive dataset cleaning and preparation were performed on the raw dataset (see Methods and ref. 21). Precisely, the final dataset consists of 37 components, namely, SiO2, B2O3, Al2O3, MgO, CaO, BaO, Li2O, Na2O, K2O, Ag2O, Cs2O, Ti2O, BeO, NiO, CuO, ZnO, CdO, PbO, Ga2O3, Y2O3, La2O3, Gd2O3, Bi2O3, TiO2, ZrO2, TeO2, P2O5, V2O5, Nb2O5, Ta2O5, MoO3, WO3, H2O, Sm2O3, MgF2, PbF2, and PbCl2, and nine properties, namely, density, Young's, shear, and bulk moduli, TEC, Vickers’ hardness, refractive index, Tg, and liquidus temperature. These represent the most extensive composition–property models developed in the glass science literature covering most of the human-made glass compositions.21 Further details on the dataset, including the distribution of the glass compositions with respect to number components and for each of the input components, are provided in the ESI† (see Fig. S1 and S2).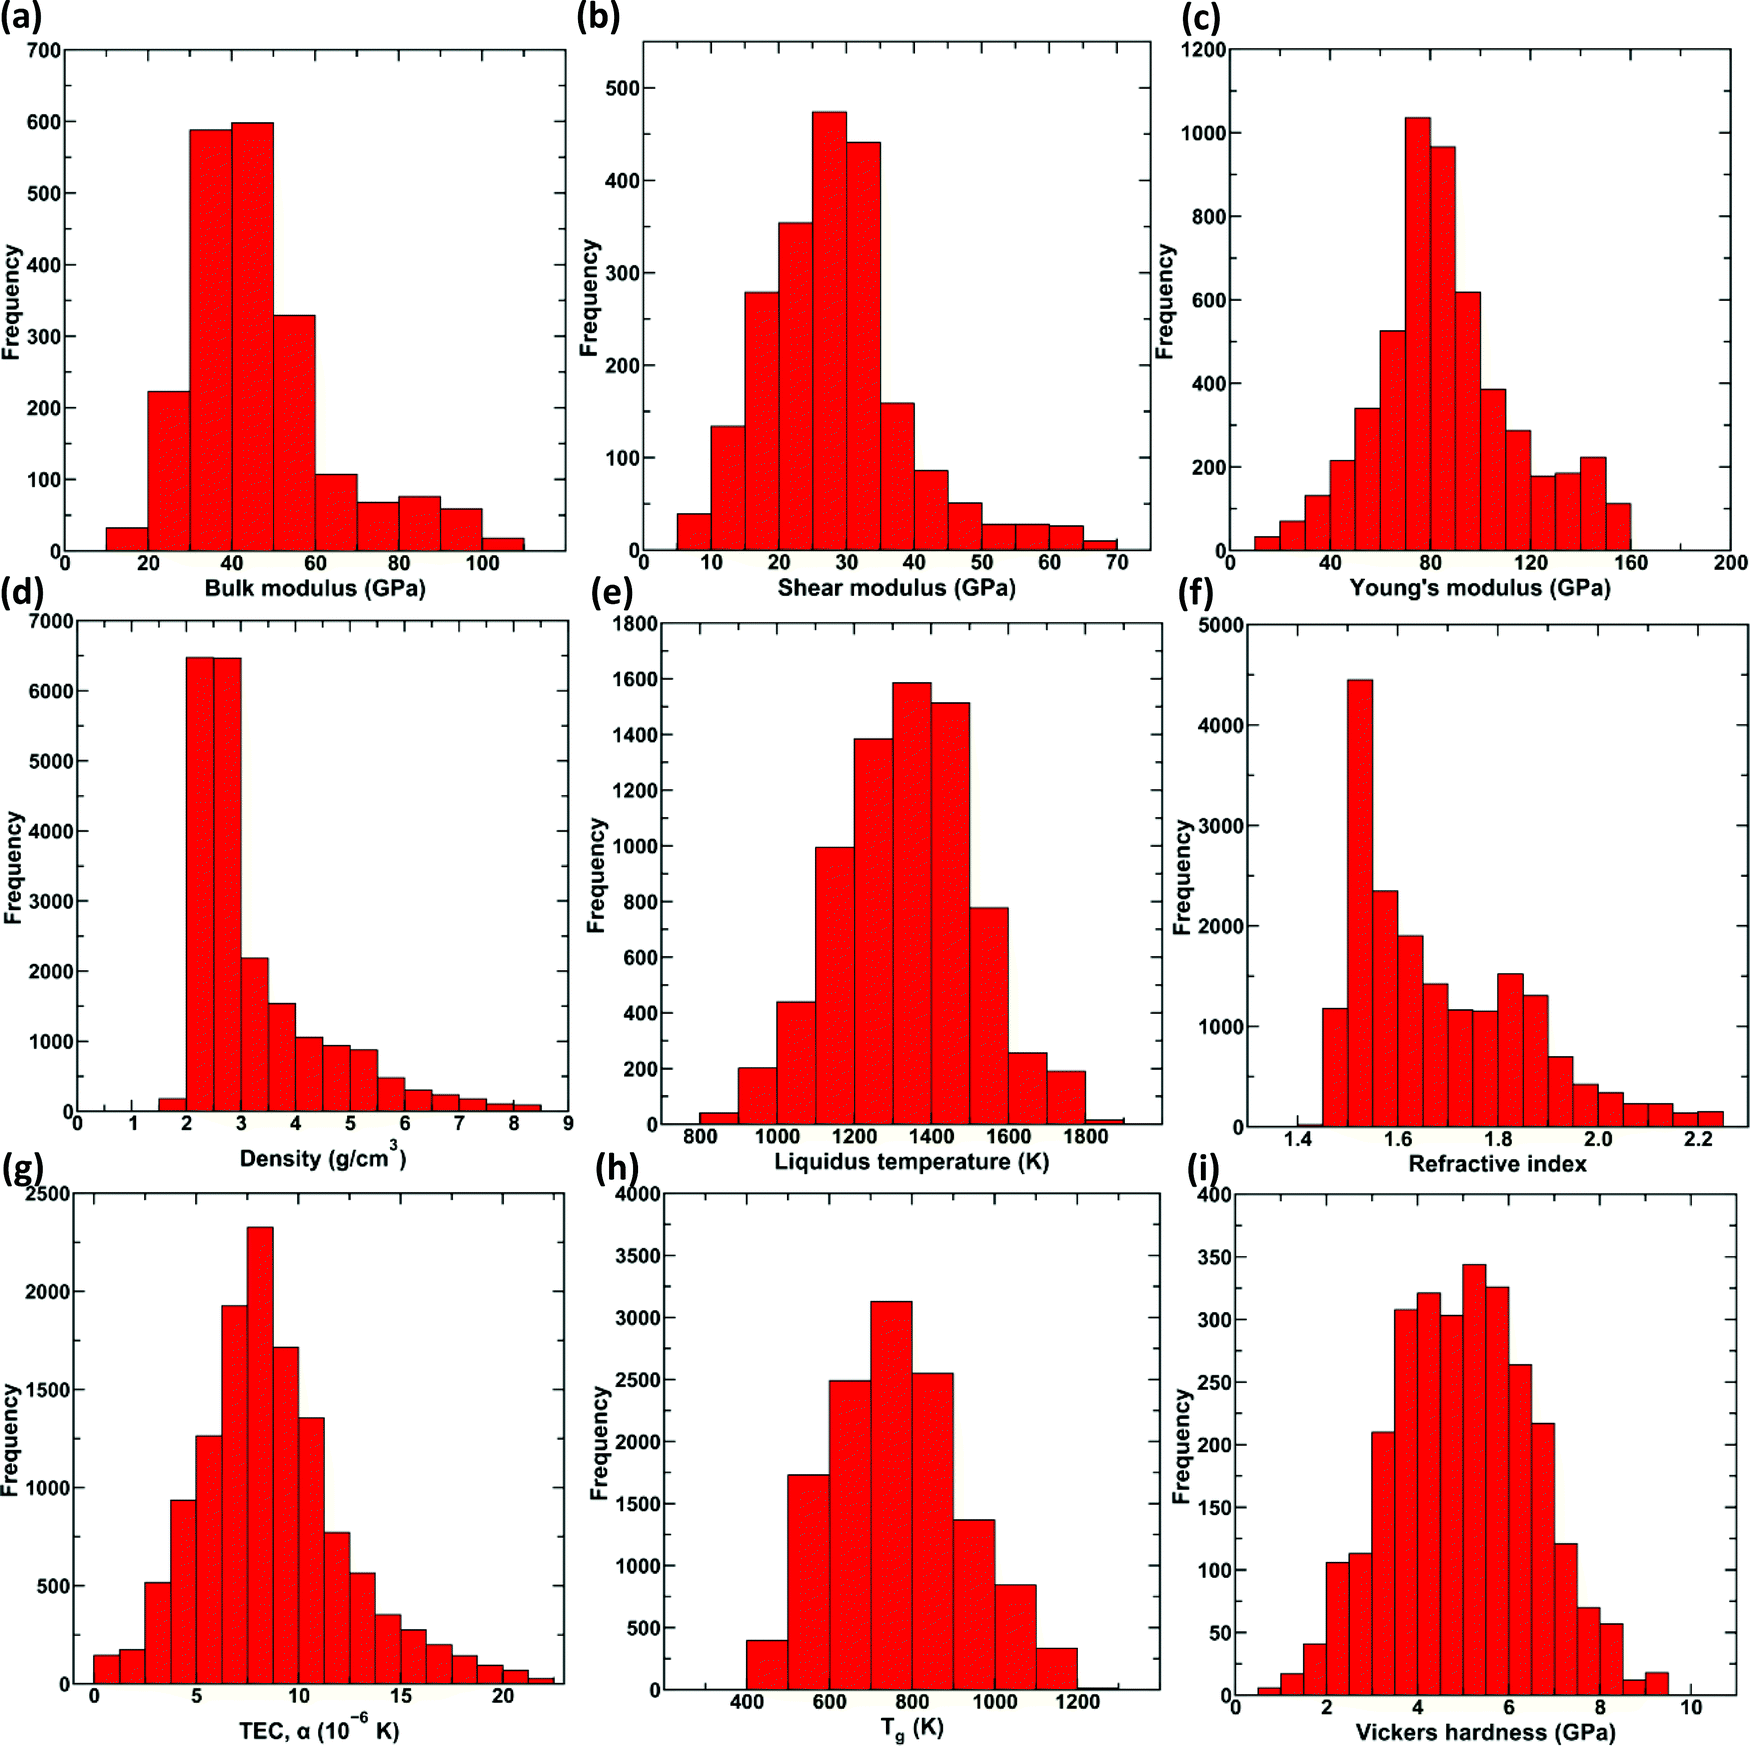 | ||
| Fig. 1 Dataset visualization. Distribution of the properties, namely, (a) bulk modulus, (b) shear modulus, (c) Young's modulus, (d) density, (e) liquidus temperature, (f) refractive index, (g) thermal expansion coefficient (TEC), (h) glass transition temperature (Tg) and (i) hardness, in the glass dataset used for training the GPR model. | ||
We train this dataset employing KISS-GP (see Methods) with hyperparametric tuning to develop optimized models. Note that we use KISS-GP28 with Lanczos variance estimates (LOVE),33 which significantly reduces the computational time and storage complexity (see Methods). Further, the prediction for high-dimensional data is carried out using MSGP. Due to the ![[scr O, script letter O]](https://www.rsc.org/images/entities/char_e52e.gif) (1) nature of MSGP,29 computational resources associated with the prediction are independent of the size of the data, thus enabling faster predictions (see Methods for details). Fig. 2 shows the predicted values of density, Young's, shear, and bulk moduli, TEC, Vickers’ hardness, refractive index, Tg, and liquidus temperature, in comparison to the measured experimental values for the trained GPR model with KISS-GP and MSGP. Since there are significant overlapping points, a heat map is used in Fig. 2, wherein the respective coloring scheme represents the number of points associated with each property per unit area. Note that only the test set is plotted in the figure, although the R2 values associated with the training and validation set is provided. The inset related to each property shows the probability density of error in the prediction with a confidence interval of 90%. We observe that the R2 values for all the properties are equal to or greater than 0.8, suggesting a well-trained model. Further, the R2 values of the training, validation, and test set are comparable, thereby confirming the goodness-of-fit of the model.
(1) nature of MSGP,29 computational resources associated with the prediction are independent of the size of the data, thus enabling faster predictions (see Methods for details). Fig. 2 shows the predicted values of density, Young's, shear, and bulk moduli, TEC, Vickers’ hardness, refractive index, Tg, and liquidus temperature, in comparison to the measured experimental values for the trained GPR model with KISS-GP and MSGP. Since there are significant overlapping points, a heat map is used in Fig. 2, wherein the respective coloring scheme represents the number of points associated with each property per unit area. Note that only the test set is plotted in the figure, although the R2 values associated with the training and validation set is provided. The inset related to each property shows the probability density of error in the prediction with a confidence interval of 90%. We observe that the R2 values for all the properties are equal to or greater than 0.8, suggesting a well-trained model. Further, the R2 values of the training, validation, and test set are comparable, thereby confirming the goodness-of-fit of the model.
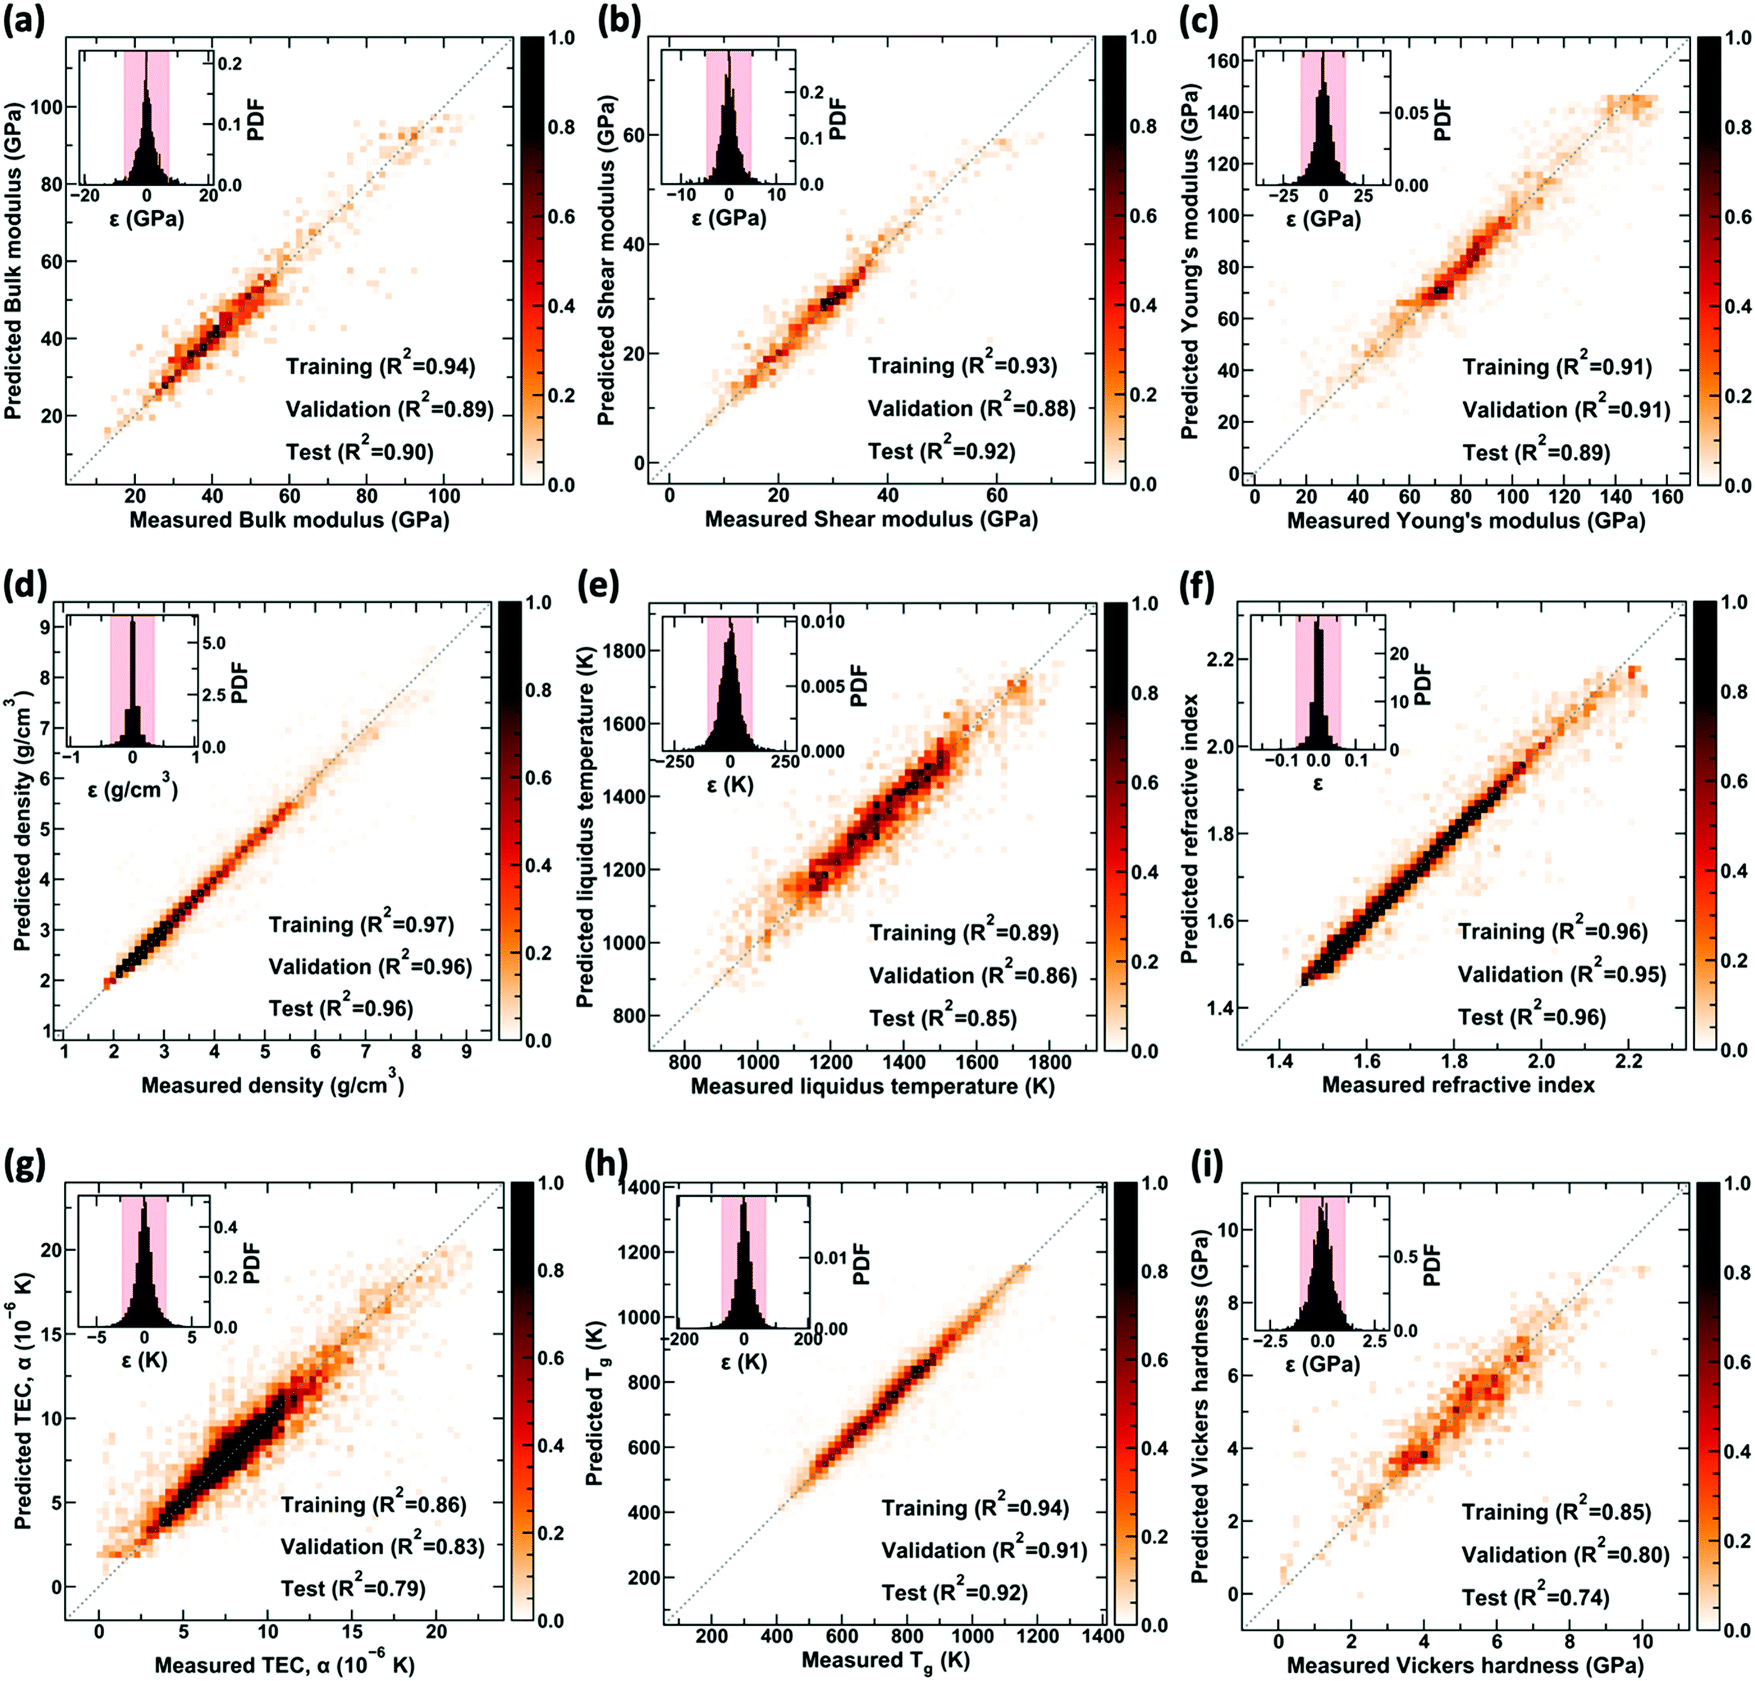 | ||
| Fig. 2 KISS-GP models for the prediction of properties. Predicted values of (a) bulk modulus, (b) shear modulus, (c) Young's modulus, (d) density, (e) liquidus temperature, (f) refractive index, (g) thermal expansion coefficient (TEC), (h) glass transition temperature (Tg) and (i) hardness using GPR with respect to the experimental values. Due to a large number of overlapping points, the color scheme is used to represent the number of points per unit area associated with each. INSET shows the error in the predicted values as a probability density function (PDF) with the shaded region representing the 90% confidence interval. Training, validation, and test R2 values are also provided separately. | ||
Now, we demonstrate the key attractive features of the proposed GPR-based approach to provide the uncertainty associated with the prediction. First, we analyze standard deviation predicted by KISS-GP for the test dataset, that is, the dataset unseen by the model. Fig. 3 shows the histogram of the absolute values of standard deviations |σ| corresponding to the predictions for compositions in the test dataset. Note that the |σ| mentioned here is the standard deviation predicted by the KISS-GP and not the error in the predictions. This procedure is repeated for all the nine properties considered. We observe that the distribution is unimodal, with a peak closer to zero in most of the cases, which suggests that the models are reasonable with the predictions for most of the data points in the test set exhibiting high confidence. We also observe that the distribution for some properties is notably broader than others—for example, shear modulus, Young's modulus, liquidus temperature, and hardness. Specifically, hardness exhibits the maximum standard deviation among all the properties suggesting lower reliability in the predictions. Such decreased reliability for hardness could be attributed to the spread in the dataset and also to the nature of the property itself. Unlike other properties such as Young's modulus, hardness is not a material property and depends highly on measurement techniques and conditions used.34–36 Thus, the final hardness model developed on the dataset with higher noise exhibits a larger standard deviation.
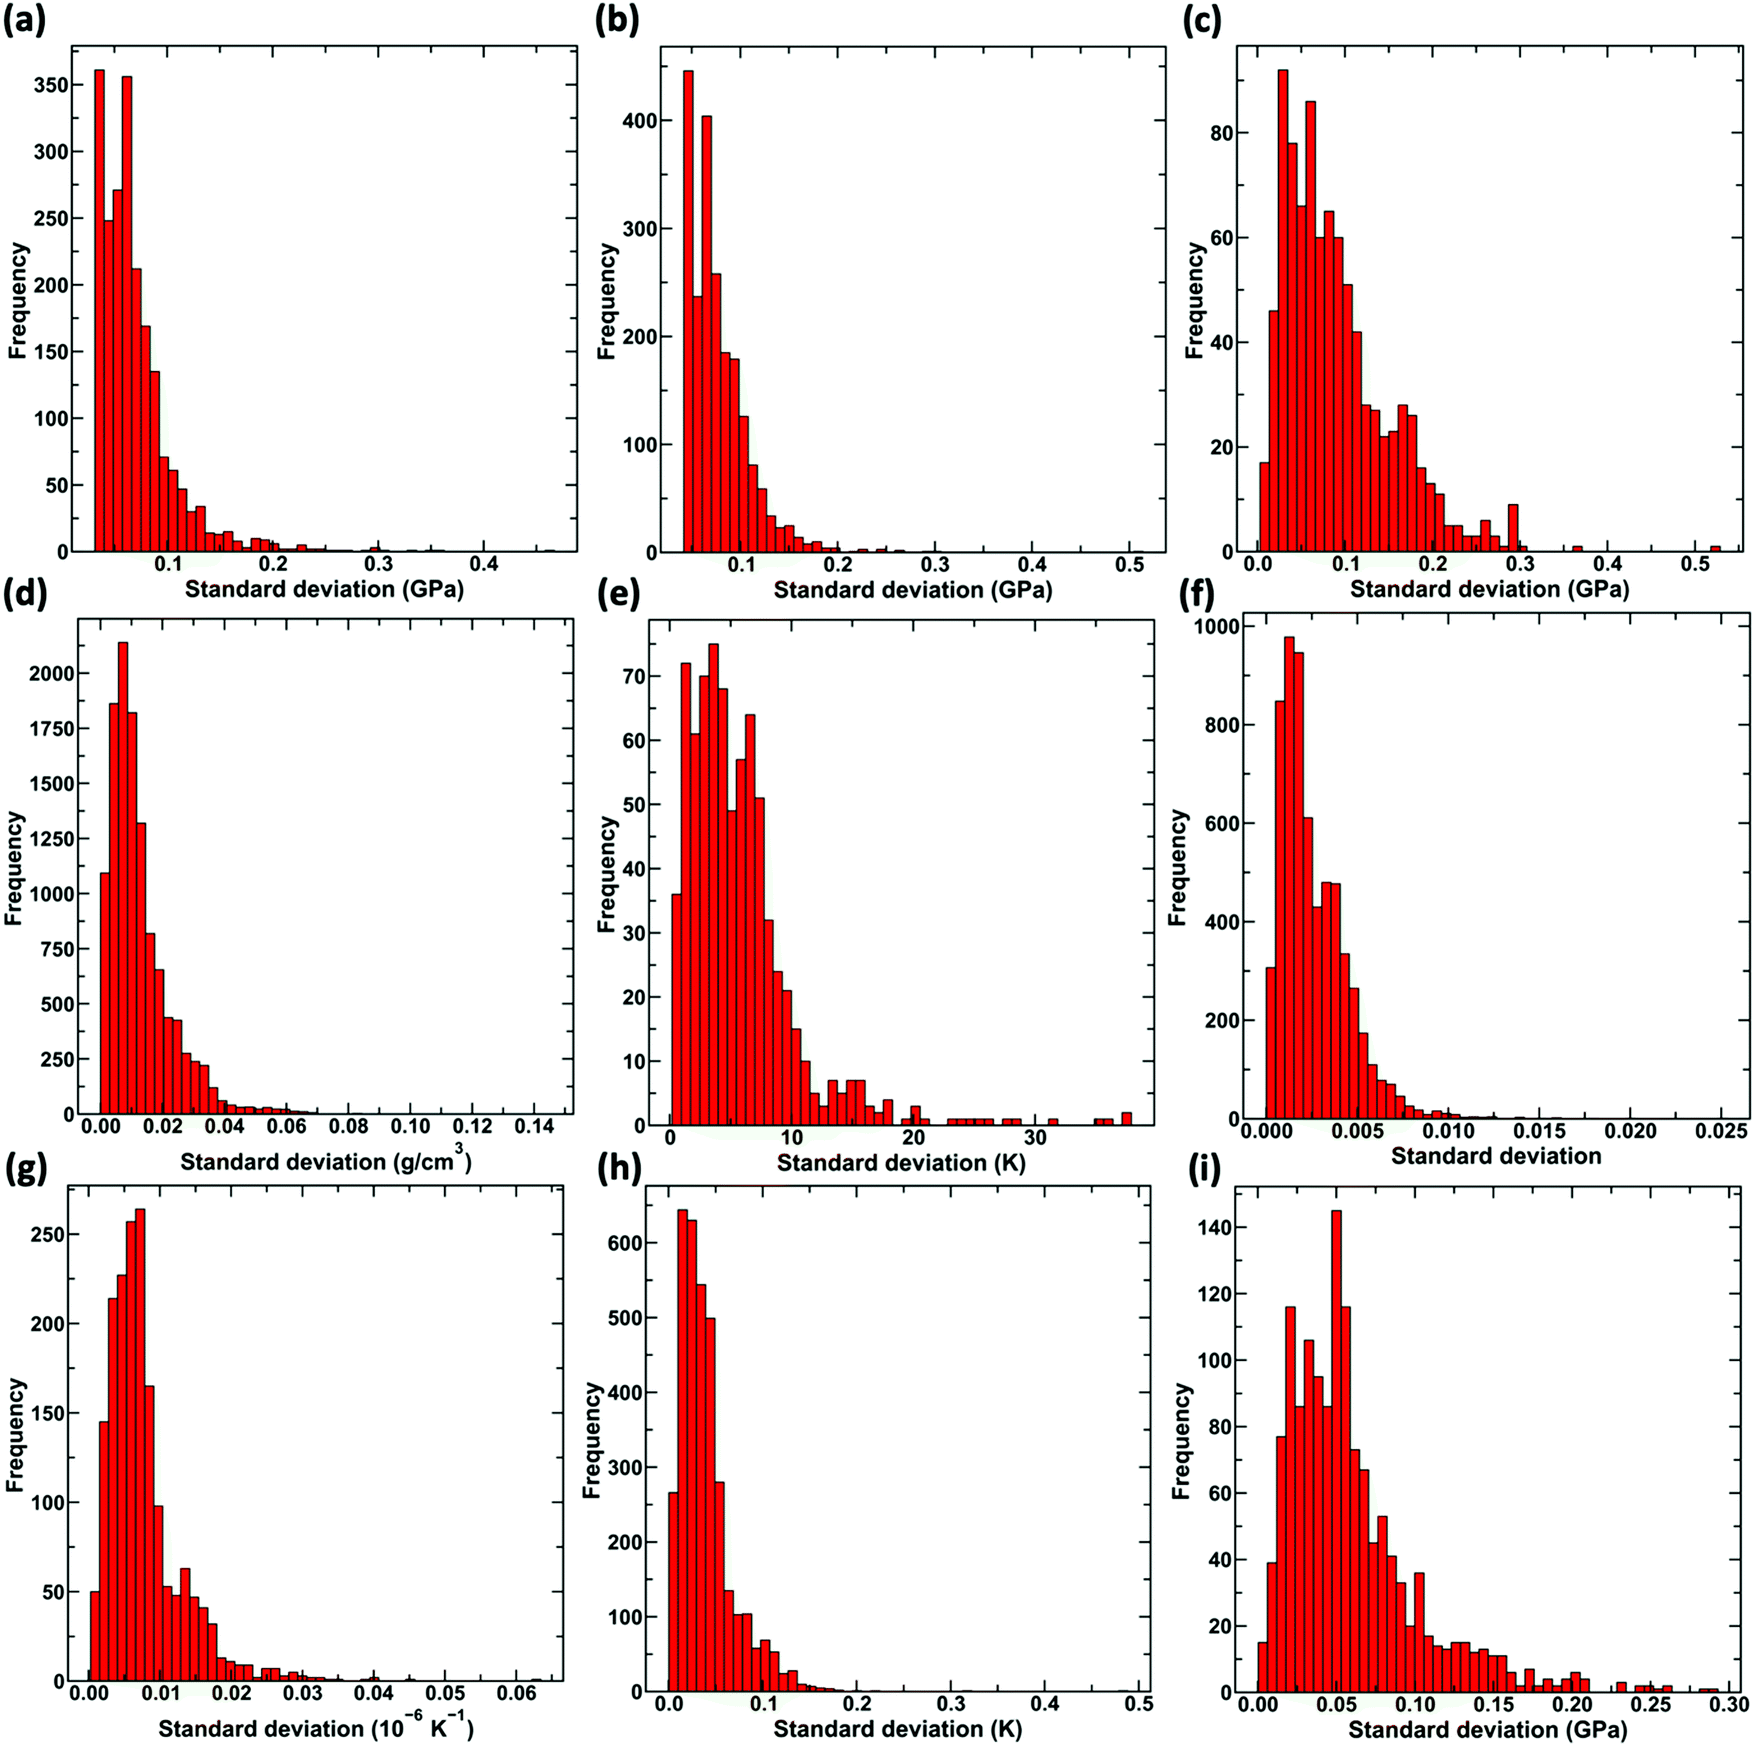 | ||
| Fig. 3 Histogram of the absolute value of standard deviations for the predictions on the test dataset by KISS-GP for (a) bulk modulus, (b) shear modulus, (c) Young's modulus, (d) density, (e) liquidus temperature, (f) refractive index, (g) thermal expansion coefficient (TEC), (h) glass transition temperature (Tg) and (i) hardness. | ||
Second, we analyze the contribution of each of the input components in the glass composition toward the standard deviation in the prediction. To this extent, we select the glass compositions having non-zero value for a given component in the test dataset. For the selected compositions having the given component, the standard deviations associated with the KISS-GP predictions are computed. Then, the mean value of the standard deviations obtained for all the predictions is computed for a given component. For example, to compute the mean standard deviation associated with SiO2 for Young's modulus, all the glass compositions having non-zero SiO2 values are selected from Young's modulus dataset. Then, the standard deviation associated with the KISS-GP predictions for each of the compositions is computed. The mean value of the standard deviations thus obtained provides the mean standard deviation associated with SiO2 for Young's modulus. The procedure is repeated for all 37 components and nine properties.
Fig. 4 shows the mean value of the standard deviation for the predictions of Young's modulus corresponding to each of the input components considered. We observe that there is a direct correlation between the mean standard deviation and the frequency of components in the dataset. Specifically, components exhibiting high values of standard deviations are the ones that have very few data points (see Fig. S1 in the ESI†). On the contrary, the components that are present in many glasses, such as SiO2, Na2O, Al2O3, and CaO, to name a few, exhibit low standard deviation and spread in the prediction (see Fig. S1 in the ESI†). Similar behavior is observed for other properties as well (see Fig. S4 in the ESI†). This observation is in agreement with the fact that the training for a particular input component improves if there is enough data associated with that particular component. Overall, the results suggest that the predictions for components that are present in a larger number of glasses are more reliable and vice versa. As such, the performance of the model could be improved by increasing the number of glasses corresponding to those components for which the data is at present sparse. Note that the model doesn’t exhibit any trend in terms of the accuracy of predictions with respect to the number of components in the glass (see ESI†). That is, whether a glass consists of two components or ten components, the predictive accuracy of model is comparable.
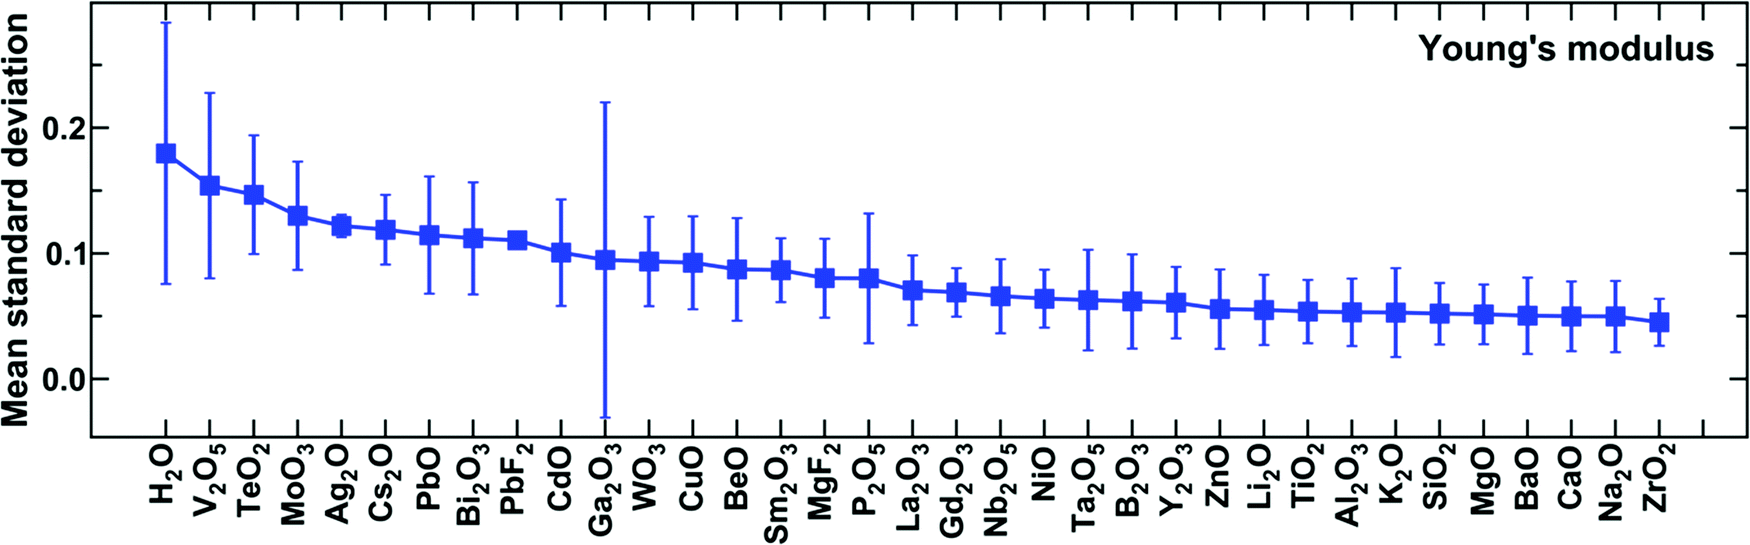 | ||
| Fig. 4 Mean standard deviation in the predictions of Young's modulus for each of the components present in the glass compositions. | ||
Finally, to check whether the model can capture the underlying physics, we focus on a binary sodium borate (NB) glass series, that is, (Na2O)x·(B2O3)1−x. This glass series exhibit the well-known boron anomaly,34,37–39 wherein the properties exhibit a highly non-monotonic variation owing to the variable coordination of boron (three to four) with increasing sodium content. Specifically, most of the glass properties exhibit an inflection for sodium content varying from 30% to 50%. Fig. 5 shows the nine properties predicted for the binary NB glass with the 2σ and 3σ confidence intervals, along with the experimental values. First of all, we observe that the predictions exhibit a close match with the experimental values for all the properties. Second, we observe that the model exhibits a significantly lower standard deviation for the domain where experimental data exist and a high standard deviation for the regions where data is not available. This suggests that the model exhibits increased reliability for interpolation, while confidence decreases for extrapolation. Third, and most interestingly, we observe that the model can capture the boron anomaly for all the properties. Precisely, even for properties such as shear modulus, Young's modulus, refractive index, and hardness, which have few points beyond the model, can capture the non-monotonic behavior associated with the boron anomaly in agreement with the theoretical models.
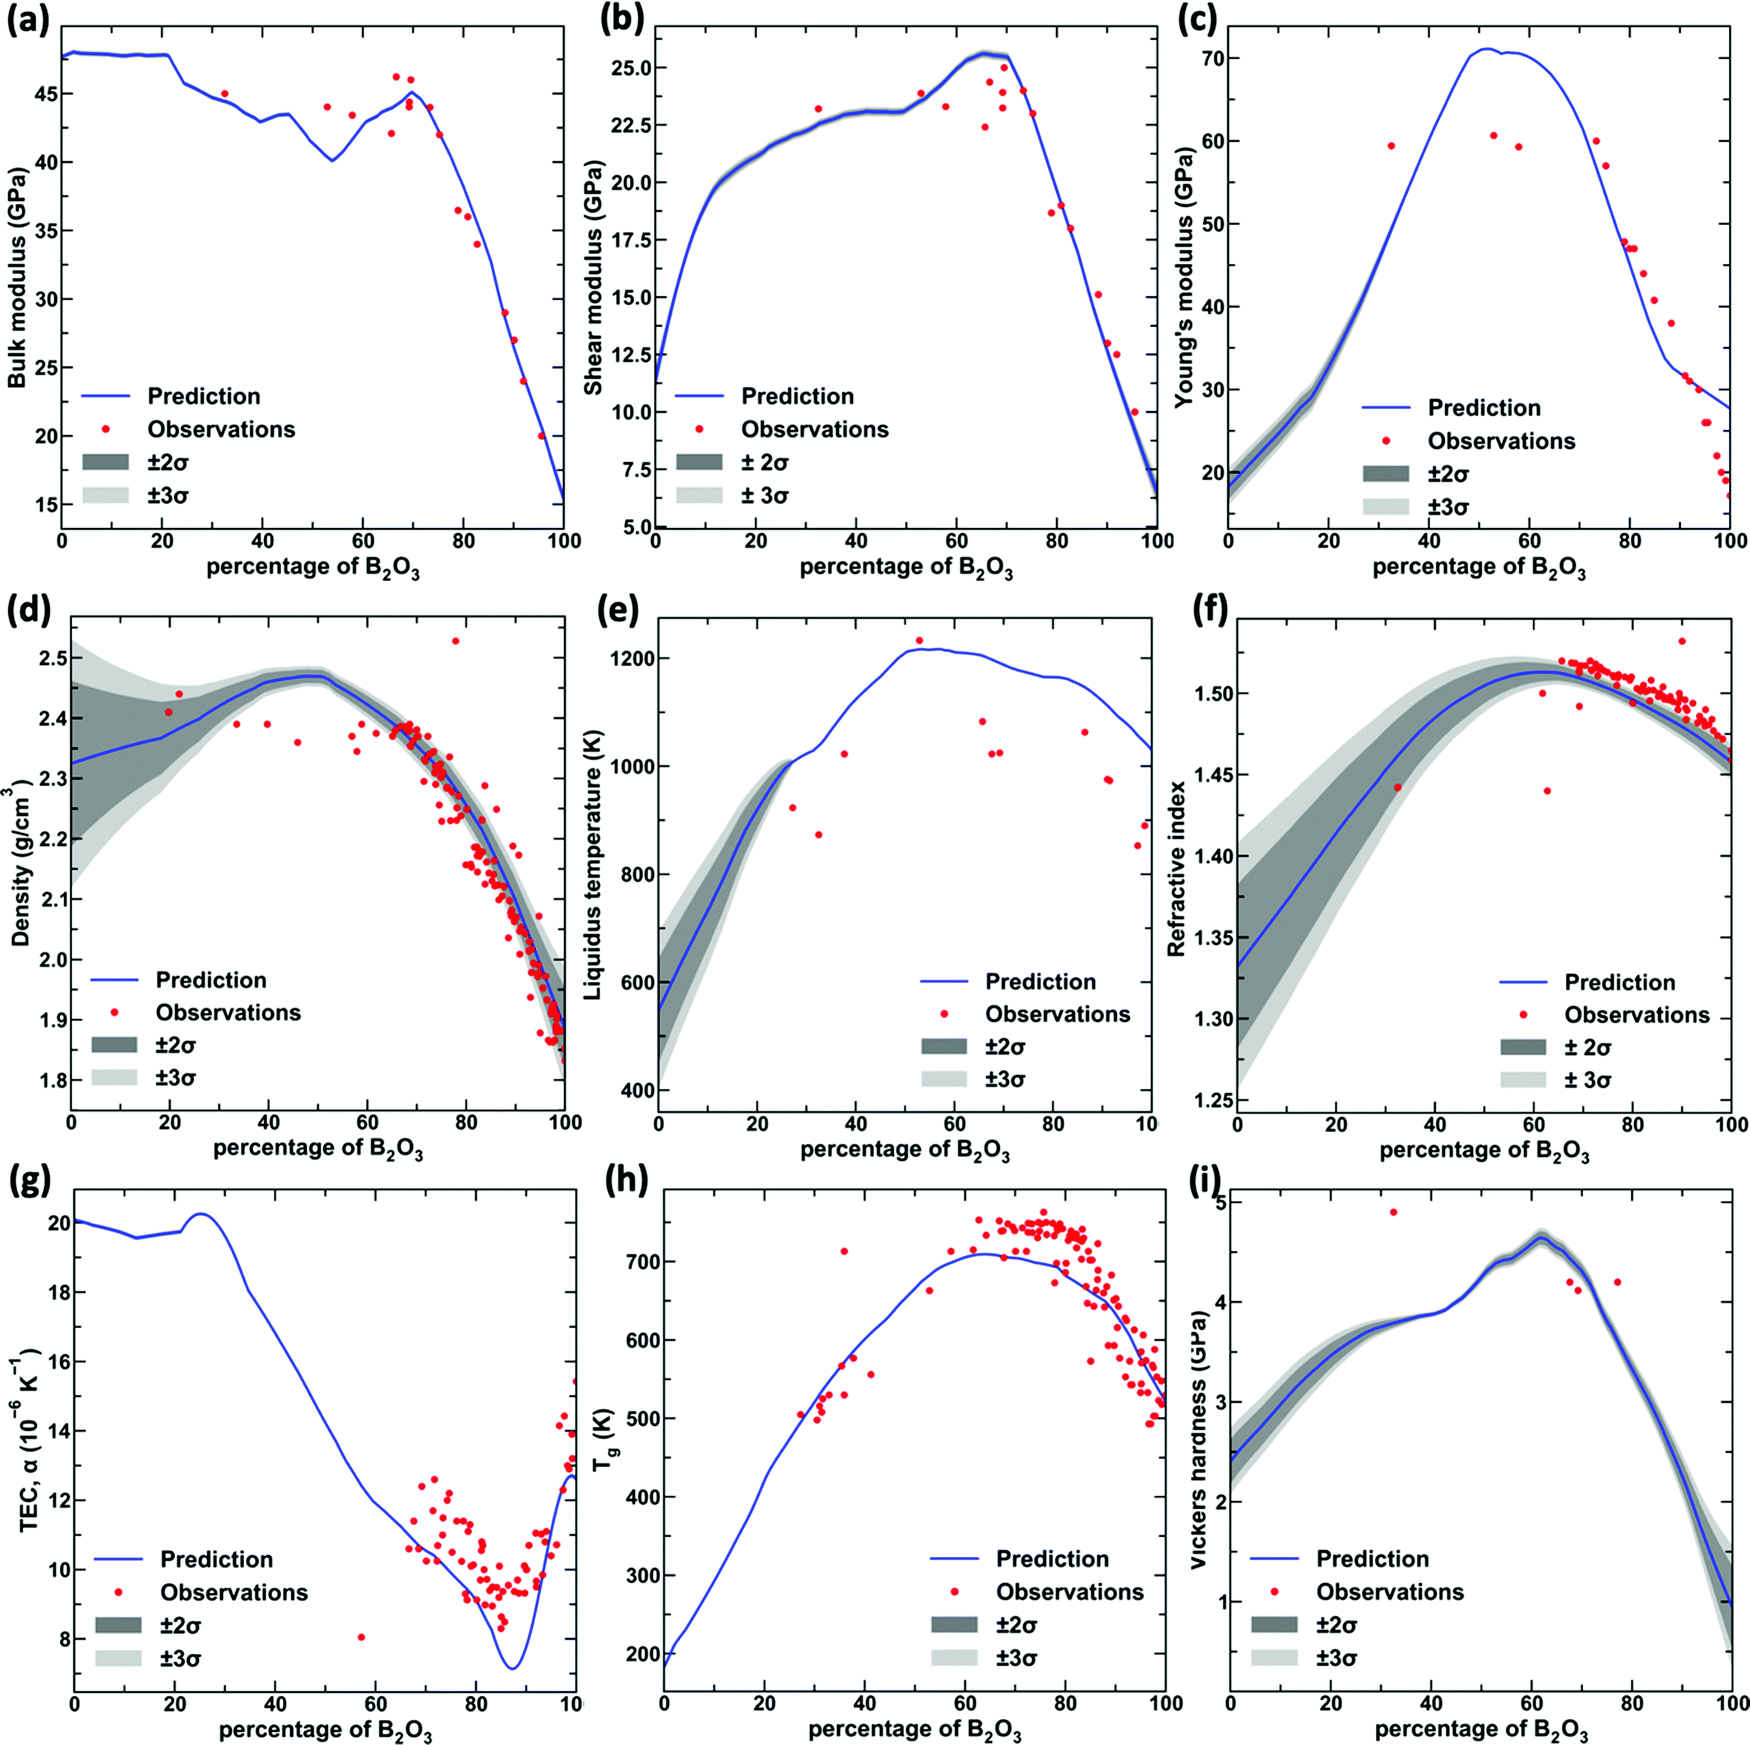 | ||
| Fig. 5 Standard deviation with increasing boron percentage in sodium borate glasses of (a) bulk modulus, (b) shear modulus, (c) Young's modulus, (d) density, (e) liquidus temperature, (f) refractive index, (g) thermal expansion coefficient (TEC), (h) glass transition temperature (Tg) and (i) hardness. | ||
To test the generality, we choose a ternary glass composition of sodium borosilicate, x(Na2O)·y(B2O3)·1 − x − y(SiO2). Fig. 6 shows the standard deviation of predicted values for the entire range of the ternary using the trained KISS-GP model. The mean values of the properties representing the best estimate of the model for this ternary are provided in the ESI.† The compositions corresponding to the measured values in the original data (which may belong to training, validation, or test set) are marked using the black squares. We observe that the standard deviation in the predictions of compositions close to the original dataset is significantly low. As the compositions are farther away from the original dataset, the standard deviation of the predicted value increases. This behavior is consistently observed for all the properties (see Fig. 6). This is because, in KISS-GP, the training is carried out by identifying the distribution that reduces the variance for a known data point (that is, training data) to zero or at least very close to it. As such, when the model is extrapolated to domains without any training data, the inference becomes poor as represented by larger standard deviation values. Nevertheless, we observe that the standard deviation for most of the properties is relatively low, confirming high confidence in the values predicted by the model. Overall, we observe that KISS-GP allows the development of reliable composition–property models, quantifying uncertainty in predictions when extrapolated over the entire compositional space.
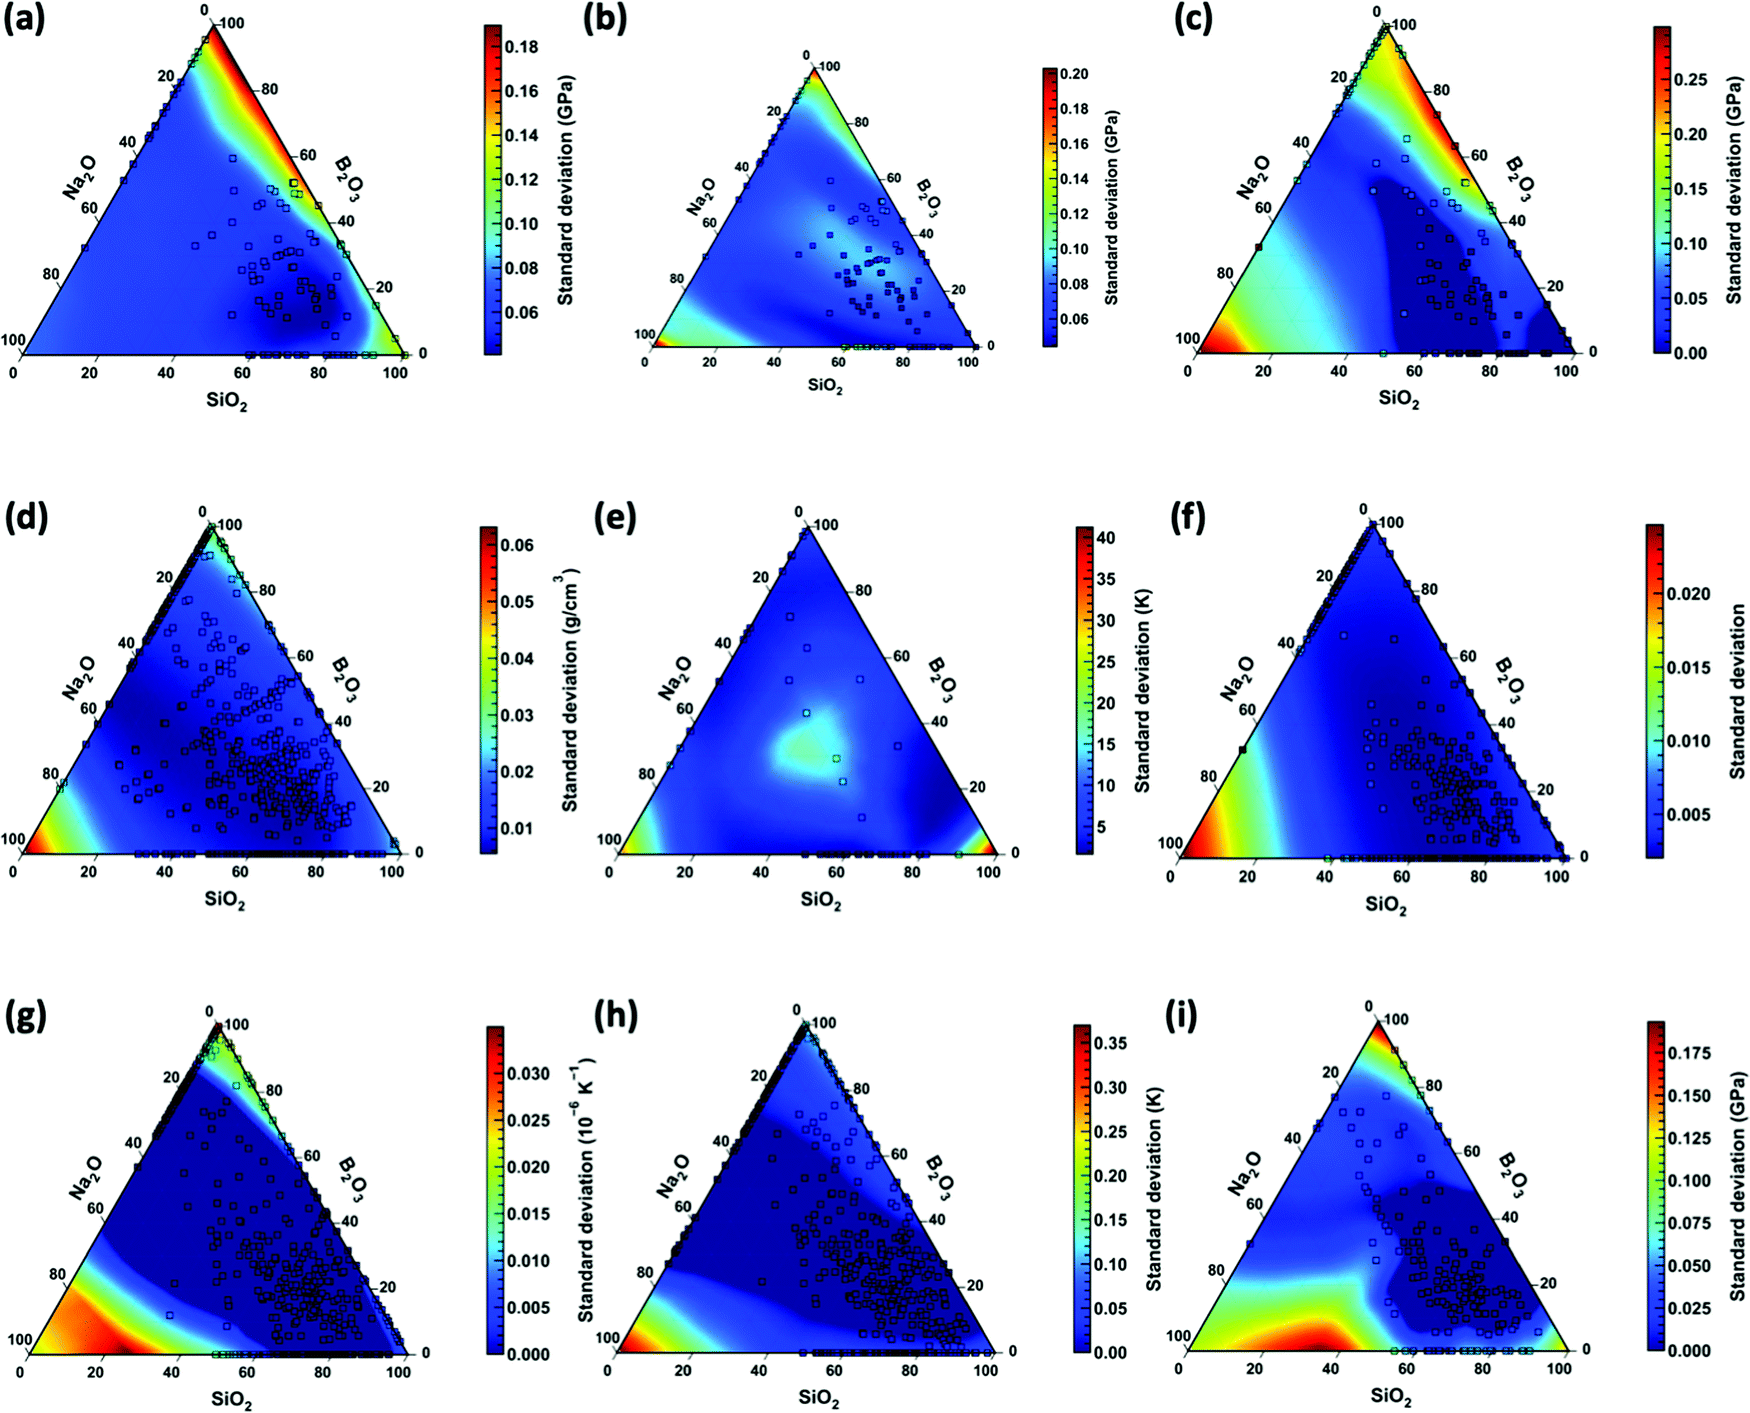 | ||
| Fig. 6 The standard deviation for predicted values using KISS-GP. Standard deviation predicted by the trained GPR models of (a) bulk modulus, (b) shear modulus, (c) Young's modulus, (d) density, (e) liquidus temperature, (f) refractive index, (g) thermal expansion coefficient (TEC), (h) glass transition temperature (Tg) and (i) hardness for sodium borosilicate glasses. Experimental compositions are marked using black squares. | ||
Now, we compare the performance of the GPR models with some of the state-of-the-art ML models.21Table 1 shows the R2 values of KISS-GP in comparison to linear regression, XGBoost, and DNN (see ref. 21 for details) on the test dataset. Note that the dataset used for training all the models are the same.21 Further, only the test dataset R2 values are shown to have a fair comparison of the models on the unseen dataset. In terms of the R2 values of the overall dataset, GP performs better than all other methods. We observe that for seven out of nine properties, KISS-GP outperforms all other methods, including DNN, in terms of the R2 values of test data. The increase in the R2 for some of these properties ranges from 3–5%, for example, liquidus temperature, Young's modulus, shear modulus, which is a notable increase in the accuracy. These results confirm that the predictions obtained from KISS-GP and MSGP are reliable and superior to other state-of-the-art methods, as presented in Table 1. Besides, the uncertainty quantification in KISS-GP and MSGP-based property predictions is quite useful to interpret the model validity in experimentally unexplored regimes of the compositional space. This feature is severely lacking in the other deterministic models. At this point, it should be noted that although KISS-GP is able to capture the mean values of the function correctly, the prediction of the standard deviation is highly sensitive to the training process. This could be attributed to the deep kernel layer (DKL) present in the KISS-GP framework, which reduces the dimensionality of the input feature while training the model. This is a disadvantage associated with the KISS-GP in comparison to the classical GP, which can be addressed to a reasonable extent by hyperparametric optimization of the DKL and early stopping.
| Property | Linear regression | XGBoost | DNN | KISS-GP |
|---|---|---|---|---|
| Bulk modulus | 0.75 | 0.87 | 0.89 | 0.90 |
| Shear modulus | 0.77 | 0.86 | 0.88 | 0.91 |
| Young's modulus | 0.78 | 0.84 | 0.86 | 0.89 |
| Density | 0.92 | 0.95 | 0.95 | 0.96 |
| Liquidus temperature | 0.60 | 0.79 | 0.80 | 0.85 |
| Refractive index | 0.92 | 0.94 | 0.94 | 0.96 |
| Thermal expansion coefficient | 0.67 | 0.78 | 0.80 | 0.79 |
| Glass transition temperature | 0.79 | 0.88 | 0.90 | 0.92 |
| Hardness | 0.62 | 0.77 | 0.80 | 0.74 |
Conclusions
Altogether, employing KISS-GP and MSGP, we show that reliable composition–property models can be developed for large datasets. These models for predicting density, Young's, shear, and bulk moduli, TEC, Vickers’ hardness, refractive index, Tg, and liquidus temperature of inorganic glasses with up to 37 input components, the largest so far, allows the exploration of a broad compositional space that was hitherto unknown. In addition, the KISS-GP models are able to capture the uncertainty associated with the predictions when extrapolated beyond the training data. Further, the KISS-GP models yield superior results when compared against state-of-the-art methods such as XGBoost or DNN models. We show the KISS-GP models are able to capture the underlying physics without any explicit training, even for glass compositions and properties with sparse data. Thus, the overall contribution of the work is as follows: (i) development of reliable composition–property models for nine glass properties, (ii) quantifying uncertainty in prediction by employing scalable Gaussian process on a large glass dataset, and finally, (iii) making the models available for the glass community for accelerating glass design. The generic approach presented here can be applied for developing composition–property relationships of a wide range of materials involving extensive data with detailed uncertainty quantifications. The models developed here have been made available as part of a package, Python for Glass Genomics (PyGGi, see: http://pyggi.iitd.ac.in).40Data availability
The data that support the findings of this study are available from the corresponding authors upon reasonable request.Code availability
All the codes used in the present work are available in the GitHub page: https://github.com/m3rg-repo/machine_learning_glass/tree/master/Scalable_Gaussian_Process.Conflicts of interest
There are no conflicts to declare.Acknowledgements
NMAK acknowledges the financial support for this research provided by the Department of Science and Technology, India, under the INSPIRE faculty scheme (DST/INSPIRE/04/2016/002774) and DST SERB Early Career Award (ECR/2018/002228). The authors thank the IIT Delhi HPC facility for providing the computational and storage resources.References
- A. Makishima and J. D. Mackenzie, J. Non-Cryst. Solids, 1973, 12, 35–45 CrossRef CAS.
- C. J. Wilkinson, Q. Zheng, L. Huang and J. C. Mauro, J. Non-Cryst. Solids: X, 2019, 2, 100019 Search PubMed.
- J. C. Mauro, A. Tandia, K. D. Vargheese, Y. Z. Mauro and M. M. Smedskjaer, Chem. Mater., 2016, 28, 4267–4277 CrossRef CAS.
- D. R. Cassar, A. C. P. L. F. de Carvalho and E. D. Zanotto, Acta Mater., 2018, 159, 249–256 CrossRef CAS.
- N. M. A. Krishnan, S. Mangalathu, M. M. Smedskjaer, A. Tandia, H. Burton and M. Bauchy, J. Non-Cryst. Solids, 2018, 487, 37–45 CrossRef.
- L. Bassman, P. Rajak, R. K. Kalia, A. Nakano, F. Sha, J. Sun, D. J. Singh, M. Aykol, P. Huck, K. Persson and P. Vashishta, npj Comput. Mater., 2018, 4, 74 CrossRef.
- A. M. Gopakumar, P. V. Balachandran, D. Xue, J. E. Gubernatis and T. Lookman, Sci. Rep., 2018, 8, 3738 CrossRef.
- G. X. Gu, C.-T. Chen and M. J. Buehler, Extreme Mech. Lett., 2018, 18, 19–28 CrossRef.
- S. Bishnoi, S. Singh, R. Ravinder, M. Bauchy, N. N. Gosvami, H. Kodamana and N. M. A. Krishnan, J. Non-Cryst. Solids, 2019, 524, 119643 CrossRef CAS.
- K. Yang, X. Xu, B. Yang, B. Cook, H. Ramos, N. M. A. Krishnan, M. M. Smedskjaer, C. Hoover and M. Bauchy, Sci. Rep., 2019, 9, 8739 CrossRef.
- J. C. Mauro, A. Tandia, K. D. Vargheese, Y. Z. Mauro and M. M. Smedskjaer, Chem. Mater., 2016, 28, 4267–4277 CrossRef CAS.
- D. S. Brauer, C. Rüssel and J. Kraft, J. Non-Cryst. Solids, 2007, 353, 263–270 CrossRef CAS.
- E. Alcobaça, S. M. Mastelini, T. Botari, B. A. Pimentel, D. R. Cassar, A. C. P. de, L. F. de Carvalho and E. D. Zanotto, Acta Mater., 2020, 188, 92–100 CrossRef.
- H. Liu, T. Zhang, N. M. Anoop Krishnan, M. M. Smedskjaer, J. V. Ryan, S. Gin and M. Bauchy, npj Mater. Degrad., 2019, 3, 32 CrossRef.
- T. Han, N. Stone-Weiss, J. Huang, A. Goel and A. Kumar, Acta Biomater., 2020, 107, 286–298 CrossRef CAS.
- J. N. P. Lillington, T. L. Goût, M. T. Harrison and I. Farnan, J. Non-Cryst. Solids, 2020, 533, 119852 CrossRef CAS.
- X. Lu, L. Deng, J. Du and J. D. Vienna, J. Non-Cryst. Solids, 2020, 120490 CrossRef.
- M. Montazerian, E. D. Zanotto and J. C. Mauro, Int. Mater. Rev., 2020, 65, 297–321 CrossRef CAS.
- Y.-J. Hu, G. Zhao, M. Zhang, B. Bin, T. D. Rose, Q. Zhao, Q. Zu, Y. Chen, X. Sun, M. de Jong and L. Qi, npj Comput. Mater., 2020, 6, 1–13 CrossRef.
- X. Lu, L. Deng, S. Gin and J. Du, J. Phys. Chem. B, 2019, 123, 1412–1422 CrossRef CAS.
- R. Ravinder, K. H. Sridhara, S. Bishnoi, H. S. Grover, M. Bauchy, Jayadeva, H. Kodamana and N. M. A. Krishnan, Mater. Horiz., 2020, 7(7), 1819–1827 RSC.
- C. E. Rasmussen, in Advanced Lectures on Machine Learning: ML Summer Schools 2003, Canberra, Australia, February 2–14, 2003, Tübingen, Germany, August 4–16, 2003, Revised Lectures, ed. O. Bousquet, U. von Luxburg and G. Rätsch, Springer Berlin Heidelberg, Berlin, Heidelberg, 2004, pp. 63–71 Search PubMed.
- H. Rappel, L. A. A. Beex, L. Noels and S. P. A. Bordas, Probabilistic Eng. Mech., 2019, 55, 28–41 CrossRef.
- H. Rappel and L. A. A. Beex, Eur. J. Mech. – A Solids, 2019, 75, 169–196 CrossRef.
- H. Rappel, L. A. A. Beex and S. P. A. Bordas, Mech. Time-Depend. Mater., 2018, 22, 221–258 CrossRef.
- P. Hauseux, J. S. Hale, S. Cotin and S. P. A. Bordas, Appl. Math. Models, 2018, 62, 86–102 CrossRef.
- A. Tewari, S. Dixit, N. Sahni and S. P. A. Bordas, Data-Centric Eng., 2020, 1, e8 CrossRef.
- A. Wilson and H. Nickisch, International Conference on Machine Learning, 2015, pp. 1775–1784 Search PubMed.
- A. G. Wilson, C. Dann and H. Nickisch, 2005, arXiv:1511.01870 Cs Stat.
- B. W. Silverman, J. R. Stat. Soc. Ser. B Methodol., 1985, 47, 1–52 Search PubMed.
- E. Snelson and Z. Ghahramani, in Advances in Neural Information Processing Systems 18, ed. Y. Weiss, B. Schölkopf and J. C. Platt, MIT Press, 2006, pp. 1257–1264 Search PubMed.
- J. Gardner, G. Pleiss, K. Q. Weinberger, D. Bindel and A. G. Wilson, Advances in Neural Information Processing Systems, 2018, pp. 7576–7586 Search PubMed.
- G. Pleiss, J. R. Gardner, K. Q. Weinberger and A. G. Wilson, 2018, arXiv:1803.06058 Cs Stat.
- A. K. Varshneya, Fundamentals of Inorganic Glasses, Elsevier, 2013 Search PubMed.
- S. Kasimuthumaniyan, A. A. Reddy, N. M. A. Krishnan and N. N. Gosvami, J. Non-Cryst. Solids, 2020, 534, 119955 CrossRef CAS.
- Y. Yu, M. Wang, N. M. Anoop Krishnan, M. M. Smedskjaer, K. Deenamma Vargheese, J. C. Mauro, M. Balonis and M. Bauchy, J. Non-Cryst. Solids, 2018, 489, 16–21 CrossRef CAS.
- M. M. Smedskjaer, J. C. Mauro, R. E. Youngman, C. L. Hogue, M. Potuzak and Y. Yue, J. Phys. Chem. B, 2011, 115, 12930–12946 CrossRef CAS.
- M. Wang, N. M. Anoop Krishnan, B. Wang, M. M. Smedskjaer, J. C. Mauro and M. Bauchy, J. Non-Cryst. Solids, 2018, 498, 294–304 CrossRef CAS.
- B. Stevensson, Y. Yu and M. Edén, Phys. Chem. Chem. Phys., 2018, 20, 8192–8209 RSC.
- Python for glass genomics (PyGGi), https://pyggi.iitd.ac.in.
Footnote |
| † Electronic supplementary information (ESI) available. See DOI: 10.1039/d0ma00764a |
| This journal is © The Royal Society of Chemistry 2021 |