 Open Access Article
Creative Commons Attribution 3.0 Unported Licence
Green synthesis of templated carbon porous materials from simple raw materials
Geovanny Broetto
Besinella
 ab,
José Eduardo
Padilha
 *c,
Fabiano Bisinella
Scheufele
 d,
Lázaro José
Gasparrini
 a,
Carlos Eduardo
Borba
 e and
Helton José
Alves
 abe
abe
aLaboratory of Materials and Renewable Energy (LABMATER), Department of Engineering and Exact Sciences, Federal University of Paraná – UFPR, Rua Pioneiro 2153, Jardim Dallas, 85950-000, Palotina, PR, Brazil
bPostgraduate Program in Engineering of Energy in Agriculture, West Parana State University – UNIOESTE, Campus of Toledo, Campus of Cascavel, Rua Universitária 2069, 85814-110, Cascavel, PR, Brazil
cLaboratory of Theory, Modeling and Simulation of Nanomaterials (LTMSNano), Jandaia do Sul Advanced Campus, Federal University of Paraná – UFPR, Rua Dr João Maximiano, 426, 86900-000, Jandaia do Sul, PR, Brazil. E-mail: jose.padilha@ufpr.br
dGraduation Program of Biotechnology and Bioprocess Engineering, Federal Technological University of Paraná – UTFPR – UTFPR, Rua Cristo Rei 19, 85902-490, Toledo, PR, Brazil
ePostgraduate Program in Chemical Engineering, West Paraná State University – UNIOESTE, Campus of Toledo, Rua da Faculdade 645, Jardim La Salle, 85903-000, Toledo, PR, Brazil
First published on 2nd November 2020
Abstract
Templated porous carbon materials (TPCMs) have recently received attention due to their many applications. In this context, this work focused on the development of a simple synthesis method to produce highly porous carbon materials, by applying commercial sugar as a carbon source, pyrolyzed silica (as a template) and deionized water. The synthesis of the materials consisted of: (i) gel formation, wherein the mass ratio sugar/template (S/T) was evaluated as well as the deionized water volume; (ii) carbonization: the gels were carbonized under an N2 inert atmosphere at a heating rate of 10 °C min−1 and a temperature of 700 °C for 1 h; and (iii) template leaching, in which two leaching agents were evaluated (NaOH and HF) for silica template removal. In order to evaluate the potential and characteristics of the TPCMs, morphological, textural and chemical characterization were carried out through N2 and CO2 physisorption, Raman spectroscopy, X-ray diffraction (XRD) and Fourier transform infrared spectroscopy (FT-IR). Overall, the NaOH-leached materials reached similar chemical and textural properties when compared to the HF, which is interesting from the economical, safety and environmental points of view. The N2 physisorption analyses evidenced the synthesis of a highly porous material after the removal of the template; C1-I (NaOH leaching) showed a specific surface area of 462 m2 g−1 and a micropore area of 610 m2 g−1, and elevated pore volume (1.04 cm3 g−1), wherein micropores (0.21 cm3 g−1) and mesopores (0.83 cm3 g−1) were identified – most interesting values for the best TPCM amongst the studied conditions. An average diameter value of ultramicropores and supermicropores (2.9 Å) was also identified by CO2 physisorption. The XRD diffractograms and Raman analyses indicated the formation of a semi-crystalline structure in the templated porous carbon material (TPCM), with large domains of graphite and graphene oxide sheets in a random pattern (turbostratic), along with amorphous carbon. From the FT-IR analysis it was possible to determine that the carbonized samples underwent partial oxidation and to identify the presence of bonds and vibrations of the aromatic skeleton (νOH, νC–H and νC![[double bond, length as m-dash]](https://www.rsc.org/images/entities/char_e001.gif) C). Overall, the characterization of the TPCMs, produced from simple raw materials, have demonstrated the great potential of this synthesis method for highly porous carbonaceous materials.
C). Overall, the characterization of the TPCMs, produced from simple raw materials, have demonstrated the great potential of this synthesis method for highly porous carbonaceous materials.
1 Introduction
Since its synthesis in 2004 by Geim and Novoselov,1 graphene has been considered one of the most promising materials for applications in nanotechnology. Graphene is present in nature in its bulk form, known as graphite, and its oxidation mechanism and the chemical structure of graphene oxide are still unknown, mainly due to its nonstoichiometric and its highly hygroscopic nature.2,3 Graphene can be synthesized by several methods, for example, chemical vapor deposition (CVD), mechanical exfoliation of graphite and annealing of silicon carbide (SiC) under an ultra-high vacuum.4 However, these methods have several limitations, like the high energy demand, low performance and limitation of instruments and laboratories, making those methods suitable for use in basic science, but not practical for commercial use. In this sense, graphene oxide (GO) and reduced graphene oxide (rGO) are gaining attention, as they can be synthesized in a simple and cheap way, making them an obvious choice for the large-scale synthesis of graphene.5There are different strategies for the synthesis of GO and/or rGO, which can be classified into two main categories: (i) methods where simple carbon molecules are used to build pristine graphene; and (ii) methods where layers of graphene are obtained from carbon sources, such as graphite. In the latter, first generated GO and/or rGO are commonly used for obtaining graphene derivatives, particularly for use in nanocomposite materials. The first synthesis of GO is often attributed to Brodie,6–9 where GO was obtained through the oxidation of graphite. In those methods they use thermal reduction, chemical reduction using reducing agents such as hydrazine hydrate, sodium borohydride, and ascorbic acid, and biological reduction using bacteria and plant extracts.10 There are other methods to convert GO to rGO, like the solvothermal method, where GO could be converted to rGO even in water.11
However, in the process of reducing GO to rGO, toxic and/or explosive reducing agents are widely used, for example, hydrazine hydrate (HH) and sodium borohydride (NaBH3), which are considered suitable for reduction purposes. Nonetheless, the application of these materials is limited by their dangerous and toxic nature.12,13 In this way, the development of a synthesis process involving “green agents”, non-toxic and ecologically correct compounds, is extremely important for the applicability of large-scale synthesis of both GO and rGO. Recent studies pointed to a promising future in the replacement of highly dangerous reducers with ecological reducers to obtain graphene, such as metals (iron, zinc and aluminum),14–16 alkaline solutions (sodium hydroxide and potassium hydroxide),17 phenols (tannin, gallic acid, tea and dopamine),18–21 alcohols (methyl alcohol, ethyl alcohol and isopropyl alcohol)22 and other substances (glycine, vitamin C and sodium citrate).23–25
In this work, we present a green synthesis process for graphene oxide-containing templated porous carbon materials (TPCMs) with high porosity, by using common components like commercial sugar, pyrolyzed silica and water. The process is designed in a simple, inexpensive and low risk manner, with the possibility of application in any academic laboratory, which could be easily scalable to industry.
2 Experimental procedure
2.1 Synthesis procedure
Aerosil-380 pyrolyzed silica (Sigma-Aldrich) was used as a template and commercial crystal sugar was used as a carbon precursor. The mass ratios between the silica template and the sugar that were used in this work as well as the values of the mass and volumetric proportions in all syntheses are summarized in Table 1. All systems were mechanically mixed for 5 hours. After mixing, each sample was taken to a refrigerator to soften the gel in a closed translucent container, for a period of 7 days.| Sample | H2O volume [mL] | Sugar mass (S) [g] | Template mass (T) [g] | Mass ratio (S/T) |
|---|---|---|---|---|
| C1 | 250 | 135 | 75 | 1.8 |
| C2 | 250 | 205 | 75 | 2.7 |
| C3 | 150 | 135 | 75 | 1.8 |
| C4 | 150 | 205 | 75 | 2.7 |
2.2 Carbonization under an N2 atmosphere
The impregnated samples were placed in 250 mL tall form porcelain melting pots (Chiarotti), weighed and subjected to carbonization in an electric furnace (FIVE PQ 10P – EDG), in a controlled atmosphere of N2 with a flow of 100 mL min−1. The heating ramp of the furnace was set to constant heating of 10 °C min−1, up to a maximum temperature of 700 °C, and kept at this temperature for a period of 1 h.2.3 Removal of the silica template
To remove the silica template, two methods were used.Method I: after the carbonization step, the “coal-template” compound was placed in a 250 mL beaker and weighed. A 2.0 mol L−1 solution of NaOH in water (1![[thin space (1/6-em)]](https://www.rsc.org/images/entities/char_2009.gif) :
:![[thin space (1/6-em)]](https://www.rsc.org/images/entities/char_2009.gif) 1) was used for this step. The sample was mixed in 100 mL of the NaOH solution, and was left to rest for a period of 72 h, and then the coal-template was washed with distilled water. After the disposal of the NaOH solution from the beakers, the coal was washed with distilled water until neutral pH was obtained.
1) was used for this step. The sample was mixed in 100 mL of the NaOH solution, and was left to rest for a period of 72 h, and then the coal-template was washed with distilled water. After the disposal of the NaOH solution from the beakers, the coal was washed with distilled water until neutral pH was obtained.
Method II: after the carbonization step, the “coal-template” compound was placed in a 250 mL beaker and weighed. A volume of 200 mL of hydrofluoric acid (HF) (p.a. 99%, Sigma-Aldrich) was added to the beaker. The sample was left to rest for a period of 5 h. At the end of the period, the hydrofluoric acid was removed and then the coal was washed with distilled water until neutral pH. Upon neutralizing the pH, all samples were taken to the oven in a beaker, where they remained for 48 h at 110 °C.
2.4 Material characterization
The samples were analyzed using scanning electron microscopy (VEGA3 TESCAN), in which the samples were spread in the sample holder on double-sided carbon tape, and then dried and metallized by sputtering with a thin layer of gold on the surface. Semi-quantitative chemical compositions of the micro-regions of the samples were determined by EDS (Energy Dispersive Spectroscopy) with an X-ray detector (OXFORD INSTRUMENTS, model X-act). The images were obtained using different magnifications in SE (secondary electron) mode. One of the samples was selected for analysis using transmission electron microscopy (TEM) (an FEI TECNAI G2 F20 microscope operated at 200 kV in STEM mode – 8 spots). The powdered sample was previously dispersed in isopropyl alcohol for 30 min, using an ultrasonic bath, and an aliquot was then transferred to a copper grid coated with a thin carbon film.The adsorption/desorption isotherms of N2 (physisorption) were obtained at liquid nitrogen temperature controlled by Quantachrome Nova 2000e equipment. All samples were subjected to pretreatment at 150 °C, under a vacuum, for 3 h. The specific area was calculated from the parameters of the Barrett–Emmett–Teller (BET) isotherms (P/P0 = 0.05–0.30); the pore volume (calculated at a relative pressure P/P0 of 0.99) and the average pore diameter were estimated according to the Barrett–Joyner–Halenda method (BJH). The samples were dried in two steps: the 1st for 24 h at 100 °C; and the 2nd for 4 h at 250 °C in a vacuum atmosphere. The adsorption/desorption isotherms of CO2 (physisorption) were obtained at a temperature of 0 °C, and the method used for the calculations was the Non-Local Discrete Fourier Transform (NLDFT) model: CO2 at 273 K on carbon.
X-ray diffraction measurements were performed to determine the different crystalline phases that are present in the produced coals. The diffractograms were obtained using an X-ray diffractometer (D2-Phaser – Bruker) with a Cu-Kα X-ray source (1.5418 Å) and nickel filter, under a voltage of 30 kV and 10 mA. The diffractograms were collected by performing measurements with an angular step of 0.02° min−1 and a time per step of 1 s in the angular range of 10 to 80° (2θ).
The Raman spectra were obtained using a Renishaw spectrophotometer coupled to an optical microscope, with the focal spot of the incident radiation at a point of 1 μm. An argon laser (λ = 514.5 nm) with an incident power of 20 mW in the region of 50–5000 cm−1 was used.
The infrared spectra were obtained in the middle infrared range between 450 and 4000 cm−1, with a resolution of 1 cm−1 and 64 accumulations per sample. The readings were taken from samples previously dried in an oven at 110 °C that were macerated until obtaining a fine powder. The obtained powder was then analyzed in the Fourier transform infrared spectrophotometer (FT-IR). A PerkinElmer 65 model together with the infrared spectrometer was used, with the UATR accessory.
Thermogravimetric analyses (TGA – PerkinElmer STA 600) were carried out under the following conditions: N2 as a carrier gas with a flow rate of 20.0 mL min−1 and sample heating of 10 °C min−1, in the temperature range between 30 °C and 900 °C. Also, derivative curves of TGA were obtained (DTG).
3 Results and discussion
3.1 Scanning electron microscopy (SEM) and transmission electron microscopy (TEM)
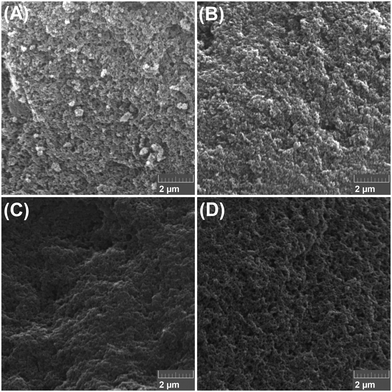
In Fig. 1(A)–(D), we present the Scanning Electron Microscopy (SEM) images of the samples C1-I, C2-I, C3-II and C4-II. As we can observe, all systems present a highly porous morphological structure. These pores come from the removal of the template as well as from the carbonization process.By analyzing Fig. 1, one may notice some differences in the morphology of the SEM images. Namely, samples C1-I and C2-I were leached with NaOH, which was less effective to completely remove the silica when compared to the HF method (C3-II and C4-II). Therefore, as observed in the EDS analysis (see Table 2), for samples C1-I and C2-I, a residual presence of Si was observed, and hence the granule structures observed in the SEM images for leaching method I (NaOH), especially for sample C1-I, can be ascribed to the silica template that was not entirely removed.
| Sample | C [%] | O [%] | Na [%] |
|---|---|---|---|
| C1-I | 83.99 ± 0.69 | 12.15 ± 0.93 | 0.65 ± 0.01 |
| C2-I | 89.51 ± 0.20 | 9.99 ± 0.15 | 0.33 ± 0.18 |
| C3-II | 90.76 ± 0.60 | 9.24 ± 0.60 | — |
| C4-II | 88.93 ± 0.71 | 11.07 ± 0.71 | — |
| Sample | Si [%] | Total [%] | C/O [m/m] |
|---|---|---|---|
| C1-I | 3.21 ± 1.21 | 100 | 6.91 |
| C2-I | 0.17 ± 0.11 | 100 | 8.96 |
| C3-II | — | 100 | 9.82 |
| C4-II | — | 100 | 8.03 |
In Fig. 2 we present an example of a transmission electron microscopy (TEM) image of one of the samples, C3-II. In this picture, a magnified image of the morphological structure of the components we used may be observed. As may be seen in the TEM images, the system is composed of a set of graphitic flakes that are randomly interconnected, creating porous structures. Also in Fig. 2, we indicate with a red arrow, as an example, one of the several two-dimensional layers that can be found in our system.
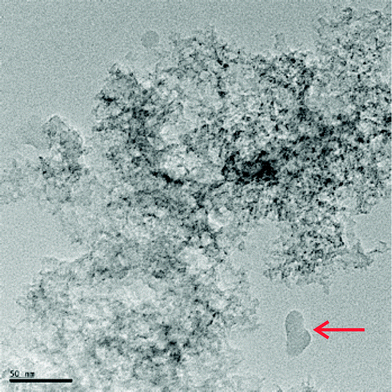 | ||
| Fig. 2 Transmission electron micrograph of sample C3-II. The red arrow points to a two-dimensional layer. | ||
3.2 Energy dispersive X-ray spectroscopy – EDS
The Energy Dispersive X-ray Spectroscopy (EDS) results are summarized in Table 2. As we could observe, the method used to remove the silicon template showed great efficiency. The presence of Si and Na in low concentrations and other elements on the surface of the samples leached by NaOH suggests that the method is efficient as a chemical agent to remove the silica template. Indeed, in the samples that were treated with method II, which uses hydrofluoric acid as the leaching agent, the efficiency was confirmed by the absence of Si on their respective surfaces.The data obtained by EDS for the samples after leaching showed high proportions of C/O, and a ratio of a minimum of 6.91 to a maximum of 9.82. This may suggest that the carbonization process and the removal method applied in the present work favored slight oxidation of the material. However, among the samples analyzed, C1-I was the one with the highest oxygen content.
Jankovský et al.26 showed via EDS analysis that in the composition of graphite oxides obtained by the modified Hummers’ method, the C/O ratios for chemically reduced graphene were in the range between 4 and 11, while the ratios for thermally reduced graphene are much higher, ranging from 22 to 50. This feature may indicate that the process of formation of graphene may come from chemical exfoliation of the graphitic material generated during the carbonization process.
3.3 Carbon dioxide physisorption
In Fig. 3 the isothermal curves of the CO2 physisorption measurements are presented. All samples showed similar isotherm profiles, like Type 1, characteristic of microporous materials, typically observed for activated carbons. The isotherms present a considerable adsorbed volume at lower pressures, referring to the first adsorbed layer of the gas, in the so-called ultramicropore regime.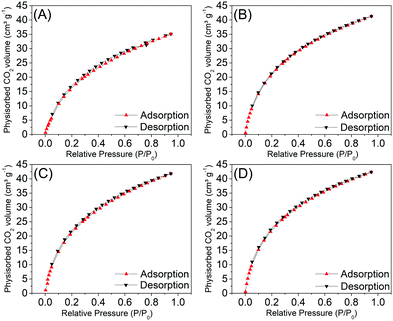 | ||
| Fig. 3 Adsorption and desorption isotherms obtained with CO2 for the C1-I (A), C2-I (B), C3-II (C) and C4-II (D) samples, after the leaching of the template. | ||
The CO2 physisorption data are summarized in Table 3. Through the results of the microporous surface areas (from 133 to 157 m2 g−1), volume (from 0.04 to 0.05 cm3 g−1) and micropore diameter (from 2.86 to 2.99 Å), it is possible to observe that there are no significant differences comparing the methods used to remove the silica template of the samples. The same behavior was observed for the mass ratios between the sugar and the template.
| Sample | C1-I | C2-I | C3-II | C4-II |
|---|---|---|---|---|
| Surfacemicro [m2 g−1] | 133 | 149 | 150 | 157 |
| V micro [cm3 g−1] | 0.04 | 0.05 | 0.05 | 0.05 |
| Diametermicro [Å] | 2.99 | 2.86 | 2.98 | 2.86 |
Analyzing the data obtained via the NLDFT method, we observe that the average pore diameter values are similar to the diameter of a CO2 molecule, in accordance with the classification parameters for ultramicroporous and supermicroporous. According to Thommes et al.,27,28 the filling of narrow micropores (ultramicropores – with diameters up to two or three angstroms) occurs at low relative pressures (P/P0 – 0.01) and it is entirely governed by an enhanced fluid–solid adsorption interaction.
In addition to the strong adsorption potential, a cooperation mechanism, including both solid interactions and fluid–fluid interactions, plays an important role in the pore filling process of wider micropores (supermicropores); this occurs in a higher relative pressure range (for example, P/P0 = 0.01–0.15).27,28
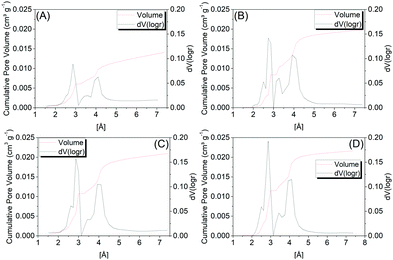
Fig. 4 shows the pore distribution as a function of the pore size of samples C1-I, C2-I, C3-II and C4-II, wherein by analyzing the microporous size distributions, one may observe similar profiles between the samples, with predominance of a bimodal distribution concentrated in the ultramicroporous range. Two more intense peaks are observed, around 2.9 Å and 4.0 Å, where the first is the most intense.
3.4 Nitrogen physisorption
The data obtained through nitrogen physisorption are summarized in Table 4 and the obtained isotherms are shown in Fig. 5. As we can see, the isotherms show similar behaviours, like Type IVa, and the hysteresis is type H3. In summary, all samples present isotherms that are Type IVa, which is a result of capillary condensation, where it is possible to note monolayer formation, followed by multilayer adsorption, from the inflection point up to the end of the isotherm. The Type IVa isotherm is typical for samples with pores in the range of mesopores to macropores, in which the formation of adsorption multilayers is possible, but limited to the pore dimensions of the material.| Sample | Template | C1 | C2 | C3 | C4 | C1-I | C2-I | C3-II | C4-II |
|---|---|---|---|---|---|---|---|---|---|
| Surface [m2 g−1] | 531 | 178 | 100 | 485 | 555 | 462 | 436 | 518 | 311 |
| SurfaceMicro [m2 g−1] | 695 | 245 | 147 | 638 | 754 | 610 | 580 | 684 | 573 |
| V micro [cm3 g−1] | 0.24 | 0.08 | 0.05 | 0.22 | 0.26 | 0.21 | 0.20 | 0.24 | 0.19 |
| V meso [cm3 g−1] | 0.61 | 0.30 | 0.12 | 1.00 | 0.60 | 0.83 | 0.48 | 0.66 | 0.28 |
| V total [cm3 g−1] | 0.85 | 0.38 | 0.17 | 1.22 | 0.86 | 1.04 | 0.68 | 0.90 | 0.47 |
| Diameter [Å] | 17.76 | 17.82 | 17.82 | 36.60 | 36.60 | 36.57 | 30.50 | 38.35 | 32.91 |
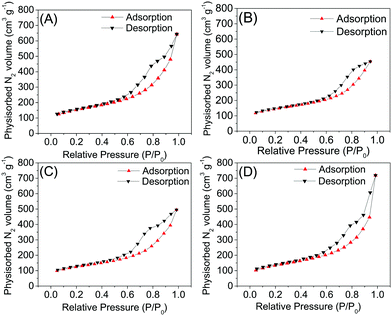 | ||
| Fig. 5 Adsorption and desorption isotherms after leaching from the C1-I (A), C2-I (B), C3-II (C) and C4-II (D) samples. | ||
All type H3 hysteresis loops had a loop closure point close to pressures of 0.45–0.6 P/P0, that is, the lower closing point of the hysteresis cycle, which agrees with the “universal” hysteresis limit, observed in cylindrical pores of MCM-41.27 However, in all samples, the isotherms have values of N2 higher than 100 cm3 g−1 at the beginning of the experiment, at low relative pressures. This is indicative of the marked presence of micropores in the synthesized materials, as previously revealed by the CO2 physisorption technique. Therefore, we can conclude that the materials have micro and mesopores in their structure.
The lowest mass ratios (1.8![[thin space (1/6-em)]](https://www.rsc.org/images/entities/char_2009.gif) :
:![[thin space (1/6-em)]](https://www.rsc.org/images/entities/char_2009.gif) 1) of sugar per silica showed a high surface area compared to those with higher ratios (2.7
1) of sugar per silica showed a high surface area compared to those with higher ratios (2.7![[thin space (1/6-em)]](https://www.rsc.org/images/entities/char_2009.gif) :
:![[thin space (1/6-em)]](https://www.rsc.org/images/entities/char_2009.gif) 1). The decrease in the sugar fraction in the mass ratio sugar/silica makes it possible to obtain materials with larger areas and mesoporous volume, which is due to the formation of a material with thinner walls. The samples subjected to leaching treatment by method I, which employs the use of a 2.0 mol L−1 NaOH solution, showed an increase in the surface area and pore volume, and, in particular, the micropores. The samples C1 and C2 that were leached through the solution of NaOH reached an increase of 262% and 380% in the micropore volume, followed by an expressive increase in the total pore volume, 273% and 412%. However, the samples treated by leaching method II showed a reduction in total pore volume of around 26% for sample C3, and 45% for sample C4. The use of hydrofluoric acid for leaching resulted in a reduction in the volume of micropores (27%) and mesopores (46%) of sample C4, in addition to a reduction in the surface area of 244 m2 g−1. The BET specific surface areas of samples C1-I, C2-I and C3-II are bigger than alcohol-reduced rGO (5.8–35.9 m2 g−1) and within the range of HH rGO (usually 400–700 m2 g−1).12,22,29 Perhaps the concentration and volume of hydrofluoric acid used to leach the silica from samples C3 and C4 acted so aggressively that several conjectures can be explored, such as: reducing the number of pore walls; enlargement of pores; and pore breakdown.
1). The decrease in the sugar fraction in the mass ratio sugar/silica makes it possible to obtain materials with larger areas and mesoporous volume, which is due to the formation of a material with thinner walls. The samples subjected to leaching treatment by method I, which employs the use of a 2.0 mol L−1 NaOH solution, showed an increase in the surface area and pore volume, and, in particular, the micropores. The samples C1 and C2 that were leached through the solution of NaOH reached an increase of 262% and 380% in the micropore volume, followed by an expressive increase in the total pore volume, 273% and 412%. However, the samples treated by leaching method II showed a reduction in total pore volume of around 26% for sample C3, and 45% for sample C4. The use of hydrofluoric acid for leaching resulted in a reduction in the volume of micropores (27%) and mesopores (46%) of sample C4, in addition to a reduction in the surface area of 244 m2 g−1. The BET specific surface areas of samples C1-I, C2-I and C3-II are bigger than alcohol-reduced rGO (5.8–35.9 m2 g−1) and within the range of HH rGO (usually 400–700 m2 g−1).12,22,29 Perhaps the concentration and volume of hydrofluoric acid used to leach the silica from samples C3 and C4 acted so aggressively that several conjectures can be explored, such as: reducing the number of pore walls; enlargement of pores; and pore breakdown.
Fig. 6 shows the pore distribution volume as a function of the pore size of samples C1-I, C2-I, C3-II and C4-II, obtained through the BJH method. All samples presented a pore volume distribution in a bimodal form, which is found in the range of mesopores, which is between 20 and 500 Å. It is noticeable that samples C1-I (A) and C3-II (C) presented larger pore volumes in the regions of smaller diameters (15–37 Å) than samples C2-I (B) and C4-II (D), which validates the volume of micropores and the microporous surface area found in the samples.
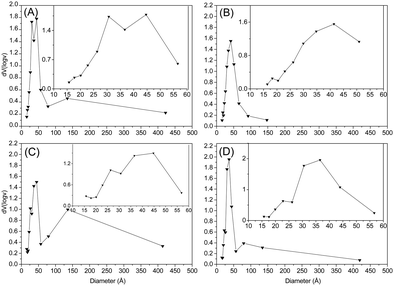 | ||
Fig. 6 Pore distribution volumes in the desorption (dV(log![[thin space (1/6-em)]](https://www.rsc.org/images/entities/char_2009.gif) v) cm3 g−1) of samples C1-I (A), C2-I (B), C3-II (C) and C4-II (D). v) cm3 g−1) of samples C1-I (A), C2-I (B), C3-II (C) and C4-II (D). | ||
A study by Thommes et al.30 compared two types of micro and mesoporous silica templates, in order to investigate and characterize the pore network. They observed that these materials have a pore size close to 139 Å, which is characteristic of cylindrical pores. All of our samples have values of the pore size close to 26 Å, which means that the cylindrical pore networks of the samples are connected by small mesopores. This is the most desirable behavior in the synthesis of carbonaceous porous materials, which indicates the use of these porous materials in several areas of adsorption processes. In summary, the synthesized materials showed bimodal pore morphology, consisting of spherical micro–mesopores connected by small (26 Å) cylindrical mesopores.
As mentioned above, the SEM results and EDS evidenced that the NaOH leaching method was not able to completely remove the silica template from the carbonized material. In spite of that, overall the textural properties of the TCPM of the NaOH-leached materials were comparable to the ones obtained using HF (see Table 4). For that reason, the NaOH method was considered as a greener alternative, given its economic and environmental advantages (e.g. lower cost, more accessible reagent, easier to manipulate and less potentially harmful than HF). Of course, given the specificity of the textural properties, the specific application should be considered to define the most adequate material for that purpose.
3.5 X-ray diffraction
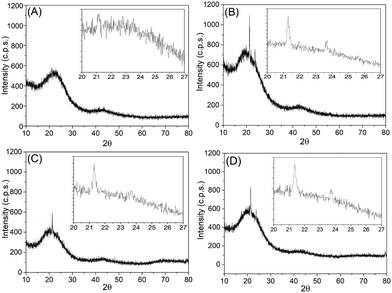
Fig. 7 presents the X-Ray Diffraction results (XRD). The diffractograms of all samples showed two main peaks, the first with greater width in the range of 20–30° in 2θ, while the second was smoother, in the 2θ range of 40–45°. This feature indicates that we have a material with an organized crystal structure, and the peak near 24° is consistent with the diffraction of the (002) plane, typical of graphitic materials. The reflections observable at 40° (100) and 43° (101) characterize 2D and 3D graphitic structures. The peak assigned to the (002) plane, that appears with a small offset relative to the real position of the signal, that should be located at 26.5° for (002), presents a weaker signal. A weak signal of plane (002) is often related to the turbostratic carbon structure (t-carbon), that is, the graphene layers are arranged in a random structure. Also, according to Li et al.,31 turbostratic carbon is generally considered to be a variant of hexagonal graphite, and both hexagonal graphite and turbostratic carbon are composed of layers of graphene with regular spacing with a different degree of stacking order and directions.Hexagonal graphite (h-graphite) could be seen as an ordered AB stacking structure of graphene layers, known as Bernal stacking. In contrast, in turbostratic graphite (t-graphite), the graphene layers are randomly connected to each other. This random structure induces translations and rotations of the graphene layers, changing the interlayer spacing and/or the shape of atomic layers, inducing curvature, as well as local positive fluctuations in the interlayer spacing of graphene layers.32–36
According to Zhang et al.,37 the intense peak between 20 and 30° reflects a crystallographic arrangement that may present a certain structural organization of the charcoal, and this behavior occurs as a result of an alignment of the layers (graphene oxide and/or graphite oxide). According to Soin et al.,38 after the reduction of graphite to rGO, the appearance of a broad band in the range 23° < θ < 27° can be associated with a spacing between the rGO layers of 0.36 nm, indicating that the rGO sheets are weakly stacked. In this way, we can also observe this behavior in our samples, indicating the presence also of rGO in the material obtained in this work. This factor and the bigger interlayer spacing could help in the understating of the isotherms obtained in the N2 physisorption results, since the isotherms and hysteresis shown by the majority of the samples present the behavior of materials composed of agglomerates of plates, similar to graphitic materials (hysteresis of type H3).
A study conducted by Khan et al.39 compared the wide angle XRD patterns of nanoporous coals at different temperatures (700 °C, 800 °C, and 900 °C) with commercially available activated carbon, observing wide peaks around 23.3° and 43.8°. The studies by Khan et al.39 reported that the peak intensity of the (002) plane increases with higher temperatures, suggesting greater graphitization. With the exception of sample C1-I, the rest of the samples analyzed by XRD had acute peaks close to 21.3° in 2θ, which in the literature is reported as flat graphite (002).
3.6 Raman spectroscopy
One important analysis technique of carbon-based materials is Raman spectroscopy. In this way, our samples were also characterized by Raman spectroscopy, and the spectra are shown in Fig. 8.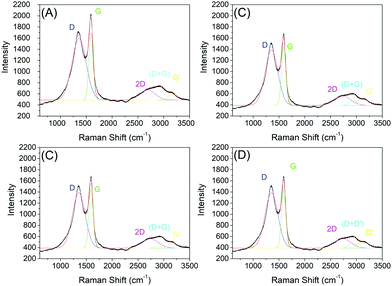 | ||
| Fig. 8 Raman spectroscopy of samples C1-I (A), C2-I (B), C3-II (C) and C4-II. (D) After removing the silica template. | ||
The data obtained through Raman spectroscopy show bands close to 1350 cm−1 and 1590 cm−1, corresponding to the D and G bands. Three other bands of lower intensities were recorded close to 2700 cm−1, 2900 cm−1 and 3180 cm−1, corresponding to 2D bands, (D + D′) and D′. The D band (1350 cm−1) is detected with high intensity, which does not occur in pristine graphitic materials; however, the graphene oxide spectrum is characterized by the presence of the D peak (1350 cm−1). This D band occurs when there is significant disorder in the material, like vacancies, pores, stacking disorder, etc.40,41 Distorted microstructures, including disorder in the stacking of graphene layers, increased spacing between layers at the edges of the flakes, curved graphene layers and other structural defects are observed experimentally in crushed graphite.33,42,43 These defects induce a reduction of the symmetry of the material, creating new active Raman modes, which causes the appearance of the D band and is commonly observed in nanomaterials with a high surface area.44 However, due to the highly porous morphology of the materials, it is possible that the D band comes from a structure rich in defects. The G band, close to a wavelength of 1580 cm−1, is related to the vibrational mode referring to the symmetrical stretch of the C![[double bond, length as m-dash]](https://www.rsc.org/images/entities/char_e001.gif) C bond in the plane of the material.44 This corroborates with the data found in the XRD analysis, which presented a large peak close to the region characterized as the stretch of sp2 bonds. According to Ferrari and Robertson,45 the G band moves to higher frequencies during graphite amorphization. When switching from a pure graphite crystal to a single sheet of graphene, the G band changes from 1581 to 1585 cm−1; this change may also be partially responsible for the higher G-band frequencies in graphene oxide, if significant unmodified graphitic areas remains unaltered.46
C bond in the plane of the material.44 This corroborates with the data found in the XRD analysis, which presented a large peak close to the region characterized as the stretch of sp2 bonds. According to Ferrari and Robertson,45 the G band moves to higher frequencies during graphite amorphization. When switching from a pure graphite crystal to a single sheet of graphene, the G band changes from 1581 to 1585 cm−1; this change may also be partially responsible for the higher G-band frequencies in graphene oxide, if significant unmodified graphitic areas remains unaltered.46
The 2D band characteristic of all forms of graphene is pronounced in all samples of this work. Work carried out by Ferrari (2007)41 used the 2D band to identify the numbers of graphene layers and the type of stacking, where it is shown that an additional increase in the number of graphene layers leads to a significant decrease in the relative intensity of the 2D peak. In the graphene Raman spectrum, two characteristics are more intense, with the G peak at 1580 cm−1 and a band at 2700 cm−1, commonly called 2D, where the second peak, which is more prominent, is observed in graphene oxide samples.47,48 There are also other notable bands in graphene-based materials, such as the D′ band around 1620 cm−1, 2D (also called G′) at 2700 cm−1 and 2D′ (in many cases mistakenly called 2G) at 3250 cm−1, in addition to a D + D′ combination at around 2930 cm−1. The parameters were obtained from the fit of Gaussian curves representing the D and G bands (note: the least square method was used in the fit procedure). The area and intensity ratio of the D and G bands (AD and AG, ID and IG), and the width and position of the G and 2D bands are shown in Table 5. The ratio between the intensities of the D and G bands, called the ID/IG ratio, can be used to infer the density of defects in the layers, where in pure and crystalline graphite and graphene samples the ratio is close to zero (Table 5).
| Sample | I D/IG | A D/AG | L G | G-Band [cm−1] | 2D-band position [cm−1] |
|---|---|---|---|---|---|
| C1-I | 0.92 | 3.09 | 82 | 1590 | 2684 |
| C2-I | 0.91 | 3.34 | 83 | 1591 | 2644 |
| C3-II | 0.94 | 2.79 | 84 | 1590 | 2729 |
| C4-II | 0.91 | 3.45 | 72 | 1591 | 2664 |
An increase in the ID/IG ratio is commonly found in GO materials.12,23,48–51 This increase could also be attributed to a decrease in the average size of the graphitic domains51,52 and an increase in the fraction of edges in the material.40,41
3.7 Fourier-transform infrared spectroscopy (FTIR)
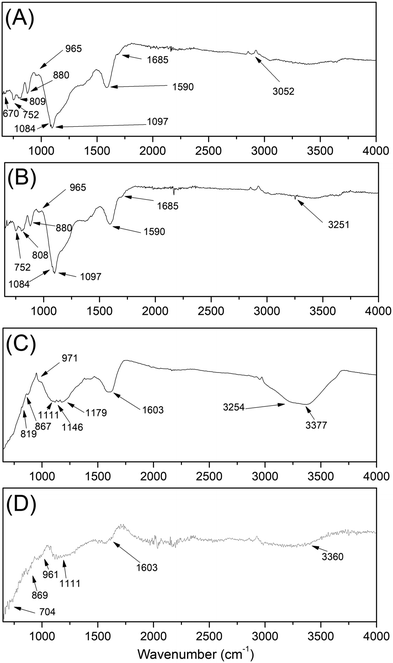
In Fig. 9 the infrared spectra of the samples are presented. With this information it is possible to qualitatively identify the presence of surface functional groups. In Table 6 we summarize the molecular vibrational modes with their respective wave numbers that were identified in our samples. The bands located at 3200 cm−1, which is associated to the hydroxyl group –OHn (νOH C–OH). The bands in the 3200 cm−1 group –OH (νOH H2O) refer to the presence of water in the sample.| Observed wave number | Assignments | |||
|---|---|---|---|---|
| C1-I | C2-I | C3-II | C4-II | |
| 1097, 1084, 965, 880, 808, 752, 670 | 1097, 1084, 1074, 965, 880, 808, 752, 677 | 111, 971, 867, 819, 740, 697 | 1111, 961, 869, 704 | Angular deformation of C–H in the aromatic ring |
| 1590 | 1591 | 1603 | 1603 | Aromatic bonds –C![[double bond, length as m-dash]](https://www.rsc.org/images/entities/char_e001.gif) C– C– |
| 1685 | 1695 | — | — | Carbonyl bonds R2C![[double bond, length as m-dash]](https://www.rsc.org/images/entities/char_e001.gif) O O |
| 3052 | 3051 | 3254, 3377 | 3360 | Axial deformations of O–H |
Intense bands around 2900 cm−1 (νCH) appeared in all spectra of group 1, since they are present in almost all organic compounds, because they are due to the presence of the C–H stretch. The absorption region of aromatic nuclei is between 900 and 650 cm−1; sharp bands in this region indicate the presence of angular vibrations outside the C–H plane of aromatics. Strong bands are present in the region of 900–690 cm−1, which indicates the presence of an aromatic skeleton in the structure.
According to Lee et al.,53 graphite has characteristic peaks at 3430 and 1610 cm−1, which correspond to the elongation of the O–H bond of adsorbed water and skeletal vibrations from graphitic domains of aromatic C![[double bond, length as m-dash]](https://www.rsc.org/images/entities/char_e001.gif) C, respectively. A peak shift of aromatic C
C, respectively. A peak shift of aromatic C![[double bond, length as m-dash]](https://www.rsc.org/images/entities/char_e001.gif) C from 1580 cm−1 in graphite to 1660 cm−1 in graphene oxide (OG) appears, indicating that some electron-withdrawing groups (such as oxygen-containing functional groups) are attached to aromatic rings after oxidation,54 since the stretch region close to 1650–1690 cm−1 refers to the carbonyl groups (–C
C from 1580 cm−1 in graphite to 1660 cm−1 in graphene oxide (OG) appears, indicating that some electron-withdrawing groups (such as oxygen-containing functional groups) are attached to aromatic rings after oxidation,54 since the stretch region close to 1650–1690 cm−1 refers to the carbonyl groups (–C![[double bond, length as m-dash]](https://www.rsc.org/images/entities/char_e001.gif) O). The confirmation of the aromatic ring is made in the region of 1700–1500 cm−1 (νC
O). The confirmation of the aromatic ring is made in the region of 1700–1500 cm−1 (νC![[double bond, length as m-dash]](https://www.rsc.org/images/entities/char_e001.gif) C) through the absorption band corroborating with the data obtained by XRD and Raman, which indicates the stretching of C
C) through the absorption band corroborating with the data obtained by XRD and Raman, which indicates the stretching of C![[double bond, length as m-dash]](https://www.rsc.org/images/entities/char_e001.gif) C bonds. By analyzing the FT-IR data, it is possible to determine that the carbonized samples undergo partial oxidation, where it is possible to observe the presence of connections and vibrations of several groups from oxidation. In all samples for which NaOH was used as the template removal agent, a higher index of functional groups was shown, indicating high oxidation of the carbonaceous material. The samples that used HF for the leaching of the silica template showed a significant reduction of oxygenated groups on the surface, favoring greater reduction of the material by this way of leaching. The samples treated by method II have fewer oxygen groups in their structure, favoring the quality of the material obtained. The removal of these portions of oxygen is a vital topic that determines the properties of the final product, and the material will be closer to properties that are observed in turbostratic graphene and also pristine graphene.9 Finally, since the HF leached material presents fewer oxygenated groups and could resemble features close to pristine graphene, this synthesis process could benefit industry, as this material shows high potential in view of its numerous applications.
C bonds. By analyzing the FT-IR data, it is possible to determine that the carbonized samples undergo partial oxidation, where it is possible to observe the presence of connections and vibrations of several groups from oxidation. In all samples for which NaOH was used as the template removal agent, a higher index of functional groups was shown, indicating high oxidation of the carbonaceous material. The samples that used HF for the leaching of the silica template showed a significant reduction of oxygenated groups on the surface, favoring greater reduction of the material by this way of leaching. The samples treated by method II have fewer oxygen groups in their structure, favoring the quality of the material obtained. The removal of these portions of oxygen is a vital topic that determines the properties of the final product, and the material will be closer to properties that are observed in turbostratic graphene and also pristine graphene.9 Finally, since the HF leached material presents fewer oxygenated groups and could resemble features close to pristine graphene, this synthesis process could benefit industry, as this material shows high potential in view of its numerous applications.
3.8 Thermogravimetric analysis and derivative thermogravimetry (TGA/DTG)
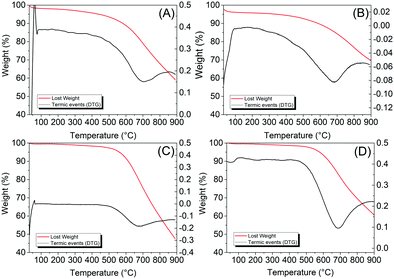
The thermogravimetric analysis is presented in Fig. 10. As we can see, only three regions of mass loss were observed for the samples, the first in the range of 30–130 °C, followed by two mass losses of greater intensity at 150–480 °C and 480 °C.Samples C1-I and C2-I presented similar mass loss to that of graphene oxide. The first loss occurs in the range of 30–130 °C, referring to the loss of water, around 2%. The second region occurred in the range of 150–480 °C, with a loss of mass of approximately 3.9%, attributed to the volatility of the carbonyl and carboxyl groups. The third range 480–750 °C is related to the thermal degradation of more stable structures from the carbon backbone structure with a loss of mass of approximately 35%. Those values are close to studies presented in the literature.55,56 Samples C3-II and C4-II showed the same characteristics, but with a lower loss of mass in the second range (150–450 °C), with a loss percentage of approximately 1.75%. This can be attributed to the greater reduction occurring with the use of HF in the leaching of the template, since this removal agent has greater interaction with the silicate compounds. Such data corroborate with the FT-IR of the samples (Fig. 9 and Table 6), which showed the absence of the carbonyl functional groups, which gives better characteristics to the obtained graphene oxide.
4 Conclusion
In this work we have presented a new synthesis route of templated porous carbon materials with desirable features from simple and low-cost raw materials. The characterizations of the obtained materials after the syntheses corroborate the production of a potential porous carbonaceous compound, which may be performed in any academic or industrial laboratory. Special attention may be given to the NaOH-leached material since comparable results were obtained to the traditionally used leaching agent (i.e. HF) for silica template removal. Therefore, the procedure presents both economic and environmental benefits. The N2 physisorption values showed high surface areas (external 462 m2 g−1 and micropores 610 m2 g−1) and total pore volume (1.04 cm3 g−1), where a large percentage is attributed to micropores (0.21 cm3 g−1) and mesopores (0.83 cm3 g−1). An average diameter value of ultramicropores and supermicropores (concentrated on 2.9 Å and 4.0 Å) was also identified by CO2 physisorption. Through the analysis of the bands in Raman and XRD, it appears that the process of synthesis of coals generated the formation of a semicrystalline material with large domains of graphite and graphene sheets organized in a random structure, related to a turbostratic graphene material with high porosity. All of those features can favor the use of this material in the most diverse industrial and laboratory areas, and it may be used as a molecular separator, filter medium, effluent treatment and in other applications. Finally, the synthesis process of this material together with the significantly low-cost values of the raw materials involved in its reproducibility on a large scale demonstrates that this work contributes in an important way to the area of synthesis of carbonaceous materials.Conflicts of interest
There are no conflicts to declare.Acknowledgements
The authors acknowledge financial support from the Brazilian agencies CNPq and CAPES. This work was partially supported by the Brazilian Institute of Science and Technology (INCT) in Carbon Nanomaterials.Notes and references
- K. S. Novoselov, A. K. Geim, S. V. Morozov, D. Jiang, Y. Zhang, S. V. Dubonos, I. V. Grigorieva and A. A. Firsov, Science, 2004, 306, 666–669 CrossRef CAS.
- G. Shao, Y. Lu, F. Wu, C. Yang, F. Zeng and Q. Wu, J. Mater. Sci., 2012, 47, 4400–4409 CrossRef CAS.
- A. Lerf, H. He, M. Forster and J. Klinowski, J. Phys. Chem. B, 1998, 102, 4477–4482 CrossRef CAS.
- V. Loryuenyong, K. Totepvimarn, P. Eimburanapravat, W. Boonchompoo and A. Buasri, Adv. Mater. Sci. Eng., 2013, 1–5 Search PubMed.
- R. S. Cherian, S. Sandeman, S. Ray, I. N. Savina, J. Ashtami and P. V. Mohanan, Colloids Surf., B, 2019, 179, 94–106 CrossRef CAS PubMed.
- B. C. Brodie, Philos. Trans. R. Soc. London, 1859, 149, 249–259 CrossRef.
- L. Staudenmaier, Ber. Dtsch. Chem. Ges., 1898, 31, 1481–1487 CrossRef CAS.
- W. S. Hummers and R. E. Offeman, J. Am. Chem. Soc., 1958, 80, 1339 CrossRef CAS.
- Y. Si and E. T. Samulski, Nano Lett., 2008, 8, 1679–1682 CrossRef CAS PubMed.
- S. Pei and H.-M. Cheng, Carbon, 2012, 50, 3210–3228 CrossRef CAS.
- C. Nethravathi and M. Rajamathi, Carbon, 2008, 46, 1994–1998 CrossRef CAS.
- S. Stankovich, D. A. Dikin, R. D. Piner, K. A. Kohlhaas, A. Kleinhammes, Y. Jia, Y. Wu, S. T. Nguyen and R. S. Ruoff, Carbon, 2007, 45, 1558–1565 CrossRef CAS.
- H.-J. Shin, K. K. Kim, A. Benayad, S.-M. Yoon, H. K. Park, I.-S. Jung, M. H. Jin, H.-K. Jeong, J. M. Kim, J.-Y. Choi and Y. H. Lee, Adv. Funct. Mater., 2009, 19, 1987–1992 CrossRef CAS.
- Z.-J. Fan, W. Kai, J. Yan, T. Wei, L.-J. Zhi, J. Feng, Y. M. Ren, L.-P. Song and F. Wei, ACS Nano, 2010, 5, 191–198 CrossRef PubMed.
- Z. Fan, K. Wang, T. Wei, J. Yan, L. Song and B. Shao, Carbon, 2010, 48, 1686–1689 CrossRef CAS.
- S. Yang, W. Yue, D. Huang, C. Chen, H. Lin and X. Yang, RSC Adv., 2012, 2, 8827 RSC.
- X. Fan, W. Peng, Y. Li, X. Li, S. Wang, G. Zhang and F. Zhang, Adv. Mater., 2008, 20, 4490–4493 CrossRef CAS.
- Y. Lei, Z. Tang, R. Liao and B. Guo, Green Chem., 2011, 13, 1655 RSC.
- J. Li, G. Xiao, C. Chen, R. Li and D. Yan, J. Mater. Chem. A, 2013, 1, 1481–1487 RSC.
- Y. Wang, Z. Shi and J. Yin, ACS Appl. Mater. Interfaces, 2011, 3, 1127–1133 CrossRef CAS PubMed.
- L. Q. Xu, W. J. Yang, K.-G. Neoh, E.-T. Kang and G. D. Fu, Macromolecules, 2010, 43, 8336–8339 CrossRef CAS.
- D. R. Dreyer, S. Murali, Y. Zhu, R. S. Ruoff and C. W. Bielawski, J. Mater. Chem., 2011, 21, 3443–3447 RSC.
- S. Bose, T. Kuila, A. K. Mishra, N. H. Kim and J. H. Lee, J. Mater. Chem., 2012, 22, 9696 RSC.
- M. J. Fernández-Merino, L. Guardia, J. I. Paredes, S. Villar-Rodil, P. Solís-Fernández, A. Martínez-Alonso and J. M. D. Tascón, J. Phys. Chem. C, 2010, 114, 6426–6432 CrossRef.
- W. Wan, Z. Zhao, H. Hu, Q. Zhou, Y. Fan and J. Qiu, Carbon, 2011, 49, 2878 CrossRef CAS.
- O. Jankovský, Š. H. Kučková, M. Pumera, P. Šimek, D. Sedmidubský and Z. Sofer, New J. Chem., 2014, 38, 5700–5705 RSC.
- M. Thommes, K. Kaneko, A. V. Neimark, J. P. Olivier, F. Rodriguez-Reinoso, J. Rouquerol and K. S. Sing, Pure Appl. Chem., 2015, 87, 1051–1069 CAS.
- M. Thommes and K. A. Cychosz, Adsorption, 2014, 20, 233–250 CrossRef CAS.
- M. D. Stoller, S. Park, Y. Zhu, J. An and R. S. Ruoff, Nano Lett., 2008, 8, 3498–3502 CrossRef CAS PubMed.
- M. Thommes, B. Smarsly, M. Groenewolt, P. I. Ravikovitch and A. V. Neimark, Langmuir, 2006, 22, 756–764 CrossRef CAS PubMed.
- Z. Li, C. Lu, Z. Xia, Y. Zhou and Z. Luo, Carbon, 2007, 45, 1686–1695 CrossRef CAS.
- J. Huang, Acta Mater., 1999, 47, 1801–1808 CrossRef CAS.
- X. Chen, H. Yang, G. Wu, M. Wang, F. Deng, X. Zhang, J. Peng and W. Li, J. Cryst. Growth, 2000, 218, 57–61 CrossRef CAS.
- J. Li, Q. Peng, G. Bai and W. Jiang, Carbon, 2005, 43, 2830–2833 CrossRef CAS.
- K. Awasthi, Int. J. Hydrogen Energy, 2002, 27, 425–432 CrossRef CAS.
- K. Niwase, T. Tanaka, Y. Kakimoto, K. N. Ishihara and P. H. Shingu, Mater. Trans., JIM, 1995, 36, 282–288 CrossRef CAS.
- X. Zhang, Y.-C. Zhang and J.-W. Zhang, Talanta, 2016, 161, 567–573 CrossRef CAS PubMed.
- N. Soin, S. S. Roy, T. H. Lim and J. A. McLaughlin, Mater. Chem. Phys., 2011, 129, 1051–1057 CrossRef CAS.
- J. H. Khan, J. Lin, C. Young, B. M. Matsagar, K. C. Wu, P. L. Dhepe, M. T. Islam, M. M. Rahman, L. K. Shrestha, S. M. Alshehri, T. Ahamad, R. R. Salunkhe, N. A. Kumar, D. J. Martin, Y. Yamauchi and M. S. A. Hossain, Mater. Chem. Phys., 2018, 216, 491–495 CrossRef CAS.
- M. A. Pimenta, G. Dresselhaus, M. S. Dresselhaus, L. G. Cançado, A. Jorio and R. Saito, Phys. Chem. Chem. Phys., 2007, 9, 1276–1290 RSC.
- A. C. Ferrari, Solid State Commun., 2007, 143, 47–57 CrossRef CAS.
- N. Welham, V. Berbenni and P. Chapman, J. Alloys Compd., 2003, 349, 255–263 CrossRef CAS.
- J. Huang, Acta Mater., 1999, 47, 1801–1808 CrossRef CAS.
- W. Li, H. Zhang, C. Wang, Y. Zhang, L. Xu, K. Zhu and S. Xie, Appl. Phys. Lett., 1997, 70, 2684–2686 CrossRef CAS.
- A. C. Ferrari and J. Robertson, Phys. Rev. B: Condens. Matter Mater. Phys., 2000, 61, 14095–14107 CrossRef CAS.
- D. Graf, F. Molitor, K. Ensslin, C. Stampfer, A. Jungen, C. Hierold and L. Wirtz, Nano Lett., 2007, 7, 238–242 CrossRef CAS PubMed.
- I. M. Jauris, C. F. Matos, C. Saucier, E. C. Lima, A. J. G. Zarbin, S. B. Fagan, F. M. Machado and I. Zanella, Phys. Chem. Chem. Phys., 2016, 18, 1526–1536 RSC.
- Y. Chen, X. Zhang, D. Zhang, P. Yu and Y. Ma, Carbon, 2011, 49, 573–580 CrossRef CAS.
- C. K. Chua, A. Ambrosi and M. Pumera, J. Mater. Chem., 2012, 22, 11054 RSC.
- I. K. Moon, J. Lee, R. S. Ruoff and H. Lee, Nat. Commun., 2010, 1, 73 CrossRef PubMed.
- H. Wang, J. T. Robinson, X. Li and H. Dai, J. Am. Chem. Soc., 2009, 131, 9910–9911 CrossRef CAS PubMed.
- Z. Bo, X. Shuai, S. Mao, H. Yang, J. Qian, J. Chen, J. Yan and K. Cen, Sci. Rep., 2014, 4, 4684 CrossRef PubMed.
- D. W. Lee, L. De Los Santos V., J. W. Seo, L. L. Felix, A. Bustamante D., J. M. Cole and C. H. W. Barnes, J. Phys. Chem. B, 2010, 114, 5723–5728 CrossRef CAS PubMed.
- W. Ren, L. Gao, L. Ma and H. Cheng, Carbon, 2011, 49, 2881 CrossRef CAS.
- J. Chen, B. Yao, C. Li and G. Shi, Carbon, 2013, 64, 225–229 CrossRef CAS.
- H. Mehl, C. F. Matos, E. G. C. Neiva, S. H. Domingues and A. J. G. Zarbin, Quím. Nova, 2014, 37, 1639–1645 CAS.
| This journal is © The Royal Society of Chemistry 2021 |

