
Cross-linking behavior of eutectic hardeners from natural acid mixtures†
Jonathan
Tellers
a,
Mona
Jamali
a,
Philippe
Willems
b,
Bôke
Tjeerdsma
b,
Nicolas
Sbirrazzuoli
 a and
Nathanael
Guigo
*a
a and
Nathanael
Guigo
*a
aInstitut de Chimie de Nice, Université Côte d'Azur, CNRS, UMR 7272, 06108 Nice, France. E-mail: Nathanael.GUIGO@univ-cotedazur.fr; Nicolas.SBIRRAZZUOLI@univ-cotedazur.fr
bORINEO – original renewables, Acaciastraat 14, B-3071 Erps-Kwerps, Belgium. E-mail: phw@orineo.com
First published on 9th December 2020
Abstract
Eutectic Hardeners (EH) are multi component mixtures that activate one or more of their constituents for curing at low temperatures and are characterized by a low melting point. In this paper, natural acids and their mixtures (Citric Acid (CA), Malic Acid (MA), and Tartaric Acid (TA)) are used in conjunction with the liquefactor Ethyl Lactate (EL) to cure epoxidized linseed oil (ELO). Their influence on curing speed and final material properties are investigated. Mixtures with MA proved to have a lower viscosity, which is beneficial for the preparation of homogenous samples, but showed slightly diminished tensile properties compared to materials cured with only CA. TA had an increased reaction speed thanks to a lower pKa value and the final material properties of a CATA mixture with small amounts of TA were found to have improved toughness and tensile strength.
Introduction
Spurred on by a need to develop well performing yet sustainable materials,1 researchers have focused on developing new raw materials and techniques, that perform at least as well as the current fossil based solutions. Significant progress has been made in the development of natural epoxy matrices that rely on unsaturated vegetable oils2–5 and the epoxidation of naturally occurring monomers,6–8 and usually require either multiple double bonds or hydroxyl groups to be present in the molecule.9 A multitude of epoxy matrices based on these unsaturated oils are already widely available on a large scale, and thus provide an economically viable source for green epoxy matrices through established methods.10 However, there are fewer suitable bio-based hardeners that can cure at low temperatures, are economic, and that are easy to handle without any associated health concerns. Amine based hardeners are among the best performing fossil-based solutions, allowing for fast curing speed at room temperature and displaying a wide range of excellent properties.11 Although amines can be obtained from natural resources and using enzymes,11–14 they are prone to oxidize and often present health risks that would be better avoided during the development of new hardener solutions.15–17 Another class of widely used epoxy hardeners that have a broad range of applications are anhydrides, which are used in electronics, composites applications, and generally in exclusively heat curing applications.18 They can be used to obtain thermosets with high glass transitions (Tg),19 but they present handling issues and are known to cause respiratory issues and diseases,12,20 thus making them undesirable for use in open space.In order to avoid high investment costs and optimization of the synthetic process associated with introducing a new chemical to the market, repurposing an existing chemical for the curing of epoxy matrices is very appealing. In order to adhere to our previously established requirements, potential chemicals should be bio-based and present no health risk, allow for easy curing even at low temperatures, and be widely available without negative connotations. Prime candidates for curing activation at lower temperatures are fruit-based acids such as Citric Acid (CA), Malic Acid (MA), and Tartaric Acid (TA), which are already produced at large scales and that can be obtained through fermentation and extraction methods,21–24 although the large majority of the current MA production still starts from the fossil based maleic anhydride.25
CA in particular has been investigated in recent years as a curing agent, because of its wide availability and potential given that it is a multifunctional acid bearing three COOH groups. CA has been used in conjunction with small amounts of water to liquefy the acid, which was successful in activating the acid for curing below its melting point (Tm),26 but required a convoluted multi-day procedure and relied on water as the liquefier, which itself can react with epoxy without forming a cross-link. Another group obtained a completely bio-based thermoset using CA to cure ELO,27 but employed tetrahydrofuran (THF) for the procedure, which was evaporated during the curing process. While this is an elegant way to end up with a fully bio-based material, THF bears potential health risks and does not allow for easy storability of the CA/THF hardener mixture.
We have recently shown that, by creating an eutectic mixture of the multifunctional CA using a liquefier (ethyl lactate – EL), one can effectively lower the Tm of CA and activate it for curing at lower temperatures.28 An eutectic mixture is a formulation of two or more components that combined have a melting point lower than any of the individual components making up the mixture.29 While eutectics have been used in a plethora of industrial applications,30–39 this was the first time it has been used in the form of a hardener system with the primary purpose to reduce the melting point of an otherwise inert component at room-temperature. Furthermore, the liquefied component can be stored and thus remains available for curing reactions months after its preparation. Driven by the fact that, in industry, the best performing hardeners are usually mixtures of molecules,40,41 the present study will elaborate on these findings and extend the concept of eutectic hardeners to mixtures of natural acids. Specifically, eutectic hardener (EH) formulations will be prepared by mixing CA with other natural acids such as MA and TA, investigating the altered curing behaviour and final material properties.
Methods
Nuclear magnetic resonance (NMR)
NMR spectra were recorded on a Bruker AVANCE III (400 MHz). 1H-NMR chemical shifts are given in reference to the residual solvent peak of CDCL3 at 7.26 ppm.Fourier transform infrared spectroscopy (FTIR)
A Bruker Tensor 27 FTIR spectrometer equipped with a liquid nitrogen cooled MCT detector and single-reflection diamond ATR device was used to record IR spectra. The curing at room temperature was studied by taking spectra of the same sample in time intervals. The spectrum of air was recorded as background before each measurement. A total of 128 scans with a resolution of 1 cm−1 were recorded for each sample.Rheology
Curing studies were performed on a Thermo Scientific HAAKE MARS rheometer. Isothermal curing measurements were obtained in plate–plate geometry (25 mm diameter, 1 mm gap, 0.5% strain) at varying temperatures (24, 30, 35, 40, 45, 50, 55, and 60 °C). The variations of the complex viscosity and storage and loss modulus depending on isothermal curing temperature were analyzed.Dynamic mechanical thermal analysis (DMTA)
The dynamic mechanical properties were studied using a Mettler-Toledo DMA-1 in tensile mode. Samples were tested in temperature sweeps from −50 °C to 180 °C with a heating rate of 2 °C min−1. Experiments were done in a single frequency oscillation mode with a frequency of 1 Hz, a force amplitude of 0.1 N and a displacement amplitude of 0.1% in auto tension offset control. To reduce measurement variations, three measurements were performed and an average curve was created using the origins average multiple curves function.Thermogravimetric analysis (TGA)
TGA was performed with a TGA/DSC3+ instrument from Mettler-Toledo. Samples were studied at a heating rate of 10 °C min−1 under air flow (80 mL min−1).Shore A & D hardness test
The hardness of the rubbers was determined using Shore A and Shore D type durometers. The hardness was determined according to ASTM D2240 in a temperature regulated room at 23 °C. Shore D hardness was only determined for materials with a Shore A value exceeding 80 for at least one of the measurements.Gel fraction and swelling ratio
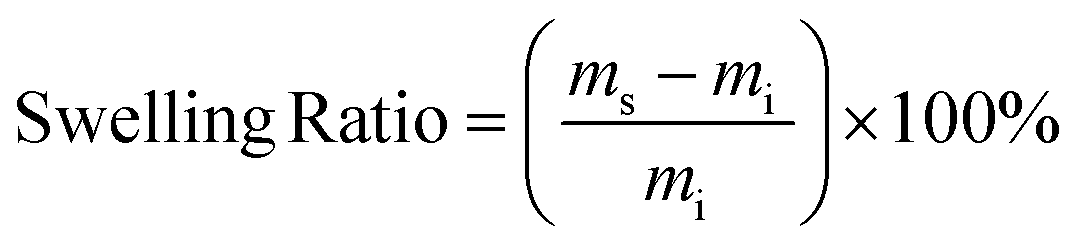
The gel fraction and swelling ratio of samples was determined in a 20 mL vial by covering vacuum dried samples with a mass of ∼200 mg with 5 mL of THF. Samples were kept for 7 days at room temperature after which the samples were removed from the vial and quickly dried with paper before determining the weight of the swollen sample. Then, samples were dried in a vacuum oven until a constant weight was reached. The gel fraction and swelling ratio were calculated according to the following two equations: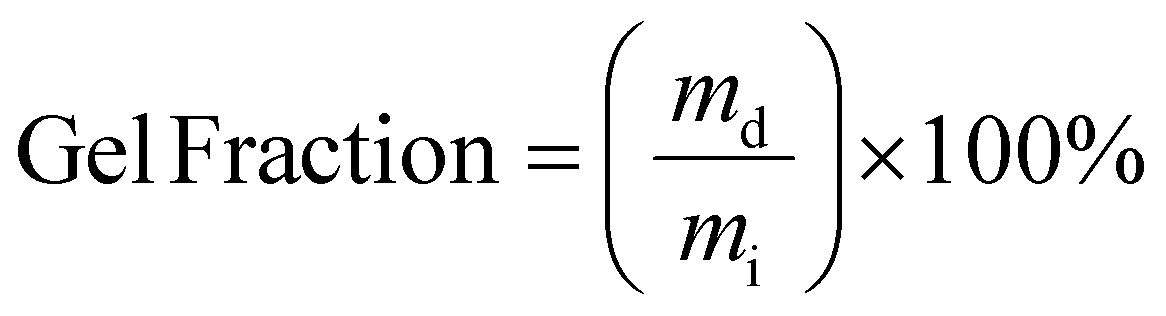
with mi, ms and md being the initial, swollen and dry mass, respectively.
Tensile tests
Tensile tests were performed with a Shimadzu EZ-LX tensile tester equipped with a 1 kN load cell. The tests were performed on dog bones (l = 48 mm, w = 5.1–5.3 mm, t = 1.9–3.5 mm) cut from cured 19.6 × 19.6 cm square slabs of the respective material. The exact sample dimensions were determined for each sample before testing. A grip-to-grip separation of 35.92 mm was used. The samples were prestressed to 0.1 N and then loaded with a constant crosshead speed of 20 mm min−1.Materials
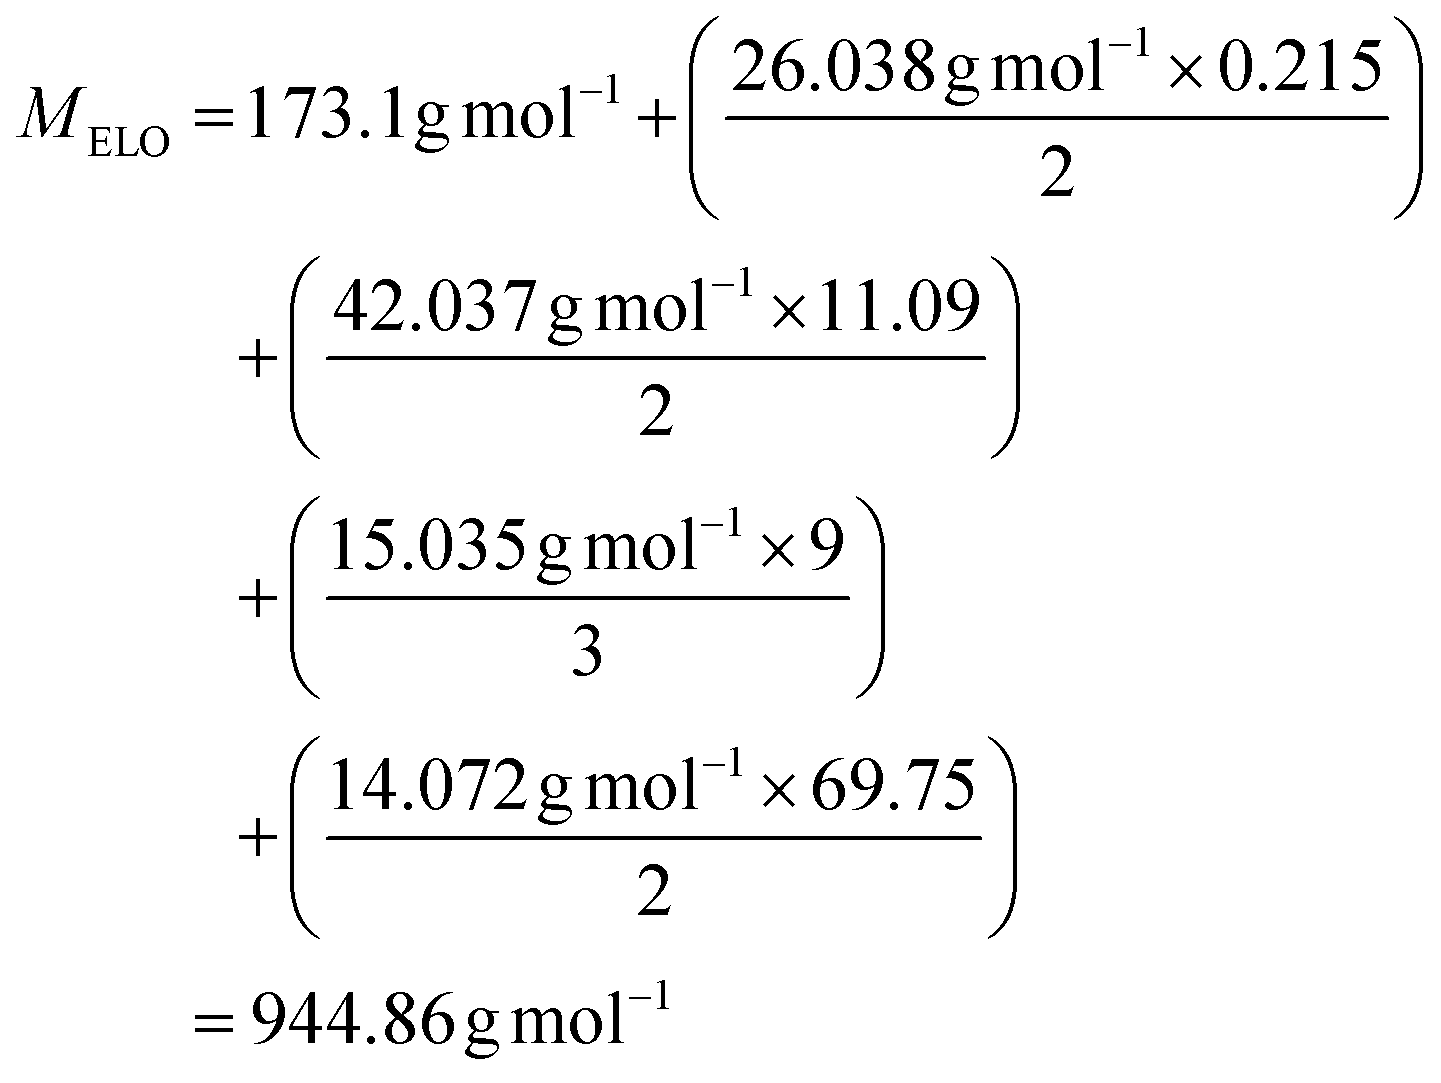
Epoxidized Linseed Oil (ELO) was kindly provided by Valtris Chemicals (molecular weight of 980 g mol−1 and average of 5.5 epoxy groups per molecule) and used as received. The amount of epoxy per molecule was determined by the supplier via non-aqueous potentiometric titration (ASTM D 1652). Citric acid (ACS reagent, ≥99.5%), L-(+)-tartaric acid (≥99.5%), DL-malic acid (≥99%), and (−)-ethyl L-lactate (98%) were purchased from Sigma-Aldrich (now MERCK) and used as received. The precise amount of epoxy groups in ELO and its molecular weight were also determined by NMR (Fig. S1†). The integration of the single glycerol CH was set as 1, which allows one to determine the number of epoxy groups per molecule according to eqn (S1)† (eqn (1)): | (1) |
 | (2) |
Thermoset preparation
Example formulation calculated for R Eutectic = 1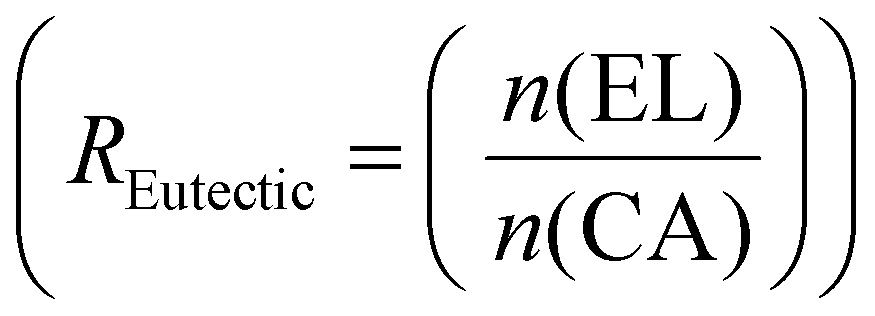 and RELO = 0.8
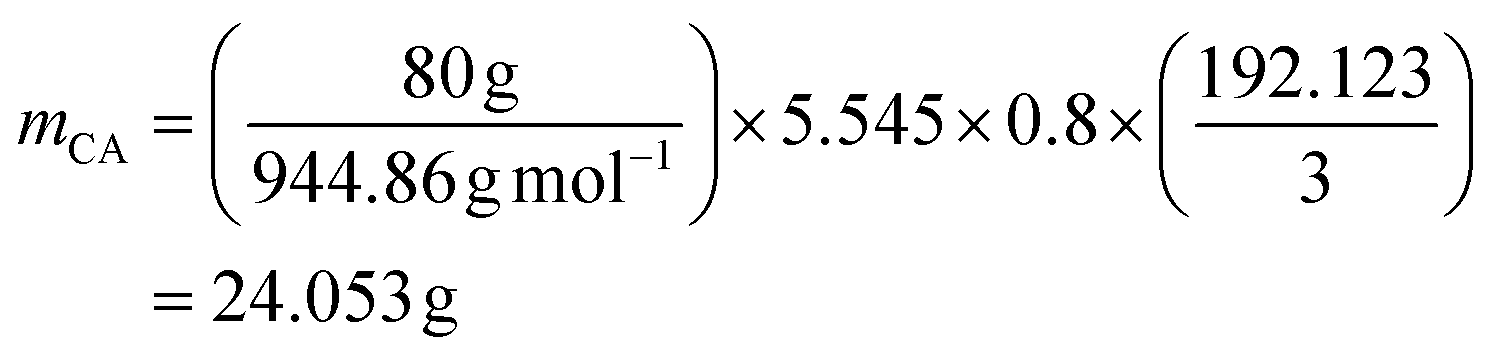
 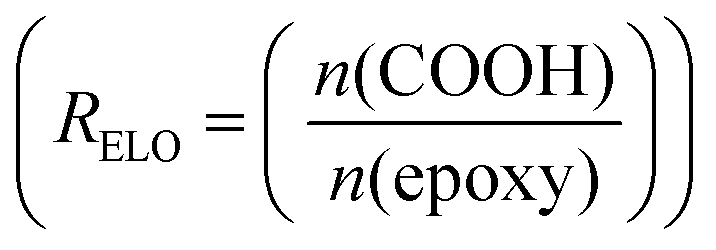 : To obtain the desired thickness of ∼3 mm inside a 196 × 196 mm mold we found that starting with 80 g ELO is appropriate. The rest of the required material was calculated based on that. The amount of required CA is calculated as follows (eqn (3)):
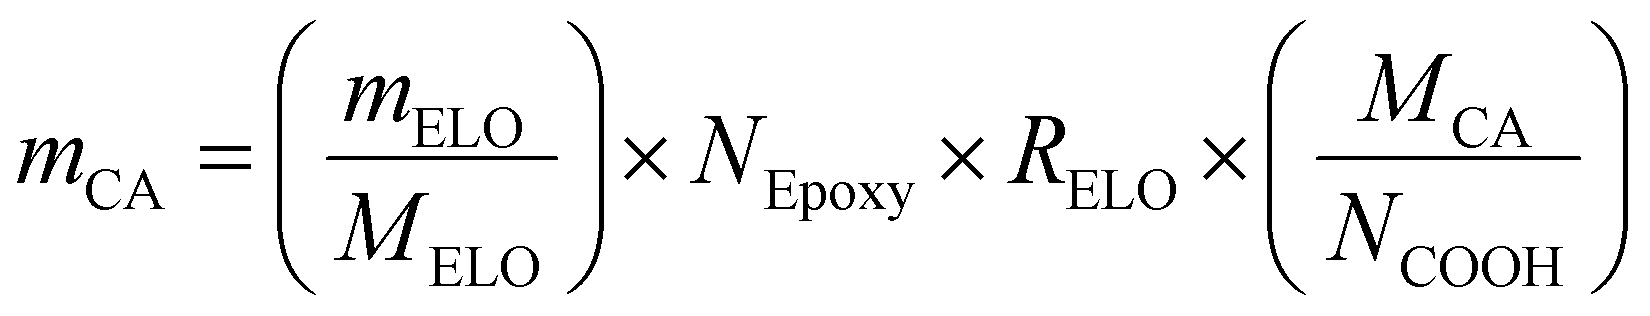 | (3) |
The required amount of EL is then calculated as follows (eqn (4)):
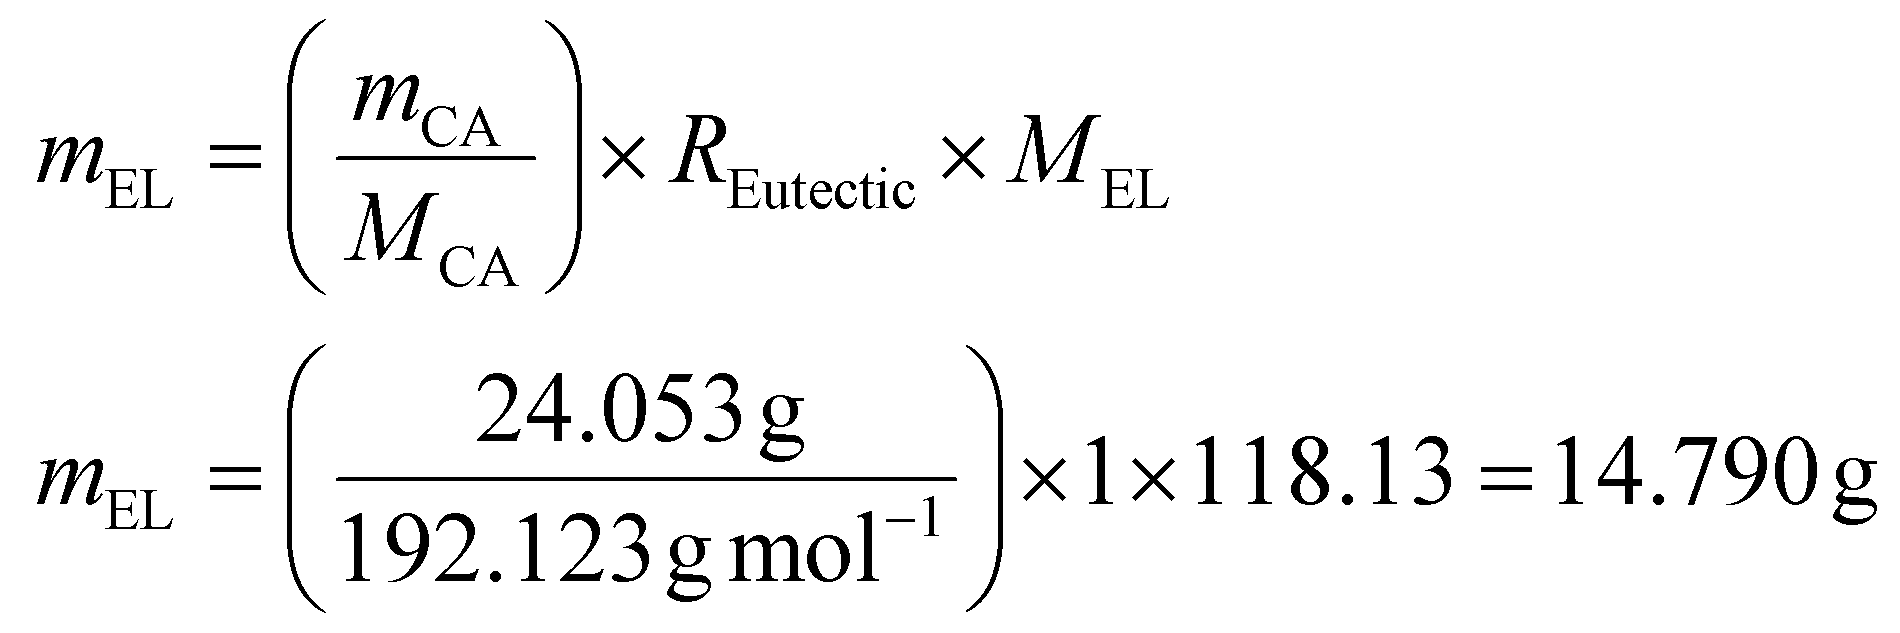 | (4) |
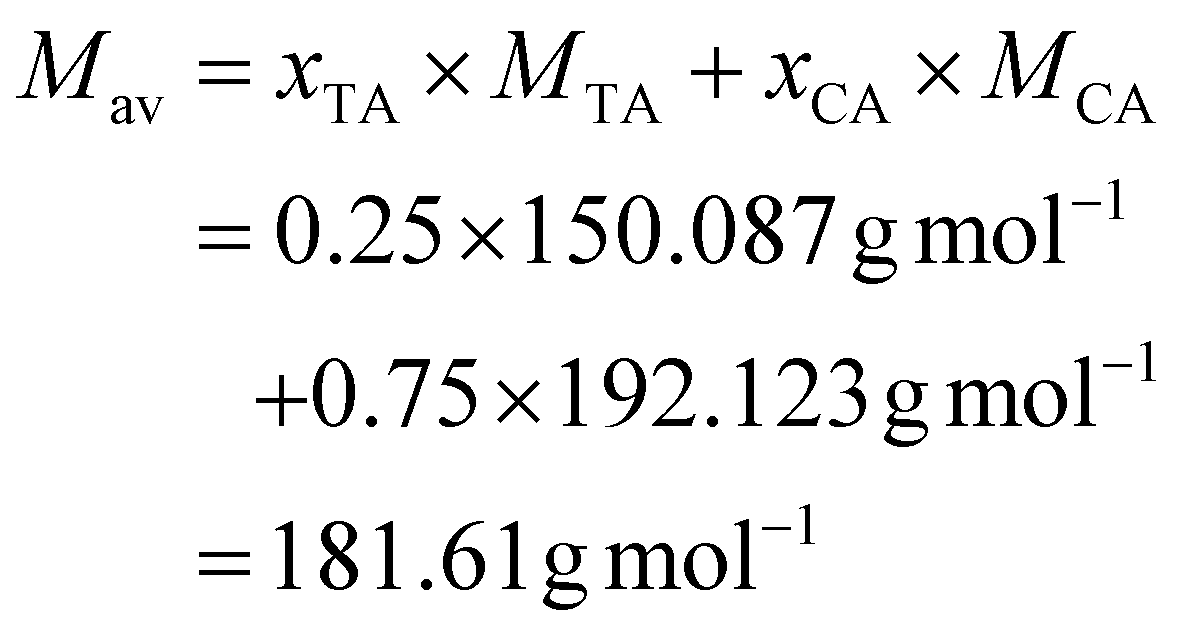
The calculation for mixtures of the natural acids had to be adapted, since CA has 3, whereas TA and MA have 2 COOH moieties. This is taken into account in the calculation by using the average number of COOH groups (Xav) and molecular weight (Mav) of the mixture. The calculation is as follows, using 25% TA, 75% CA, and a 1![[thin space (1/6-em)]](https://www.rsc.org/images/entities/char_2009.gif) :1 ratio of acids (combined) to EL as an example (eqn (5)):
:1 ratio of acids (combined) to EL as an example (eqn (5)):
 | (5) |
The average amount of COOH groups is obtained according to eqn (6).
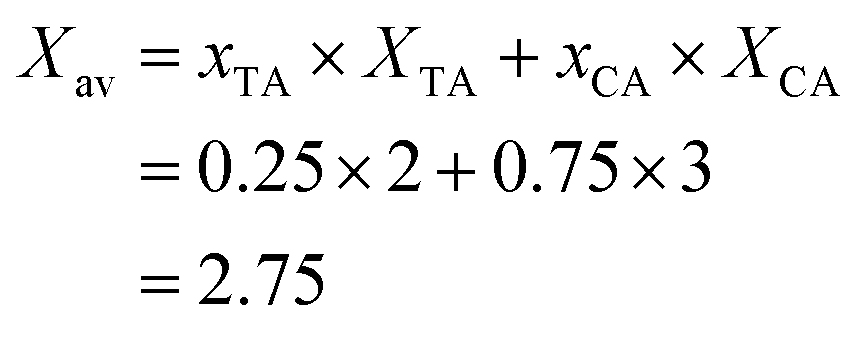 | (6) |
The amount of hardener is then calculated, again a based on a starting amount of ELO of 80 g using eqn (3). The outcome of that calculation is the amount of the combined hardener that has to be added. From that, the actual amount of TA and CA required is calculated back. The amount of EL needed can also be calculated from eqn (4), switching the molecular weight of CA with the average molecular weight of the mixture which was calculated above. To obtain a homogenous and liquid mixture of CA, MA, TA, and EL, they are heated together at 140 °C until they become fully liquid (∼5–15 min) and cooled to 60 °C in an oven. Before mixing with the Eutectic Hardener (EH), ELO is kept at roughly 60 °C to melt residual crystals (ELO tends to partially crystallize at room temperature over time). Then, ELO and EH are mixed using a spatula at 60 °C, poured into a rectangular mold, and cured in an oven at 60 °C for 1 h. This pre-curing step ensures that air bubbles are taken out of the system. A subsequent post-curing step at 160 °C is carried out for 2 h, ensuring full consumption of oxirane groups.
Results and discussion
To elaborate on the concept of using eutectic hardeners (EH), the naturally occurring dicarboxylic acids Malic Acid (MA) and Tartaric Acid (TA) were investigated as eutectic curing agents. In addition, mixtures of TA and MA with the trifunctional Citric Acid (CA) were investigated. Ethyl Lactate (EL) was used as a liquefactor, which, together with the acids, creates the EH and ensures low viscosity and processability. TA and MA are particularly interesting for comparison, as they are structurally similar, having the same carbon back bone and both being di-functional acids, with the only difference originating from the missing hydroxy group on the γ-carbon of MA. The structure of the employed acids and their published pKa values42,43 are given in Fig. 1. The structural difference between TA and MA results in lower pKa values for TA and the rotational freedom is different for these two acids due to the additional hydrogen bonding of TA, which could have implications for the hardened thermoset, since it provides an extra possibility for epoxy ring opening (etherification) or an additional hydrogen bonding for intramolecular bonds.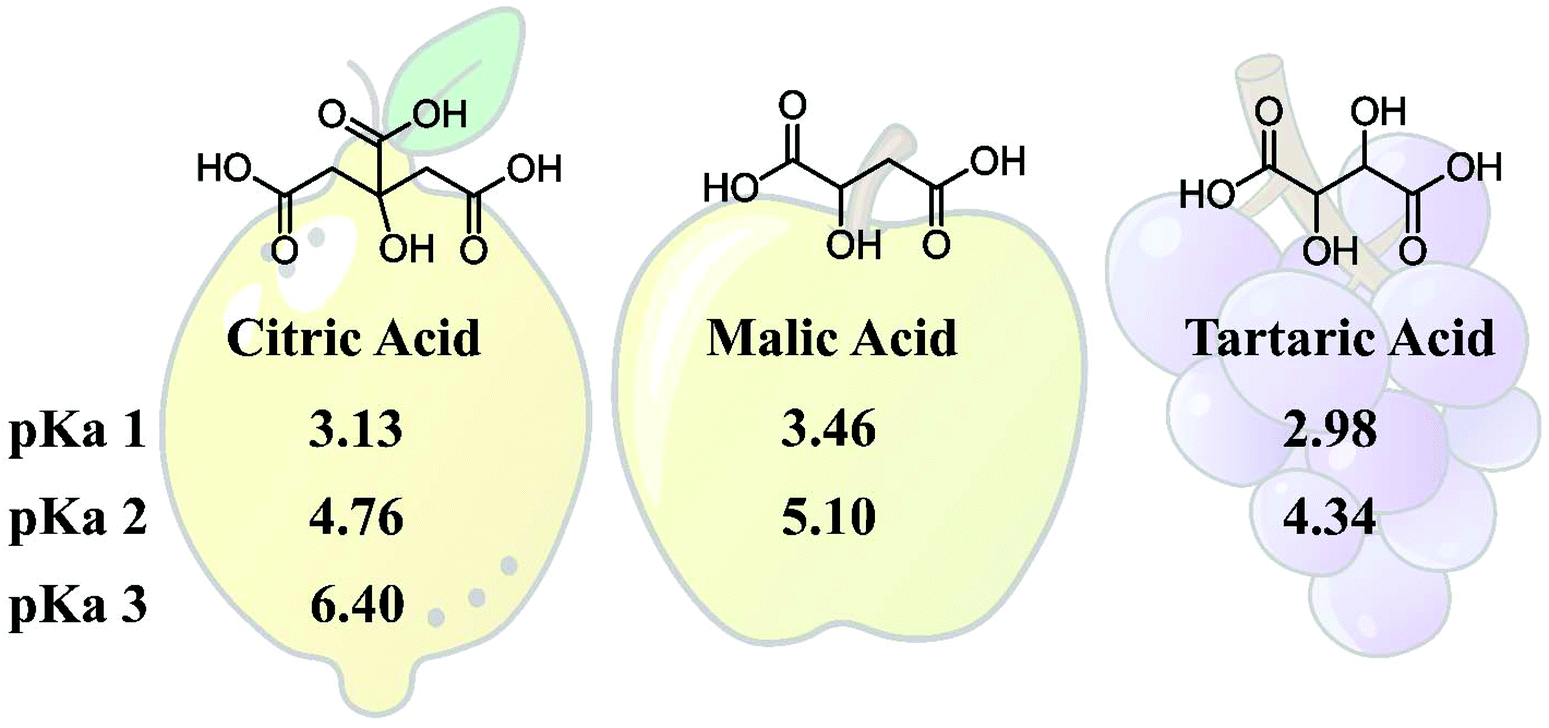 | ||
| Fig. 1 Structure of Citric Acid (CA), Malic Acid (MA), and Tartaric Acid (TA), and their pKa values.42,43 | ||
We previously analyzed the EH based on CA and EL alone and determined the melting point of different molar mixtures of the combined system (Fig. S2†). Initially, mixtures of just MA and TA mixed with EL were prepared, which brought to light a limited number of detrimental issues precluding their use in molecular form at room temperature. For mixtures between MA and EL, the MA tended to spontaneously crystallize over time, which could be anywhere from 20 minutes to a day. Mixtures were stable above 60 °C and thermosets could be prepared at 60 °C and higher (vide infra) to make homogenous and fully cured samples. For mixtures of TA and EL another issue arose. We found that TA reacts when kept together with EL above 100 °C for prolonged periods of time. In fact, it appears that the reaction products are what allows a homogeneous eutectic mixture to be formed between TA and EL, because it takes significantly longer than for mixtures of CA or MA with EL. The NMR spectrum of a 1:1 molar mixture of TA and EL (homogenized for ∼30 min at 140 °C) revealed a plethora of new signals compared to the individual components alone (Fig. S3†). The signals next to the ethyl lactate ethyl ester signals suggest that transesterification between TA and EL occurred, but no attempt has been made to isolate individual components at this point. In contrast, an NMR spectrum of an equimolar CAEL mixture after homogenization (∼5 min at 140 °C) does not show any new signals (Fig. S4†). TGA measurements further corroborate these results. In an isothermal measurement at 160 °C, and thus above the evaporation temperature of EL, EH of TA100 and CA100 first show a significant mass loss corresponding to evaporating EL, which in case of CA100 fully evaporates within 2 h, whereas TA100 samples show a higher remaining mass than what would be expected from the amount of EL added (Fig. S5†). If TA undergoes a transesterification with EL, the resulting TA ethyl ester would not evaporate due to significantly higher molar mass than EL at 160 °C, explaining the larger residual mass.
The reaction of TA and crystallization of MA can be circumvented by using mixtures of the acids in the EH formulations. Specifically, different molar mixtures of CAMA and CATA mixtures were explored. EHs were prepared by mixing CA with either MA or TA in varying molar ratios of 3:1, 1:1, and 1:3 (i.e. 75, 50, and 25 mol% of the respective acid). For example, 75 mol% CA is mixed with 25 mol% of either MA/TA and combined with an equimolar amount of EL, in the case of the combined substance of CA and MA/TA. Samples prepared with these EHs are abbreviated using the respective mol% of the acid, so CA75MA25 in this case. Homogenization of these mixtures was achieved by heating at 140 °C for 5 min. When MA was used, this was sufficient to obtain a clear liquid mixture that was stable upon cooling to room temperature. CA75TA25 homogenized readily within the 5 min timeframe, but higher contents (i.e. 50 and 75 mol% of TA) required more time and led to slight discoloration which we attribute to TA reacting with EL. This also manifested in the material properties of samples obtained with larger amounts of TA (vide infra). When comparing the mixtures, a difference in viscosity becomes quickly apparent because CAMA mixtures show significantly reduced viscosity compared to CA100 and CATA mixtures. The viscosity of these mixtures, determined through a rheology frequency sweep at 24 °C, is plotted in Fig. 2. It stands to reason that the missing hydroxy group in MA compared to TA is the reason for this significantly lower viscosity. At least in the crystal, it has already been shown that both hydroxy groups of TA participate in hydrogen bonding,44 connecting the TA units in a network that is not possible for MA. This is the likely explanation for the higher viscosity of the TA containing samples. Since the viscosity of EHs has a considerable influence on the properties and thus our ability to obtain homogenous samples,45 controlling the viscosity is of great interest. Sufficiently low viscosity is desired to properly mix the resin with the hardener to avoid a potential pre-heating step. In this case, using MA as part of the EH to control the viscosity presents a significant advantage.
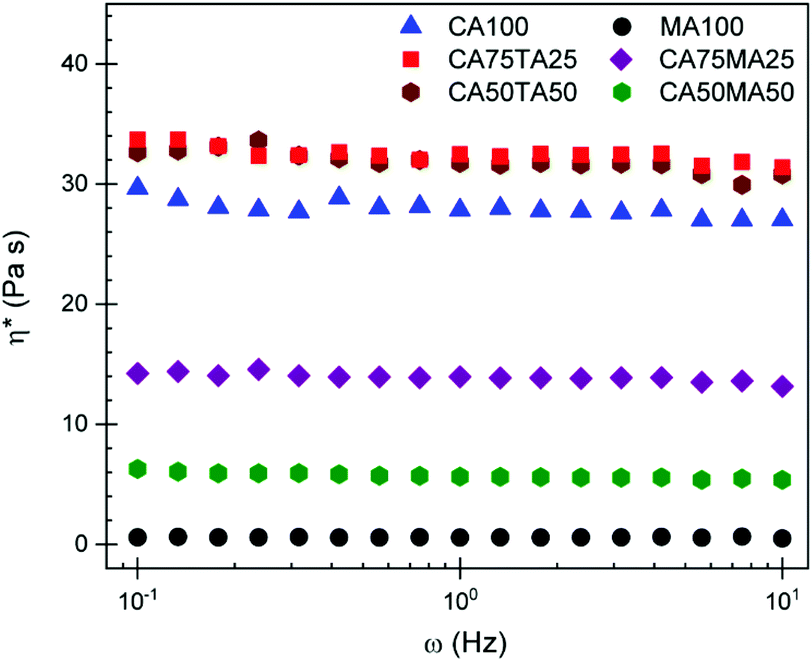 | ||
| Fig. 2 Viscosity of acid and ethyl lactate mixtures measured through a frequency sweep at 24 °C. The number behind the acid abbreviation stands for the respective ratio in mol%. | ||
The major focus of the current study was to investigate how reaction rate, activation energy, and final material properties would change in comparison to the single acids. We previously studied the effect of changing liquefier concentration and thus fixed the molar ratio of EL to acid molecules at a constant 1 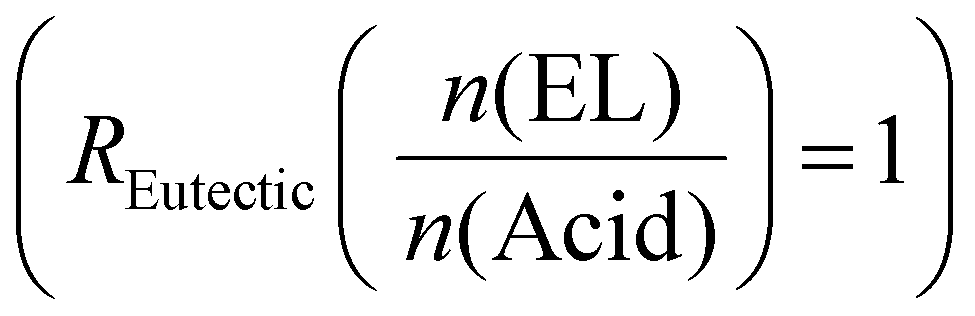 . Since CA has three COOH functions and TA and MA only have two, the average changing total number of COOH moieties had to be considered when mixing the acid. The ratio of COOH groups to oxirane moieties was kept constant at 0.8 based on previous investigations,28,46 which resulted in the highest enthalpy release during curing. This off-stochiometric ratio of COOH to epoxy groups resulted in the highest reaction enthalpy and full consumption of epoxy groups (vide infra), because the CA hydroxy groups and the hydroxy groups generated from the epoxy ring opening are also able to react with the remaining epoxy groups.47,48 We chose epoxidized linseed oil (ELO) as the epoxy matrix due to its green synthesis, cheap cost, and general availability.2,49
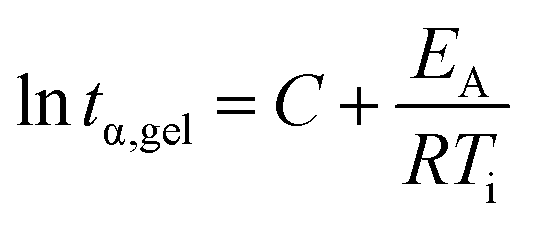
Rheometry was employed to investigate the curing behavior. Isothermal curing was carried out at multiple temperatures, monitoring the development of the storage G′ and loss modulus G′′. The cross-over point of these two factors is known as the gel point (tα,gel), the point where a gel is formed due to the progressing cross-linking. A typical curing curve is displayed in Fig. S6.† The gel point is always at the same conversion α for the same material, regardless if a different temperature is applied. This iso-conversional phenomenon can be used to determine the activation energy EA of gelation using the following equation:50–53
 | (7) |
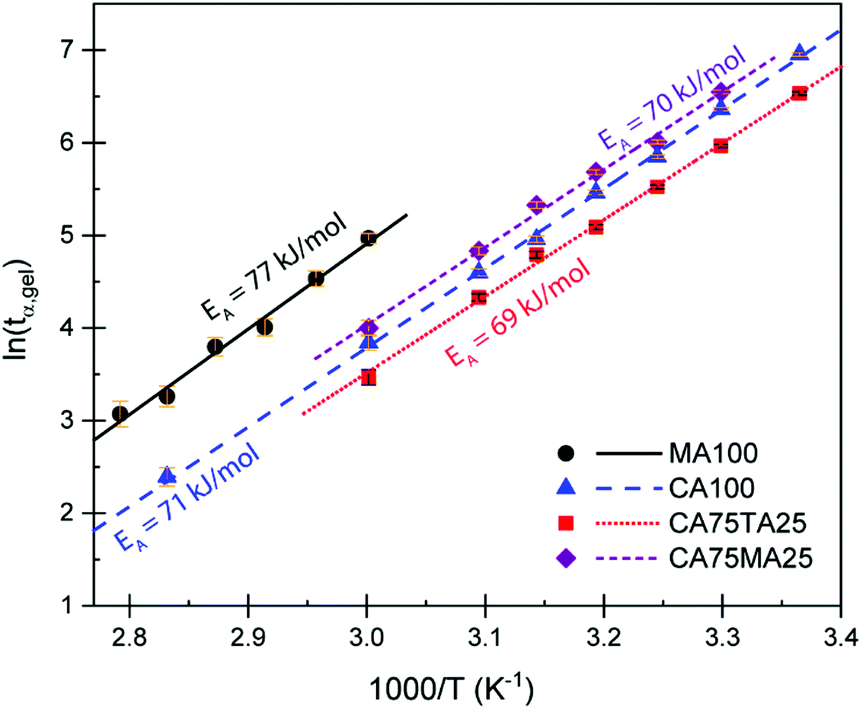 | ||
| Fig. 3 Plot of the determined gel points (tα,gel) for samples cured at different temperatures vs. the inverse curing temperature. For all samples, a ratio of acid molecules (not COOH moieties) to EL of 1 was maintained, considering both acids when mixtures were used. The number next to the acid abbreviation represents the respective content of acid in mol% (e.g. CA75TA25 = 75 mol% citric acid and 25 mol% tartaric acid). | ||
To study the mechanical properties of materials cured using the acid mixtures, rectangular samples with a thickness of 3–4 mm and size of 19.6 cm × 19.6 cm were prepared by pouring the combined reactive mixture of EH and ELO into suitable rectangular molds. Samples were then cured at 60 °C for 1 h. This step facilitated the removal of air bubbles. Then, a post curing step at 160 °C was carried out for 2 h to fully cure the thermoset. The complete consumption of oxirane groups was confirmed via FTIR measurements through the disappearance of the oxirane band at 821 cm−1 (Fig. 7). The resulting thermoset slabs were sufficiently large so that all subsequent tests were carried out on the same batch. DMTA measurements were employed to investigate how the dynamic mechanical properties of the final materials could be influenced using the natural acid mixtures. Suitable samples were cut from the cured rectangular slabs and tested from −50 °C to 150 °C, following the evolution of E′ and tan delta. Fig. 4 shows the average storage modulus (E′) and tan delta of samples cured with CA100, CA75TA25, and CA75MA25. We observed an average glass transition temperature – Tg (determined from the peak maximum of tan delta) of 23 ± 1 °C for CAMA, 27 ± 1 °C for CA100, and 31 ± 1 °C for CA75TA25. At room temperature, samples prepared with 75 mol% of CA and 25 mol% of TA appear to be consistently stiffer than those where only CA is used, which is also reflected in their apparent hardness determined via shore hardness tests (Table 1) and tensile properties, which will be discussed in detail at a later stage. Since the Tg window of these samples under regular conditions is above and below room temperature, slight variations of the Tg can change the apparent material properties quite profoundly at RT. Similar to the observed Tg, the value of the rubbery plateau modulus decreases in the order of CA75TA25 > CA100 > CA75MA25, which highlights the difference in terms of cross-link density.
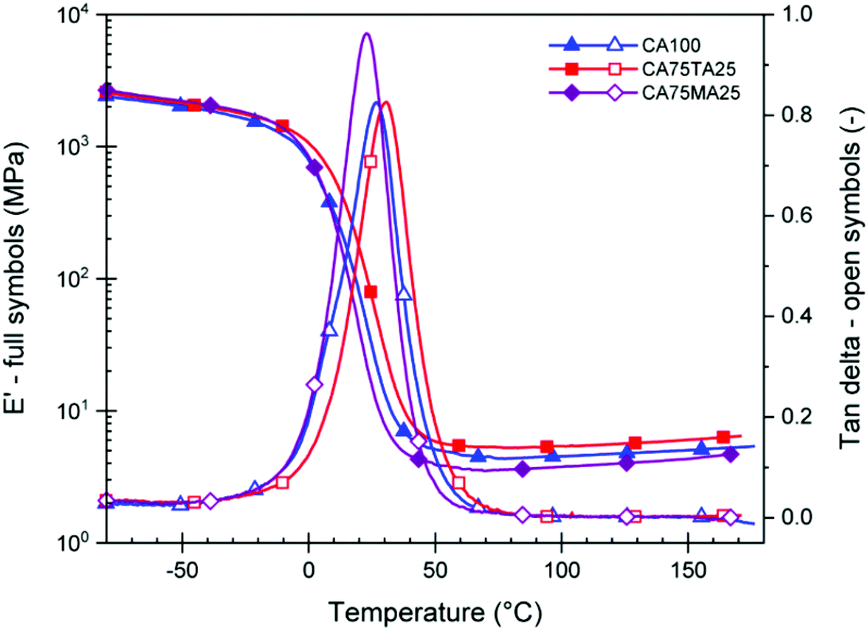 | ||
Fig. 4 DMTA data (−50 °C to 150 °C, 1 Hz, 0.1% strain) of thermosets cured with  and EH using a fixed COOH/oxirane group-ratio of 0.8. The numbers behind the acid abbreviation represent the molar percentage of acid used. The symbols are intended to help differentiate the curves and do not represent the data points. and EH using a fixed COOH/oxirane group-ratio of 0.8. The numbers behind the acid abbreviation represent the molar percentage of acid used. The symbols are intended to help differentiate the curves and do not represent the data points. | ||
 using a COOH/oxirane group-ratio of 0.8
| Sample | Tensile data | Shore hardness | Swelling ratio (%) | Gel fraction (%) | ||||
|---|---|---|---|---|---|---|---|---|
| E (MPa) | σ Y (MPa) | ε B (%) | Toughness (J m−3) | Type A | Type D | |||
| With E = Young's modulus; σY = tensile strength at yield point; εB = strain at break. | ||||||||
| CA100 | 33 ± 4 | 6 ± 1 | 51 ± 4 | 0.64 ± 0.11 | 85 ± 4 | 24 ± 2 | 88.1 ± 6 | 89 ± 1 |
| CA75MA25 | 55 ± 10 | 4.6 ± 0.9 | 55 ± 8 | 0.65 ± 0.16 | 78 ± 3 | 19 ± 2 | 105.9 ± 6 | 89 ± 4 |
| CA50MA50 | 17 ± 3 | 2.8 ± 0.7 | 57 ± 10 | 0.44 ± 0.16 | 71 ± 3 | 118.4 ± 3 | 90 ± 3 | |
| CA25MA75 | 14 ± 4 | 2.3 ± 0.4 | 59 ± 6 | 0.38 ± 0.09 | 65 ± 2 | 125.4 ± 23 | 86 ± 2 | |
| MA100 | 8 ± 1 | 1.7 ± 0.5 | 59 ± 10 | 0.24 ± 0.08 | 55 ± 2 | 146.4 ± 8 | 81 ± 4 | |
| CA75TA25 | 243 ± 26 | 7.4 ± 0.5 | 30 ± 2 | 0.75 ± 0.08 | 92 ± 3 | 38 ± 3 | 82 ± 6 | 90 ± 2 |
| CA50TA50 | 20 ± 3 | 3 ± 0.6 | 62 ± 9 | 0.44 ± 0.12 | 68 ± 3 | 124 ± 11 | 83 ± 3 | |
| CA25TA75 | 5 ± 2 | 1.1 ± 0.1 | 73 ± 8 | 0.19 ± 0.05 | 47 ± 5 | 151 ± 10 | 78 ± 2 | |
| TA100 | 3 ± 0.5 | 0.8 ± 0.3 | 68 ± 4 | 0.19 ± 0.02 | 47 ± 2 | 158 ± 18 | 73 ± 2 | |
Furthermore, we see a consistent Tg difference between samples containing the same mol percentage of MA and TA (Fig. S8†). This was observed for all samples with 25 and 50 mol% of TA and MA. Despite the issues concerning larger amounts of TA, which lead to a decreased rubberry plateau modulus for CA50TA50 compared to CA50MA50, the TA containing materials displayed a consistently higher Tg due to the increased stiffness of this acid compared to MA.
To obtain further information about the network density of these samples, the gel fraction and swelling ratio were determined as a function of their composition. To do this, samples were submerged in THF for 24 h and weighed in their swollen and dry state (details in Experimental section). These data are displayed in Fig. 5A and B. Gel fractions for CA samples are in the low 90th percentile. Values of 95%+ are not reached with this EH because of the liquefier EL that was used, which is not incorporated in the matrix and gets partially washed out. We see the gel fraction drop with increasing TA content due to the thermal instability of TA during the homogenization procedure, which we determined during the preparation of the EH mixtures. As mentioned previously, low amounts of TA can be quickly incorporated in the CATA mixture, thus avoiding significant reaction of TA. The preparation time increases with a higher content of TA, and during this time TA is prone to react, which resulted in diminished material properties. More telling is the swelling ratio data. For chemically similar samples, a higher swelling ratio means that the network density is lower.54 We find a slightly lower swelling ratio for CA75TA25 compared to CA100, which is again lower than the swelling ratio of CA75MA25 cured samples, which is in line with the DMTA results that indicated the same order in terms of cross-linking density, thus corroborating these findings.
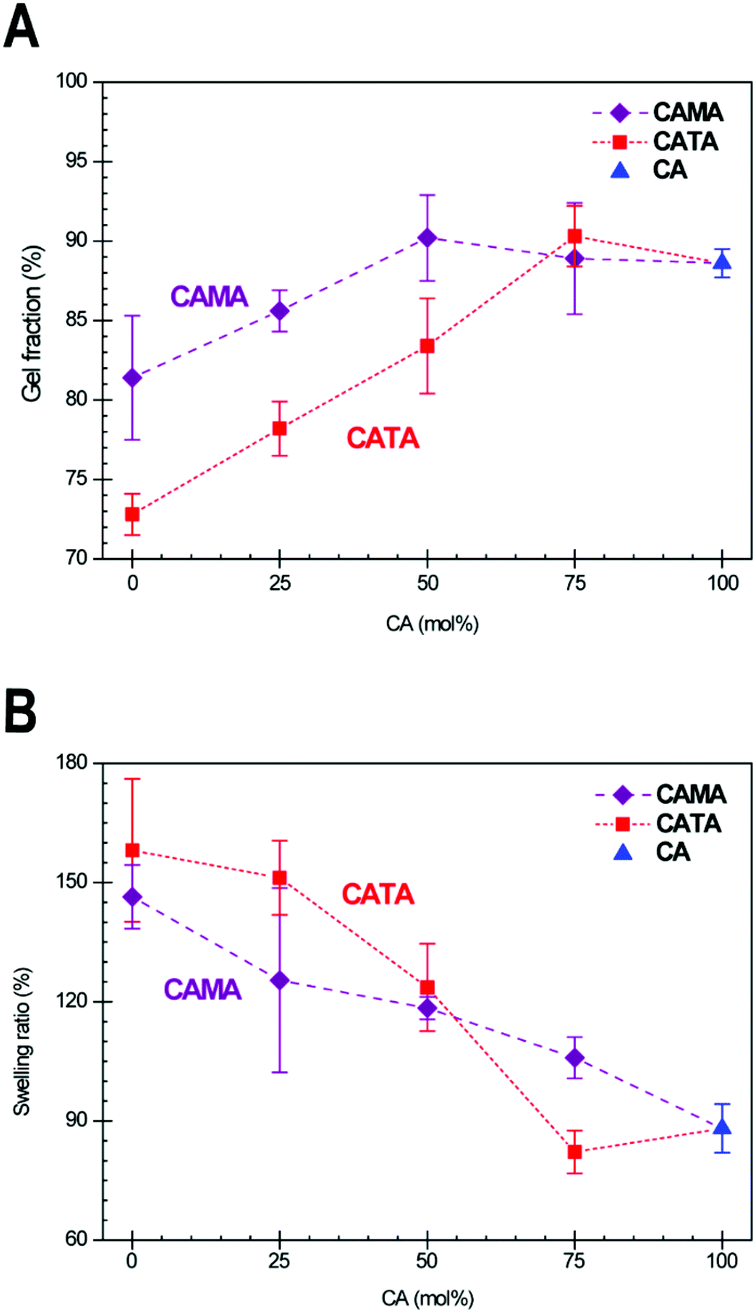 | ||
| Fig. 5 Determined gel fractions (A) and swelling ratios (B) for CA (one data point; blue triangle), CATA (red squares), and CAMA (purple diamonds) samples, which were all cured using the HTP protocol. For each data point, five samples were tested, and the result is given as the average of those measurements. The abscissa gives the fraction of CA in mol%, with the respective missing fraction being made up of either TA or MA depending on the data point. The dashed lines are meant to guide the eye to samples containing the same acid mixtures. | ||
DMTA also allowed us to determine the influence of ageing on the samples (Fig. S9†). This investigation was initially motivated by the question about whether leaching of EL will influence the mechanical properties of the thermoset over time. For that, starting from sample A, (i.e. freshly cured sample which was equilibrated 24 h at room temperature at (∼50% relative humidity) we remeasured DMA of the samples left for one year at room temperature (∼50% relative humidity) in a cabinet of the laboratory (sample B in Fig. S9†). This was followed by treatment in the oven at 120 °C with applied vacuum of the same sample, remeasuring (sample C in Fig. S9†), and finally a remeasure after an additional re-equilibration 24 h at room temperature (sample D in Fig. S9†). For both formulations, the samples B, i.e. measured after one year aging, revealed a significantly reduced Tg of about 6–7 °C compared to the initial value of samples A. We previously showed,28 that with decreasing amount of EL, the Tg of the final material increases, which we expected to see in case any additional EL leached from the sample. After treatment of these samples in the vacuum oven, a significantly higher Tg is obtained for sample C (Fig. S9†), which could be due to the removal of additional EL. However, after leaving those samples for 24 h at room temperature, the Tg of sample D is back to the value observed before for sample A. This results hints at absorbed moisture as the cause for the lowered Tg,55 as it interrupts the hydroxy hydrogen bonds in the ELO matrix and Hardener, thus acting as a plasticizer. Indeed, in TGA measurements of the 1+ year old samples (Fig. S10A†), we observe a significant mass loss at temperatures above 100 °C, followed by a two-step degradation process typical for ELO based thermosets.46 Subsequently, we conducted TGA measurements of a freshly cured sample, followed by TGA of the same sample after 24 h, and lastly a TGA run immediately after drying the sample stored for 24 h for 2 h at 90 °C in a vacuum oven (Fig. S10B†). The first run showed a mass loss of only 3%, corresponding to residual EL in the system. After leaving the sample for 24 h, about 3.5% in weight of moisture was absorbed, which could be removed through drying in vacuum, bringing the weight loss during the isothermal TGA measurement back to 3% (sample c in Fig. S10B†) i.e. corresponding to the residual EL which cannot be removed by drying at 90 °C. These corroborate the findings that moisture is responsible for the diminishing Tg of aged samples observed during DMA tests. The ∼3% of EL that remains trapped in the system has thus no impact on the evolution of thermo-mechanical properties with time.
It may be also noted here, that preparing samples without using the liquefier EL, so just the acids, yields samples with very poor quality due to insufficient mixing of the acids during melting. An example was highlighted in Fig. S11† where a sample was prepared only with solid CA mixed with ELO and compared with the same sample employing the eutectic mixture. The bad mixing leads to samples with heterogeneous distribution of cross-links attested by a much broad Tg compared to the CA100 prepared with the EL. Moreover, a lower cross-link density for the non-eutectic sample, evidenced by the lower observed rubber plateau during DMA, is obtained for the non-eutectic sample compared to the sample prepared with EH. Furthermore, the insufficient curing using only the acid CA is immediately evident from the appearance of the obtained samples shown in the inset pictures of the graph in Fig. S11.† This reveals the importance of using the liquefier during the mixture and the curing to obtain homogeneous and easy to pour samples.
Finally, we investigated how the tensile properties were affected by the acid mixtures and whether adding small amounts of other acids can result in a better performing material than using a single acid. Tensile testing was performed on all samples. The collected data is given in Table 1. In Fig. 6, the tensile strength, toughness, and strain at break are plotted as a function of the molar composition of acids. Materials containing 50 mol% of TA or MA and more, up to TA100 and MA100 follow a general trend. Despite the additional potential of hydrogen bonds with TA, the simple truth is that the samples containing 50 mol% of more of TA have lower toughness, tensile strength, yet higher strain at break due to the reduced crosslinking density, which is the results of the reactions of TA with EL during the preparation stage. The mixtures with 25 mol% of difunctional acid TA added proved to be the most interesting. Despite a lower strain at break, samples cured with CA75TA25 show an increased tensile strength and, most importantly, have the overall highest toughness, showcasing the validity of using mixtures of acids. Furthermore, the stiffness is considerably higher (E = 243 MPa in CA75TA25 compared to e.g. 33 MPa in CA100), which, as mentioned before, was also reflected in the shore hardness test (Table 1). We believe this is caused by a slightly higher average Tg of the CA75TA25 cured samples that was determined during DMTA.
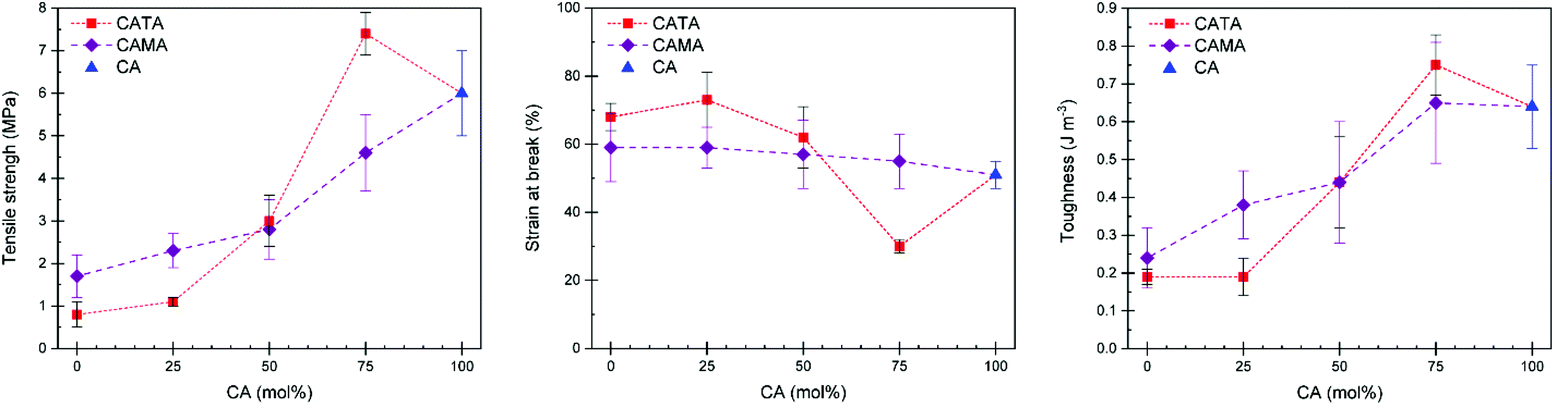 | ||
| Fig. 6 Tensile strength (left), strain at break (middle), and toughness (right) of CAMATA materials as function of acid composition. The abscissa gives the fraction of CA in mol%, with the respective missing fraction being made up of either TA or MA depending on the data point (red squares = TA containing; purple diamonds = MA containing). The dashed lines are meant to guide the eye to samples containing the same acid mixtures. | ||
Samples with 25 mol% of MA have similar properties compared to CA100, whereas when 50 mol% of MA is added it shows a considerable drop in terms of mechanical properties (Table 1). As we demonstrated earlier, despite a significant reduced viscosity of the EH mixture with 25 mol% of MA, the material properties are largely the same as the CA100 cured sample. Thus, using MA as part of the EH mixture can result in significantly reduced viscosity, which aids in applying the reactive mixture without compromising the final material properties compared to a material cured only with CA.
Incidentally, we observed a good correlation between the determined swelling ratio and the corresponding tensile properties, which is plotted in Fig. S12.† Generally, tensile strength, Young's modulus, and toughness increased with decreasing swelling ratio, whereas strain at break increased. The biggest outliers are the stiffness and strain at break observed for CA75TA25, which is probably due to its higher Tg compared to the other materials. The Tg window of these materials is around room temperature and a slightly higher Tg results in a partially frozen network at room temperature, which is not reflected in the swelling tests as the Tg is not relevant for those.
Lastly, with an addition of 25 mol% of TA to the CA EL hardener formulation, we found that we could outperform the EH with only CA in terms of tensile strength, hardness, toughness, which appears to be due to a slightly higher cross-link density, as evidenced by the swelling ratio and DMTA results. There are multiple factors at play. We believe it is a combination of TA being a difunctional acid with a stiff backbone and two hydroxy functions that could participate in the reaction or provide additional hydrogen bonds that increase the apparent network density. During DMTA we do not observe a modulus drop at high temperatures, which is usually seen even when much stronger hydrogen bonds are involved,56 which suggests that the network density should originate from covalent bonds. Both TA and CA have four functional groups that could participate in the reaction, but the reactivity of COOH-moieties is higher than OH.57 Considering this, we theorize that during the progressing reaction part of the COOH functionalities are hindered in their ability to diffuse through the polymer matrix, as illustrated in Fig. 7, because the CA molecule is connected at two points. At higher amounts of difunctional acids, the three connection points that CA provides ultimately lead to higher connectivity, but low amounts of di-functional acids could reach otherwise inaccessible oxirane moieties. While MA is also a difunctional acid, its presumed reduced reactivity (i.e. lower pKa) cannot off-set this effect. We are currently investigating the reaction kinetics in detail to elucidate the exact factors that causes the observed higher cross-link density.
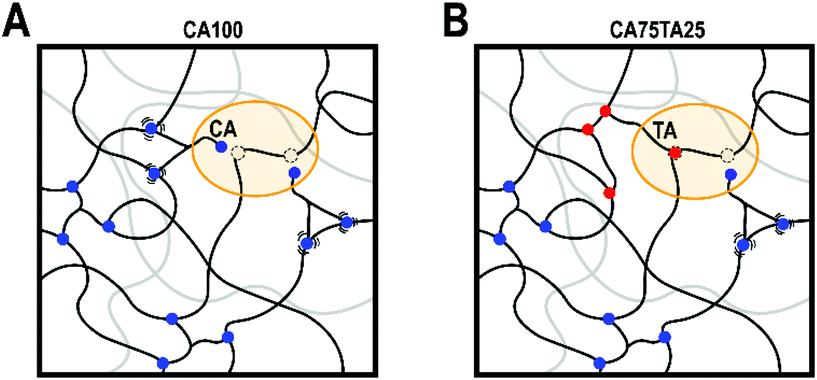 | ||
| Fig. 7 (A) Illustration of hindered mobility of CA moieties at the end of the reaction after the vitrification of the sample leading to unconnected entities; (B) Illustration on how low amount of TA can help in cross-linking inaccessible oxirane moities. | ||
Conclusions
The goal of the present study was to further investigate the concept of eutectic hardeners (EH) using natural acid mixtures, with the goal to improve the initial formulation and to examine the influence of the acid structure on the final material properties. Three natural multifunctional carboxylic acids, Citric Acid (CA), Malic Acid (MA), and Tartaric Acid (TA) were mixed in varying molecular ratios and liquified with Ethyl Lactate (EL) at elevated temperatures, resulting in a liquid EH at room temperature. All four molecules are naturally available, abundant, relatively inexpensive, non-toxic, and already approved for food contact. Mixtures with MA have a generally lower viscosity, which has implications for obtaining defect free samples without enclosed air. TA tends to react with EL in high concentrations, but low amounts mixed with CA are promising due to increased reactivity and higher Tg in the final cured material. Samples with 25 mol% of TA showed increased stiffness, tensile strength, and toughness, which we attribute to the lower hindrance of a difunctional acid to propagate through the polymer matrix at the end of the reaction. The observed tensile properties of the materials correlated with the corresponding swelling ratio of the respective material. The present works expands on the use of eutectic mixtures as “eutectic hardeners” and provides ideas for how one might influence the viscosity of the reactive curing mixture. These fully biobased and non-toxic systems cured with eutectic hardeners is leading to flexible materials. Such a flexibility is an asset for flexible coatings (e.g. on textile), for decorative sheets for interior applications (flooring, furniture, etc.) and for agglomerating flexible granules such as cork and rubber.Author contributions
The manuscript was written through contributions of all authors. All authors have given approval to the final version of the manuscript.Funding sources
This work benefited from financial support from the French government, managed by the National Research Agency (ANR) under the UCAJEDI Future Investments project with reference number ANR-15-IDEX-01 and financial support of “La Maison de la Chimie”.Abbreviations
| TGA | Thermogravimetric analysis |
| DMTA | Dynamic mechanical thermal analysis |
| ELO | Epoxidized linseed oil |
| CA | Citric acid |
| EL | Ethyl lactate |
| MA | Maleic acid |
| TA | Tartaric acid |
Conflicts of interest
There are no conflicts to declare.Acknowledgements
Fruitful collaboration with Mettler-Toledo is acknowledged. The authors would like to ackowledge Abby Cuttriss from UCA for English editing.References
- R. Geyer, J. R. Jambeck and K. L. Law, Sci. Adv., 2017, 3, 1–5 CrossRef PubMed.
- P. Muturi, D. Wang and S. Dirlikov, Prog. Org. Coat., 1994, 25, 85–94 CrossRef.
- S. J. Park, F. L. Jin and J. R. Lee, Mater. Sci. Eng., A, 2004, 374, 109–114 CrossRef.
- S. G. Tan and W. S. Chow, JAOCS, J. Am. Oil Chem. Soc., 2011, 88, 915–923 CrossRef.
- N. Supanchaiyamat, P. S. Shuttleworth, A. J. Hunt, J. H. Clark and A. S. Matharu, Green Chem., 2012, 14, 1759–1765 RSC.
- M. Shibata and T. Ohkita, Eur. Polym. J., 2017, 92, 165–173 CrossRef.
- K. P. Unnikrishnan and E. T. Thachil, Des. Monomers Polym., 2008, 11, 593–607 CrossRef.
- A. Tarzia, J. Montanaro, M. Casiello, C. Annese, A. Nacci and A. Maffezzoli, BioResources, 2018, 13, 632–645 Search PubMed.
- E. Ramon, C. Sguazzo and P. M. G. P. Moreira, Aerospace, 2018, 5, 110 CrossRef.
- J. M. Raquez, M. Deléglise, M. F. Lacrampe and P. Krawczak, Prog. Polym. Sci., 2010, 35, 487–509 CrossRef.
- M. Fache, C. Montérémal, B. Boutevin and S. Caillol, Eur. Polym. J., 2015, 73, 344–362 CrossRef.
- Y. I. Li, F. Xiao, K. S. Moon and C. P. Wong, J. Polym. Sci., Part A: Polym. Chem., 2006, 44, 1020–1027 CrossRef.
- S. Kind and C. Wittmann, Appl. Microbiol. Biotechnol., 2011, 91, 1287–1296 CrossRef PubMed.
- S. Thiyagarajan, L. Gootjes, W. Vogelzang, J. Van Haveren, M. Lutz and D. S. Van Es, ChemSusChem, 2011, 4, 1823–1829 CrossRef PubMed.
- E. A. Baroncini, S. Kumar Yadav, G. R. Palmese and J. F. Stanzione, J. Appl. Polym. Sci., 2016, 133 Search PubMed.
- K. Tarvainen, R. Jolanki, M. L. H. Eckerman and T. Estlander, Contact Dermatitis, 1998, 39, 46–47 CrossRef PubMed.
- A. Motahari, A. A. Rostami, A. Omrani and M. Ehsani, J. Macromol. Sci., Part B: Phys., 2015, 54, 517–532 CrossRef.
- H. Q. Pham and M. J. Marks, in Ullmann's Encyclopedia of Industrial Chemistry, Wiley-VCH Verlag GmbH & Co. KGaA, Weinheim, Germany, 2005 Search PubMed.
- N. Boquillon and C. Fringant, Polymer, 2000, 41, 8603–8613 CrossRef.
- R. Schöneich and G. Wallenstein, Z. Gesamte Hyg., 1990, 36, 164–166 Search PubMed.
- J. N. Currie, J. Biol. Chem., 1917, 31, 15–37 CrossRef.
- M. Belén, J. M. Salgado, N. Rodríguez, S. Cortés, A. Converti and J. M. Domínguez, Braz. J. Microbiol., 2010, 41, 862–875 CrossRef.
- E. Battat, Y. Peleg, A. Bercovitz, J. S. Rokem and I. Goldberg, Biotechnol. Bioeng., 1991, 37, 1108–1116 CrossRef.
- J. Gal, Chirality, 2008, 20, 5–19 CrossRef.
- R. M. Zelle, E. De Hulster, W. A. Van Winden, P. De Waard, C. Dijkema, A. A. Winkler, J. M. A. Geertman, J. P. Van Dijken, J. T. Pronk and A. J. A. Van Maris, Appl. Environ. Microbiol., 2008, 74, 2766–2777 CrossRef PubMed.
- P. Gogoi, M. Boruah, S. Sharma and S. K. Dolui, ACS Sustainable Chem. Eng., 2015, 3, 261–268 CrossRef.
- S. K. Sahoo, V. Khandelwal and G. Manik, Polym. Adv. Technol., 2018, 29, 2080–2090 CrossRef.
- J. Tellers, P. Willems, B. Tjeerdsma, N. Guigo and N. Sbirrazzuoli, Green Chem., 2020, 22, 3104–3110 RSC.
- F. Guthrie, London, Edinburgh Dublin Philos. Mag. J. Sci., 1884, 17, 462–482 CrossRef.
- R. L. Ashbrook, J. Am. Ceram. Soc., 1977, 60, 428–435 CrossRef.
- J. Gao, H. Xiong, Y. Gao, J. Zhang, H. Yang and X. Ma, Int. J. Electrochem. Sci., 2016, 11, 6306–6314 CrossRef.
- P. W. Stott, A. C. Williams and B. W. Barry, J. Controlled Release, 1998, 50, 297–308 CrossRef.
- U. Gala, H. Pham and H. Chauhan, J. Dev. Drugs, 2013, 2, 1000e130 Search PubMed.
- A. Abo-Hamad, M. Hayyan, M. A. H. AlSaadi and M. A. Hashim, Chem. Eng. J., 2015, 273, 551–567 CrossRef.
- A. P. Abbott, R. C. Harris, K. S. Ryder, C. D'Agostino, L. F. Gladden and M. D. Mantle, Green Chem., 2011, 13, 82–90 RSC.
- A. P. Abbott, P. M. Cullis, M. J. Gibson, R. C. Harris and E. Raven, Green Chem., 2007, 9, 868–872 RSC.
- A. P. Abbott, G. Capper, D. L. Davies, R. K. Rasheed and V. Tambyrajah, Chem. Commun., 2003, 9, 70–71 RSC.
- F. Lionetto, A. Timo and M. Frigione, Thermochim. Acta, 2015, 612, 70–78 CrossRef.
- J. D. Mota-Morales, R. J. Sánchez-Leija, A. Carranza, J. A. Pojman, F. del Monte and G. Luna-Bárcenas, Prog. Polym. Sci., 2018, 78, 139–153 CrossRef.
- B. S. Hayes, R. Moulton, D. Dixon and L. Vorobyev, United States Pat, US7008555B2, 2006, 9 Search PubMed.
- K. Yasu, WO2015076912, 2015, 23.
- R. G. Bates and G. D. Pinching, J. Am. Chem. Soc., 1949, 71, 1274–1283 CrossRef.
- P. Comuzzo and F. Battistutta, in Red Wine Technology, Elsevier, 2018, pp. 17–34 Search PubMed.
- F. Stern and C. A. Beevers, Acta Crystallogr., 1950, 3, 341–346 CrossRef.
- S. Montserrat, G. Andreu, P. Cortés, Y. Calventus, P. Colomer, J. M. Hutchinson and J. Málek, J. Appl. Polym. Sci., 1996, 61, 1663–1674 CrossRef.
- C. Menager, N. Guigo, L. Vincent and N. Sbirrazzuoli, J. Polym. Sci., 2020, 58, 1717–1727 CrossRef.
- D. N. Bikiaris and G. P. Karayannidis, J. Polym. Sci., Part A: Polym. Chem., 1995, 33, 1705–1714 CrossRef.
- D. N. Bikiaris and G. P. Karayannidis, J. Polym. Sci., Part A: Polym. Chem., 1996, 34, 1337–1342 CrossRef.
- J.-M. Pin, N. Sbirrazzuoli and A. Mija, ChemSusChem, 2015, 8, 1232–1243 CrossRef PubMed.
- A. Cadenato, J. M. Salla, X. Ramis, J. M. Morancho, L. M. Marroyo and J. L. Martin, J. Therm. Anal., 1997, 49, 269–279 CrossRef.
- H. Teil, S. A. Page, V. Michaud and J. A. E. Månson, J. Appl. Polym. Sci., 2004, 93, 1774–1787 CrossRef.
- S. Vyazovkin and N. Sbirrazzuoli, Macromolecules, 1996, 29, 1867–1873 CrossRef.
- N. Sbirrazzuoli, A. Mititelu-Mija, L. Vincent and C. Alzina, Thermochim. Acta, 2006, 447, 167–177 CrossRef.
- L. A. Errede, Macromolecules, 1986, 19, 654–658 CrossRef.
- P. Chen, L. Zhang and F. Cao, Macromol. Biosci., 2005, 5, 872–880 CrossRef PubMed.
- J. Tellers, S. Canossa, R. Pinalli, M. Soliman, J. Vachon and E. Dalcanale, Macromolecules, 2018, 51, 7680–7691 CrossRef.
- L. Shechter and J. Wynstra, Ind. Eng. Chem., 1956, 48, 86–93 CrossRef.
Footnote |
| † Electronic supplementary information (ESI) available: NMR spectra and supplementary rheological and DMA data. See DOI: 10.1039/d0gc03172k |
| This journal is © The Royal Society of Chemistry 2021 |