
Continuous reactor for renewable methanol†
Athanasios A.
Tountas
a,
Geoffrey A.
Ozin
 *b and
Mohini M.
Sain
ac
*b and
Mohini M.
Sain
ac
aDepartment of Chemical Engineering and Applied Chemistry, University of Toronto, 200 College St., Toronto, ON M5S 3E5, Canada
bDepartment of Chemistry, University of Toronto, 80 St George St., Toronto, ON M5S 3H6, Canada. E-mail: g.ozin@utoronto.ca
cDepartment of Mechanical and Industrial Engineering, University of Toronto, 5 King's College Rd., Toronto, ON M5S 3G8, Canada
First published on 5th November 2020
Abstract
For society and corporations to decisively shift to fossil fuel alternatives and avoid the likely devastating consequences of climate change and ecosystem destruction of ‘business-as-usual’, a renewable pathway to carbon net-neutral or net-negative feedstocks is of utmost importance. Methanol (MeOH) is a promising candidate but is still produced with conventional natural gas to syngas technology. The need for fossil-free and less costly syngas routes to MeOH has been the focus of immense academic effort. Towards this end, this study details a version 1.0 tool for investigating prospective photochemical and thermal heterogeneous MeOH synthesis catalysts and present thermal benchmarking data with a commercial copper–zinc oxide-alumina (CZA) catalyst. The testing conditions use a 3![[thin space (1/6-em)]](https://www.rsc.org/images/entities/char_2009.gif) :1 H2:CO2 syngas ratio, temperatures from <448–533 K (<175–260 °C), and pressure up to 0.78 MPa. These conditions allow for more efficient CO2 utilization by improving low-temperature MeOH yield and reducing capital and operating costs of process equipment. The reactor performance is validated with respect to the literature and also a rate model based on a Langmuir–Hinshelwood–Hougen–Watson (LHHW) mechanism with good agreement. This verifies that the system behaves isothermally and predictably. This unique system can be configured to screen catalysts both thermally and with light, and expanded to commercial test conditions and scales. At aspirational low-temperature and low-pressure conditions, 398 K (125 °C) and 1.0 MPa (comparable P to this study), the MeOH equilibrium per-pass yield is a respectable 8.8 mol% with comparable high-P equipment costs to current commercial operations.
:1 H2:CO2 syngas ratio, temperatures from <448–533 K (<175–260 °C), and pressure up to 0.78 MPa. These conditions allow for more efficient CO2 utilization by improving low-temperature MeOH yield and reducing capital and operating costs of process equipment. The reactor performance is validated with respect to the literature and also a rate model based on a Langmuir–Hinshelwood–Hougen–Watson (LHHW) mechanism with good agreement. This verifies that the system behaves isothermally and predictably. This unique system can be configured to screen catalysts both thermally and with light, and expanded to commercial test conditions and scales. At aspirational low-temperature and low-pressure conditions, 398 K (125 °C) and 1.0 MPa (comparable P to this study), the MeOH equilibrium per-pass yield is a respectable 8.8 mol% with comparable high-P equipment costs to current commercial operations.
1. Introduction
Fossil fuels are currently and will undoubtedly continue to be a MeOH feedstock for the foreseeable future. But this depends on how society implements forward-thinking policies to restrict fossil fuel use in the next decades. Regardless, it would not only be sensible to use these dwindling reserves more efficiently but to expand the ways in which promising products can be produced, e.g. using less efficient syngas. MeOH can be produced commercially via several methods: by (a) methane-reforming or (b) methane bi-reforming, with subsequent heterogeneous hydrogenation of CO/CO2 (at 5.0–8.0 MPa, 503–573 K). Less common routes involve less efficient feedstocks, e.g. (a) syngas from biomass, (b) water/CO2 for electrochemical production, and (c) CO2-rich pathways sourced from power-plant effluents or the atmosphere.Global MeOH demand is expected to be 73.2 MMt per year in 2020 excluding MeOH-to-olefin (MTO) production (25.6 MMt per year).1 In the future the MTO process could foreseeably produce global quantities of ethylene (208 MMt per year, 20192) and propylene (94 MMt per year, 20163) whereas these are predominantly made from petroleum today. If plastics are assumed to be composed of 90–95% polymers, then the three above chemicals would constitute ≥30% of the total 2017 EU chemical demand.4 Thus, renewable MeOH could supply these products sustainably.
MeOH can also be reformed, releasing H2 for use in fuel cells. It has a higher H2 density per volume than liquid H2 or oxymethylene ether (OME1–5). Phosphoric acid fuel cells which operate near 473 K can tolerate up to 1 vol% CO from reforming reactions eqn (1) (reverse water-gas shift, RWGS) and (2) (steam reforming of MeOH). Furthermore, they can operate above 393 K (120 °C), helping alleviate CO poisoning.
| CO2 + H2 = CO + H2O ΔH298K = +41.3 kJ mol−1 | (1) |
| CH3OH + H2O = CO2 + 3H2 ΔH298K = +49.6 kJ mol−1 | (2) |
The cost of a MeOH fuel cell is US$ 1960 kWcapacity−1 (2016 estimate5 in 2020 dollars) and remains expensive; however, it is steadily becoming comparable to fossil-fuel technologies (US$ 1000 kWcapacity−1).6 The efficiency is moderate (37–42%) due to the need of an external reformer. Nonetheless, compared to a hybrid gasoline internal combustion engine and diesel hybrids, with wheel-to-well efficiencies of 28% and 34%, respectively, it is a 1.3 and 1.1-fold improvement on the low end.7
Data is available on medium – (2.58 MPa) and high – (5.09–8.010 MPa) pressure CO2-to-MeOH production, but low-pressure (<0.5–1.0 MPa) and low-temperature 448–473 K (175–200 °C) production data is lacking in the literature.
Here we present experimental data for the commercial high-performance CZA MeOH catalyst with aspirational CO2-rich (3:1 H2:CO2) syngas and at low-T and low-P conditions. We identify where its performance lies for comparison purposes to prospective low-severity MeOH catalysts. We describe the low-T and low-P conditions to target for higher conversion and yield for improved CO2 utilization. We propose using light to help achieve the requisite performance at low-T and low-P conditions that, if achieved, will ultimately save on the capital cost, operating cost and complexity of high-P equipment and operations. Continued development of CZA-type catalysts is important due to its earth-abundant components. To deploy regional or site-specific MeOH-synthesis renewable-energy-storage plants cost effectively around renewable hydrogen generating installations, we believe that lowering the severity of the reaction conditions is key to enabling mass deployment of small-scale MeOH systems.
1.1. Producing syngas more efficiently from fossil fuels
Conventional syngas production via methane steam reforming (eqn (3)) and dry reforming (eqn (4)) does not deliver syngas with the correct ratio of 2:1 H2:CO for MeOH synthesis without further purification and adjustment. ‘Bi-reforming’ solves this inconvenience by producing Metgas (2:1 H2:CO) or ‘Methane’ + gas (eqn (5)).11| CH4 + H2O = CO + 3H2 ΔH298K = +206.3 kJ mol−1 | (3) |
| CH4 + CO2 = 2CO + 2H2 ΔH298K = +164.4 kJ mol−1 | (4) |
| 3CH4 + 2H2O + CO2 → 4CO + 8H2 ΔH298K = +659.8 kJ mol−1 | (5) |
The bi-reforming process operates at 1073–1223 K (800–950 °C) and 0.5–4 MPa with a feed composition of 3:2:1 CH4:H2O:CO2. A generalized equation starting from heavier hydrocarbon feed sources is shown in eqn (6).
| 3CnH2n+2 + (3n − 1)H2O + CO2 → (3n + 1)CO + (6n + 2)H2 | (6) |
As eqn (5) is highly endothermic (16-fold ΔHV,water), processes have been proposed that combine the endothermic CH4 steam reforming with its partial oxidation resulting in oxidative bi-reforming (Fig. 1), which results in no generation of by-products. The tandem reaction is eqn (7). Temperature helps CH4 conversion, and is ∼90% XCH4 at 1173 K (900 °C),11 and conversely, pressure negatively affects conversion according to Le Chatelier's principle. In the conventional process, gas heating reforming (GHR) is combined with auto-thermal reforming (ATR) where unreformed natural gas is combusted in ATR and provides heat for the GHR endothermic reforming reaction (eqn (3)), which occur in series (GHR then ATR). This process results in not insignificant amounts of CO2 emissions after costly multi-step separation and adjustment. Oxidative bi-reforming outperforms GHR + ATR by its simplicity. However, challenges such as safety concerns related to the CH4/O2 mixture in the combustion step and catalyst resistance to high temperatures and steam environments remain and require further study.
| CH4 + 2O2 = CO2 + 2H2O + heat = CO + 2H2 | (7) |
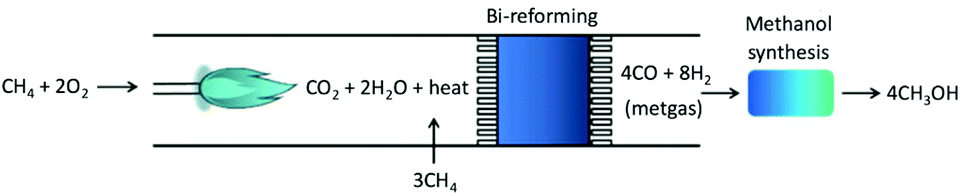 | ||
| Fig. 1 Tandem bi-reforming/MeOH synthesis process, from ref. 11. | ||
1.2. General considerations for renewable MeOH production
Lowering the temperature and pressure and lessening the need for high-quality syngas for MeOH production is key to (a) increasing the MeOH equilibrium yield of this exothermic reaction at lower temperatures and (b) lowering the capital and operating costs of compressor equipment needed to produce renewable MeOH (discussed in Results and Discussion), and (c) increasing the efficiency of CO2 utilization (or CO2 conversion), respectively. Light via photochemistry can accelerate reaction rates and increase the space time yield to MeOH (at 50 K lower T) using the CZA catalyst12 without increasing the bulk temperature appreciably. The photochemical effect is more evident as temperatures decrease (<473 K or 200 °C) due to charge carriers (photo-generated electrons and holes) recombining faster as the temperature increases.12 As such, the reactor in this study was benchmarked in a low-temperature range. At these low-T and low-P conditions without CO is where this novel hybrid reactor attempts to operate and screen for the next light-activated, CO2-rich fed, CZA-type MeOH catalyst.For this study, the CO2 conversion, temperature, and pressure were intentionally kept low in order to (a) determine the intrinsic activity of the CZA catalyst or benchmark to beat, and (b) maintain the system in a single-phase (gas-phase) condition.
Furthermore, the pressure of 0.78 MPa is about the same pressure as a low-pressure flash drum (0.5–1 MPa) of a typical MeOH process, upstream of typically 2 or 3 distillation columns (0.1 MPa) for chemical-grade AA MeOH.13 Thus, some pressure is beneficial to drive the product towards separation and allow smooth process operation. Recompressing hot product streams on-route to separation is not ideal. For the assumed operating conditions of this paper, the distillation section is assumed to be at atmospheric pressure.
Low pressure also bodes well for prospective RWGS (eqn (1)) unit operations providing CO, upstream of a MeOH synthesis reactor. The idea of adding a RWGS reactor upstream of a Fischer–Tropsch or MeOH synthesis reactor is not a new concept.14,15–17 Since the RWGS reaction is pressure insensitive, and preferred at low pressure due to the competing methanation reaction occurring on some catalysts,18 this could also provide a means to boost the low-T and low-P MeOH synthesis performance. The benefits of CO at commercial conditions are highlighted in section 3.1. Because the RWGS technology is still in its relative infancy for commercial applications17,18 and adds to the complexity of the energy storage system, it is omitted for now from this discussion. We have shown in our prior work the benefits of a solar-RWGS stage in lowering the carbon emissions and energy demand of renewable MeOH.19
1.3. Low-T and low-P MeOH catalysts in the literature
When considering low-T and low-P MeOH synthesis systems, a typical first assumption is production via homogeneous systems. However, these typically suffer from two issues (a) product-separation issues and (b) the requirement of additives for high performance.20 On the other hand, heterogeneous systems are the industry standard for high-throughput chemical synthesis. Low-T and low-P heterogeneous MeOH catalysts are known in the field, although they oftentimes are not at both low conditions simultaneously.In a study by Liao et al.,21 a low-pressure Pd@Zn core–shell catalyst was created which is active at 2 MPa and 523–543 K. This combination was found to suppress the RWGS (with increasing Zn) and thereby enhance MeOH selectivity. Using a foreign semi-conductive material (CdSe) the authors were better able to facilitate noble metal (Pd) decoration at milder reduction temperatures. Although the screening temperatures were still nominal, the rate and MeOH selectivity achieved were 134 mmolMeOH gPd−1 h−1 and 70%, respectively, at 523 K, 2 MPa and a WHSV of 18000 mL g−1 h−1, outperforming the commercial CZA catalyst with a rate and selectivity of 3.1 and 2.4%, respectively, at 543 K, 2 MPa. For a fairer comparison, the bulk catalyst mass could have been considered as well. Regardless, progress is being made and the key results were that the PdZn surface was more selective to MeOH precursors and Pd facilitated better H2 splitting (via higher absorption energies) at moderate pressure compared to Cu-based surfaces. A comprehensive listing of Pd-based catalysts with low-pressure performance is detailed in Ojelade et al.22 Ting et al.20 detailed a novel Re(1 wt%)/TiO2 catalyst with performance of 0.8 mmolMeOH mmolRe−1 h−1 at 323 K and 1 MPa CO2 (6 MPa total with H2) with 82% SMeOH. The TiO2 acts to highly disperse the Re into subnanometer clusters and as single Re atoms in some cases. The performance is impressive, but high-T reduction (773 K) and uncertainty surrounding the active Re oxidation state limits practical deployment thus far. The authors also listed a wide variety of low-T (<323 K) and nominal-P (∼3–9 MPa) MeOH catalysts that employ platinum-group metals. They note that one drawback of this family of catalysts is that the synthesis is typically complex.
In a study by Sun et al.23 on the indium family of catalysts, the authors studied Pt-decorated In2O3 and found 100% MeOH selectivity at a mild temperature of 498 K and pressure of 5 MPa. Although promising, the catalyst was only 9.5% as productive at 498 K (1.56 mmolMeOH gcat−1 h−1) compared to 573 K (16.4 mmolMeOH gcat−1 h−1). They also determined that the Pt-decorated catalyst was more stable than the pure In2O3via Raman spectroscopy analysis to infer the presence of a lower number of oxygen vacancies at 573 K and 5 MPa of the decorated sample resulted in a lower amount of heat generation by the O-vacancy formation. Indium oxides catalyst are generally interesting for low-pressure (≤5 MPa) CO2-to-MeOH synthesis, but still require above-nominal temperatures (543–573 K) where MeOH yield is limiting. Our research group has demonstrated a photo-enhanced, low-pressure, highly selective defect-laden rod-like nanocrystal indium oxide24 (WTY of 0.06 mmolMeOH g−1 h−1 and 50% SMeOH with 2-fold light enhancement at 523 K and 0.1 MPa) MeOH catalyst. For a comprehensive listing of low-T and low-P indium-based photocatalyst systems devised by our group with rates as high as 24 mmolCO g−1 h−1, please see Dong et al.25 Although most produce CO via RWGS with high selectivity, it is feasible with some additional pressure (0.5–5.0 MPa) that some would also become selective for C1 oxygenates such as MeOH.
In a study by Wu and coworkers26 that builds on the effectiveness of Pd for enhanced low-pressure H2 splitting and the associated MeOH productivity, the authors applied visible light to a Pd/ZnO catalyst to see if it promoted low-T and low-pactivity. Indeed, they found at conditions of 3:1 H2:CO2, GHSV of 20400 ml gcat−1 h−1, P of 1.2 MPa, and T of 463–543 K that light irradiation (2 × 500 W Hg lamps) enhanced the CO2 conversion 2-fold compared to dark conditions. They ascribed the activity to the local surface plasmon resonance, quantified by UV-Vis diffuse reflectance, that redshifted to the visible spectrum due to the supporting ZnO. Under visible light, Pd generated hot electrons that transferred to the Pd/ZnO interface activating CO2 to MeOH. Without the ZnO support the electrons primarily activated the CO2via RWGS on Pd. The rates or weight time yields measured under light were 1–4 mmolMeOH gcat−1 h−1 at 463–543 K.
Please refer to reviews27,28 that provide more of an overview of low-T and low-P photoactive heterogeneous MeOH catalysis. The catalysts highlighted in this section are summarized in Table 1. This section is meant to offer a taste of recent progress in the field.
| Catalyst | Study | Conditions, T (K), P (MPa), space velocity | Rate or WTY (mmolMeOH gcat−1 h−1) (unless otherwise noted) | Methanol selectivity, SMeOH (%) |
|---|---|---|---|---|
| P–F: plug-flow reactor, CSTR: continuous stir-tank reactor. | ||||
| In2O3−x(OH)y rod nanocrystals | Wang et al. (2018)24 | 523, 0.1 (3:1 H2:CO2), 2-fold light enhancement, P–F GHSV: 32000 ml g−1 h−1 |
0.06 | 60 (dark) |
| 50 (light) | ||||
| Re (1 wt%)/TiO2 | Ting et al. (2019)20 | 323, 6 (5:1 H2:CO2), Batch 24 h |
0.8 (per mmolRe) | 82 |
| CZA | Liao et al. (2017)21 | 543, 2 (2.8:1 H2:CO2), P–F GHSV: 18000 ml g−1 h−1 |
3.1 | 2.4 |
| Pd/ZnO | Wu et al. (2019)26 | 463–543, 1.2 (3:1 H2:CO2), P–F GHSV: 20400 ml g−1 h−1, 2-fold light enhancement |
1–4 | 50 (dark) |
| 33 (light) | ||||
| Fresh CZA | This study | 448–523, 0.78 (3:1 H2:CO2), CSTR WHSV: 223–743 h−1 |
0.34–13.7 | 43.4–79.4 |
| Pt@In2O3 | Sun et al., 202023 | 498–573, 5 (4:1 H2:CO2), P–F GHSV: 21000 ml g−1 h−1 |
1.56–16.4 | 100 (<498 K) |
| 50 (573 K) | ||||
| Pd@Zn | Liao et al. (2017)21 | 523–543, 2 (2.8:1 H2:CO2), P–F GHSV: 18000 ml g−1 h−1 |
134 (per gPd) | 70 |
2. Experimental
2.1. Materials
A commercial CZA catalyst (supplier Alfa Aesar, ‘Copper based methanol synthesis catalyst’, Stock no. 45776) was used to thermally benchmark the reactor. It has a component composition of 63.5:25.0:10.0:1.5 wt% CuO:ZnO:Al2O3:MgO. Based on this bulk composition, the elemental composition is approximately 29:11:7:1:52 mol% Cu:Zn:Al:Mg:O. The catalyst is described as being primarily used for the Lurgi-low pressure MeOH synthesis process, and its physical ‘as-purchased’ form is as pellets of 5.4 mm × 3.6 mm. The presence of MgO is found to increase the catalyst lifetime as it stabilizes the CZA structure by decreasing the sintering of exposed copper.8 A typical CZA BET surface area is 96 m2 gcat−1 and a Cu surface area is 25.4 m2 gcat−1.29
The as-bought catalyst was mechanically fragmented in a standard coffee bean grinder and sieved step-wise to the desired particle diameter, ranging from 180–250 μm. The sieved catalyst was weighed to 6.0 mg and loaded into the reactor tube. The catalyst loses 13 wt% upon reduction for a final active catalyst weight of 5.2 mg. It was tested intermittently for no more than 16 h and as such it was not expected to lose much activity at these mild differential conditions. In a study by Sun et al., they found that with a gas composition of 3:1 H2:CO2 at differential conversion, the catalyst exhibited no deactivation over 20 h.29 Water is expected to be at a maximum of ∼0.2 vol% in the present study at the harshest conditions tested (0.78 MPa, 523 K).
Aluminium beads (Al-beads) of 2.38 mm diameter were used as inert material in a gas preheat zone of the reactor bed. This bed of Al-beads was 4.0 cm in length. The beads were situated above the catalyst particles to ensure the inlet gas (gas flowing downwards) was at the reactor temperature (maximum 523 K) before contacting the catalyst. The required heat transfer length was verified with a convective heat transfer calculation.
Gases and standards used were: (i) pressurized CO2, Praxair grade 4.0, 99.99% <10:<10:<50:<5 ppmv O2:H2O:N2:CH4, (ii) pressurized H2, Praxair grade 5.0, 99.999%, 1:3:0.5 ppmv O2:H2O:THC, (iii) pressurized 5% H2 in N2 (grade ST, 99.99%) for catalyst reduction, (iv) pressurized N2, Praxair grade 4.8 for the back-pressure valve setpoint, (v) pressurized Argon, Praxair grade 5.0 for the gas chromatograph (GC) carrier gas, (vi) pressurized standard gas mix 500:250:100:100 ppmv CO:CH4:MeOH:EtOH balance Argon for GC calibration. The standard was run twice before each kinetic evaluation to verify the GC calibration.
2.2. Equipment
A semi-automated reaction system was used to perform the kinetic evaluations. The hybrid reactor is so named as it can conduct thermal as well as photo (with a light source) screening reactions. Three types of screening reactors are typical: Carberry, Berty (internal recycle reactor), and external recycle reactors as shown in Fig. 2. The reactor in this study is of the third type: an external recycle reactor. However, for determining catalyst performance, the principles are essentially the same.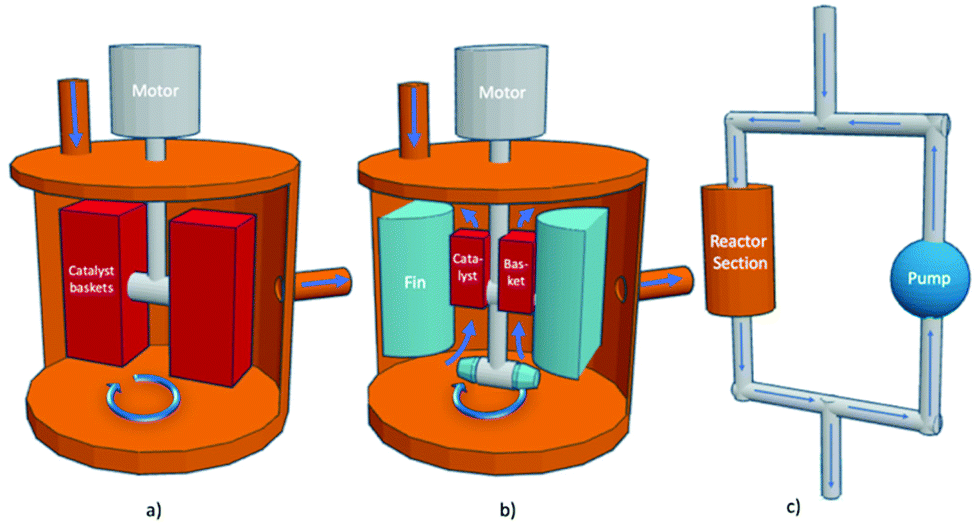 | ||
| Fig. 2 Stirred reactors (a) Carberry reactor, (b) Berty reactor (internal recycle reactor) (c) external recycle reactor thermal configuration, modified from ref. 30. | ||
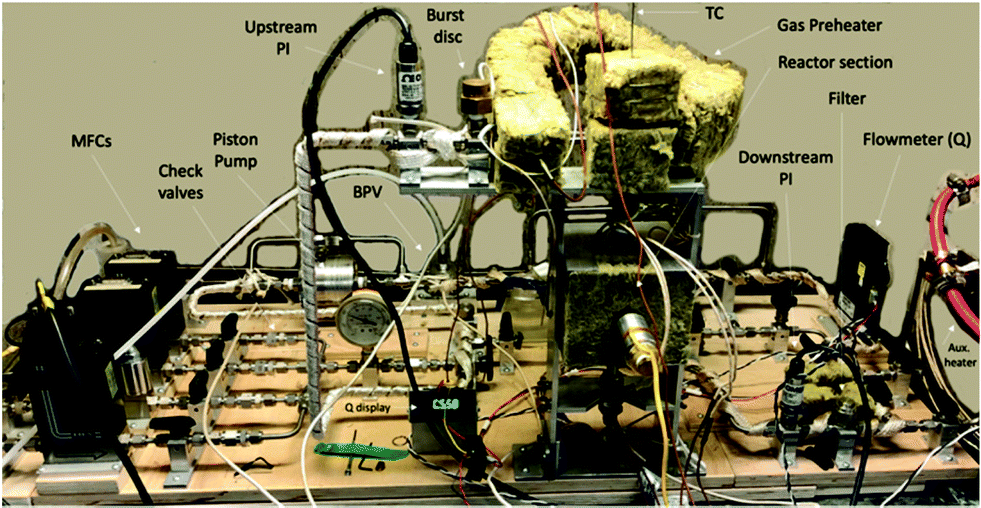
The reactor block diagram layout can be seen in Fig. 3. Fig. 4 shows the physical layout of the reactor in the light configuration. The main difference in the light vs. thermal configuration is that the 4-way tee reactor section (with a window extension addition (shown)) is replaced with a 2-way reactor fitting for the thermal-only mode. Furthermore, in the light configuration, the catalyst is loaded onto various porosity cylindrical alumina foams sitting upright in the reactor section.
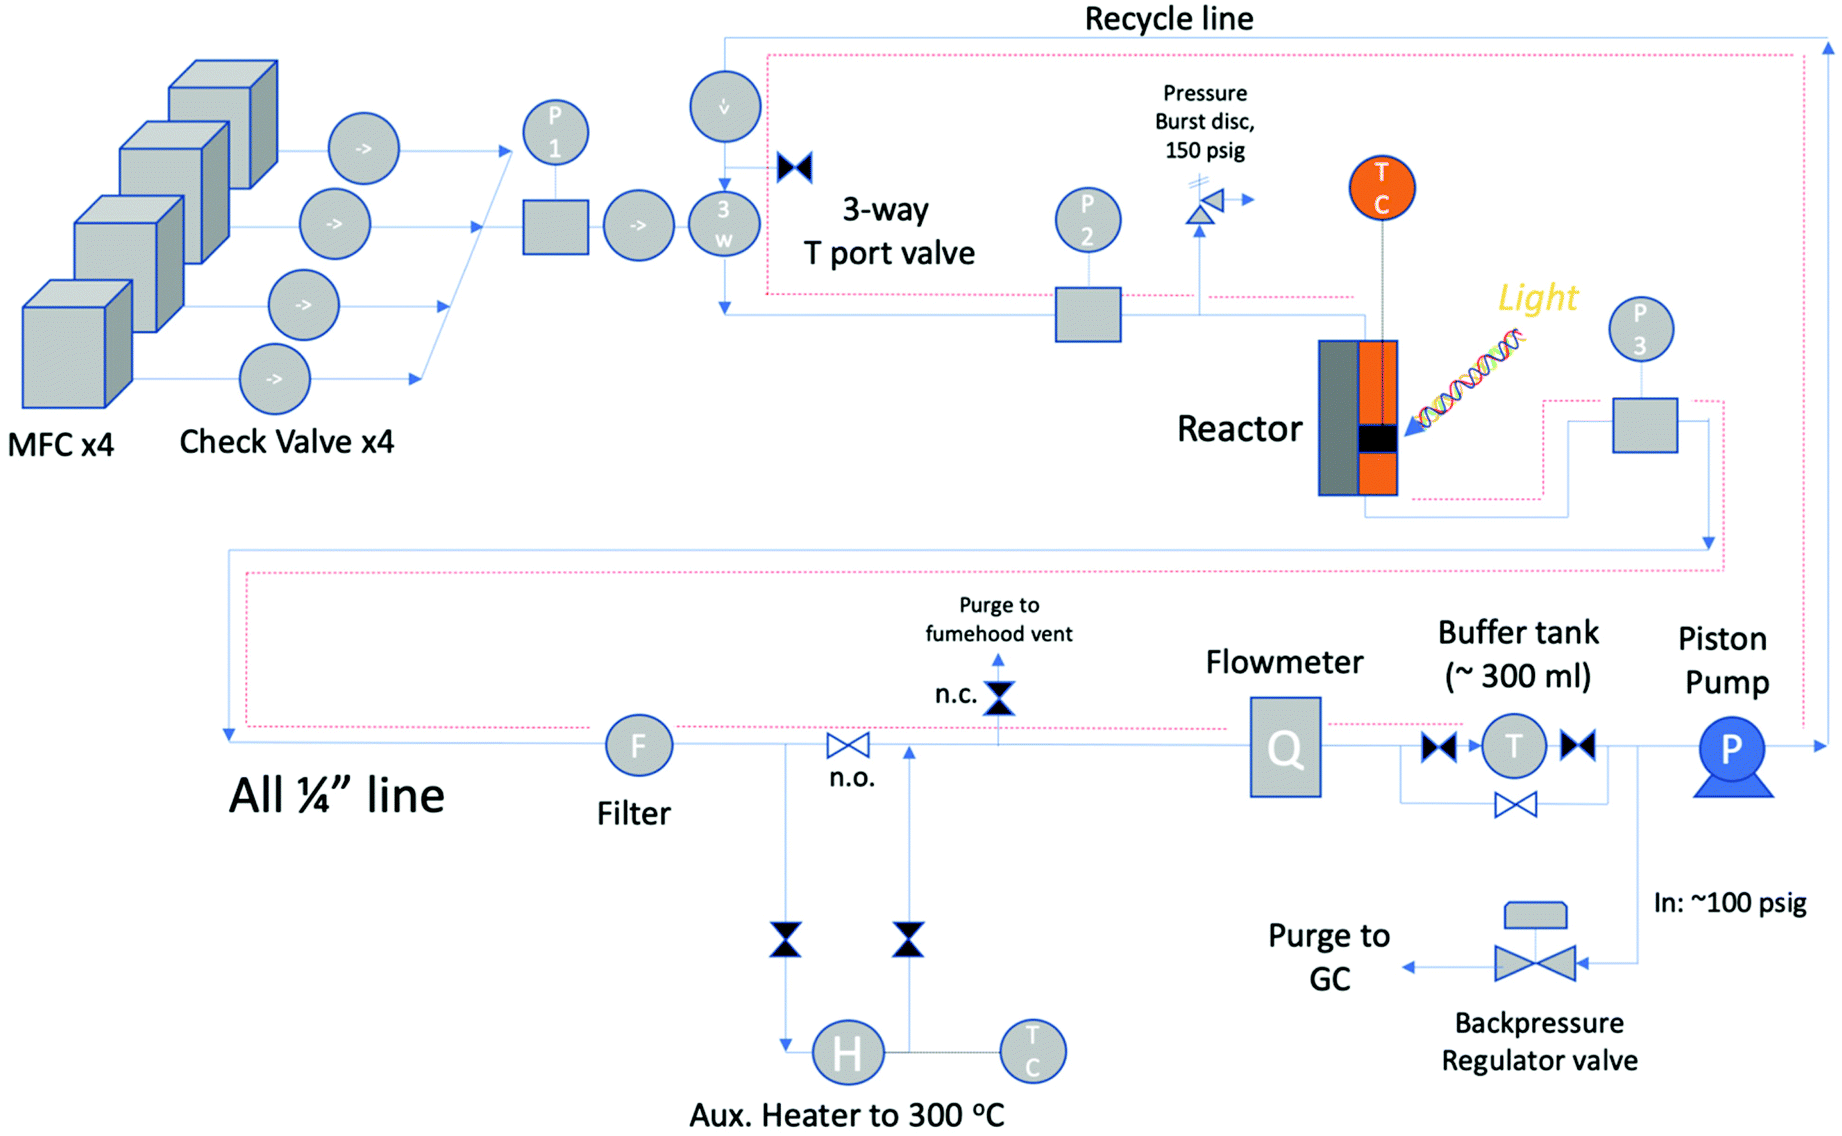 | ||
| Fig. 3 Reactor system block diagram. | ||
 | ||
| Fig. 4 Light configuration with window port shown. | ||
The foams are impinged upon through a ½′′ sapphire sight window (Rayotek Scientific, Inc., design T and P: 623 K and 3 MPa) by high-power LED light sources. The external recirculating reactor offers the most flexibility for admitting light into the system without compromising the structural integrity of the pressure vessel. Moreover, batch reactors have frequently been used for screening photochemical catalysts.31 However, samples are typically unsupported powders without adequate light permeation characteristics.
Instead, the photocatalysts used with the reactor described in this study must be first loaded (as a thin film) onto a light permeable foam support to optimize the light/catalyst contact. The port opposite to the light port allows quantifying key factors such as light absorption, which can be used for performance metrics such as quantum efficiency. High exciton utilization or quantum efficiency (near unity) has recently been reported32 for water-splitting photocatalysts that bodes well for the present potential of solar catalysts.
The feed section of the system consists of (i) MKS 1100 series, model 1159B mass flow controllers (MFCs) with a design pressure of 1.12 MPa for gaseous CO2, CO (not used) and 5% H2/N2, and (ii) an Aalborg (model GFMS-010155) 5 L min−1 MFC, 316SS, design pressure 6.9 MPa for gaseous H2. The MFCs use the thermal conductivity principle to meter the gas. In the reactor section, the thermal reactor is a ½′′ VCR union (Swagelok, SS-8-WVCR-6-DF) with an inner diameter (ID) of 10.2 mm (0.4 inch) and a length of 46.7 mm (1.84 inch) washer to washer. At the bottom is a 0.5-μm sieve washer (Swagelok, SS-6-VCR-2-0.5 M) where the catalyst sits At the top is a 60-μm sieve washer (Swagelok, SS-6-VCR-2-60 M) which was drilled through and tapered to accommodate a K-type thermocouple from the inflowing end. This extra precaution was made so that the contents of the reactor chamber did not backflow during the experiment. The potential of catalyst backflowing was an early problem, resolved by this means along with additional upstream check valves. The thermocouple was inserted through the top of the reactor block, and once inserted was situated at the base (on the 0.5-μm sieve) of the reactor adjacent to the catalyst particles. This location was optimized after trying other locations in the Al-bead bed. The reactor was heated by means of 2 × 300 W, 38.1 mm long heater cartridges (McMaster-Carr) inserted symmetrically in a copper heating collar in contact with the reactor tube. The temperature was controlled with a temperature controller (Omega Engineering), with feedback from the thermocouple inside the reactor in contact with the bottom washer (wall temperature). The contents of the reactor were recycled via a piston pump (Pump Works, Inc. PW2000 Series model PW2071). The recycle flow could be varied from 0 to 4 L min−1 (0.14 scfm). The pump had a variable speed drive connected to a variable rate controller (Pump Works, Inc., model VRC 2001). This controllers’ setpoint was set by an Arduino Uno board that received a flow measurement from the in-line H2 mass flow meter (Aalborg, GFM17, 0–5 LPM). This flow rate was also shown on the digital display (Fig. 4). The piston pump could tolerate gas temperatures up to 333 K (60 °C); therefore, a 15 cm length of pipe was left exposed upstream of the pump to the fume hood vent. The gas continuously cooled after exiting the reactor before being recirculated by the piston pump. Kinetic measurements were performed with a recycle flow of 1.0–1.5 L min−1, or more generally at ≥11-fold of the inlet flow to maintain a well-mixed system. In hindsight a more robust working temperature of the pump would be preferred to avoid potential condensation in the recycle stream. However, the location of the system in a fume-hood made rigorous heat tracing necessary. Having the reactor loop situated in a furnace is the most ideal scenario. From the literature, pumps from pump manufacturer KNF Verder, for example, can withstand temperatures up to 453 K (180 °C) but only at low system pressures of ∼0.1 MPa.33 As such, the best practice for this study's higher system pressure is to heat trace all lines to the pump maximum allowable temperature of 333 K (60 °C). Due to the low-conversion operation of this study, it was adequate to heat trace all recycle lines except the pump inlet and GC product lines as shown in Fig. 3 as dotted red lines.
The product gas exits via a back-pressure valve (BPV) and passes to a GC where it is periodically sampled for analysis by way of an online injection valve. The GC (SRI Instruments model 8610C, configuration #5) is equipped with a flame ionization detector (FID), a thermal conductivity detector (TCD), a 3′ mole sieve 5A column, and two Hayesep-D columns (18′′ and 6′). MeOH and CO were analyzed by the FID. Each GC analysis took approximately 20 minutes, plus 5 minutes to bake out at 463 K (190 °C) to remove any unpurged gas. Repeat analysis was performed every 30 minutes. The product stream was analyzed with at least (3) consecutive GC injections once the system had reached steady state. The data is an average of the measurements at a particular reactor condition. Typically, 3–4 temperatures were studied during a given analysis, typically taking 1.5–2 h to reach steady state at each temperature. No traces of other products other than MeOH and CO such as methane or higher hydrocarbons, ethers or alcohols (e.g. ethanol) were present, which attests to the negligibility of any side reactions.
2.3. Reactor performance
The condensable species, water and MeOH had to be verified so that they did not exceed certain thresholds. The lower threshold of the two, the dew point of water (VP,water) at room temperature, was 0.0023 MPa at 293 K. At this VP,water's the fraction of the total system pressure (0.78 MPa) it made up was 0.3 mol% (or vol%). If the partial pressure of water exceeded this value, it could condense and the system would experience so-called ‘water-hammer’. Water-hammer occurs when condensate becomes entrained in a fast-moving gas (such as at the pump outlet). When a tube bend or other obstruction is met by the high-speed liquid, damage can result due to the abrupt momentum change of the liquid. Thus, the maximum permissible CO2 conversion, % XCO2, was 0.3% (0.08% abs. CO2 in the feed). The equilibrium % XCO2 was 5.5% (1.38% abs. CO2) at 473 K and 0.8 MPa; therefore, it had to be closely monitored. This was the worst-case wall temperature (at the pump inlet and GC-product lines), however, and the remaining tube walls were in the 333–353 K range. The % XCO2 in this study's kinetic evaluations never exceeded 0.19% and were far from the equilibrium limit. This factor of 1.5-fold safety margin (or 280 ppmv) relative to the dew point is so that the heated lines could be left exposed at the inlet to the pump. With water's gas-phase conditions met, MeOH would be satisfied as well.
Due to these and other consideration, such as the design pressure of the MFCs, a burst disc was installed at the MFC design pressure of 1.12 MPa and situated just upstream of the reactor gas preheater. Best practices recommend that the system pressure should be ≤80% of the burst disc set pressure or ≤0.92 MPa. To be well clear of the 80% mark, the system pressure was operated at 0.78 MPa (∼100 psig). This allowed for a catalyst bed pressure drop of between 0.034–0.068 MPa (5–10 psig). A BPV was situated between the reactor exit and the recycle pump and relieved the system pressure at its setpoint of 0.78 MPa.
The significance of elevated P is that it helps increase the adsorption energies of surface intermediates in CO- and CO2-based MeOH synthesis.31
For kinetic measurements in this study the reactor was operated at 0.78 MPa throughout.
3. Results and discussion
3.1. Challenges of low-efficiency syngas to thermal MeOH
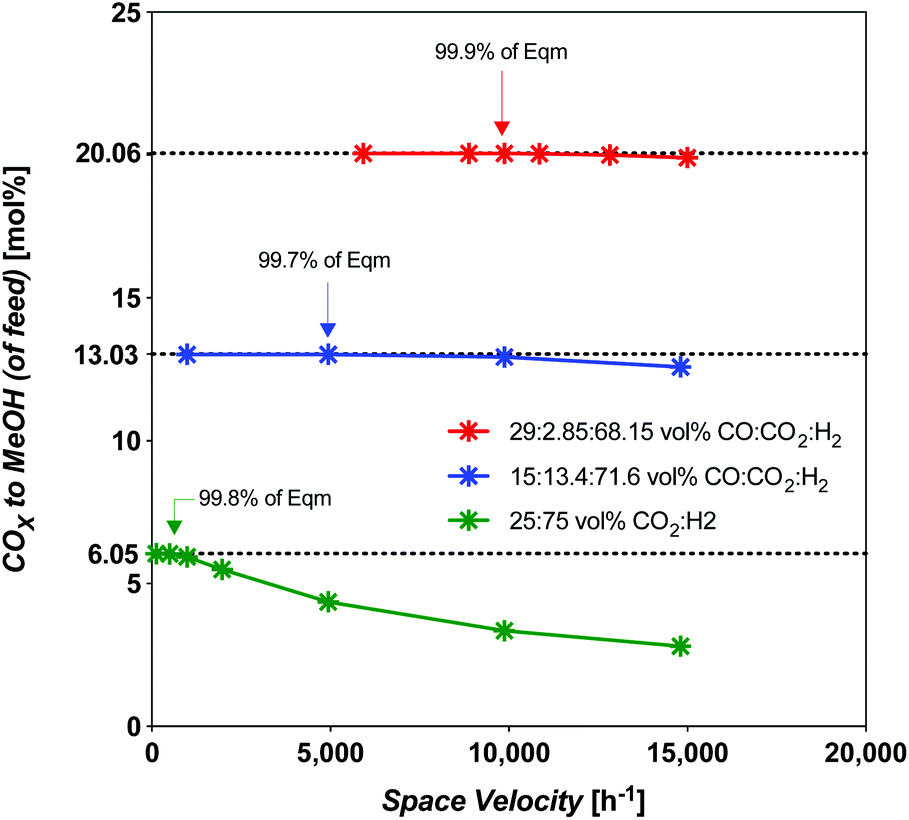
Syngas commonly derived from natural gas will undoubtedly need to be replaced by syngas derived from CO2-rich streams concentrated from the atmosphere, or CO2-rich streams without upgrading to CO, as natural gas use becomes discouraged. In this section, the challenge of the usual high-temperature synthesis using CO2-rich streams is compared to intermediate upgraded streams (or intermediate-CO) and fully upgraded CO-rich streams. The intention is to highlight the challenges of using less efficient syngas (CO2-rich, int.-CO), while comparing them to those of using the most efficient syngas (CO-rich). The assumption here is that we are considering a commercial MeOH catalyst: CZA, not unlike that used in this study. Any solar MeOH plant will need to optimize the level of upgraded syngas fed to the process, and constitutes added capital and operating costs. For our strategy A from our previous work,19 a CO-rich syngas was derived via RWGS (eqn (1)).The throughput is compared at the limiting space velocity (SV) for near-theoretical equilibrium conversion. The SV dependence was modelled using an isothermal plug-flow reactor (PFR) model in E–Z Solve, based on rate laws developed by Vanden Bussche and Froment,34 also made use of in our prior work.19 The catalyst and experimental conditions used in Vanden Bussche and Froment's study were fresh CZA catalyst, at 453–554 K, 5.1 MPa. Here we extended the model up to 8 MPa which is acceptable as they extrapolated their data to successfully predict Klier et al.10 experimental conversions at 7.5 MPa. The temperature of 523 K, which is typical for the commercial process, was considered. The limiting SV has been found to vary considerably, as shown by the model results in Fig. 5.
 | ||
| Fig. 5 Limiting space velocity of a PFR for CZA catalyst with feed composition at 523 K and 8 MPa, all SN = 2.05 except 25:75 mol% feed which is at a Stoichiometric number (SN) = 2.00. | ||
The limiting selectivity of the 3:1 H2:CO2 (CO2-rich feed without CO) was found to occur at an SV of 493 h−1 for a total CO2 conversion of 30%, an identical value to the solar-MeOH-island concept.35 In terms of CO2-to-MeOH, the CO2 conversion is 24% (Fig. 6). The selectivity at this point is 80.1% MeOH and 19.9% CO. However, this SV represents a 95% reduction in throughput compared to the best (CO-rich feed) case, with 70% reduction in MeOH yield. Interestingly, the selectivity improves from 57.8% MeOH at 9868 h−1 to 80.1% at the limiting SV. The overall disadvantage of the CO2-rich pathways by taking the throughput and yield into account is 98.5% less productive compared to the best CO-rich case.
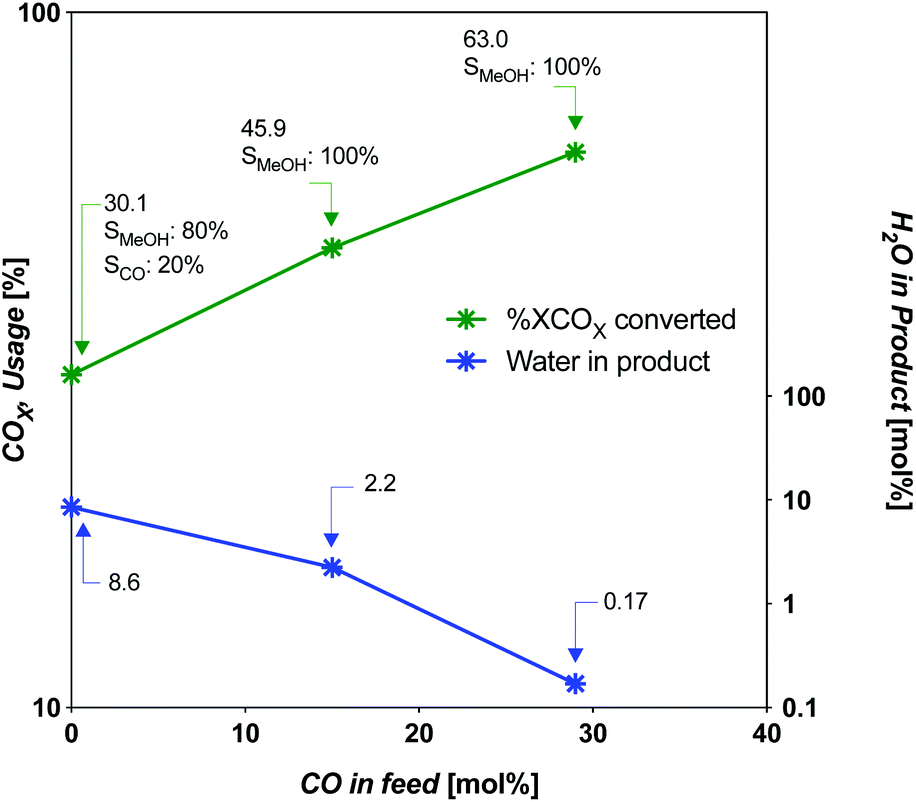 | ||
| Fig. 6 COX usage and water content in product as a function of CO in feed at limiting SV for CZA catalyst. | ||
For the intermediate-CO feed case (15 mol% CO), the limiting SV occurs near 5000 h−1 (4934 h−1). For the CO-rich feed case (29 mol% CO), it occurs near 9900 h−1 (9868 h−1). The amount of COX-to-MeOH converted is appreciably different, at 13.03 and 20.05 mol% absolute COX in the feed (or COX conversion of 46 and 63%, respectively). The intermediate-CO feed has 35% less yield and 50% less throughput for an overall disadvantage of 68%. The three cases are compared in Fig. 5 and 6. The amount of water produced is also markedly different at the limiting SV, with the intermediate-CO feed and CO2-rich feeds with 10-fold and 50-fold more water in the product gas, respectively, than in the CO-rich feed (Fig. 6).
Clearly, there are advantages of using more CO in syngas with the commercial CZA catalyst. These include 100% selectivity to MeOH at intermediate-CO levels (at amounts as low as 5% CO in the syngas19), and higher conversion at higher throughput for the same catalyst mass. Dieterich and co-workers13 in Fig. 4 of their work have plotted the equilibrium conversion of CO- or CO2-based feed gas vs. pressure at temperatures down to 473 K to give a sense of the yield improvement for different feed gases.
3.2. The Effect of per-pass CO2 to MeOH conversion on the recycle compressor costs
Low pressure is interesting from a capital cost (smaller compressors and reactors) and operating cost (gas compression energy) standpoint. Likewise, low temperature is interesting for exothermic reactions, as yields increase as temperature decreases. Boosting activity without heat (e.g. with light or photochemistry) would unlock these favourable yields. To give a sense of the magnitude of compressor operating costs, an excellent study36 was published on the single-pass CO2-to-MeOH reactor (gas in, liquid out) concept which uses direct air capture of CO2 and water electrolysis for H2. In the study, a requisite 100 MW of electricity was derived from wind turbines for a 65 kMTMeOH per year renewable MeOH plant. The capital cost of the feed compressors for the MeOH production subsystem (reactor, compressors, distillation) made up 78.2% of the capital cost at 5 MPa. As for the operating cost (excluding water electrolysis), the electricity demand of the compressors was 13.7% of the total. The novelty of the reactor concept employed lied in the complete reactant conversion in a semi-continuous process. The details of the reactor can be found here;37 however, it is still in the prototype stages and not yet commercial-ready. In a more commercial heterogeneous-continuous plug-flow operation, a recycle compressor is employed to achieve near-complete conversion of reactants CO2 and H2. With impetus from that study, we attempted to ascertain what the recycle compressor costs are as a function of reactor per-pass conversion. The per-pass CO2 conversion (XCO2) affects the plant recycle flowrate and associated recycle compressor capital and operating costs. We assumed that the unreacted feed and products are ‘let down’ to atmospheric pressure during distillation. A sensitivity analysis on the recycle compressor costs was performed by varying the recycle flow (at a given per-pass XCO2) and MeOH reactor synthesis pressure, and assuming stoichiometric conversion of CO2 to MeOH (reverse of eqn (2)) to fill the parameter space. The RWGS side reaction was omitted for this exercise for ease of computation purposes. The recycle amount as a function of per-pass XCO2, is shown in Fig. 7. As shown, the recycle flow increases exponentially as the per-pass XCO2 decreases, becoming equal to the inlet flow (100 mol s−1 of 3:1 H2:CO2) at 50% conversion. Please see Fig. S1 in the ESI† for a block diagram of the recycle operation.
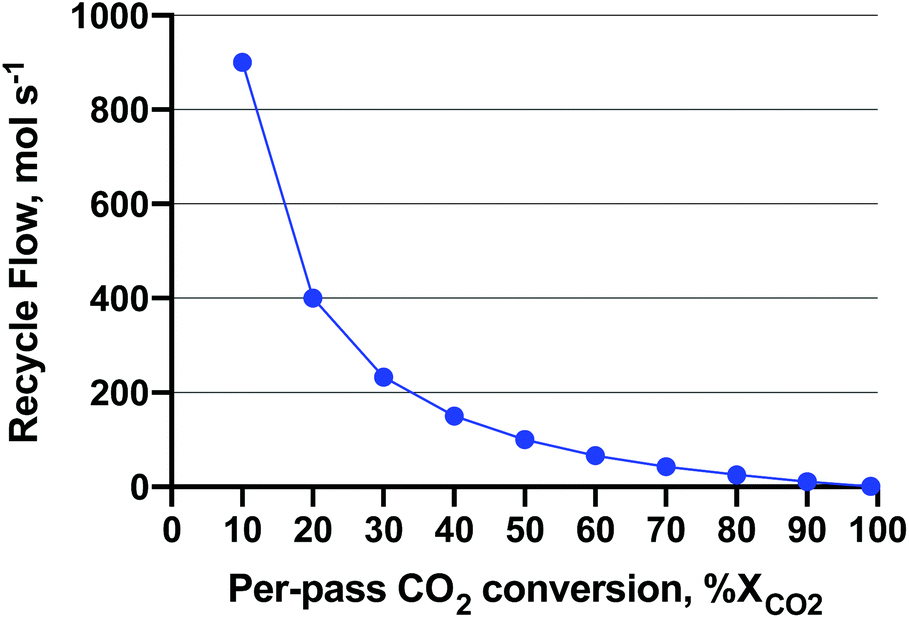 | ||
| Fig. 7 Recycle flow for a 3:1 H2:CO2 feed of 100 mol s−1. The MeOH production is assumed stoichiometric according to the reverse of eqn (2) at an amount of 25 molMeOH s−1. The recycle flow is shown a function of per-pass CO2 conversion to achieve complete conversion. | ||
The recycle compressor was assumed to be polytropic and to have an efficiency of 70%. The mixed feed stream was assumed to have a weighted average CP/CV ratio of 1.376. Similar to ref. 36, the installed cost capital expenditure (for brevity referred to here as CAPEX) was assumed to be 5-fold the capital cost. The CAPEX was averaged over a 10-year plant operating lifetime. The pertinent equations can be found in the ESI.†
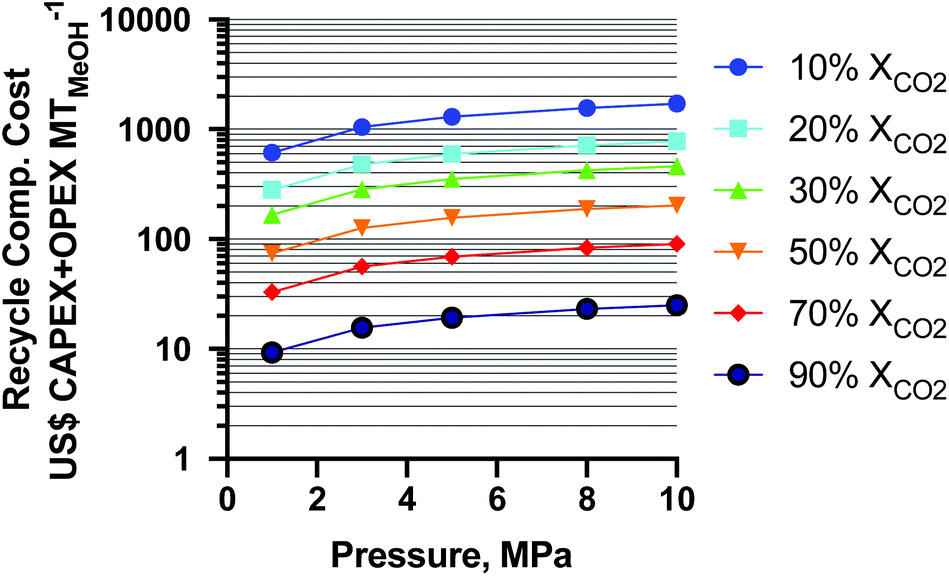
The results of the CAPEX and operating expenditure (OPEX) for the recycle compressor are shown as a function of per-pass XCO2 and MeOH synthesis pressure in Fig. 8. From the figure it is seen that the cost of the least-CO2 conversion is the highest and increases with pressure as expected. The change in CAPEX + OPEX from 50–10% XCO2 is about 2.04-fold (for the average 13% decrease in XCO2) and a similar ratio for all pressures. From 90–50% XCO2, the cost increase is about 2.92-fold (for the average 20% decrease in XCO2). The overall CAPEX + OPEX increases about two orders of magnitude from 90 to 10% XCO2. At a static conversion of 10% XCO2, from 1 MPa to 10 MPa the cost increases about 2.80-fold, and at 90% XCO2 about 2.70-fold. In the study36 (mentioned earlier), the authors did not employ a recycle compressor (which is equivalent to a pass conversion of 100% XCO2 at 5 MPa), and as such it is not shown for reference in Fig. 8. This exercise highlights the importance of high per-pass XCO2 conversion, lower pressures, and lower temperatures (to achieve higher conversion without more pressure) for minimizing the cost of conventional-reactor-produced renewable MeOH as CO2-rich MeOH processes are increasingly deployed.
 | ||
| Fig. 8 Recycle compressor cost capital expenditure (CAPEX) and operating expenditure (OPEX) as a function of per-pass CO2 conversion and reactor operating pressure for 3:1 H2:CO2 feeds. | ||
In a study by Clausen et al.,38 the compression cost was estimated as 44.7% higher for a CO2-rich feed vs. CO-rich feeds with corresponding MeOH yields of 8.2 vs. 16.5% (average), respectively. The plant operating conditions were 14.4 MPa and 508 K throughout. It is challenging to verify their values as the authors did not utilize a recycle compressor. The solar MeOH island concept used a CO2-rich syngas (3:1 H2:CO2) and conditions of 7.3 MPa and 483–523 K, and a ‘looped’ operation (although it is not clear what that ratio was) to achieve near complete conversion of the unconverted feed. The recycle compression cost could not be substantiated as the unit operation's electrical requirement, XCO2 and recycle rate were not readily available. Assuming a XCO2 of 30% and a recycle of 2.33-fold, we can estimate a recycle compressor cost of US$ 410 MtMeOH−1 for this arrangement.
When the temperature is lowered further to 448 K (175 °C), the MeOH equilibrium yield can be up to 15.4% (per-pass %XCOX of 47%) at 5 MPa, and nearly 100% SMeOH,39 with an overall recycle compressor cost of ∼US$ 176 MtMeOH−1. This begins to challenge CO-rich production recycle compressor costs of US$ 189–96 MtMeOH−1 at 20–33% MeOH yield (per-pass %XCOX of 45–63%). At very low temperature (398 K or 125 °C) and comparable pressure to the one in this study at 1.0 MPa, the yield is 8.8% (per-pass %XCOX of 30%) and >90% SMeOH,39 for an overall recycle compressor cost of US$ 167 MtMeOH−1, an aspirational target.
Due to partial CO2 conversion in all cases, recycling and recompressing unreacted feed gases is a critical factor for a CO2-rich MeOH process. With one of the (previously mentioned) best scenarios (≤5 MPa, 448 K) for a CO2-rich feed, the yield becomes more than half (0.47–0.77-fold) and recycle compression costs become less than twice (0.93–1.83-fold) that of the CO-rich commercial process. Table S1 in the ESI† summarizes the calculations at an example pressure of 8 MPa and highlights the green advantage of milder operating conditions.
3.3. Temperature ranges
To verify the operation of the thermal screening reactor, two temperature ranges were tested: a high-temperature range between 508–523 K (235–250 °C) and a low-temperature range between 448–473 K (175–200 °C). The system parameters of interest are the activation energy (EA) and selectivity, primarily. These were compared to two CSTR simulations computed in EZ-Solve by Intellipro, Inc. Other parameters such as rates were also noted. They deviated somewhat from the models due to the differences in the pressure, reactor conversion and reactor type for which the models were derived. However, one model gave a satisfactory fit with the experimental data derived here.| T (K (°C)) | r MeOH (mmol gcat−1 h−1) | r CO (mmol gcat−1 h−1) | S MeOH (%) | S CO (%) | Conv., (% XCO2) |
|---|---|---|---|---|---|
| 508 (235) | 10.9, 1 | 8.2 | 56.9 | 43.1 | 0.11 |
| 513 (240) | 11.4 | 10.6 | 51.9 | 48.1 | 0.13 |
| 518 (245) | 12.6 | 14.0 | 47.4 | 52.6 | 0.16 |
| 523 (250) | 13.7 | 17.9 | 43.4 | 56.6 | 0.19 |
The maximum MeOH and CO rates measured were 13.7 and 17.9 mmol g−1 h−1, respectively, at 523 K, 0.78 MPa. The activation energy profiles for MeOH and CO are shown in Fig. S2.†
How the derived activation energy compares to multiple literature references is shown in Table S6.† The results show that the activation energies are within 8% for the RWGS and within 0.5% for CO2-to-MeOH with the literature. This provides a good indication that the reactor is operating isothermally, in a well-mixed manner, and predictably. Furthermore, the good match with activation energies derived at higher pressures suggests the same mechanism and product pathways are present at the pressure in this study.
There is a recent new insight by Zabilskiy et al.40 into the CZA mechanism of MeOH synthesis from CO2-rich streams using high-P and T (1.5 MPa, 533 K) operando techniques. The study found that under a reducing H2 environment, the active catalyst components transformed into a copper–zinc alloy. Zinc formate was found to form upon exposure and oxidation of the alloy to CO2. Two classes of formates were found: the one previously mentioned and a second with distinctively lower reactivity, likely due to different localization with respect to copper. Copper was found to remain in the Cu(0) metallic state, not changing oxidation states even under pure CO2. Its role consists of splitting H2 as was found by fast isotope exchange of the hydrogenated formate. H2 spills over to the ZnO leading to Zn-formate and further hydrogenation to MeOH whereby ZnO is regenerated and enters a new cycle. Water mediation is missing from this mechanism; however, the study41 suggesting this did not account for the role of ZnO in forming C-oxygenates.
An alloy-active site has other precedents in the literature; for instance, Bahruji et al.42 found that high-temperature reduction (923 K or 650 °C) of PdZn/TiO2 catalyst produced a PdZn alloy that was observed using XRD, XPS, DRIFTS and TEM. This favoured MeOH formation (1.71 mmol g−1 h−1 and SMeOH of 58.0%) at 2 MPa and 523 K and is again linked to stabilizing the formate intermediate.
| T (K (°C)) | r MeOH (mmol gcat−1 h−1) | r CO (mmol gcat−1 h−1) | S MeOH (%) | S CO (%) | Conv., (% XCO2) |
|---|---|---|---|---|---|
| 448 (175) | 0.34 | 0.089 | 79.4 | 20.6 | 0.008 |
| 460.5 (187.5) | 0.80 | 0.22 | 78.3 | 21.7 | 0.020 |
| 473 (200) | 1.59 | 0.56 | 74.1 | 25.9 | 0.042 |
Because we made use of 100:0% CO2:CO in this study (the Yang et al. study in Fig. S4† uses 50:50% CO2:CO), the low-temperature EA of this work will be somewhere midway the CO and CO2EA's (as some produced CO may also take part in MeOH synthesis reactions at lower temperatures). The selectivity of MeOH vs. CO is around 80:20% from this study; therefore, an approximation is to assume that the CO taking part in the low-temperature reaction is the average of 0% and 50% CO. This high estimate of CO taking part should be valid as this study's product gas composition never exceeded this proportion of CO.
From Yang et al., with the pure component activation energies shown in Table S7,† we estimated this study's MeOH EA as being the average of pure CO2EA (133 kJ mol−1, no CO taking part), and the activation energy with CO taking part was 73.5–89.5 kJ mol−1 (or an upper limit).41 This provides an average (CO2 + CO) activation energy (from Table S8†) of ∼103–111 which is very close to this study's value of 109 kJ mol−1. Table S9† shows this study's activation energy vs. the literature and the relative error margin.
The approximation of the MeOH activation energy in this way is reasonable in our estimation. Furthermore, the relatively consistent CO EA at low and high temperatures (within ∼12% of the high T range) is further corollary to the validity of the activation energies derived here for the low-temperature range. To corroborate this, Yang et al. identified only one primary route from CO2 to CO on Cu/SiO2 (RWGS, eqn (1)) via a water-mediated carboxyl intermediate.41
A consequence of lower temperatures for Cu-containing CZA from ref. 41 is that there is less direct CO2 utilization as a result. It becomes as biased as 89/11% direct CO/CO2 utilization, respectively (Table S8†). This has an upshot, however, as the RWGS is feeding the CO-to-MeOH reaction, leading to better MeOH selectivity overall. This is confirmed here with a CZA catalyst as the study by Yang et al. used a model Cu/SiO2. As the authors in Yang et al. note: previous studies on single crystal copper are similar to those measured on the best Cu/ZnO catalyst implying dominant metal chemistry. The authors further state that for supported and unsupported Cu catalysts there are similarities between catalyst performance and behaviours that indicate that the experimental observations are dominated by copper metal chemistry. Please refer to Yang et al. study for a description of the shared CO2/CO carboxyl-mediated and CO-based formyl-mediated CO-to-MeOH mechanisms that are prominent at low-T conditions.
Thus, accelerating the RWGS activity is essential for accelerating MeOH production from CZA-type catalysts at lower temperatures. This result also implies that the Cu in CZA at lower temperatures activates carbon precursors, whether it be via a CuZn alloy (found at high T 533 K) or directly, playing a larger role than merely splitting H2.
Fig. 9 shows how the overall trend of MeOH selectivity changes with temperature from the low- to high-temperature ranges. The selectivity varies continuously from low to high temperature showing the consistent operation of the reactor for both discrete kinetic evaluations.
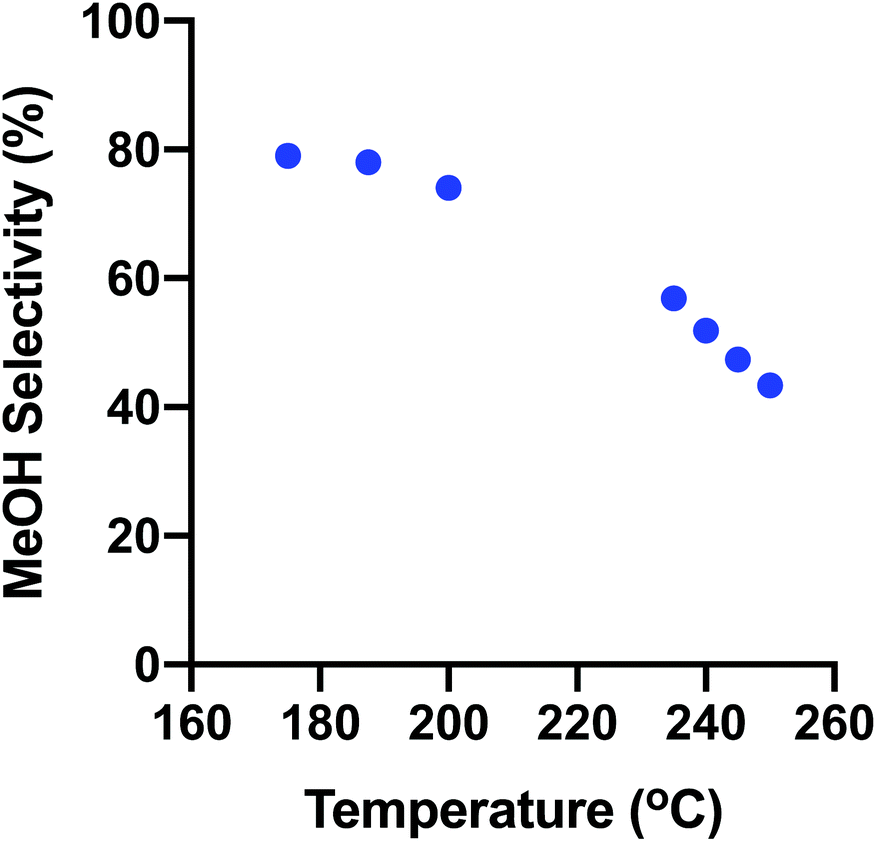 | ||
| Fig. 9 Fresh CZA MeOH Selectivity with T at ∼0.78 MPa, 3:1 H2:CO2 over the entire temperature range studied. | ||
3.4. Model comparison
The model used to benchmark the thermal reactor is based on Graaf.43 The model was derived based on the following parameters:T: 483–518 K (210–245 °C),
P: 1.5–5 MPa,
Reactor type: Spinning basket reactor (similar to Carberry CSTR reactor from Fig. 2),
Conversion: ∼1% XCO2
Catalyst: MK-101 Haldor Topsoe fresh CZA catalyst.
This model predicted the selectivity well (48.2–58.1% SMeOH) but the rates less accurately underestimating them by an order of magnitude (1.1–1.5 mmolMeOH gcat−1 h−1 at 3:1 H2:CO2 at 0.78 MPa and 508–523 K, 5.2 mg (reduced) CZA catalyst). The lower productivity of the simulated catalyst using this model may be due to the higher conversion (∼1%) condition. The model consists of a LHHW-type mechanism and involves three reactions: eqn (1) or RWGS, the reverse of eqn (2) or CO2-to-MeOH and the following eqn (8) or CO-to-MeOH:
| CO + 2H2 = CH3OH ΔH298K = −90.9 kJ mol−1 | (8) |
This third reaction is the sum of the WGS (reverse of eqn (1) and CO2-to-MeOH. The rate laws are derived considering a dual-site mechanism where there is competitive adsorption of CO and CO2 on the copper site, and H2 and H2O on the ZnO site, respectively. It also assumes dissociative H2 adsorption in the parameter range. This model's lowest pressure prediction is at 1.5 MPa; as such it is required to extrapolate to our systems’ pressure of 0.78 MPa. The model was used to compare against the high temperature range as these are the typical operating temperatures for CZA. If confirmed, this study's hybrid reactor has been optimized successfully. Due to CSTR modelling equations being analytical expressions, the model is not dependent on step-size parameters.
The Vanden Bussche and Froment model34 (used in our previous work19) was derived for a plug-flow reactor and uses only the RWGS (eqn (1)) and CO2-to-MeOH (the reverse of eqn (2)) reactions. CO2 is the main source of MeOH in this scheme, and the reactions are coupled by a surface oxygen intermediate.9 The parameters were the following:
T: 453–553 K (180–280 °C)
P: 1.5–5.1 MPa
Reactor type: Plug flow reactor
Conversion: 8–55% XCO2
pCO/pCO2: 0 to 4.1
Catalyst: Imperial Chemical Industries (ICI 51-2) fresh CZA catalyst.
This model predicted this study's selectivity less accurately, with a selectivity range of (35.1–55.8% SMeOH) and the rates overestimated by an order of magnitude (148.4–175.1 mmolMeOH gcat−1 h−1 at 3:1 H2:CO2 at 0.78 MPa and 508–523 K, 5.2 mg (reduced) CZA catalyst. The total selectivity change over the 15 K of the high T range (20.7%) was somewhat wider than found experimentally (13.5%). Reasons for this model's deviation in predicting absolute values include being derived for high non-differential conversion (in contrast to the Graaf model) and for a different reactor system (plug-flow type). Furthermore, it is expected that high product inhibition will change the product selectivity appreciably. This model, however, was used to predict the plug-flow operation and SV profiles in section 3.1. It was validated in our previous work.19
How the selectivity changes compared to the model derived from Graaf43 are compared in Table S10.† The starting selectivities (SMeOH) are comparable: 58.1 (model) vs. 56.9 (this study) %. However, there is a slight deviation in this study's selectivity change from 508 to 513 K (235 to 240 °C) of −3.3 (model) vs. −5.0 (this study)%. This may be due to the differences in the pressures used to derive the model. One would expect the model to predict a higher selectivity as it was derived at a higher pressure, as it does here at 508 K. Additionally, the Graaf model was derived for about 1% conversion. Thus, the Graaf model has slightly more product inhibition, and another reason why the experimental results and Graaf's model may not match exactly. Notwithstanding this minor difference, the total change in selectivity over the 4 temperatures (or 15 K) are comparable, at 9.9 (model) vs. 13.5 (this study) %. Correcting for the difference in starting selectivity, the total change is within ∼20%, an acceptable fit as the model will also trend selectivities higher. The rates derived from the model were 10-fold lower than those from this study. This corroborates well with the differences in conversions (5-fold) between this study and the model, and the effects of product inhibition known for CZA catalysts. Furthermore, there is noteworthy variation between CZA catalysts. In summary, the trend for the selectivity is clear and the incremental changes are comparable as the temperature increases. If the reactors were compared at the same conversion level it is likely these values would match more closely. However, conversion in this study was intentionally maintained at a low amount as (a) the objective was to identify the intrinsic activity of CZA catalyst, and (b) the system was maintained as a single phase.
3.6. Comparison of reactor performance to existing technology
The commercial operation using a plug-flow reactor can have a fresh catalyst MeOH rate of mid-60 mmolMeOH gcat−1 h−1 with optimal CO (29%), syngas stoichiometric number of 2.05 and at 523 K and 8 MPa, and GHSV of ∼10000 h−1.19 For 3:1 H2:CO2 syngas at the same commercial conditions, the simulated MeOH rate is 11.1 mmolMeOH gcat−1 h−1. The reason for the lower commercial rates with 3:1 syngas condition and at higher-P than this study is that the authors Vanden Bussche and Froment derived their rate law for higher commercially-relevant conversion (8–55% XCO2) conditions. At such high conversion conditions there is higher product inhibition and therefore the MeOH rates are more hindered. However, this analysis demonstrates the significant intrinsic rates CZA offers at low-P, low-conversion conditions and its extremely active nature that can be used as an important benchmark for new low-T and low-P MeOH catalysts.
3.7. Predicting higher pressure conditions
The hybrid reactor in this study is not limited to predicting low-pressure data only. With two or more low-pressure data points at the same feed gas composition, using an approximation of a power-type rate law, and ideal gas dependence, one can obtain a prediction of catalyst activity at higher pressures. The activity (rate) vs. total pressure relationship is derived from taking a ratio of the two low-pressure MeOH or RWGS rate laws (e.g. ambient and low-pressure (LP): 0.78 MPa) as shown in eqn (9).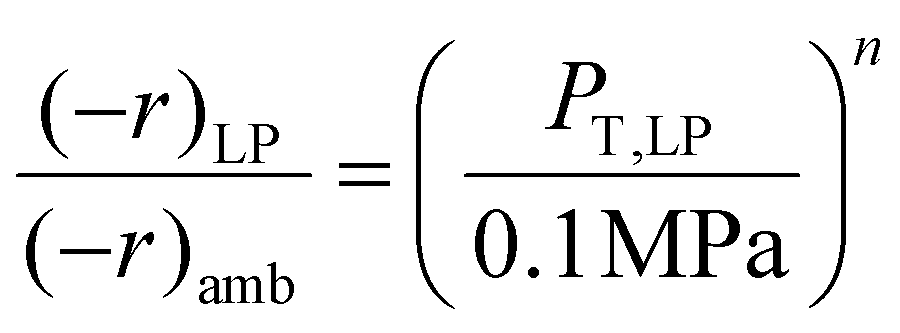 | (9) |
Where (−r)LP is the rate at low-pressure conditions (e.g. 0.78 MPa), (−r)amb is the rate at ambient pressure conditions (or 0.1 MPa), PT, LP is the total system pressure at (−r)LP or 0.78 MPa, 0.1 MPa is the total pressure at (−r)amb, and n is the unknown exponent that results from cancelling the Arrhenius rate laws. With these parameters known we can determine the n or the pressure-factor that applies over a reasonable (or approximating ideal gas conditions) pressure range. In determining eqn (9), other parameters such as the preexponential factors (Ki), activation energies (EA), and gas mole fractions (xi) all cancel out and leave the total pressures. With the rates at two separate pressures known, the exponent n can be deduced and used to approximate higher-pressure activity.
4. Version 2.0
4.1. Recycle pump
The best option to allow for higher conversion is to comprehensively heat trace all system lines to the recycle pump maximum operating temperature and/or source a higher temperature pump with a higher allowance of the diaphragm material. Another option is to implement a steam trap if condensation should occur. A steam trap installed upstream of the pump inlet would allow for any generated condensate to exit the system under pressure. This would allow higher system pressures and associated conversion. Another method was found in an older study44 whereby they suggest using an upstream heating coil to ensure isothermal conditions and a downstream cooling jacket to protect the pump. This method allows operation at high conversion, but its effectiveness is uncertain as it is essentially a plug-flow operation due to the single pass conversion registered. Regardless, the collected condensate would need to be weighed and analyzed separately for its MeOH concentration. Higher conversion catalyst screening is necessary to better understand catalyst performance at commercial high-conversion and high-yield conditions. This work demonstrated low-conversion, maximum activity with no product inhibition, but this regime is unlikely to be found in a scaled-up commercially-viable operation.4.2. Preheater reactivity with syngas
Between the burst disc and the reactor is a gas preheater. This was not ultimately needed as the Al-bead bed length was more than sufficient to preheat the syngas to reactor temperature (worst case 100% CO2 up to 523 K). Of interest, however, was the temperature at which a braided stainless-steel (SS) flex line becomes catalytically active at 0.78 MPa and 3:1 H2:CO2 syngas. This temperature was found to be ∼533 K (260 °C) where after 40 minutes, tens of ppm of CO were detected. This fact limited the temperature of the SS reactor to this upper limit. If the reactor tube were coated with a high T ceramic, providing the high temperature was confined to well defined area, this limit could be potentially have been overcome.
4.3. Nickel tetracarbonyl safety
Nickel-tetracarbonyl (Ni(CO)4), is generally considered the most toxic form of nickel.45 A gaseous compound, it can form when nickel containing SS contacts high concentrations of CO in reactant/product syngas. The acute lethality LC50 for humans has been estimated to be 3 ppmv (over 30 min) or an immediate fatal dose at 30 ppmv.45 An auxiliary heater was added in case it was suspected to have formed and needed to be decomposed. Its formation can be checked with a Ni(CO)4 specific gas sensor such as a Dräger tube. The heater could in theory recirculate 573 K (300 °C) gas in the system (see Fig. S5†), but due to the low heat capacities of gases (∼1.0 J g−1 K−1), the system's heated lines would need to be maintained at a suitable temperature as well. Thus, from the Fig. S5,† the pump would need to withstand a maximum wall temperature of 473 K, to decompose it before venting the system. If post venting (at ambient P), the temperature requirement would be 423–473 K in air. The decomposition varies inversely with the concentration of CO, and it will decompose naturally in 1 minute in the absence of CO in air.45 This additional safety feature was not used as the CO product was kept dilute. This is a challenge of using high-Ni SS as materials of construction for laboratory reactors and CO-rich syngas. Maintaining a system dilute in syngas with high throughput is another method to mitigate the formation of this toxic by-product, and was employed in this study.4.4. System pressure
A relatively easy solution to augment the system pressure is to increase the throughput of the MFCs (maximum 133 sccm at 3:1 H2:CO2 in this study). Increasing the flow would allow higher pressure operation by decreasing the residence time (higher flow at higher pressure resulting in a higher WHSV). But high feed/purge gas for a recirculating system can cause abrupt system pressure changes if not implemented with due caution. Furthermore, higher throughput of operation will require additional preheater checks due to the higher recycle flow to maintain the system at CSTR conditions. The current pump (Pump Works, Inc. PW2071) can deliver up to 4000 sccm recycle flow, allowing the feed to theoretically increase to 400 sccm. Additionally, however, the pressure-drop in the reactor section at such high recycle flows may become restrictive and necessitate easing of the bottom 0.5 μm sieve to ≥2 μm.
The pressure used in this work was set based on a safe margin for maintaining single-phase operation.
5. Conclusions
As presented, there are financial benefits to renewable MeOH producers in boosting the performance of catalysts at low-T and low-P conditions. We demonstrated that at this study's CO2-to-MeOH conditions the equilibrium MeOH yield and recycle compressor cost become comparable to high-performance CO-rich systems at 0.27–0.44-fold and 0.88–1.74-fold, respectively. At these low-severity conditions we demonstrated the operation of a pressurized CSTR-type reactor of the external recirculating type, with flexibility in operating temperature, at mild-pressure and low-conversion conditions. For this Version 1.0 reactor, material-of-construction reactivity, component design specifications and the desired CZA intrinsic performance determined the maximum T, P, and conversion scope of this study. Methods to exceed the pressure and conversion limitations in a Version 2.0 reactor have been presented, but higher T still presents challenges (although higher T is less critical for CO2-rich streams). Nonetheless, relevant activity data was collected for the CZA system for milder T (448–523 K) and P (0.78 MPa) MeOH production conditions: aspirational performance benchmarks for CO2-rich feeds. CO has been confirmed as a MeOH intermediate at lower temperatures, suggesting the importance of the RWGS for CZA-type catalysts at these conditions. The benefit of low-T and low-P operating conditions hinge on the prospect of accelerating a photocatalytic CZA catalyst's activity with light that will allow for more efficient CO2 utilization in terms of increased MeOH yield and the resulting reduction in capital and operating costs. Focusing on the RWGS activity at low temperature coupled with the rate determining step of CO hydrogenation may be of interest. The rigorousness of the quantitative data obtained and the system's reproducibility when testing with well-known catalysts was confirmed with models and literature references. Future testing of prospective thermal and photochemical MeOH catalysts can now proceed with certainty.Conflicts of interest
There are no conflicts to declare.Acknowledgements
AAT would like to especially thank visiting researcher Prof. Xiaoliang Yan of Taiyuan University of Technology for testing support and invaluable advice. Thank you to Keshav Raina for proof-reading the manuscript. Thank you to Dr. Ulrich Ulmer and Prof. C. A. Mims for early design discussions. Thank you to Mireille Ghoussoub for the TGA analysis. Thank you to Prof. A. Steinfeld of ETH Zurich for design discussions and advice. Thank you to the exceptional Chemistry Machine Shop staff: Ahmed Bobat, John Ford and David Heath for design discussions and system assembly. Thank you to Jack Jackiewicz of the Chemistry Electronics Shop for automation and electronics support. GAO acknowledges the financial support of the Ontario Ministry of Research and Innovation (MRI), the Ministry of Economic Development, Employment and Infrastructure (MEDI), the Ministry of the Environment and Climate Change's (MOECC) Best in Science (BIS) Award, Ontario Centre of Excellence Solutions 2030 Challenge Fund, Ministry of Research Innovation and Science (MRIS) Low Carbon Innovation Fund (LCIF), Imperial Oil, the University of Toronto's Connaught Innovation Fund (CIF), Connaught Global Challenge (CGC) Fund, and the Natural Sciences and Engineering Research Council of Canada (NSERC).Notes and references
- MMSA World Supply and Demand Summary, 2020.
- GlobalData, ESI Africa, 2019 Search PubMed.
- Centre for Industry Education, Methanol, Ethylene and Propylene, http://www.essentialchemicalindustry.org.
- European Chemical Industry Council (Cefic), Facts & Figures of the European chemical industry, 2018 Search PubMed.
- M. F. Sgroi, F. Zedde, O. Barbera, A. Stassi, D. Sebastián, F. Lufrano, V. Baglio, A. S. Aricò, J. L. Bonde and M. Schuster, Energies, 2016, 9, 1008–1026 CrossRef.
- G. A. Olah, A. Goeppert and G. K. S. Prakash, Beyond Oil and Gas: The Methanol Economy, Wiley-VCH Verlag GmbH & Co. KGaA, Weinheim, Germany, 2009 Search PubMed.
- Michael Wang, Well-to-Wheels Energy and Emission Impacts of Vehicle/Fuel Systems, 2003 Search PubMed.
- D. Previtali, M. Longhi, F. Galli, A. Di Michele, F. Manenti, M. Signoretto, F. Menegazzo and C. Pirola, Fuel, 2020, 274, 117804 CrossRef CAS.
- J. F. Portha, K. Parkhomenko, K. Kobl, A. C. Roger, S. Arab, J. M. Commenge and L. Falk, Ind. Eng. Chem. Res., 2017, 56, 13133–13145 CrossRef CAS.
- K. Klier, R. Chatikavanu, G. Herman and G. W. Simmons, J. Catal., 1982, 74, 343–360 CrossRef CAS.
- W. C. Liu, J. Baek and G. A. Somorjai, Top. Catal., 2018, 61, 530–541 CrossRef CAS.
- B. Xie, R. J. Wong, T. H. Tan, M. Higham, E. K. Gibson, D. Decarolis, J. Callison, K. F. Aguey-Zinsou, M. Bowker, C. R. A. Catlow, J. Scott and R. Amal, Nat. Commun., 2020, 11, 1–11 Search PubMed.
- V. Dieterich, A. Buttler, A. Hanel, H. Spliethoff and S. Fendt, Energy Environ. Sci., 2020, 13, 3207–3252 RSC.
- P. Kaiser, R. B. Unde, C. Kern and A. Jess, Chem. Ing. Tech., 2013, 85, 489–499 CrossRef CAS.
- O. S. Joo, K. D. Jung, I. Moon, A. Y. Rozovskii, G. I. Lin, S. H. Han and S. J. Uhm, Ind. Eng. Chem. Res., 1999, 38, 1808–1812 CrossRef CAS.
- F. Vidal Vázquez, P. Pfeifer, J. Lehtonen, P. Piermartini, P. Simell and V. Alopaeus, Ind. Eng. Chem. Res., 2017, 56, 13262–13272 CrossRef.
- I. Dimitriou, P. García-Gutiérrez, R. H. Elder, R. M. Cuéllar-Franca, A. Azapagic and R. W. K. Allen, Energy Environ. Sci., 2015, 8, 1775–1789 RSC.
- M. Juneau, M. Vonglis, J. Hartvigsen, L. Frost, D. Bayerl, M. Dixit, G. Mpourmpakis, J. R. Morse, J. W. Baldwin, H. D. Willauer and M. D. Porosoff, Energy Environ. Sci., 2020, 13, 2524–2539 RSC.
- A. A. Tountas, X. Peng, A. V. Tavasoli, P. N. Duchesne, T. L. Dingle, Y. Dong, L. Hurtado, A. Mohan, W. Sun, U. Ulmer, L. Wang, T. E. Wood, C. T. Maravelias, M. M. Sain and G. A. Ozin, Adv. Sci., 2019, 6, 1–52 Search PubMed.
- K. W. Ting, T. Toyao, S. M. A. H. Siddiki and K. I. Shimizu, ACS Catal., 2019, 9, 3685–3693 CrossRef CAS.
- F. Liao, X. P. Wu, J. Zheng, M. M. J. Li, A. Kroner, Z. Zeng, X. Hong, Y. Yuan, X. Q. Gong and S. C. E. Tsang, Green Chem., 2017, 19, 270–280 RSC.
- O. A. Ojelade and S. F. Zaman, Catal. Surv. Asia, 2020, 24, 11–37 CrossRef CAS.
- K. Sun, N. Rui, Z. Zhang, Z. Sun, Q. Ge and C.-J. Liu, Green Chem., 2020, 22, 5059–5066 RSC.
- L. Wang, M. Ghoussoub, H. Wang, Y. Shao, W. Sun, A. A. Tountas, T. E. Wood, H. Li, J. Y. Y. Loh, Y. Dong, M. Xia, Y. Li, S. Wang, J. Jia, C. Qiu, C. Qian, N. P. Kherani, L. He, X. Zhang and G. A. Ozin, Joule, 2018, 2, 1369–1381 CrossRef CAS.
- Y. Dong, P. Duchesne, A. Mohan, K. K. Ghuman, P. Kant, L. Hurtado, U. Ulmer, J. Y. Y. Loh, A. A. Tountas, L. Wang, A. Jelle, M. Xia, R. Dittmeyer and G. A. Ozin, Chem. Soc. Rev., 2020, 49, 5648–5663 RSC.
- D. Wu, K. Deng, B. Hu, Q. Lu, G. Liu and X. Hong, ChemCatChem, 2019, 11, 1598–1601 CrossRef CAS.
- G. Chen, G. I. N. Waterhouse, R. Shi, J. Zhao, Z. Li, L. Z. Wu, C. H. Tung and T. Zhang, Angew. Chem., Int. Ed., 2019, 58, 17528–17551 CrossRef CAS.
- K. Li, B. Peng and T. Peng, ACS Catal., 2016, 6, 7485–7527 CrossRef CAS.
- J. T. Sun, I. S. Metcalfe and M. Sahibzada, Ind. Eng. Chem. Res., 1999, 38, 3868–3872 CrossRef CAS.
- R. J. Davis and M. E. Davis, Fundamentals of Chemical Reaction Engineering, Dover Publications, Inc., New York, 2003 Search PubMed.
- E. V. Kondratenko, G. Mul, J. Baltrusaitis, G. O. Larrazábal and J. Pérez-Ramírez, Energy Environ. Sci., 2013, 6, 3112–3135 RSC.
- T. Takata, J. Jiang, Y. Sakata, M. Nakabayashi, N. Shibata, V. Nandal, K. Seki, T. Hisatomi and K. Domen, Nature, 2020, 581, 411–414 CrossRef CAS.
- C. Ortega, M. Rezaei, V. Hessel and G. Kolb, Chem. Eng. J., 2018, 347, 741–753 CrossRef CAS.
- K. M. Vanden Bussche and G. F. Froment, J. Catal., 1996, 10, 1–10 CrossRef.
- B. D. Patterson, F. Mo, A. Borgschulte, M. Hillestad, F. Joos, T. Kristiansen, S. Sunde and J. A. van Bokhoven, Proc. Natl. Acad. Sci. U. S. A., 2019, 116, 12212–12219 CrossRef CAS.
- M. J. Bos, S. R. A. Kersten and D. W. F. Brilman, Appl. Energy, 2020, 264, 1–11 CrossRef.
- M. J. Bos and D. W. F. Brilman, Chem. Eng. J., 2015, 278, 527–532 CrossRef CAS.
- L. R. Clausen, N. Houbak and B. Elmegaard, Energy, 2010, 35, 2338–2347 CrossRef CAS.
- M. Bowker, ChemCatChem, 2019, 11, 4238–4246 CrossRef CAS.
- M. Zabilskiy, V. L. Sushkevich, D. Palagin, M. A. Newton, F. Krumeich and J. A. van Bokhoven, Nat. Commun., 2020, 11, 1–8 Search PubMed.
- Y. Yang, C. A. Mims, D. H. Mei, C. H. F. Peden and C. T. Campbell, J. Catal., 2013, 298, 10–17 CrossRef CAS.
- H. Bahruji, J. R. Esquius, M. Bowker, G. Hutchings, R. D. Armstrong and W. Jones, Top. Catal., 2018, 61, 144–153 CrossRef CAS.
- H. Graaf and E. J. Stamhuis, Chem. Eng. Sci., 1988, 43, 3185–3195 CrossRef.
- R. F. Miller and I. M. Hoyt, J. Chem. Inf. Model., 1987, 53, 1689–1699 Search PubMed.
- M. D. Hurlimann, Acute Exposure Guideline Levels for Selected Airborne Chemicals, 2007, vol. 21 Search PubMed.
Footnote |
| † Electronic supplementary information (ESI) available. See DOI: 10.1039/d0gc03115a |
| This journal is © The Royal Society of Chemistry 2021 |