
 Open Access Article
 This Open Access Article is licensed under a
 Creative Commons Attribution 3.0 Unported Licence
Carotenoids improve bacterial tolerance towards biobutanol through membrane stabilization†
Geraldine W. N.
Chia
 ab,
Thomas
Seviour
bc,
Staffan
Kjelleberg
bd and
Jamie
Hinks
*b
ab,
Thomas
Seviour
bc,
Staffan
Kjelleberg
bd and
Jamie
Hinks
*b
aInterdisciplinary Graduate School (IGS), Nanyang Technological University, 637335 Singapore
bSingapore Centre for Environmental Life Sciences Engineering (SCELSE), Nanyang Technological University, 637551 Singapore. E-mail: jhinks@ntu.edu.sg
cWATEC Aarhus University Centre for Water Technology, Nørrebrogade 44, Bldg 1783, 8000 Aarhus, Denmark
dSchool of Biological, Earth and Environmental Sciences, University of New South Wales, Australia
First published on 6th January 2021
Abstract
Microbial butanol production is an important sustainable energy option, but it is economically limited by poor process performance. Butanol is toxic and damages bacterial cell membranes, requiring cells to expend energy for survival rather than for butanol production. Here we explore the utility of two polar carotenoids, lutein (LUT) and zeaxanthin (ZEA), as molecular rivets to mitigate membrane fluidization by solvents and thus improve butanol tolerance in Escherichia coli. LUT and ZEA formed carotenoid-rich nanodomains in multilamellar vesicles, at molar ratios of 1![[thin space (1/6-em)]](https://www.rsc.org/images/entities/char_2009.gif) :9 relative to phospholipids (10 mol%), which reduced the fluidization effect of 3.5% (v/v) butanol by 62%, as indicated by changes in generalized polarization values of the membrane fluidity probe, Laurdan. Additionally, membrane penetration of butanol was 38% lower in the same test system. In carotenoid-treated E. coli, butanol-induced membrane damage, determined by propidium iodide, decreased by up to 30%. Additionally, E. coli treated with both LUT and ZEA achieved a two-log increase in cell viability upon acute butanol exposure of 3.5% (v/v), compared to untreated cells. This is the first time that carotenoids have been used to fortify cellular membranes and reduce biomass loss due to butanol, thereby revealing a potential biotechnological application for carotenoids to improve the economics of microbial butanol production.
:9 relative to phospholipids (10 mol%), which reduced the fluidization effect of 3.5% (v/v) butanol by 62%, as indicated by changes in generalized polarization values of the membrane fluidity probe, Laurdan. Additionally, membrane penetration of butanol was 38% lower in the same test system. In carotenoid-treated E. coli, butanol-induced membrane damage, determined by propidium iodide, decreased by up to 30%. Additionally, E. coli treated with both LUT and ZEA achieved a two-log increase in cell viability upon acute butanol exposure of 3.5% (v/v), compared to untreated cells. This is the first time that carotenoids have been used to fortify cellular membranes and reduce biomass loss due to butanol, thereby revealing a potential biotechnological application for carotenoids to improve the economics of microbial butanol production.
Environmental significanceAdvanced biofuels have a place in sustainable energy infrastructure because they offset the life cycle carbon footprint of conventional fossil fuels while at the same time achieving waste valorization. The widespread adaptation of advanced biofuels such as biobutanol is complicated by marginal economics and sensitivity to oil price fluctuations. Process improvements aimed at increasing biobutanol yields are an active area of study. We present a fundamental biophysical study showing that carotenoids have the potential to improve microbial membrane tolerance to butanol and potentially improve yields. 8.5 million tonnes of carotenoid rich tomato pomace is produced annually which has no commercial value. We reason that carotenoid rich waste streams would make ideal, dual-use feedstock that simultaneously provide process improvement additives as well as a source of biomass. This work sets the scene for such bioprocess investigations and is the first step on a journey towards achieving economical biobutanol production. |
Introduction
Liquid biofuels are compatible with current energy infrastructure, positioning microbial butanol production as an important source of renewable energy.1 Currently, ethanol is the most highly produced biofuel, reflecting the availability of mature yeast fermentation technology. However, ethanol's miscibility with water means that its recovery is energy intensive.2 Conversely, butanol is an alternative biofuel that can be produced via microbial fermentation, it does not mix well with water and has a higher energy density as compared with ethanol.2Although it is a promising next-generation biofuel, butanol is a poor economic proposition when directly compared to ethanol,2 which poses a barrier to its widespread use as a sustainable fuel. The production costs of butanol are inversely related to the solvent yields of microbial production as well as production titers.3 One strategy to increase solvent yields would be to prolong the lifespan of the fermentative microorganisms by reducing biomass loss that is a result of end-product toxicity. Approaches that additionally increase production titres above that of natural producers (≈3% (v/v) butanol) are also desirable. Both intra and extracellular butanol are toxic to the producing organism. While microorganisms can be genetically engineered with efflux pumps to actively export butanol from the cells,4 their cellular membranes will still be disrupted by extracellular butanol.
Mechanistically, butanol readily partitions itself into the phospholipid bilayer of the membrane and increases the disorder in the hydrophobic tails of the phospholipids.5 The disordering effect causes the membrane to deviate from optimum fluidity. Consequently, other metabolic functions are inhibited, which is detrimental to both cell survival and bioproduction.6 Strategies that enable tolerance to extracellular butanol stresses are thus required to preserve biomass in microbial production bioprocesses.
Manipulation of the cell membrane composition is a common approach to increase microbial solvent tolerance, and can be achieved through genetic engineering,7 for example through increasing the proportion of saturated hydrocarbon tails of phospholipids to reduce membrane fluidity.8 Microbial membrane fluidity can also be influenced by the presence of molecules that intercalate the membrane. An example being the class of molecules known as carotenoids that modulate the fluidity of heat-exposed membranes9,10 by influencing the motional freedom of phospholipid tails.11 The eight repeating isoprene units in carotenoids provide a highly rigid and hydrophobic molecular framework that is terminated by an ionone ring at each end of the molecule. Polar carotenoids are characterized by the presence of hydroxyl, keto- or epoxide functionalities on the ionone rings whose polar surface area allows the perpendicular orientation of the molecules with respect to the membrane surface (Fig. 1). Notably, polar carotenoids only increase the rigidity of membranes that are in the fluid phase.12–14 Hence, they act as rivets to increase the rigidity of the lipid bilayer.12,15,16 Conceptually, membranes that comprise polar carotenoids should be less prone to fluidization under butanol stress.
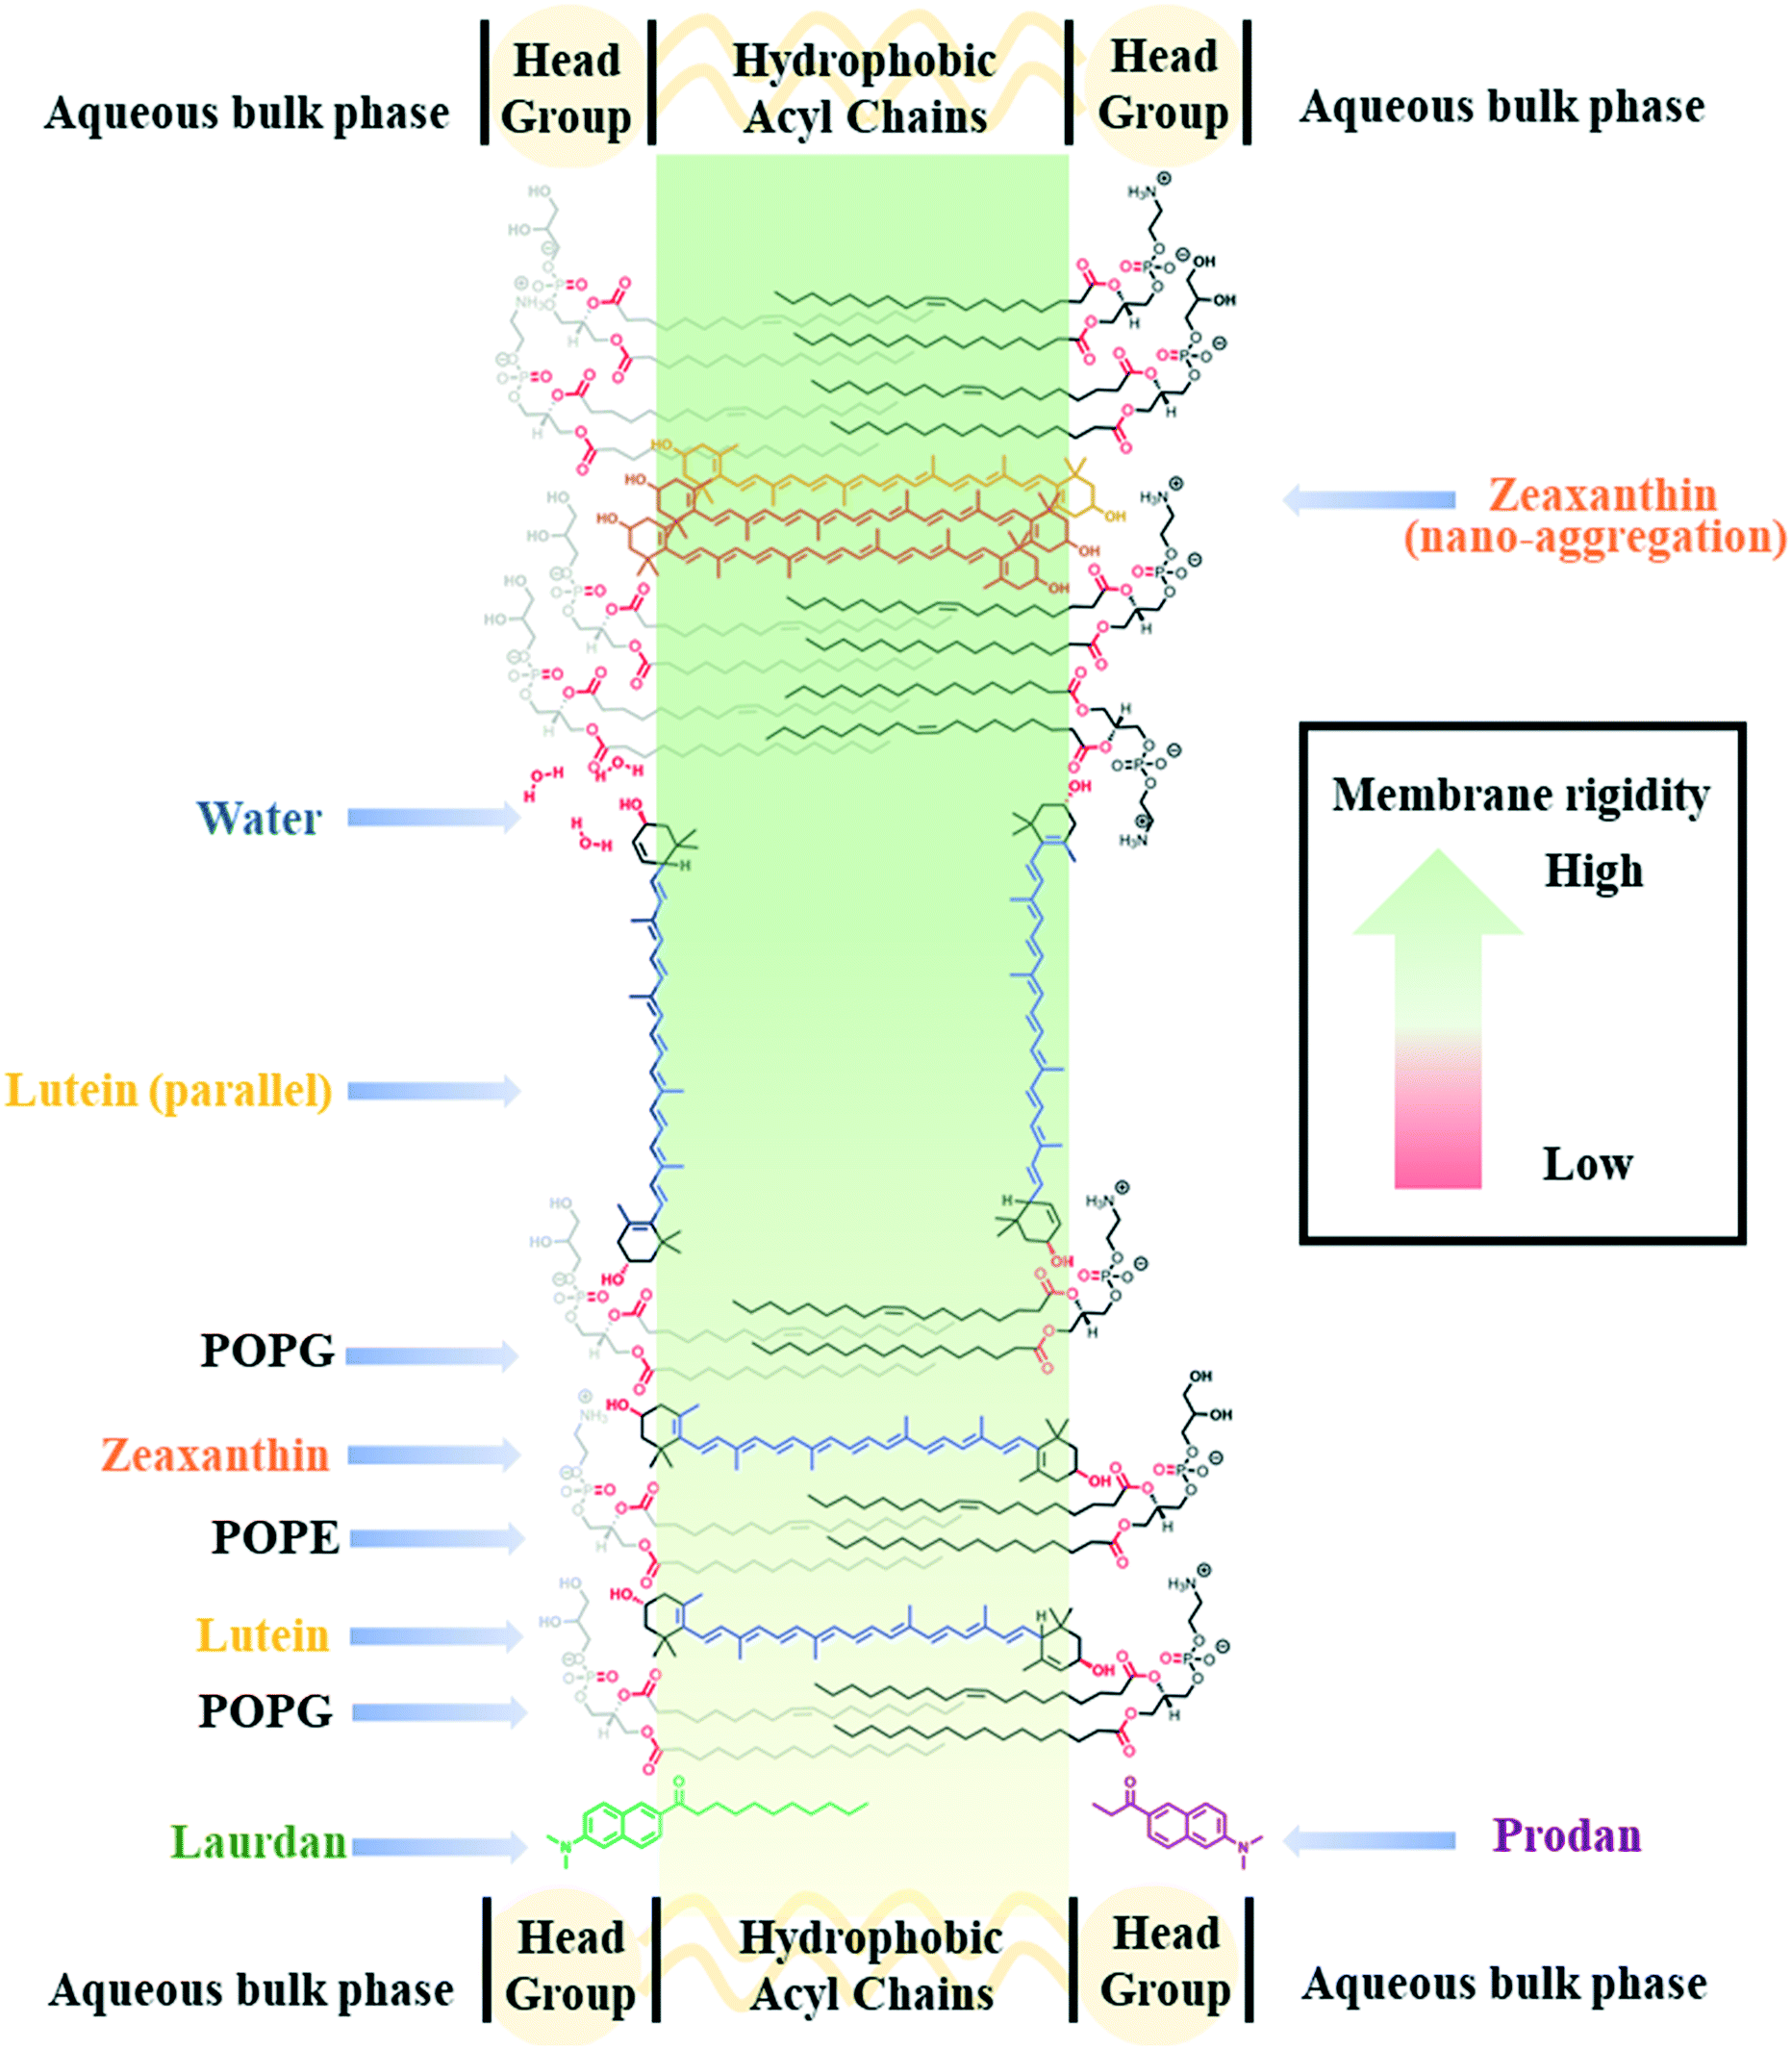 | ||
| Fig. 1 Schematic model of the membrane intercalation of polar carotenoids and the localization of two membrane probes, Laurdan and Prodan. A model prokaryotic phospholipid bilayer comprising representative bacterial lipids 1-palmitoyl-2-oleoyl-sn-glycero-3-phosphoethanolamine (POPE) and 1-palmitoyl-2-oleoyl-sn-glycero-3-phospho-(1′-rac-glycerol) (POPG). The carotenoids, LUT and ZEA, generally span the lipid bilayer. Prodan only associates within the hydrophilic (headgroup) region, while Laurdan associates more dominantly in the hydrophobic (acyl chain) region. Highlighted in red are the functional groups on phospholipids, carotenoids and water that can form hydrogen bonds with each other. The nano-aggregation of carotenoids increases membrane rigidity relative to their individual counterparts. | ||
We hypothesize that the supplementation of carotenoids as chemical additives to cell cultures would be an environmentally friendly, materials-based approach to biological strain improvement in microbial biofuel production.17–19 Herein, we begin by applying a systematic biophysical approach to study the effects of two polar carotenoids, lutein and zeaxanthin, on a prokaryotic lipid model system (multilamellar vesicles, MLVs) consisting of phosphatidylethanolamine (PE) and phosphatidylglycerol (PG) (Fig. 1). In addition, we aimed to extend these biophysical studies on model Gram-negative microbial membranes to proof-of-concept validation studies on live bacteria. For this we used Gram-negative microorganism, Escherichia coli which is a workhorse for biotechnology and common candidate for genetic modification. We showed that the incidental nano-aggregation of polar carotenoids mitigate butanol-induced fluidization of the bacterial membrane, thereby increasing the membrane tolerance and the survivability of E. coli against butanol challenge. To the best of our knowledge, this is the first systematic study of carotenoid–membrane interactions deploying a binary lipid model (i.e. PE and PG) that is representative of bacterial membranes. It is also the first study to describe the interaction of carotenoid nanodomains with cellular membranes, to tackle the challenge of increasing microbial membrane tolerance towards butanol.
Experimental
Chemicals
Carotenoids were obtained from Carbosynth (United Kingdom) at 88% purity for lutein and 95% purity for zeaxanthin. Stock solutions of carotenoids were prepared in dimethyl sulfoxide (DMSO) at 1 mg mL−1 for use in bacterial20 systems but at 5 mg mL−1 in chloroform for use with multilamellar vesicles. Synthetic phospholipids, 1-palmitoyl-2-oleoyl-sn-glycero-3-phosphoethanolamine (POPE) and 1-palmitoyl-2-oleoyl-sn-glycero-3-phospho-(1′-rac-glycerol) (POPG) were obtained, ready for use, from Avanti Polar Lipids, in 25 mg mL−1 chloroform stock solutions. Propidium iodide (PI) was obtained from ThermoFisher Scientific, as a component of the LIVE/DEAD® BacLight Bacterial Viability kit. Laurdan, Prodan and solvents used in this study (butanol, pentanol, methanol, ethanol chloroform and DMSO) were purchased from Sigma-Aldrich. Stock solutions of Laurdan and Prodan were maintained in methanol at 2.83 mM. A 10X stock solution of phosphate buffer solution (PBS) was prepared as follow: 25.6 g Na2HPO4·7H2O, 80 g NaCl, 2 g KCl and 2 g KH2PO4 in 1 L distilled water, and diluted before use (pH 7.2). All experiments with synthetic liposomes were carried out using the aqueous buffer comprising 10 mM 4-(2-hydroxyethyl)-1-piperazineethanesulfonic acid and 100 mM NaCl (HEPES) (pH 7.2).Multilamellar vesicle (MLV) stock preparation
Chloroform stock solutions of carotenoids, POPE and POPG were mixed in appropriate volumes to achieve desired concentrations of 0.5, 1, 2.5, 5 and 10 mol% carotenoid in a PE:PG mix of 85:15.5,21 Chloroform was evaporated from the mixture under a stream of nitrogen and subsequently kept under vacuum for at least 4 h before rehydration.22 The dried films were rehydrated with HEPES at 37 °C to form PEPG multilamellar vesicles (PEPG MLVs) at a stock concentration of 2 mg mL−1. The aqueous mixtures were then stirred continuously on a magnetic stir plate at 37 °C ± 2 °C for 2 h. At least two stock samples of each concentration were prepared and were used as independent replicates in the DSC measurements and fluidity assays.
Bacterial strains and growth conditions
E. coli K12 (ATCC 10798) was maintained on Lysogeny Broth (LB, Lennox) agar. For culture, single colonies were inoculated into LB and incubated at 37 °C overnight. Mid-log cultures were obtained by inoculating 100 μL of overnight E. coli cultures (100X dilution) into 10 mL of fresh LB, and incubated for 4 h at 37 °C. Cells that needed to be harvested for washing with PBS, were centrifuged at 12000g for 10 min. Experimental monitoring of E. coli growth curves was performed as follows: mid log cultures were diluted 100X into fresh LB, 200 μL of the diluted culture was transferred to clear 96-well microtiter plates (Nunc™) and growth was monitored at 600 nm every 15 min, over 18 h at 37 °C in a M200 TECAN plate reader. For all carotenoid-supplemented experiments with E. coli (including the growth measurements), the final working concentration of carotenoids supplemented was 10 μg mL−1. As the carotenoids were sequentially diluted from their DMSO stocks, treated cultures contained approximately 6.25% (v/v) of DMSO in the final solution. Control samples were spiked to achieve the same DMSO content and monitored as above.
Differential scanning calorimetry (DSC)
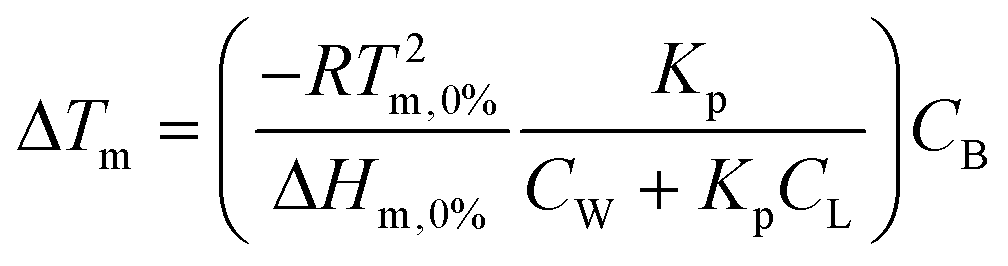
DSC thermograms were obtained through measurements using a Nano DSC TA instrument. MLVs were diluted 1:1 with HEPES buffer, from their stocks to a final MLV concentration of 1 mg mL−1 prior to DSC experiments. For butanol challenge experiments, MLVs were diluted 1:1 with HEPES buffer that contained butanol at 2X the test concentration of either 1, 2 or 3% (v/v). The scans were carried out at the temperature range of 3–40 °C with a ramp rate of 1 °C min−1, in both heating and cooling directions.5 Samples were equilibrated for 300 seconds after each heating and cooling scan in all experiments. Two independent DSC experiments were carried out for each type of MLV and at each butanol concentration. Baseline subtraction from the blank buffers and estimation of thermodynamic parameters (Tm, ΔH and ΔS) were carried out in NanoAnalyzer. Molar heat capacity (Cp) was determined as the maximum value of the main phase transition peaks in each thermogram (Fig. S1A†). Full width at half maximum (FWHM) was estimated as the difference between T1 and T2, where T1 and T2 are two distinct temperatures at which the molar heat capacity measured is half that of Cp (Fig. S1A†). The linear fitting of ΔTm against butanol concentration (CB) was first carried out in OriginPro 9.0, with the line passing through origin. The slope of the line was then used to estimate Kp based on the expression in the parenthesis found in eqn (2).23 Statistical analysis using the Student's t-test was carried out in OriginPro. 9.0.| ΔTm = Tm,x% − Tm,0% | (1) |
 | (2) |
Membrane fluidity assay
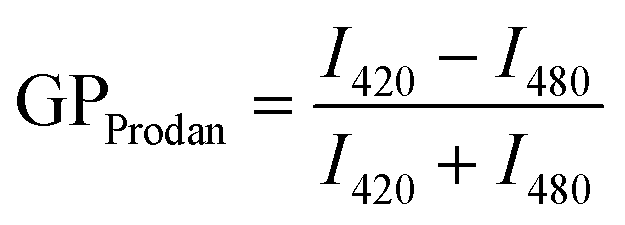
Fluorescent membrane probes, Laurdan and Prodan, were used to report the effects of carotenoids and butanol on membrane polarity and fluidity at different regions of the membrane. Generalized polarization (GP) values were calculated as described by Parasassi (1998)24,39 (eqn (3) and (4)).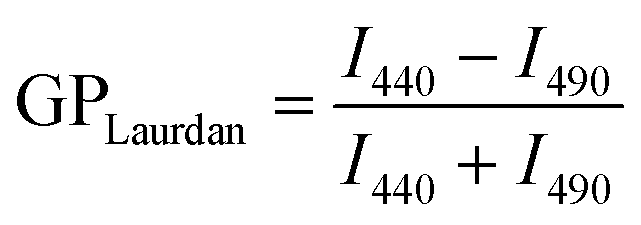 | (3) |
 | (4) |
The extent to which butanol fluidizes the lipid bilayer was also quantified by calculating the difference in GP values between x% butanol and 0% butanol (i.e. the control) for each type of MLV based on eqn (5).
| ΔGP = GPx% − GP0% | (5) |
MLV stock solutions were diluted to 1 mg mL−1 with HEPES buffer and then stained with 28 μM of either Laurdan or Prodan dye. Aliquots (100 μL) of the stained MLVs were transferred to the wells of a 96-well black plate with clear glass bottom (Corning®), and added to 100 μL of buffer containing solvent (butanol or pentanol), at 2X of the target concentration. The plate was then incubated in a M200 TECAN plate reader at 37 °C for one hour to achieve a homogenous temperature, before fluorescence measurements from 400 to 600 nm were performed. GP values were then calculated based on eqn (3) and (4) above for Laurdan and Prodan respectively,24 and the raw GP values were normalized against the control within each set of experiments. Statistical analysis using the Student's t-test was carried out in OriginPro. 9.0.
Carotenoid uptake determination
To determine the carotenoid carrying capacity of E. coli, we titrated biomass by varying the optical density (OD600) of a culture of E. coli against a fixed carotenoid concentration (10 μg mL−1). Mid log E. coli cultures were first harvested after two washes with PBS and then adjusted to an optical density (OD600) of 2, and diluted accordingly where necessary with PBS to 2X of the final OD600 to be tested (0.0625, 0.125, 0.5 and 1). Tubes that contain the same volume of only PBS (without any cells) were used as control. Carotenoids were then added at a final concentration of 10 μg mL−1 and incubated on bench for half an hour. After which, the cells were spun down and washed with PBS. Carotenoids that had been taken up into the cells were then extracted using procedures reported previously.25 Briefly, the cell pellet was resuspended in 100% methanol and heated at 85 °C for 20 min. Methanol extracts (200 μL) were then transferred to 96-well microtiter plates and their absorbance intensity at 450 nm determined using the M200 TECAN plate reader. The concentration of carotenoids in the methanol extract was then estimated based on a calibration curve with carotenoids (0.125–20 μg mL−1) in methanol (Fig. S5†).Membrane damage assessment
Overnight cultures of E. coli were harvested and washed twice with PBS before adjusting the cell density to OD 1. The washed cell culture was then treated with carotenoids for one hour, before being challenged with butanol at 0, 0.6, 1.2, 1.8, 2.4 and 3.5% (v/v) for 15 min. The cells were then washed with PBS twice, followed by resuspension in PBS. The turbidity of the challenged cells was then normalized to OD600 = 0.02. An aliquot (100 μL) of the normalized cultures was then transferred to a blank 96-well microtiter plate and stained with propidium iodide (PI) at a final working concentration of 10 μM. The fluorescence intensity of PI was determined from 550–800 nm (λex = 465 nm), in a M200 TECAN plate reader. The change in fluorescence intensity at 630 nm (ΔI630) was calculated for butanol challenged cells, based on eqn (6) below. Statistical analysis using the Student's t-test was carried out in OriginPro. 9.0.| ΔI630 = I630,x% − I630,0% | (6) |
Acute butanol challenge
Mid log E. coli cultures were harvested after two washes with fresh LB. The washed culture was first adjusted to an optical density (OD) of 2 and then added to an equal volume of LB media that contained carotenoids at 2X of the final working concentration. The treatment was carried out at room temperature for 1 h. After which, the cells were challenged with 0% or 3.5% butanol, in a 96-well microtiter plate for 30 min before colony forming units (CFU) were enumerated on LB agar plates The acute challenge of 3.5% (v/v) butanol applied here simulates extreme butanol challenge above that of natural butanol producers, i.e. reflecting conditions which might be found in economically viable, advanced biobutanol production process.Results and discussion
Carotenoid nano-aggregation decreases hydrophobic interactions between acyl chains of phospholipids
Peak broadening in the differential scanning calorimetry (DSC) thermograms was observed in the gel-to-liquid crystalline phase transition peak for MLVs containing lutein (LUT–MLVs) and zeaxanthin (ZEA–MLVs) (Fig. 2A and B). The extent of peak broadening is proportionate to the molar concentration of carotenoids (see full width at half maximum (FWHM) values in Table S1†). Furthermore, the apparent molar heat capacity (Cp) decreases non-linearly as a function of carotenoid concentration (Fig. 2C). This contrasts with the linear trend of non-polar carotenoids (i.e. beta-carotene and carotene), which has been shown in an earlier study with phosphatidylcholine in the same concentration regime,22 and that is likely due to the random association of non-polar carotenoids in the hydrophobic region of the bilayer as they do not assume specific orientations or aggregations.22,26,27 These changes in membrane thermodynamics suggest that LUT and ZEA aggregate within the lipid bilayer and the extent of aggregation is dependent on carotenoid concentration.17,22,27–31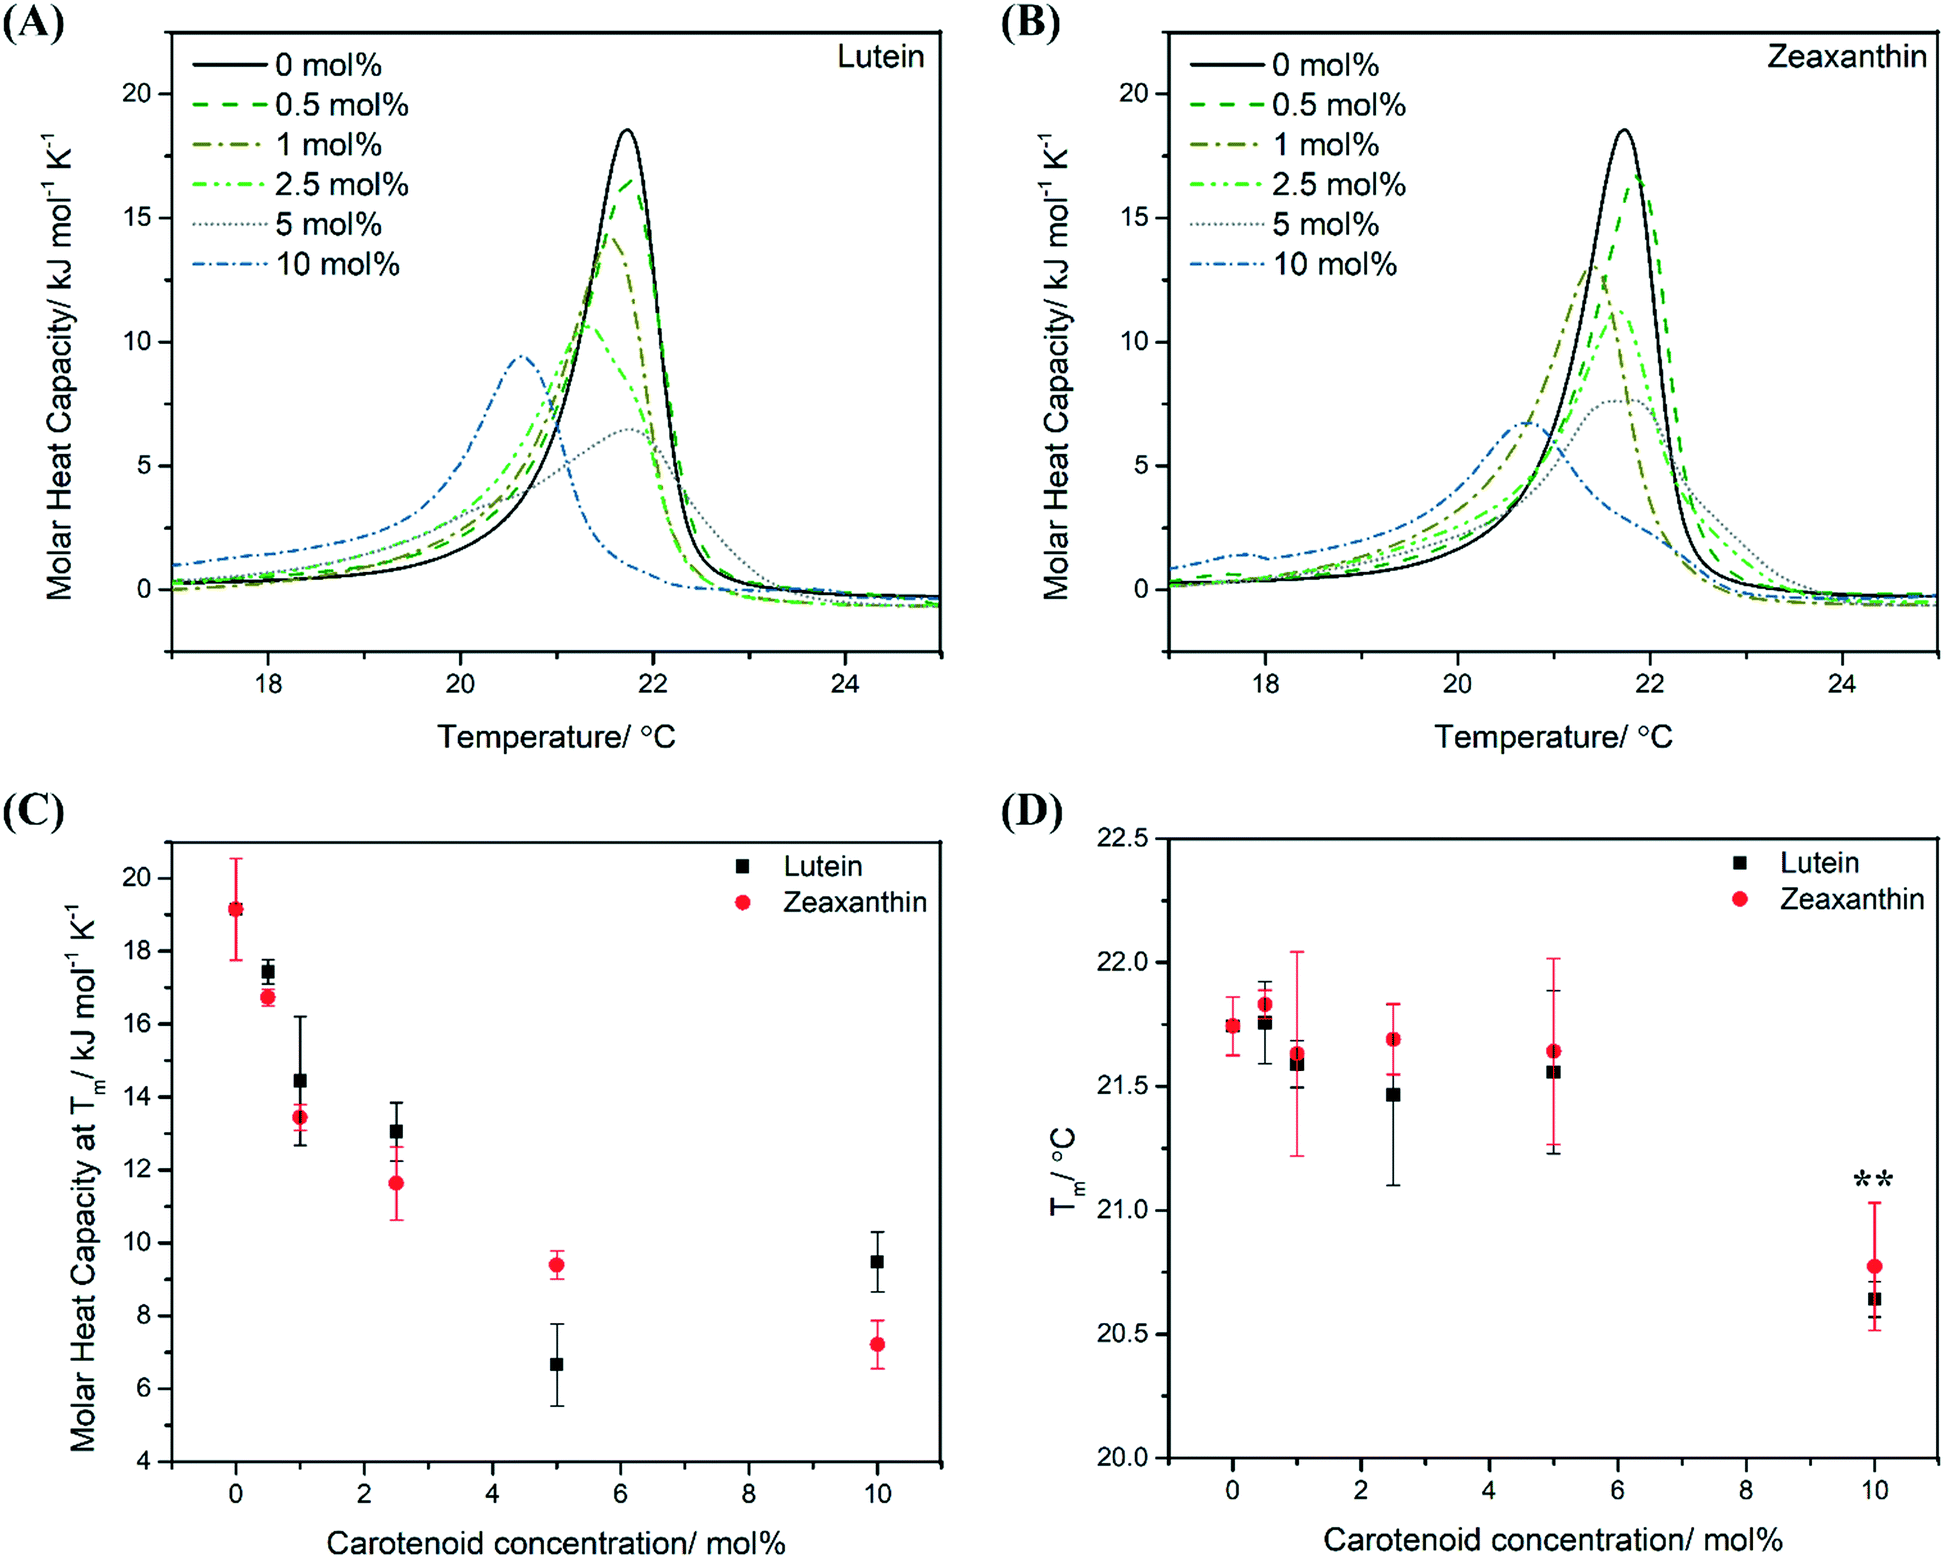 | ||
| Fig. 2 Aggregation at 10 mol% (high carotenoid concentration) substantially influences thermodynamic properties of PEPG MLVs. Differential scanning calorimetry (DSC) cooling thermograms of PEPG MLVs that comprise different molar concentrations of LUT (A) and ZEA (B) from 0 to 10 mol% (average of two independent replicates). The x-axis has been scaled from 17–25 °C (for a representative raw thermogram, see Fig. S1B†). Plot of molar heat capacity (Cp, kJ mol−1 K−1) (C) and phase transition temperature (Tm, °C) (D) as a function of carotenoid concentration (mol%). ** indicates p value that is less than 0.05 (Student's t-test). | ||
Further, MLVs that contain 0.5 mol% carotenoids exhibited similar melting temperatures (Tm), as well as other basic thermodynamic parameters (ΔH and ΔS), as compared to control MLVs (Fig. 2D, S1C and D†). This suggests that, at low concentrations, carotenoids adopt a monomeric organization in the MLVs such that the interactions between neighbouring acyl tails are not disrupted extensively.28,31 On the other hand, carotenoids at 10 mol% were observed to perturb the lipid bilayer the most, as indicated by the greatest reduction in Tm, where it decreased by approximately 1 °C for both 10 mol% LUT–MLVs (Tm = 20.6 °C (±0.1), p < 0.05) and ZEA–MLVs (Tm = 20.8 °C (±0.3), p < 0.05) (Fig. 2D). This indicates that the cooperative melting of the acyl tails is substantially weaker in these MLVs, compared to control MLVs. We infer that the molecular aggregation observed at high carotenoid concentrations promotes the formation of carotenoid-rich domains within the lipid bilayer, where the Van de Waals and hydrophobic interactions between acyl tails and carotenoids are likely to be more dominant than interactions between neighboring acyl tails.30,32 These carotenoid-rich nanodomains in MLVs are instrumental in modulating membrane thermodynamics, which is parallel to lipid nanodomains in biological membranes, that are functional for facilitating membrane-associated cellular processes.33,34
Polar carotenoids decrease fluidity and water permeability of the hydrophobic regions in lipid bilayers
Membrane fluidity was probed at different regions of the lipid bilayer using Prodan and Laurdan, where Prodan probes at the headgroups (hydrophilic region) and Laurdan probes at the hydrophobic region given its longer hydrocarbon chain (Fig. 1).24,35 Based on the Tm of all PEPG MLVs used in this study (Fig. 2C), the MLVs existed in their liquid-crystalline phases during the membrane fluidity assay, which was carried out at a uniform temperature of 37 °C. Thus, any changes in membrane fluidity may be directly attributed to the presence of the carotenoids within the lipid bilayer rather than a gel-to-liquid crystalline phase change of the phospholipids. Notably, the fluorescence intensity of Laurdan and Prodan decreased in the presence of carotenoids in LUT–MLVs and ZEA-LUVs (Fig. 3A–D). This is likely due to the highly conjugated carotenoid backbones quenching the fluorescence emission from the probes, which further suggests that both the probes and carotenoids are in close proximity in the membrane.9,36 The presence of carotenoids may also have hindered partitioning of the probes into the membranes.37,38 Nonetheless, the general spectral characteristics of the liposomes are still preserved and can be used to determine generalized polarization (GP) of the liposomes, where higher GP values are indicative of lower membrane polarity and lower membrane fluidity.24,39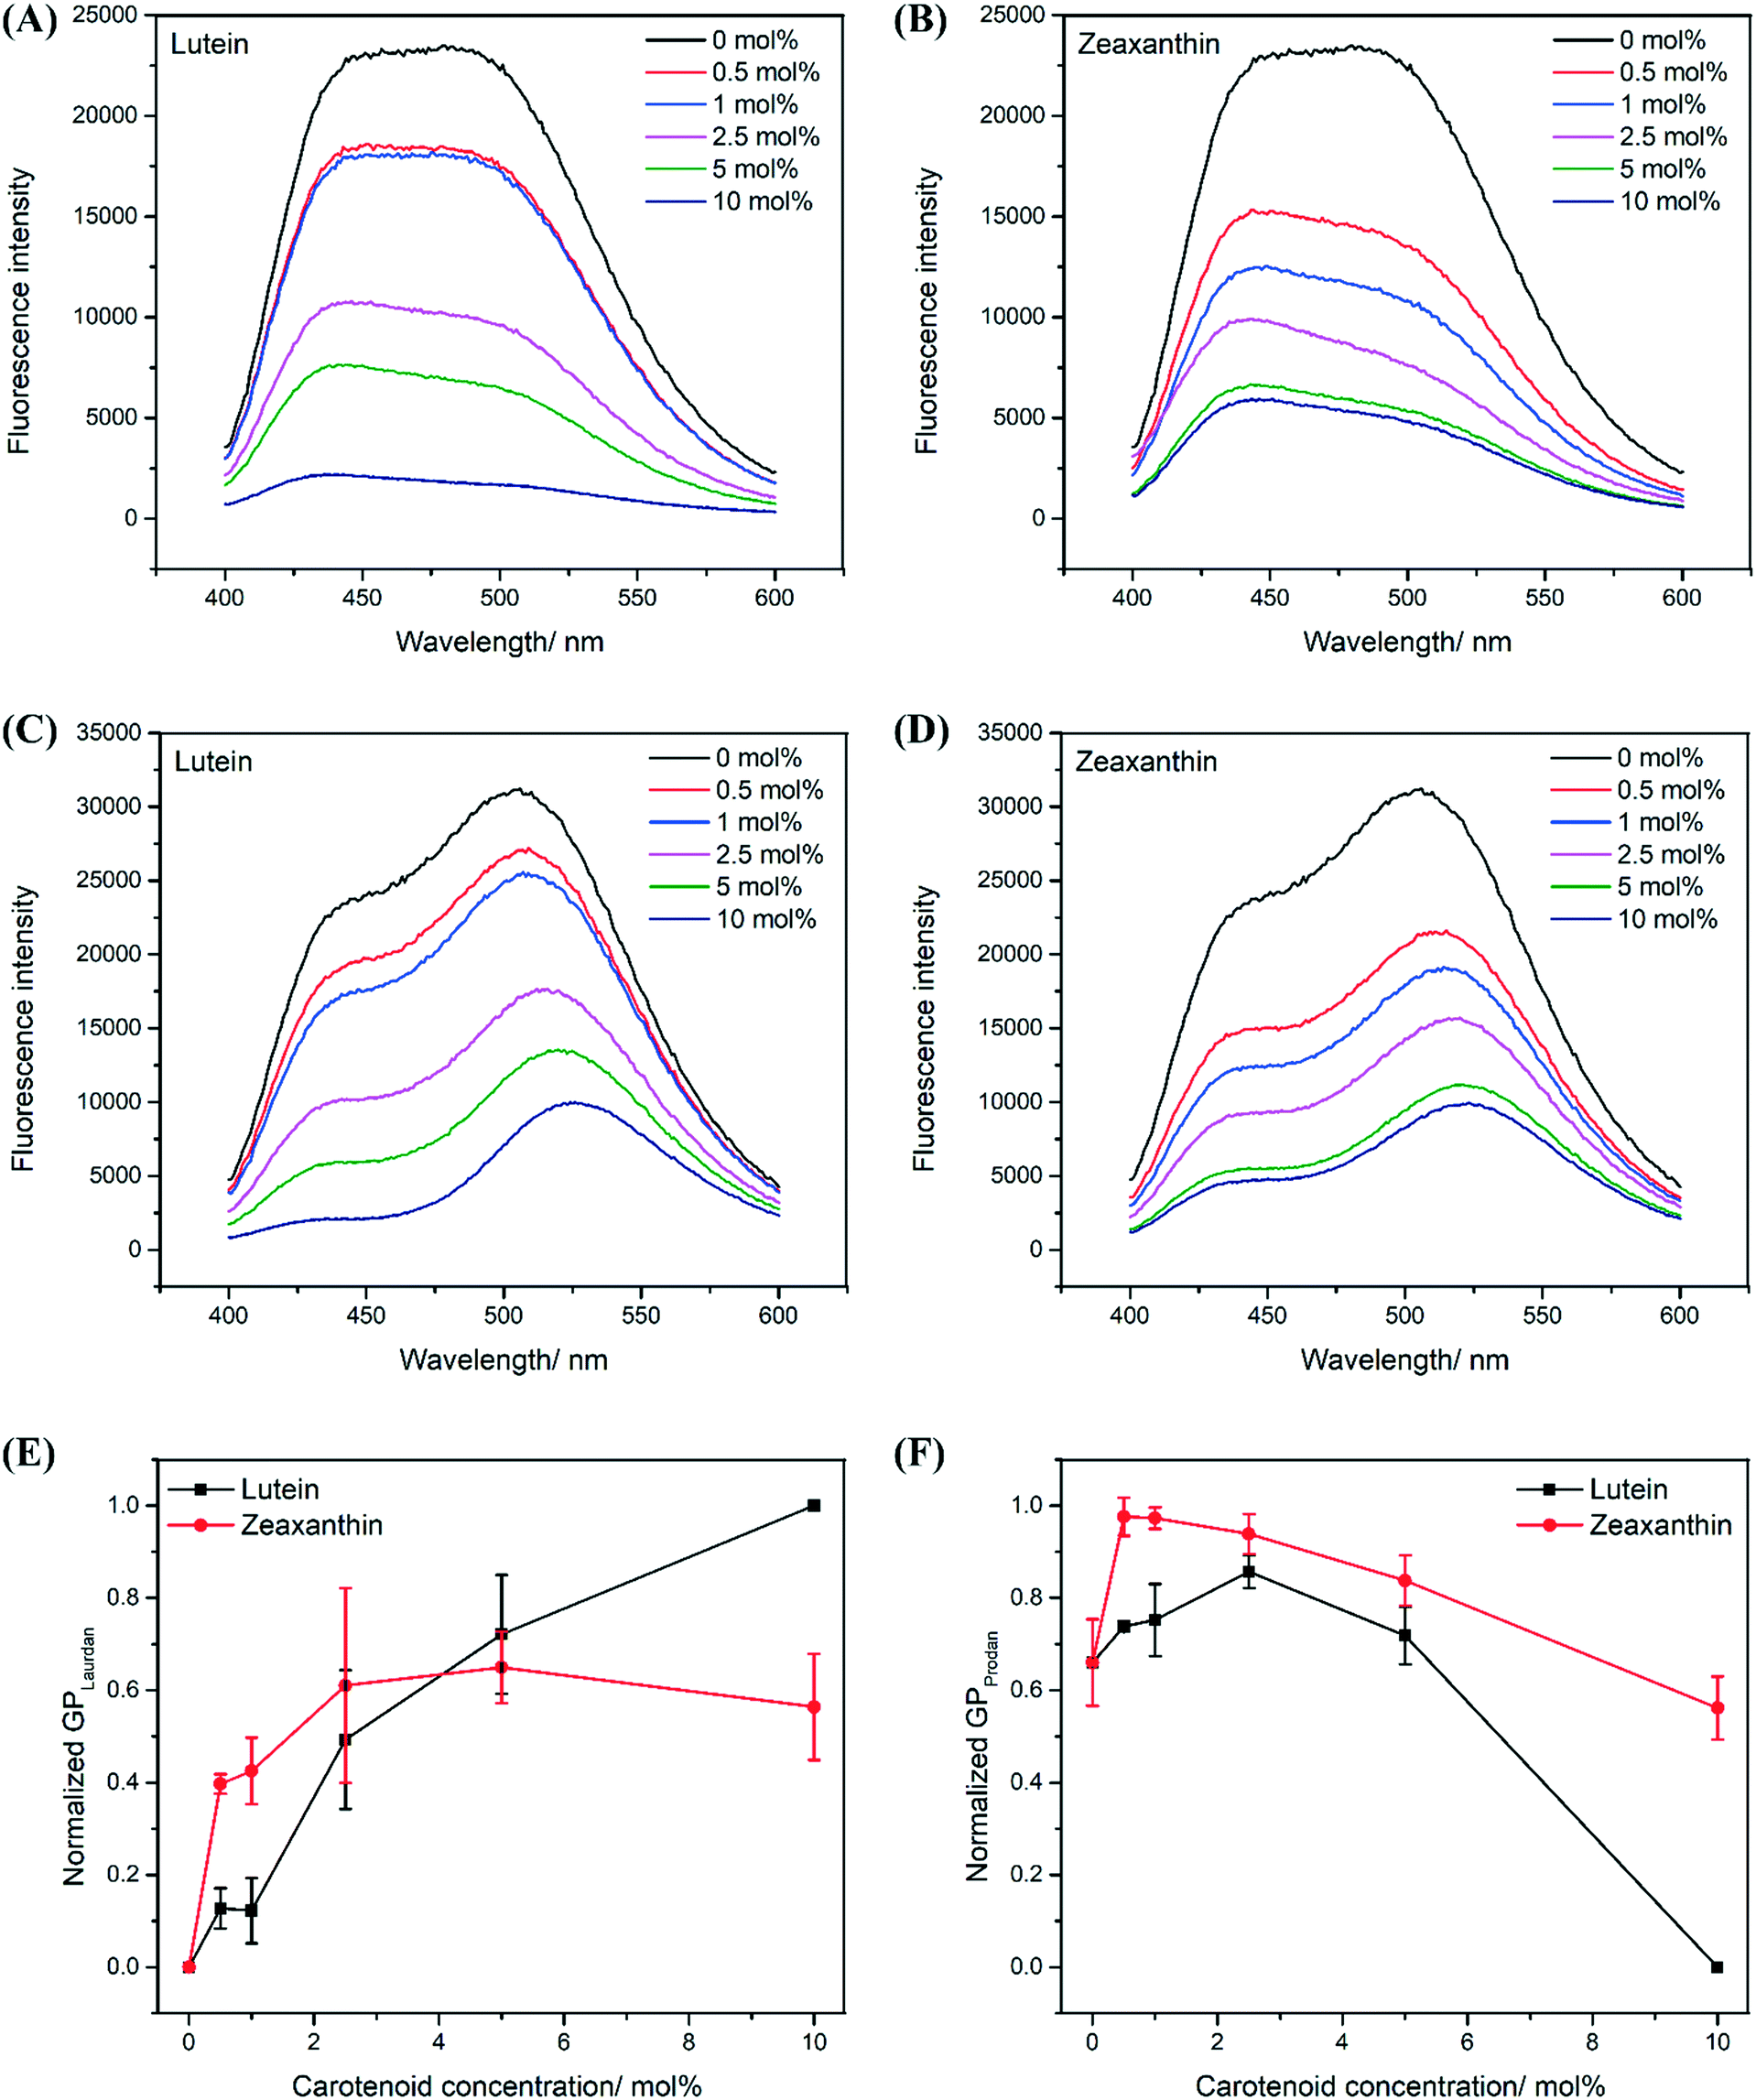 | ||
| Fig. 3 Carotenoids decrease membrane fluidity in the hydrophobic regions but increase membrane fluidity in the hydrophilic regions. Fluorescence emission spectrum (λex = 350 nm) of Laurdan in PEPG MLVs containing different molar concentrations of LUT (A) and ZEA (B). Fluorescence emission spectrum (λex = 350 nm) of Prodan in PEPG MLVs containing different molar concentrations of LUT (C) and ZEA (D). Generalized polarization (GP) calculated for Laurdan (E) and Prodan (F) as a function of carotenoid concentration. | ||
In probing the hydrophobic region, both LUT–MLVs and ZEA–MLVs were observed to have consistently higher Laurdan GP values than control MLVs at all carotenoid concentrations (Fig. 3E). The decrease in membrane fluidity at the hydrophobic region by LUT and ZEA is likely due to restrictions on molecular motion of the acyl tails as carotenoids interact with the acyl tails via Van de Waals and hydrophobic interations.16,30,32 In probing the hydrophilic region, both LUT–MLVs and ZEA–MLVs were also observed to have higher Prodan GP values than control MLVs at all carotenoid concentrations except at 10 mol% (Fig. 3F). Because the hydroxyl groups on carotenoids interact with the carbonyl or phosphate groups in the phospholipids, the membrane insertion of carotenoids at high concentrations likely reduces the tight packing between the headgroups of the phospholipids.12,15 The lower GP values recorded for MLVs that carry 10 mol% carotenoids, compared to control MLVs, also suggest that they are characterized by a more hydrated hydrophilic region. However, the water molecules likely remain in that region because the polarity of the hydrophobic region remains low in these MLVs, compared to the control MLVs. This is evidenced by the lower Laurdan GP values in Fig. 3E, which also suggests that the membrane permeability to water in the hydrophobic region decreases, especially when carotenoids are present in high concentrations.37,38
Notably, the increase in membrane fluidity and polarity at the hydrophilic region is substantially greater for LUT–MLVs than ZEA–MLVs and the structural differences between the two carotenoids may explain this observation.22,28–30 The ε-ring of lutein provides greater rotational freedom, which can facilitate both parallel and perpendicular molecular orientations, with respect to the membrane surface, in the lipid bilayer (Fig. 1).28,29,40–42 Because of the motional freedom of the ε-ring, lutein can form hydrogen bonds with surrounding water molecules, in addition to the phospholipid headgroups. The higher affinity for water is supported by previous in silico simulations that showed the formation of hydrogen bonds between lutein hydroxyl groups and water molecules in the bulk aqueous phase.40,41 Hence, the parallel orientation of lutein may have promoted greater hydration of the hydrophilic region of LUT–MLVs.
Carotenoid-aggregation reduces butanol-induced fluidization of hydrophobic region in lipid bilayers
A concentration dependent red shift in the fluorescence emission spectra was observed for Laurdan and Prodan in control PEPG MLVs that were exposed to butanol (0–3.5% (v/v)) (Fig. S2†). The red shift was also observed with MLVs that were infused with either 0.5 mol% or 10 mol% carotenoids, which represent conditions where carotenoids are dispersed or aggregated respectively (see earlier discussion of Fig. 2). In all MLVs, the Laurdan GP values decreased as a function of increasing butanol concentration, reflecting the expected increase in membrane polarity and membrane fluidity in the hydrophobic region of the MLVs due to butanol. However, LUT–MLVs and ZEA–MLVs still recorded higher Laurdan GP values than control MLVs at each butanol concentration (Fig. 4A and B), indicating that the rigidity conferred by lutein and zeaxanthin is not lost in the presence of butanol.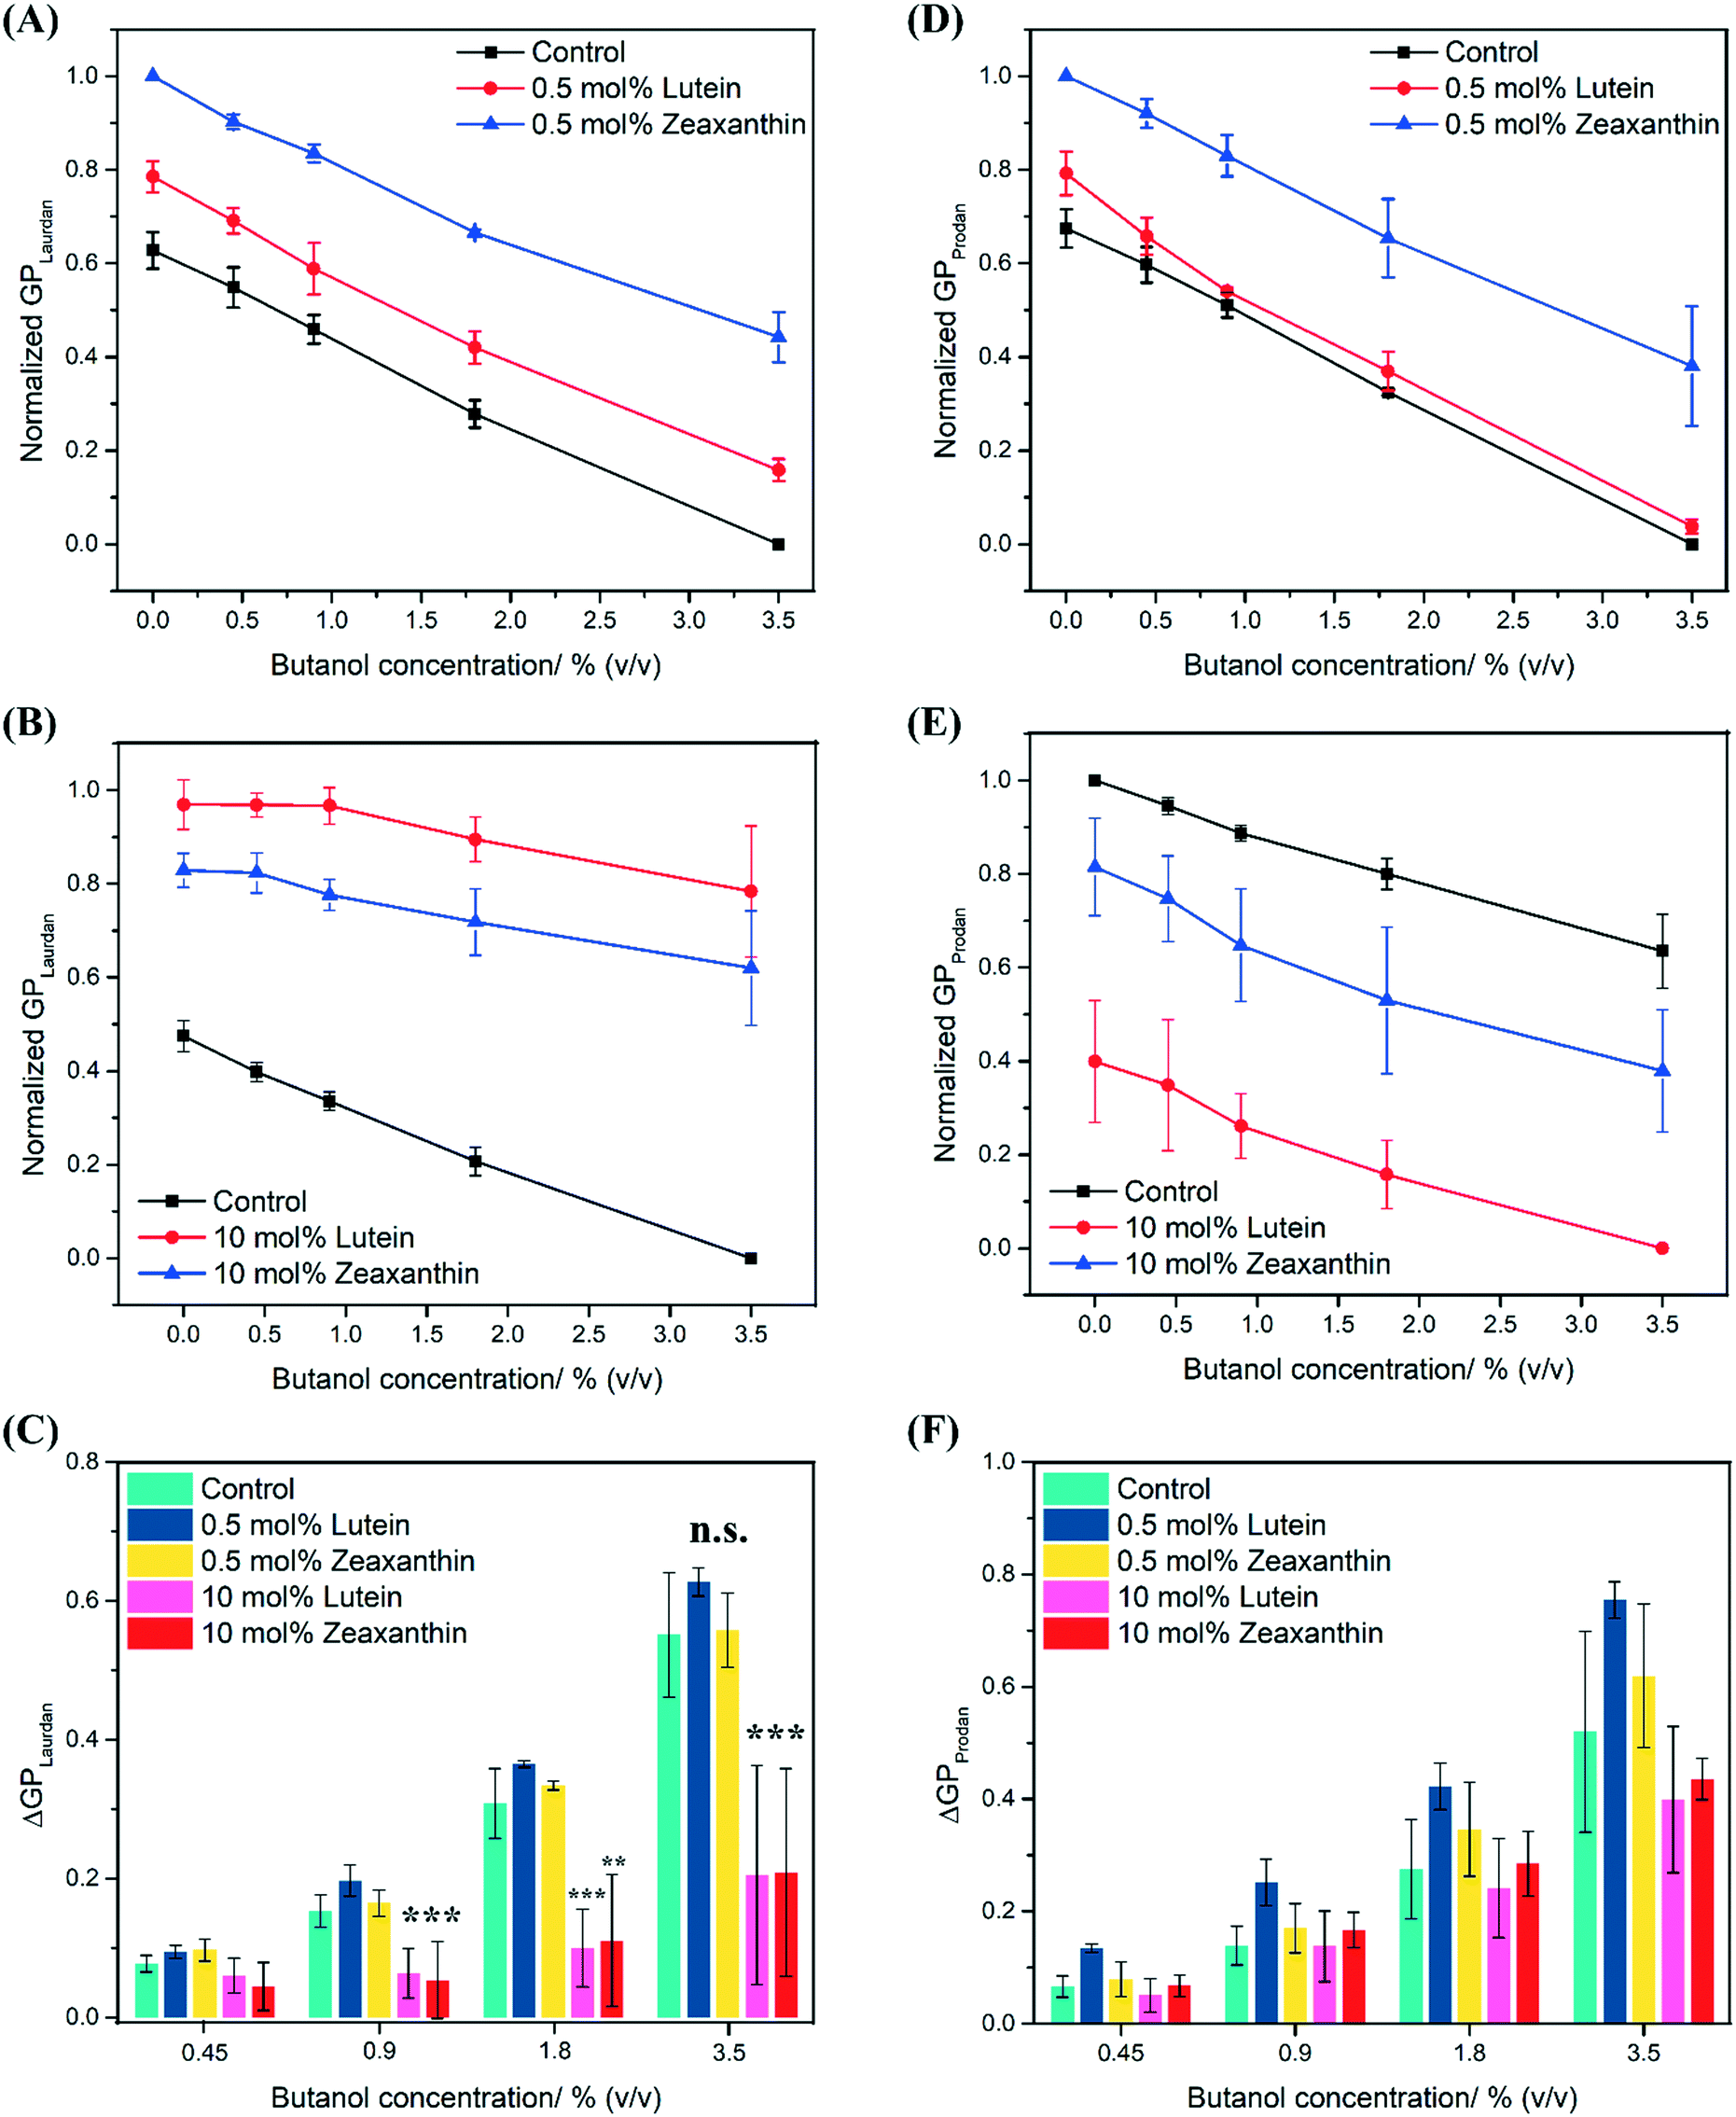 | ||
| Fig. 4 High carotenoid concentrations attenuate butanol-induced membrane fluidization. Generalized polarization (GP) measured using Laurdan for control MLVs, 0.5 mol% LUT–MLVs and ZEA–MLVs (A), and 10 mol% LUT–MLVs and ZEA–MLVs (B) that were challenged with butanol up to 3.5% (v/v). (C) Difference in GP values for Laurdan between control MLVs and LUT–MLVs or ZEA–MLVs at all butanol concentrations. GP measured using Prodan for control MLVs, 0.5 mol% LUT–MLVs and ZEA–MLVs (D), and 10 mol% LUT–MLVs and ZEA–MLVs (E) that were challenged with butanol up to 3.5% (v/v). (F) Difference in GP values for Prodan between control MLVs and LUT–MLVs or ZEA–MLVs at all butanol concentrations. n.s. indicates not significant, ** indicates p value that is less than 0.05 and *** indicates p value that is less than 0.005 (Student's t-test). | ||
The extent of membrane fluidization by butanol can be determined as the difference in GP relative to the control (ΔGP, eqn (5)) at each butanol concentration. At 3.5% (v/v) butanol, ΔGP (Laurdan) was found to be 0.55 (±0.09), 0.63 (±0.02) and 0.56 (±0.05) for control MLVs, 0.5% mol LUT–MLVs and 0.5 mol% ZEA–MLVs, respectively. There is no significant difference in ΔGP between control MLVs and MLVs that carry 0.5 mol% carotenoids (p > 0.2), which implies that the fluidizing effect of butanol in the hydrophobic region is similar across these MLVs. The same observations were also made for the MLVs challenged with other butanol concentrations (Fig. 4C). For both 10 mol% LUT–MLVs and ZEA–MLVs, ΔGP (Laurdan) was 0.21 (±0.15) at 3.5% butanol, which is significantly lower than that of the control (p < 0.005) and reflects a 63% decrease in the membrane fluidization effects at this butanol concentration, compared to the control (ΔGP (Laurdan) = 0.55 (±0.09)). The ΔGP values for 10 mol% LUT–MLVs and ZEA–MLVs were also significantly lower than control MLVs at 0.9% (p < 0.005 for both LUT- and ZEA–MLVs) and 1.8% (v/v) butanol (Fig. 4C) (p < 0.005 for LUT–MLVs and p < 0.05 for ZEA–MLVs). These results suggest that 0.5 mol% LUT–MLVs and ZEA–MLVs are still subjected to the same butanol stress as control MLVs, despite the presence of low carotenoid concentration. Conversely, carotenoids at high concentrations provide rigidity to the MLVs12,15,16 and even decreases the extent to which butanol can fluidize the hydrophobic region of the MLVs. The latter demonstrates a true attenuation of membrane fluidization that is likely attributed to the formation of carotenoid nanodomains.
Butanol was also observed to fluidize the hydrophilic region of the membrane, as indicated by the decrease in Prodan GP values with increasing butanol concentrations for all MLVs (Fig. 4D and E). There is also no substantial difference in ΔGP (Prodan) between control MLVs and MLVs that carry 0.5 mol% carotenoids (Fig. 4F), which implies that the fluidizing effect of butanol in the hydrophilic region is similar across these MLVs. At 3.5% (v/v) butanol, ΔGP (Prodan) was found to be 0.52 (±0.18), 0.40 (±0.13) and 0.44 (±0.04) for control MLVs, 10% mol LUT–MLVs and 10 mol% ZEA–MLVs, respectively. The presence of high carotenoid concentration resulted in an average of 20% decrease in the fluidization effects of 3.5% butanol at the hydrophilic region, compared to control. The attenuation effect by 10 mol% carotenoid is more prominent in the hydrophobic region (−63%), compared to the hydrophilic region (−20%). We further validated the generality of these observations by repeating these experiments with pentanol which also causes membrane fluidization.43 For this, we observed similar results (Fig. S3†), suggesting that the attenuation of membrane fluidization by carotenoids is independent of the solvents.
Nano-aggregation of carotenoids reduces partitioning of butanol into lipid bilayers
We further examined the disordering effect of butanol by comparing the Tm values, obtained from DSC measurements, between unchallenged MLVs (i.e. 0% butanol) and butanol challenged MLVs (1–3% (v/v) butanol) (ΔTm – eqn (1)) (Fig. S4† and 5). Across all MLVs, ΔTm increased as a function of butanol concentration, indicative of increasing acyl tail disorder at higher butanol concentrations (Table S2†).5 From the linear fit of ΔTm against butanol concentrations, we estimated the apparent butanol partitioning coefficient (Kp) for all the MLVs in this study (Table 1). The degree of butanol partitioning was similar for control MLVs, 0.5 mol% LUT–MLVs and ZEA–MLVs, while the butanol partitioning was approximately 38% lower in both 10 mol% LUT–MLVs and ZEA–MLVs. This concurs with our earlier observations that water permeability into the hydrophobic region of the membrane was reduced in 10 mol% LUT–MLVs and ZEA–MLVs (Fig. 4C).37,38 The additional 38% of butanol molecules that does not permeate a carotenoid-rich membrane likely remains as extracellular butanol, which can be recovered thereby increasing production yields.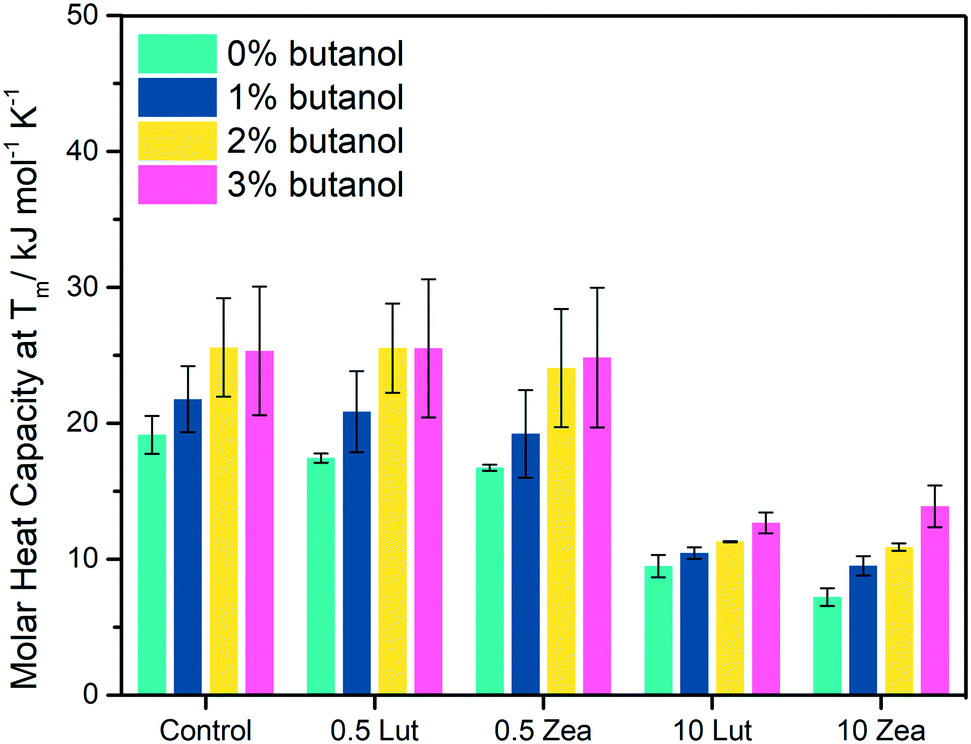 | ||
| Fig. 5 Butanol disorders acyl tails in MLVs and high carotenoid concentrations mitigate the disordering effects. Change in molar heat capacity at Tm as measured by DSC in control MLVs, LUT- and ZEA–MLVs that contain either 0.5 mol% or 10 mol% carotenoids. | ||
| MLV | [Carotenoid]/% mol | K p (×103) |
|---|---|---|
| Control | — | 12.2 (±1.1) |
| Lutein | 0.5 | 12.5 (±0.2) |
| Lutein | 10 | 7.53 (±3.63) |
| Zeaxanthin | 0.5 | 12.7 (±0.7) |
| Zeaxanthin | 10 | 7.49 (±2.93) |
The number of butanol molecules that partition into the membrane is dependent on the thermodynamic properties (Tm,0 and ΔHm,0) of the membrane (Table S3†), which is in turn influenced by the physical state of the membrane. The presence of carotenoid-rich domains in the 10 mol% LUT–MLVs and ZEA–MLVs likely pose as a permeability barrier towards butanol,37,38 and consequently membrane fluidization by butanol is reduced (Fig. 4C). Therefore, these findings ascribe a fortification functionality to the carotenoid-rich nanodomains.33
Carotenoids increase membrane tolerance in cells upon acute butanol shock
We next supplemented E. coli K12 with lutein and zeaxanthin to examine if the proposed structural functions remain valid in live cells. A maximum carotenoid uptake of 80% was observed at an optical density (OD600) of 0.5, which translates to approximately 8 μg mL−1 of carotenoids (Fig. 6A). The inset in Fig. 6A shows the cell pellet of control cultures, and cultures that were treated with either lutein or zeaxanthin. The intense orange color of the cell pellets suggests carotenoid uptake into the cells. Although it was not within the research scope of this study, it should be noted that the precise location and orientation of carotenoids cannot be determined using the techniques deployed here and further studies deploying, for example, electron paramagnetic resonance (EPR)15 would be required to further support our observations on the membrane intercalation of carotenoids.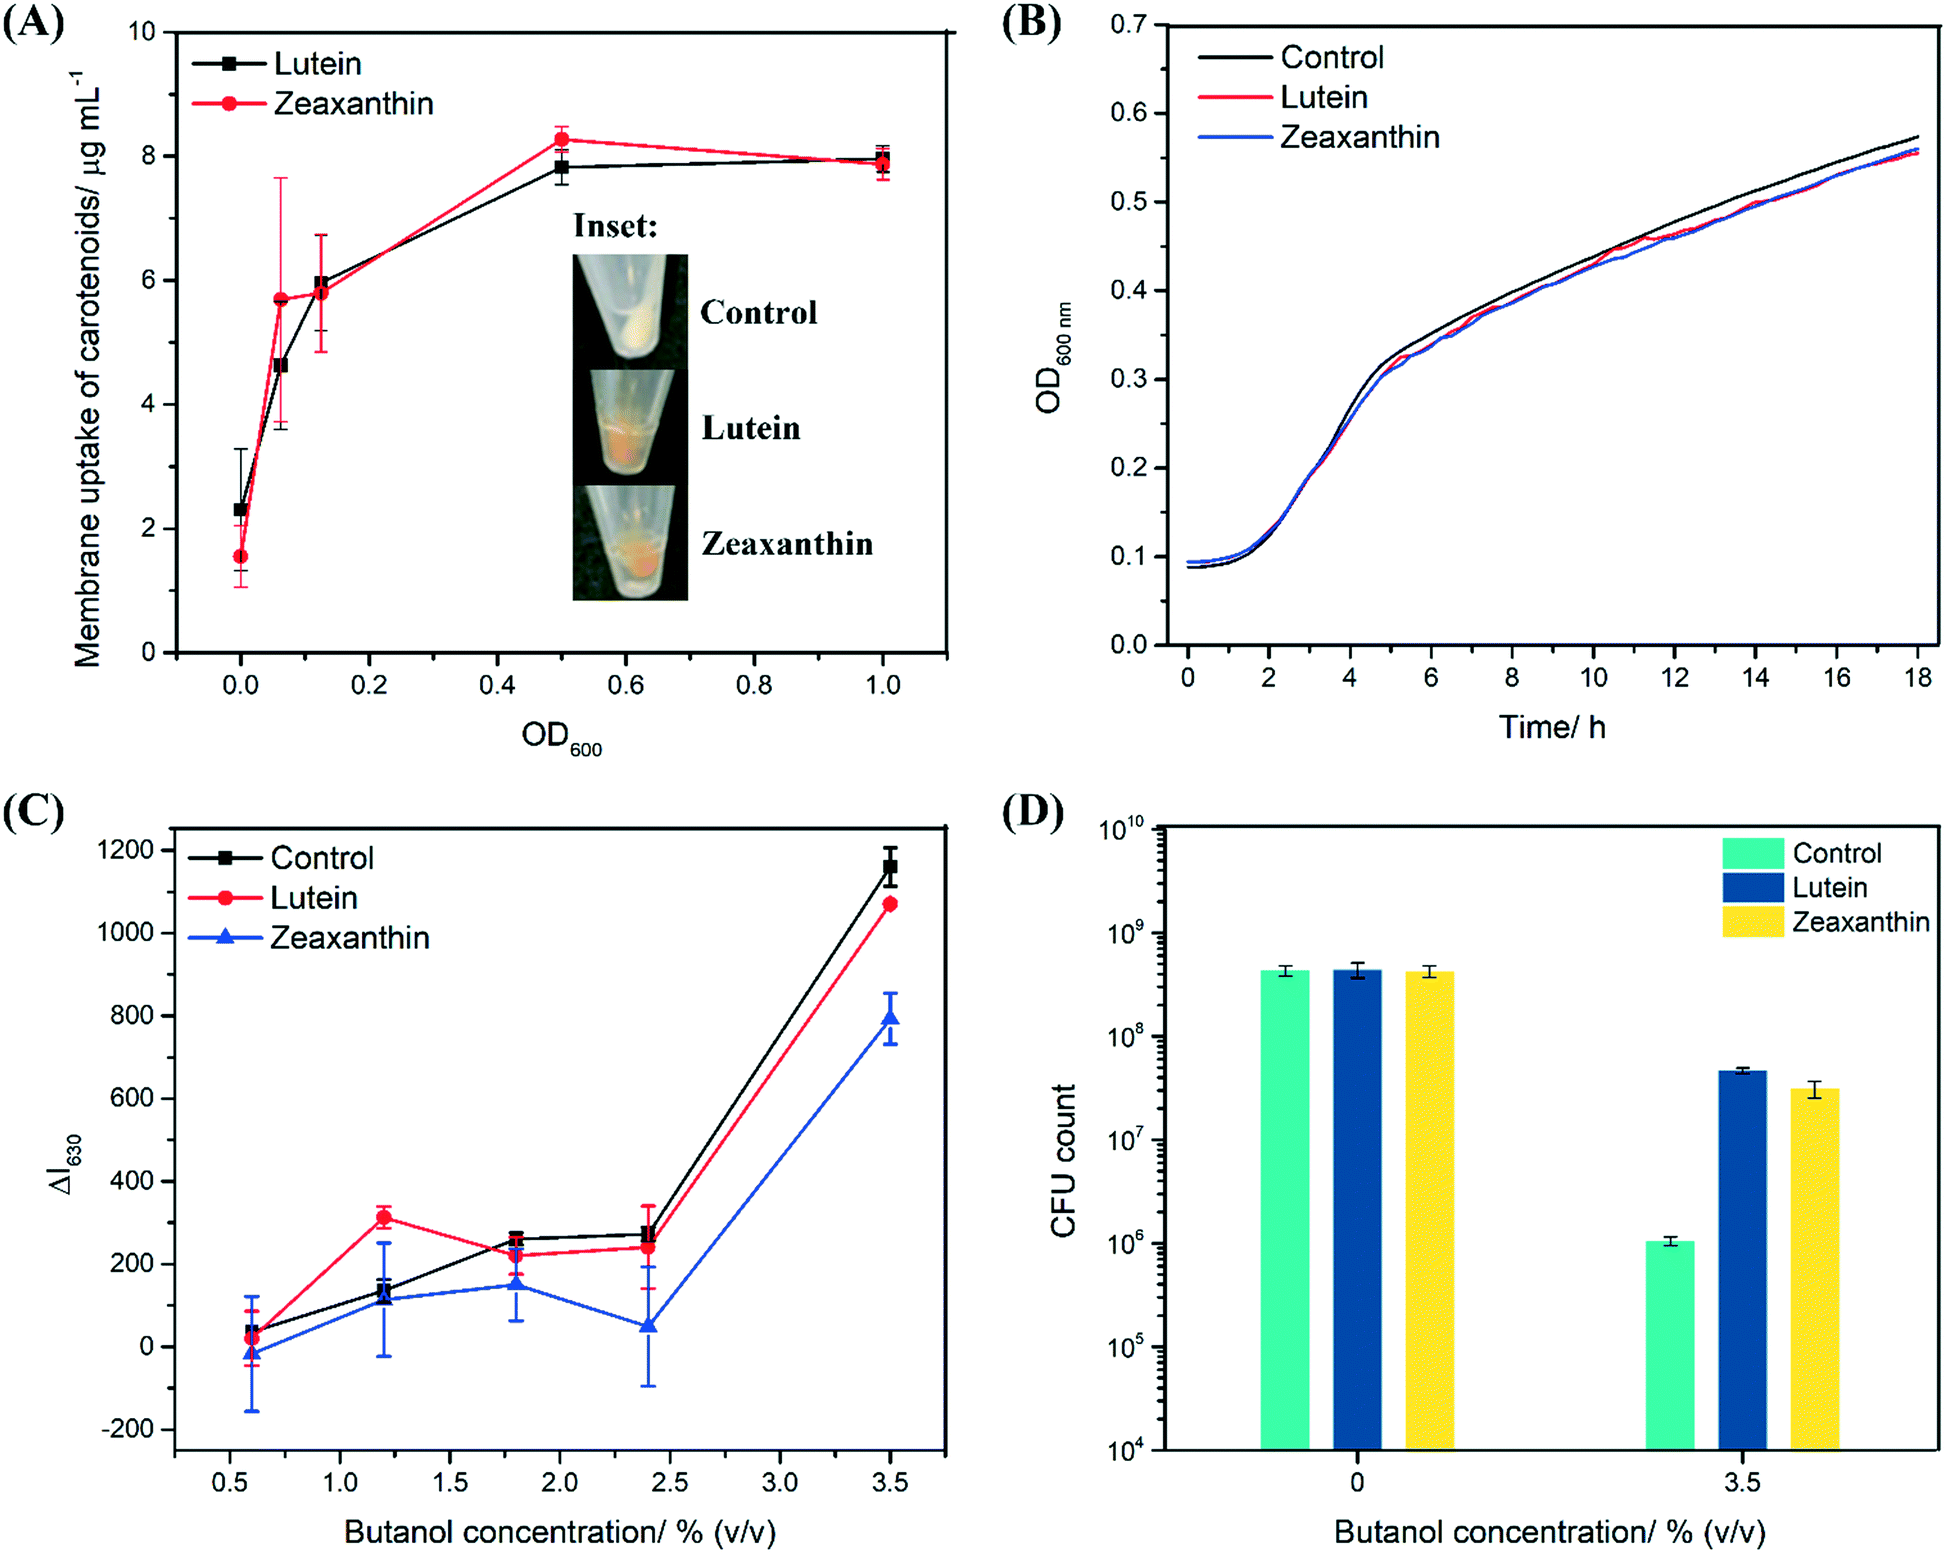 | ||
| Fig. 6 Polar carotenoids reduce membrane damage by butanol and increase survival of E. coli upon butanol shock. (A) Cellular uptake of LUT and ZEA in E. coli as a function of optical cell density. Inset: Images of cell pellets after centrifugation of control cells, cells treated with LUT and ZEA. (B) Growth curve of control cells, cells treated with 10 μg mL−1 LUT and ZEA. (C) Membrane damage as a function of butanol in control and 10 μg mL−1 LUT- and ZEA-treated cells (n = 3, p < 0.05 for LUT- and ZEA-treated cells at 3.5% (v/v), butanol and for LUT-treated cells as 1.2% (v/v) butanol and ZEA-treated cells at 2.4% (v/v) butanol). (D) Colony forming units (CFU) count of cells that survived acute exposure to 3.5% (v/v) butanol. | ||
Importantly, both lutein and zeaxanthin are biocompatible with E. coli K12, despite it being non-carotenogenic, as 10 μg mL−1 of carotenoids were not inhibitory to the growth of the bacteria in the absence of butanol (Fig. 6B).
Propidium iodide (PI) binding to intracellular nucleic acids was used to indicate membrane damage by butanol.44 PI can penetrate cells through compromised cellular membranes and only emits a large fluorescence signal when bound to the nucleic acids of damaged cells.44 The absence of a fluorescence quenching effect by carotenoids in the case with PI, as opposed to the phenomenon observed with Prodan and Laurdan in MLVs (Fig. 2A–D), suggests that the carotenoids are not in close proximity to PI to quench its fluorescence emission,9,36 and provides evidence that the carotenoids reside within the membranes of live cells and not within the cytoplasm where PI is expected to accumulate. Control cells exposed to butanol displayed an increased PI fluorescence emission (Fig. S6†), indicating cell membrane damage by butanol. To quantify the extent of cellular membrane damage by butanol, we calculated the difference in PI fluorescence emission at 630 nm (ΔI630) between unchallenged cells (i.e. 0% butanol) and butanol-challenged cells (eqn (6)). Higher ΔI630 values indicate a greater extent of membrane damage because of butanol exposure. At 3.5% (v/v) butanol, ΔI630 was 1160 (±47), 1070 (±5) and 793 (±62) for control cells, LUT- and ZEA-treated cells, respectively (Fig. 6C). Accordingly, LUT and ZEA reduced membrane damage that resulted from 3.5% (v/v) butanol, by 7% and 30% respectively. This suggests that the carotenoids can also mitigate butanol-induced membrane damage in living bacterial cells, similar to observations in the model lipid system.
For cells that were exposed to 3.5% (v/v) of butanol, there was approximately a three-log reduction in the survival rate for the control cells while for LUT- and ZEA-treated cells, there was only a one-log reduction (Fig. 6D). Supported by our earlier findings in MLVs (Fig. 4 and S4†), we propose that the attenuation of membrane damage by carotenoids increases solvent tolerance of cellular membranes, which allows for the higher survivability of the treated cells upon acute butanol exposure. Membrane fluidization is an immediate consequence when a living cell is exposed to butanol,5 although the toxic effects of butanol are usually multi-faceted especially over long periods of time with solvent exposure.43,45,46 As far as our investigations have indicated, carotenoids primarily only address the initial disrupting effects that butanol has on the structural integrity of the cellular membrane. The acute challenge was designed to assess the potential of carotenoids to mitigate extreme membrane damage and provide the rationale for employing carotenoids to fortify membranes as a strain improvement strategy.
Feasibility
Although yeast-generated bioethanol is well established, the recovery process of ethanol is energy intensive as ethanol is highly miscible in water. The microbial production of butanol more readily meets the requirements of a bioprocess that can be designed for energy efficiency, with the additional benefit that butanol is also an ideal drop-in biofuel.2 However, the economic potential of butanol is significantly limited by end-product toxicity. Accordingly, we explored the potential for carotenoids to increase membrane tolerance of butanol and demonstrated the potential for a two-log improvement in cell viability, equivalent to a 1% increase in cell survival. This complements current process enhancement strategies to achieve high cell density, which increases fermentation productivity in reactors (e.g. immobilizing cells to a solid substrate support improved yields by 47%).47 Assuming a linear correlation between biomass and solvent production, this means a corresponding 1% increase in butanol yield will result in concomitant 1% decrease in production costs. For a production plant with an annual output of 1.21 × 10⁵ metric tons butanol, this could result in a very substantial cost saving of more than $660 K per year.3 Hence, the biotechnological application of carotenoids has the potential to boost the economic competitiveness of microbial butanol production, in the effort to sustainably meet fuel demands.In contrast to similar efforts using synthetic molecules to fortify bacterial membranes, the reliance on carotenoids is consistent with the principles of green chemistry because carotenoids are naturally occurring and mainly originate from plants (i.e., renewable sources). Moreover, plant-based feedstocks are feasible options for microbial butanol production.1,48 An estimate of 0.1 kg m−3 of carotenoids is required to achieve 10 mol% carotenoid concentration in E. coli, in which the lipid content is approximately 10% of the cell biomass.49 This is operationally achievable, especially when the sources of carotenoids are carotenoid-rich food waste. For example, tomato pomace, which has no commercial value, has been shown to contain around 140 mg kg−1 of carotenoids.50 Hence, such plant-based feedstock double up as both the substrate for utilization, and a source of carotenoid supplement.48 This dual utility thereby maximizes the molecular economy of the feedstock. Research into the feasibility of such bioprocess designs should be a priority either with native or engineered butanol producing strains.
Conclusions
In summary, we report the utilization of carotenoids to mitigate butanol-induced fluidization of lipid bilayers. Our biophysical findings suggest that carotenoids can reduce butanol permeation through the membrane, and decrease the membrane disordering and fluidizing effects of butanol.37,38 These observations are more prominent when carotenoids are present at high concentrations, where they are postulated to aggregate into carotenoid-rich nanodomains.22,28–30 This mechanistic insight likely explains the decrease in membrane damage observed in carotenoid-treated E. coli cells and the consequential increase in cell survival upon acute butanol shock. In this contribution, we aimed to demonstrate our proof-of-concept that carotenoids act as membrane stabilizers against butanol-induced membrane fluidization. It is noteworthy that one advantage of carotenoids as chemical additives is their natural abundance, where they may be enriched in plant-based food wastes that are often utilized as feedstocks for biobutanol production.48 Importantly, our findings have demonstrated that the biotechnological application of carotenoids to increase membrane tolerance therefore also support for a butanol-cum-carotenoid producing strain of E. coli that may be potential useful for large-scale production.51–54Conflicts of interest
There are no conflicts to declare.Acknowledgements
We would like to thank Dr. James Ho for his advice on the analysis of the biophysical experiments. Funding for this work was provided through Ministry of Education Singapore AcRF Tier 2 grant number MOE2016-T2-1-148. SCELSE is funded by Singapore's Ministry of Education, National Research Foundation, Nanyang Technological University (NTU), and National University of Singapore (NUS) and hosted by NTU in partnership with NUS.References
- J. C. Liao, L. Mi, S. Pontrelli and S. Luo, Fuelling the future: microbial engineering for the production of sustainable biofuels, Nat. Rev. Microbiol., 2016, 14(5), 288–304 CrossRef CAS.
- N. Savage, Fuel options: The ideal biofuel, Nature, 2011, 474(7352), S9–S11 CrossRef CAS.
- N. Qureshi and H. P. Blaschek, Economics of butanol fermentation using hyper-butanol producing Clostridium Beijerinckii BA101, Food Bioprod. Process., 2000, 78(3), 139–144 CrossRef.
- M. J. Dunlop, Engineering microbes for tolerance to next-generation biofuels, Biotechnol. Biofuels, 2011, 4(1), 32 CrossRef CAS.
- J. Guo, J. C. S. Ho, H. Chin, A. E. Mark, C. Zhou, S. Kjelleberg, B. Liedberg, A. N. Parikh, N.-J. Cho, J. Hinks, Y. Mu and T. Seviour, Response of microbial membranes to butanol: interdigitation vs. disorder, Phys. Chem. Chem. Phys., 2019, 21(22), 11903–11915 RSC.
- T. Ezeji, C. Milne, N. D. Price and H. P. Blaschek, Achievements and perspectives to overcome the poor solvent resistance in acetone and butanol-producing microorganisms, Appl. Microbiol. Biotechnol., 2010, 85(6), 1697–1712 CrossRef CAS.
- L. R. Jarboe, J. B. Klauda, Y. Chen, K. M. Davis and M. C. Santoscoy, Engineering the microbial cell membrane to improve bioproduction in Green Polymer Chemistry: New Products, Processes, and Applications, ed. H. N. Cheng, R. A. Gross and P. B. Smith, American Chemical Society, 2018, vol. 1310, pp. 25–39 Search PubMed.
- Z. Tan, P. Khakbaz, Y. Chen, J. Lombardo, J. M. Yoon, J. V. Shanks, J. B. Klauda and L. R. Jarboe, Engineering Escherichia coli membrane phospholipid head distribution improves tolerance and production of biorenewables, Metab. Eng., 2017, 44, 1–12 CrossRef CAS.
- M. Anwar, T. H. Khan, J. Prebble and P. F. Zagalsky, Membrane-bound carotenoid in Micrococcus luteus protects naphthoquinone from photodynamic action, Nature, 1977, 270(5637), 538–540 CrossRef CAS.
- V. Yurkov, N. Gad'on and G. Drews, The major part of polar carotenoids of the aerobic bacteria Roseococcus thiosulfatophilus RB3 and Erythromicrobium ramosum E5 is not bound to the bacteriochlorophyll a-complexes of the photosynthetic apparatus, Arch. Microbiol., 1993, 160(5), 372–376 CrossRef CAS.
- S. Rottem and O. Markowitz, Carotenoids acts as reinforcers of the Acholeplasma laidlawii lipid bilayer, J. Bacteriol., 1979, 140(3), 944–948 CrossRef CAS.
- W. K. Subczynski, E. Markowska, W. I. Gruszecki and J. Sielewiesiuk, Effects of polar carotenoids on dimyristoylphosphatidylcholine membranes: a spin-label study, Biochim. Biophys. Acta, 1992, 1105(1), 97–108 CrossRef CAS.
- K. Strzałka and W. I. Gruszecki, Effect of β-carotene on structural and dynamic properties of model phosphatidylcholine membranes. I. An EPR spin label study, Biochim. Biophys. Acta, 1994, 1194(1), 138–142 CrossRef.
- Q. R. Johnson, B. Mostofian, G. Fuente Gomez, J. C. Smith and X. Cheng, Effects of carotenoids on lipid bilayers, Phys. Chem. Chem. Phys., 2018, 20(5), 3795–3804 RSC.
- W. K. Subczynski, E. Markowska and J. Sielewiesiuk, Spin-label studies on phosphatidylcholine-polar carotenoid membranes: effects of alkyl-chain length and unsaturation, Biochim. Biophys. Acta, 1993, 1150(2), 173–181 CrossRef CAS.
- W. Seel, D. Baust, D. Sons, M. Albers, L. Etzbach, J. Fuss and A. Lipski, Carotenoids are used as regulators for membrane fluidity by Staphylococcus xylosus, Sci. Rep., 2020, 10(1), 330 CrossRef CAS.
- G. D. Bothun, L. Boltz, Y. Kurniawan and C. Scholz, Cooperative effects of fatty acids and n-butanol on lipid membrane phase behavior, Colloids Surf., B, 2016, 139, 62–67 CrossRef CAS.
- J. Hinks, Y. Wang, A. Matysik, R. Kraut, S. Kjelleberg, Y. Mu, G. C. Bazan, S. Wuertz and T. Seviour, Increased microbial butanol tolerance by exogenous membrane insertion molecules, ChemSusChem, 2015, 8(21), 3718–3726 CrossRef CAS.
- C. Zhou, G. W. N. Chia, J. C. S. Ho, A. S. Moreland, T. Seviour, B. Liedberg, A. N. Parikh, S. Kjelleberg, J. Hinks and G. C. Bazan, A chain-elongated oligophenylenevinylene electrolyte increases microbial membrane stability, Adv. Mater., 2019, 31(18), 1808021 CrossRef.
- N. E. Craft and J. H. Soares, Relative solubility, stability, and absorptivity of lutein and beta-carotene in organic solvents, J. Agric. Food Chem., 1992, 40(3), 431–434 CrossRef CAS.
- C. Sohlenkamp and O. Geiger, Bacterial membrane lipids: diversity in structures and pathways, FEMS Microbiol. Rev., 2015, 40(1), 133–159 CrossRef.
- A. Kostecka-Gugała, D. Latowski and K. Strzałka, Thermotropic phase behaviour of α-dipalmitoylphosphatidylcholine multibilayers is influenced to various extents by carotenoids containing different structural features- evidence from differential scanning calorimetry, Biochim. Biophys. Acta, 2003, 1609(2), 193–202 CrossRef.
- T. Inoue, K. Miyakawa and R. Shimozawa, Interaction of surfactants with vesicle membrane of dipalmitoylphosphatidylcholine. Effect on gel-to-liquid-crystalline phase transition of lipid bilayer, Chem. Phys. Lipids, 1986, 42(4), 261–270 CrossRef CAS.
- T. Parasassi, E. K. Krasnowska, L. Bagatolli and E. Gratton, Laurdan and Prodan as polarity-sensitive fluorescent membrane probes, J. Fluoresc., 1998, 8(4), 365–373 CrossRef CAS.
- M. Mohammadi, L. Burbank and M. C. Roper, Biological role of pigment production for the bacterial phytopathogen Pantoea stewartii subsp. stewartii, Appl. Environ. Microbiol., 2012, 78(19), 6859–6865 CrossRef CAS.
- M. Havaux, Carotenoids as membrane stabilizers in chloroplasts, Trends Plant Sci., 1998, 3(4), 147–151 CrossRef.
- J. Gabrielska and W. I. Gruszecki, Zeaxanthin (dihydroxy-beta-carotene) but not beta-carotene rigidifies lipid membranes: a 1H-NMR study of carotenoid-egg phosphatidylcholine liposomes, Biochim. Biophys. Acta, 1996, 1285(2), 167–174 CrossRef CAS.
- W. Grudzinski, L. Nierzwicki, R. Welc, E. Reszczynska, R. Luchowski, J. Czub and W. I. Gruszecki, Localization and orientation of xanthophylls in a lipid bilayer, Sci. Rep., 2017, 7(1), 9619 CrossRef.
- A. Sujak, P. Mazurek and W. I. Gruszecki, Xanthophyll pigments lutein and zeaxanthin in lipid multibilayers formed with dimyristoylphosphatidylcholine, J. Photochem. Photobiol., B, 2002, 68(1), 39–44 CrossRef CAS.
- W. I. Gruszecki, A. Smal and D. Szymczuk, The effect of zeaxanthin on the thickness of dimyristoylphosphatidylcholine bilayer: X-ray diffraction study, J. Biol. Phys., 1992, 18(4), 271–280 CrossRef.
- A. Sujak, W. Okulski and W. I. Gruszecki, Organisation of xanthophyll pigments lutein and zeaxanthin in lipid membranes formed with dipalmitoylphosphatidylcholine, Biochim. Biophys. Acta, 2000, 1509(1–2), 255–263 CrossRef CAS.
- W. I. Gruszecki and K. Strzałka, Carotenoids as modulators of lipid membrane physical properties, Biochim. Biophys. Acta, 2005, 1740(2), 108–115 CrossRef CAS.
- M. Cebecauer, M. Amaro, P. Jurkiewicz, M. J. Sarmento, R. Šachl, L. Cwiklik and M. Hof, Membrane lipid nanodomains, Chem. Rev., 2018, 118(23), 11259–11297 CrossRef CAS.
- M. Weinrich, D. L. Worcester and S. M. Bezrukov, Lipid nanodomains change ion channel function, Nanoscale, 2017, 9(35), 13291–13297 RSC.
- F. M. Harris, K. B. Best and J. D. Bell, Use of laurdan fluorescence intensity and polarization to distinguish between changes in membrane fluidity and phospholipid order, Biochim. Biophys. Acta, 2002, 1565(1), 123–128 CrossRef CAS.
- C. Socaciu, P. Bojarski, L. Aberle and H. Diehl, Different ways to insert carotenoids into liposomes affect structure and dynamics of the bilayer differently, Biophys. Chem., 2002, 99(1), 1–15 CrossRef CAS.
- A. H. Berglund, R. Nilsson and C. Liljenberg, Permeability of large unilamellar digalactosyldiacylglycerol vesicles for protons and glucose – influence of α-tocopherol, β-carotene, zeaxanthin and cholesterol, Plant Physiol. Biochem., 1999, 37(3), 179–186 CrossRef CAS.
- T. Lazrak, A. Milon, G. Wolff, A.-M. Albrecht, M. Miehé, G. Ourisson and Y. Nakatani, Comparison of the effects of inserted C40- and C50-terminally dihydroxylated carotenoids on the mechanical properties of various phospholipid vesicles, Biochim. Biophys. Acta, 1987, 903(1), 132–141 CrossRef CAS.
- E. K. Krasnowska, E. Gratton and T. Parasassi, Prodan as a membrane surface fluorescence probe: partitioning between water and phospholipid phases, Biophys. J., 1998, 74(4), 1984–1993 CrossRef CAS.
- K. Makuch, M. Markiewicz and M. Pasenkiewicz-Gierula, Asymmetric spontaneous intercalation of lutein into a phospholipid bilayer, a computational study, Comput. Struct. Biotechnol. J., 2019, 17, 516–526 CrossRef CAS.
- M. Pasenkiewicz-Gierula, K. Baczynski, K. Murzyn and M. Markiewicz, Orientation of lutein in a lipid bilayer - revisited, Acta Biochim. Pol., 2012, 59(1), 115–118 CrossRef CAS.
- W. K. Subczynski, A. Wisniewska-Becker and J. Widomska, Can macular xanthophylls replace cholesterol in formation of the liquid-ordered phase in lipid-bilayer membranes?, Acta Biochim. Pol., 2012, 59(1), 109–114 CrossRef CAS.
- J. Sikkema, J. A. de Bont and B. Poolman, Mechanisms of membrane toxicity of hydrocarbons, Microbiol. Rev., 1995, 59(2), 201–222 CrossRef CAS.
- M. Graça da Silveira, M. Vitória San Romão, M. C. Loureiro-Dias, F. M. Rombouts and T. Abee, Flow cytometric assessment of membrane integrity of ethanol-stressed Oenococcus oeni cells, Appl. Environ. Microbiol., 2002, 68(12), 6087–6093 CrossRef.
- Y. N. Zheng, L. Z. Li, M. Xian, Y. J. Ma, J. M. Yang, X. Xu and D. Z. He, Problems with the microbial production of butanol, J. Ind. Microbiol. Biotechnol., 2009, 36(9), 1127–1138 CrossRef CAS.
- E. Fletcher, T. Pilizota, P. R. Davies, A. McVey and C. E. French, Characterization of the effects of n-butanol on the cell envelope of E. coli, Appl. Microbiol. Biotechnol., 2016, 100(22), 9653–9659 CrossRef CAS.
- Q. He and H. Chen, Improved efficiency of butanol production by absorbed lignocellulose fermentation, J. Biosci. Bioeng., 2013, 115(3), 298–302 CrossRef CAS.
- A. Procentese, F. Raganati, G. Olivieri, M. E. Russo, M. de la Feld and A. Marzocchella, Renewable feedstocks for biobutanol production by fermentation, New Biotechnol., 2017, 39, 135–140 CrossRef CAS.
- F. C. Neidhardt, Chemical composition of Escherichia coli in Escherichia coli and Salmonella: Cellular and Molecular Biology, 2, ed. J. L. Ingraham, K. B. Low, B. Magasanik, M. Schaechter and H. E. Umbarger, American Society of Microbiology (ASM), 1996, vol. 1, pp. 2882–2885 Search PubMed.
- C. M. Galanakis, in Nutraceutical and Functional Food Components, ed. J. Nagarajan, R. N. Ramanan, M. E. Raghunandan, C. M. Galanakis and N. P. Krishnamurthy, Academic Press, 2017, vol. 8, pp. 259–296 Search PubMed.
- W. Zhang, X. Hu, L. Wang and X. Wang, Reconstruction of the carotenoid biosynthetic pathway of Cronobacter sakazakii BAA894 in Escherichia coli, PLoS One, 2014, 9(1), e86739 CrossRef.
- H. Harada and N. Misawa, Novel approaches and achievements in biosynthesis of functional isoprenoids in Escherichia coli, Appl. Microbiol. Biotechnol., 2009, 84(6), 1021–1031 CrossRef CAS.
- D. R. Nielsen, E. Leonard, S. H. Yoon, H. C. Tseng, C. Yuan and K. L. Prather, Engineering alternative butanol production platforms in heterologous bacteria, Metab. Eng., 2009, 11(4–5), 262–273 CrossRef CAS.
- Q. Wang, Y. Ding, L. Liu, J. Shi, J. Sun and Y. Xue, Engineering Escherichia coli for autoinducible production of n-butanol, Electron. J. Biotechnol., 2015, 18(2), 138–142 CrossRef.
Footnote |
| † Electronic supplementary information (ESI) available. See DOI: 10.1039/d0en00983k |
| This journal is © The Royal Society of Chemistry 2021 |