A strategy of electrochemical simultaneous detection of acetaminophen and levofloxacin in water based on g-C3N4 nanosheet-doped graphene oxide†
Wenwen
Yi
a,
Chunxiao
Han
a,
Zhongping
Li
 *a,
Yujing
Guo
 *a,
Meng
Liu
 b and
Chuan
Dong
 a
a
aInstitute of Environmental Science, Shanxi University, Taiyuan 030006, P.R. China. E-mail: zl104@sxu.edu.cn
bSchool of Environmental Science and Technology, Key Laboratory of Industrial Ecology and Environmental Engineering (Ministry of Education), Dalian University of Technology, Dalian 116024, China
First published on 8th December 2020
Abstract
During environmental testing, it is an urgent problem for scientists to develop and design a new type of electrochemical sensor electrode with distinguished stability, high activity and cost-effectiveness. In our research, a novel and simple electroanalytical method for the simultaneous determination of acetaminophen (AC) and levofloxacin (LEV) in environmental water was proposed based on an ultrathin graphitic carbon nitride nanosheet-doped graphene oxide (CNNS/GO). The physicochemical properties of as-synthesized nanocomposite materials were characterized in detail by various spectroscopic and analytical techniques. Meanwhile, the electrochemical characterisation of the modified GCE was carried out by cyclic voltammetry (CV), electrochemical impedance spectroscopy (EIS) and differential pulse voltammetry (DPV). The CNNS/GO electrochemical ultra-sensitive strategy was established for detecting AC and LEV in linear concentration ranges of 5 × 10⁻⁷–3.0 × 10⁻⁵ and 5 × 10⁻⁷–1.5 × 10⁻⁵ mol L−1 with low detection limits of 1.7 × 10⁻⁸ and 7.9 × 10⁻⁸ mol L−1 toward AC and LEV, respectively. The sensor was provided with lower cost, excellent accuracy, satisfactory sensitivity and simple fabrication. The fabricated electrochemical sensor was further successfully expanded to determine AC and LEV in river water samples with recoveries between 95.6% and 111.8% and good correspondence with the HPLC method.
Environmental significanceToday, environmental testing methods are an important prerequisite for controlling environmental pollution. Moreover, the simultaneous detection of different types of pollutants is of great significance to water pollution control. We developed a novel and simple electroanalytical method for the simultaneous determination of acetaminophen (AC) and levofloxacin (LEV) in environmental water based on an ultrathin graphitic carbon nitride nanosheet and graphene oxide nanocomposite (CNNS/GO). In conclusion, the CNNS/GO nanocomposite is a promising and safe nanomaterial to realize simultaneous detection of pollutants, a challenging problem in degradation technology for water and wastewater treatment. |
1. Introduction
In the past few decades, various pharmaceuticals have been employed extensively in the breeding industries and medical fields in many countries. Medicine residues are considered to be a type of emerging environmental contaminants, which will destroy the living ecosystem and attract worldwide attention.1 Among these medicines, acetaminophen and levofloxacin have attracted widespread attention due to their irresponsible use and excessive discharge.2 Acetaminophen (AC) is an antipyretic analgesic drug which is generally considered safe when taken in the prescribed doses.3 Nevertheless, an overdose of AC can result in accumulation of toxic metabolites, leading to blurred vision, dizziness, hepatotoxicity and nephrotoxicity.4 Levofloxacin (LEV) is one of the third-generation fluoroquinolone antibiotics that is effective against some Gram-positive and most Gram-negative bacteria and can be utilized to treat bacterial infections of the sinus, skin, kidneys, prostate or bladder.5,6 Nowadays, the widespread use of medicines like AC and LEV has posed a major threat to the ecological environment and safe disposal. Therefore, we are facing the emergence of new types of hazards, such as drug-resistant bacteria and medicine residues, which require immediate remedial measures.7 The development of sensitive, portable, inexpensive and accurate detection methods as well as remediation of AC- and LEV-contaminated water in the surrounding environment has become increasingly serious and urgent for environmental researchers.At present, numerous analytical methods have been implemented for accurate monitoring of AC or LEV, including high-performance liquid chromatography (HPLC),8,9 chemiluminescence,10 spectrophotometry11,12 and enzyme-linked immunosorbent assay (ELISA).13 As we all know, medicine residues in water do not exist alone, and these methods have limitations in the simultaneous determination of AC and LEV without a separation process. As compared to the above existing traditional analytical technologies, the electrochemical method14 has been demonstrated to be an easy operation with high sensitivity, portability and rapid response, which is desirable for the analysis of AC and LEV. According to reports in the literature, a AgNP–CB–PEDOT:PSS nanocomposite has been developed for the simultaneous monitoring of AC and LEV.15 Although it has shown good performance, the conductive molecular polymer (PEDOT) contained in this material is not suitable for AC and LEV testing due to its toxic effects on the human body and the ecological environment.16 Accordingly, the development of tractable and environmentally friendly ways toward simultaneous determination of AC and LEV is particularly attractive and urgently desired.
Graphitic carbon nitride (g-C3N4), as a novel type of metal-free π-conjugated semiconductor material, has been considerably researched in photo/electro-catalysis, bioimaging and energy conversion based on its extraordinary properties such as low cost, environmental friendliness, outstanding biocompatibility, excellent photostability and peculiar electronic structure.17,18 Unfortunately, the original g-C3N4 is severely limited in the applications of diverse electrochemical techniques due to its extremely poor water solubility, low electronic conductivity, and large particle size.19 To solve these problems, it is necessary to further strip bulk g-C3N4 into ultra-thin g-C3N4 nanosheets (CNNSs). The g-C3N4 nanosheets have a larger specific surface area, excellent water solubility and abundant surface active sites.20 The carbon component in the composite can accelerate the electron transport and enhance the conductivity of the C–N material.21 Therefore, exfoliated ultra-thin CNNS and its composites are promising candidates for electrochemical applications.
Graphene oxide (GO), as a two-dimensional nanocarbon material, has been widely employed as a suitable substrate for supercapacitors, catalysis, and electronic and electrochemical platforms.22,23 Herein, the CNNS was immobilized on the surface of graphene oxide as CNNS/GO via a simple sonochemical technique. The construction of the CNNS/GO/GCE sensor further expands the application of g-C3N4 in the field of electrochemical detection. The CNNS/GO nanocomposite could provide a higher specific surface area for the electro-oxidation of AC and LEV and enhance electron transfer efficiency. Moreover, the CNNS/GO/GCE sensor exhibits many excellent performances for the detection of the two drugs, such as low detection limit, wide linear range, prominent repeatability, excellent reproducibility, favourable anti-interference ability and satisfactory recovery rate. Therefore, this work can serve as a novel, low-cost, environmentally friendly and convenient electrochemical channel for the quantitative determination of the two drugs.
2. Experiment
The reagents and apparatus, synthetic procedures of CNNS/GO, construction of an electrochemical sensor and electrochemical experiments have been indicated in the ESI.† The overall experimental fabrication process of the composite materials and the electrochemical mechanism for AC and LEV detection is clearly depicted in Scheme 1.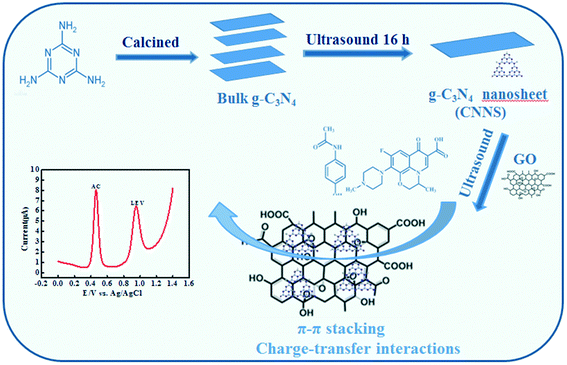 | ||
| Scheme 1 Diagrammatic sketch of the procedures for fabricating the CNNS/GO nanocomposite and its electrochemical application in the simultaneous detection of AC and LEV. | ||
3. Results and discussion
3.1 Characterization of the material
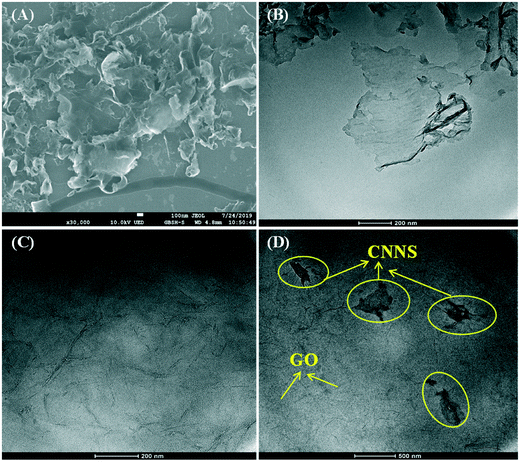
The microstructure and morphology of CNNS, GO, and CNNS/GO were analyzed using SEM and TEM as shown in Fig. 1. The SEM micrograph of CNNS (Fig. 1(A)) indicated that it has a large amount of independent and ultrathin nanosheet structures. At the same time, the nanosheet unit tends to bend and its edges are ragged. From the TEM image of pure CNNS (Fig. 1(B)), nanosheets with ultrathin thickness could be further demonstrated to be synthesized and several monolayers of CN atoms exist in the nanosheet structure. As presented in Fig. 1(C), the TEM image of GO shows two-dimensional sheets of wrinkled morphology with a large specific surface area. Next, the TEM image was employed to evaluate the morphology of CNNS/GO (Fig. 1(D)). It can be illustrated that the CNNS was dispersed on the surface of GO nanosheets, which is favorable for the electronic interaction between CNNS and GO sheets.FT-IR analysis was employed for determining the surface functional groups of GO, CNNS and CNNS/GO (Fig. S2†). GO displayed a broad characteristic band at 3406 cm−1, corresponding to the stretching vibration of –OH. Several characteristic absorption bands at 1387, 1646 and 1728 cm−1 can be related to the stretching vibration of C–OH, C![[double bond, length as m-dash]](https://www.rsc.org/images/entities/char_e001.gif) C and C
C and C![[double bond, length as m-dash]](https://www.rsc.org/images/entities/char_e001.gif) O, respectively.24 For CNNS and CNNS/GO, the peaks in the region of 1100–1650 cm−1 are ascribed to the typical stretching modes of aromatic CN heterocycles, and the sharp absorption band at around 810 cm−1 is assigned to a signature of the formation of tri-s-triazine of the g-C3N4 nanosheet.25 Wide peaks related to O–H and N–H stretching vibration modes are noticed at 3000–3500 cm−1.26
O, respectively.24 For CNNS and CNNS/GO, the peaks in the region of 1100–1650 cm−1 are ascribed to the typical stretching modes of aromatic CN heterocycles, and the sharp absorption band at around 810 cm−1 is assigned to a signature of the formation of tri-s-triazine of the g-C3N4 nanosheet.25 Wide peaks related to O–H and N–H stretching vibration modes are noticed at 3000–3500 cm−1.26
Furthermore, UV-vis spectroscopy and fluorescence spectroscopy were utilized to analyze the bonding mechanism of GO and CNNS. As shown in Fig. 2(A), the GO maximum characteristic peak at 231 nm is obtained (curve a) due to the π–π* transition in the C![[double bond, length as m-dash]](https://www.rsc.org/images/entities/char_e001.gif) C bond, and there is a shoulder-like band at 290–300 nm, associated to the n = π* transition in the C
C bond, and there is a shoulder-like band at 290–300 nm, associated to the n = π* transition in the C![[double bond, length as m-dash]](https://www.rsc.org/images/entities/char_e001.gif) O bond.23 The CNNS appeared as a pronounced band at 322 nm (curve b), which may correspond to π–π* electronic transitions of carbon nitrides containing an s-triazine ring.27 Although the characteristic peaks of CNNS and GO both appear in the UV-vis spectra of the CNNS/GO composite (curve b), the peak of CNNS shifts to around 317 nm. At the same time, the CNNS had intense emission wavelengths (curve a) at 439 nm when fluorescence was excited at 316 nm, as shown in Fig. 2(B). It is worth noting that when a small amount of GO dispersions was added to CNNS, the fluorescence intensity decreases sharply, as shown in Fig. 2(B) (curve b). The underlying reaction mechanism can be assigned to GO through charge-transfer interactions or strong π–π stacking, which can drastically transfer the highest occupied molecular orbital (HOMO) of CNNS to lower energy.28 The XRD also revealed that the CNNS/GO composite had been successfully fabricated (as shown in Fig. S3†).
O bond.23 The CNNS appeared as a pronounced band at 322 nm (curve b), which may correspond to π–π* electronic transitions of carbon nitrides containing an s-triazine ring.27 Although the characteristic peaks of CNNS and GO both appear in the UV-vis spectra of the CNNS/GO composite (curve b), the peak of CNNS shifts to around 317 nm. At the same time, the CNNS had intense emission wavelengths (curve a) at 439 nm when fluorescence was excited at 316 nm, as shown in Fig. 2(B). It is worth noting that when a small amount of GO dispersions was added to CNNS, the fluorescence intensity decreases sharply, as shown in Fig. 2(B) (curve b). The underlying reaction mechanism can be assigned to GO through charge-transfer interactions or strong π–π stacking, which can drastically transfer the highest occupied molecular orbital (HOMO) of CNNS to lower energy.28 The XRD also revealed that the CNNS/GO composite had been successfully fabricated (as shown in Fig. S3†).
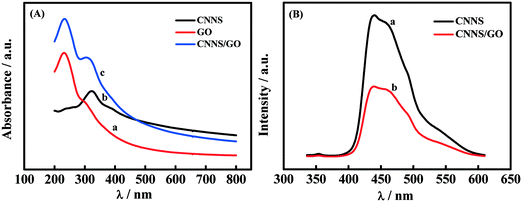 | ||
| Fig. 2 (A) UV-vis absorption spectra of GO (a), CNNS (b) and CNNS/GO (c). (B) Fluorescence spectra of CNNS (a) and CNNS/GO (b). | ||
The chemical composition of the synthesized CNNS/GO was successfully studied by XPS spectra. As can be observed in Fig. 3(A), the full-scan spectra of CNNS and CNNS/GO reveal the existence of C, N and O, and the pure GO did not contain nitrogen. The high-resolution XPS spectra of C 1s, N 1s and O 1s in different samples are also given in Fig. 3(B)–(D), respectively. The C 1s peak in the GO could be deconvoluted into three peaks at 284.93 eV, 287.1 eV and 288.4 eV, which are ascribed to C![[double bond, length as m-dash]](https://www.rsc.org/images/entities/char_e001.gif) C/C–C, C
C/C–C, C![[double bond, length as m-dash]](https://www.rsc.org/images/entities/char_e001.gif) O and O–C
O and O–C![[double bond, length as m-dash]](https://www.rsc.org/images/entities/char_e001.gif) O.29 These results confirmed that there were abundant carboxylic groups on the GO surface. The C 1s spectra of CNNS could be fitted into four parts corresponding to C
O.29 These results confirmed that there were abundant carboxylic groups on the GO surface. The C 1s spectra of CNNS could be fitted into four parts corresponding to C![[double bond, length as m-dash]](https://www.rsc.org/images/entities/char_e001.gif) C/C–C (284.7 eV), C–N–C (285.4 eV), N–C
C/C–C (284.7 eV), C–N–C (285.4 eV), N–C![[double bond, length as m-dash]](https://www.rsc.org/images/entities/char_e001.gif) N (288.5 eV), and N
N (288.5 eV), and N![[double bond, length as m-dash]](https://www.rsc.org/images/entities/char_e001.gif) C–N2 (288.0 eV).30,31 Furthermore, the XPS peak of CNNS/GO at 288.1 eV originates from carbon atoms bonded to three nitrogen atoms in the CNNS lattice, which have one double and two single bonds with three N neighbors (N
C–N2 (288.0 eV).30,31 Furthermore, the XPS peak of CNNS/GO at 288.1 eV originates from carbon atoms bonded to three nitrogen atoms in the CNNS lattice, which have one double and two single bonds with three N neighbors (N![[double bond, length as m-dash]](https://www.rsc.org/images/entities/char_e001.gif) C–N2).32 Two peaks for CNNS/GO are observed at 286.9 eV and 287.5 eV, which represent C combined with O in the form of C–O, C
C–N2).32 Two peaks for CNNS/GO are observed at 286.9 eV and 287.5 eV, which represent C combined with O in the form of C–O, C![[double bond, length as m-dash]](https://www.rsc.org/images/entities/char_e001.gif) O. An additional peak that appeared at about 284.86 eV should be attributed to C
O. An additional peak that appeared at about 284.86 eV should be attributed to C![[double bond, length as m-dash]](https://www.rsc.org/images/entities/char_e001.gif) C/C–C bonds. In Fig. 3(C), the N 1s XPS spectra of CNNS at 398.6 eV and 399.7 eV are assigned to sp2-hybridized aromatic N(C
C/C–C bonds. In Fig. 3(C), the N 1s XPS spectra of CNNS at 398.6 eV and 399.7 eV are assigned to sp2-hybridized aromatic N(C![[double bond, length as m-dash]](https://www.rsc.org/images/entities/char_e001.gif) N–C) and the tertiary N(N–(C)3), respectively.31 However, the other two weak peaks at 400.9 eV and 404.2 eV, correspond to C–N–H and π excitations, respectively.33 In the case of CNNS/GO, the peaks belonging to N 1s at 398.6 eV, 399.3 eV and 401.5 eV may contribute to C
N–C) and the tertiary N(N–(C)3), respectively.31 However, the other two weak peaks at 400.9 eV and 404.2 eV, correspond to C–N–H and π excitations, respectively.33 In the case of CNNS/GO, the peaks belonging to N 1s at 398.6 eV, 399.3 eV and 401.5 eV may contribute to C![[double bond, length as m-dash]](https://www.rsc.org/images/entities/char_e001.gif) N–C, N–(C)3 and C–N–H, respectively. The large amount of C–N–H bonds is in accord with FTIR analysis results, further confirming the abundant H atoms on the N atoms of CNNS. In Fig. 3(D), the O 1s energy peak at 532.7 eV and 533.2 eV are detected in GO and could be assigned to C
N–C, N–(C)3 and C–N–H, respectively. The large amount of C–N–H bonds is in accord with FTIR analysis results, further confirming the abundant H atoms on the N atoms of CNNS. In Fig. 3(D), the O 1s energy peak at 532.7 eV and 533.2 eV are detected in GO and could be assigned to C![[double bond, length as m-dash]](https://www.rsc.org/images/entities/char_e001.gif) O and C–O–, respectively. The weak O 1s spectra of CNNS at 533 eV and 532.1 eV could be attributed to the adsorbed H2O or CO2 and C–OH, respectively. The C–OH is derived from the incomplete reaction of oxygen-containing intermediates in the synthesis process.34 In contrast, the O 1s peak in CNNS/GO is shifted to a lower binding energy compared to that of CNNS and GO. A binding energy located at 531.9 eV could be attributed to the presence of –COOH in the nanocomposite.24 The XPS spectrum results confirm the successful generation of the composite and the presence of interactions between GO and CNNS inside the composite.
O and C–O–, respectively. The weak O 1s spectra of CNNS at 533 eV and 532.1 eV could be attributed to the adsorbed H2O or CO2 and C–OH, respectively. The C–OH is derived from the incomplete reaction of oxygen-containing intermediates in the synthesis process.34 In contrast, the O 1s peak in CNNS/GO is shifted to a lower binding energy compared to that of CNNS and GO. A binding energy located at 531.9 eV could be attributed to the presence of –COOH in the nanocomposite.24 The XPS spectrum results confirm the successful generation of the composite and the presence of interactions between GO and CNNS inside the composite.
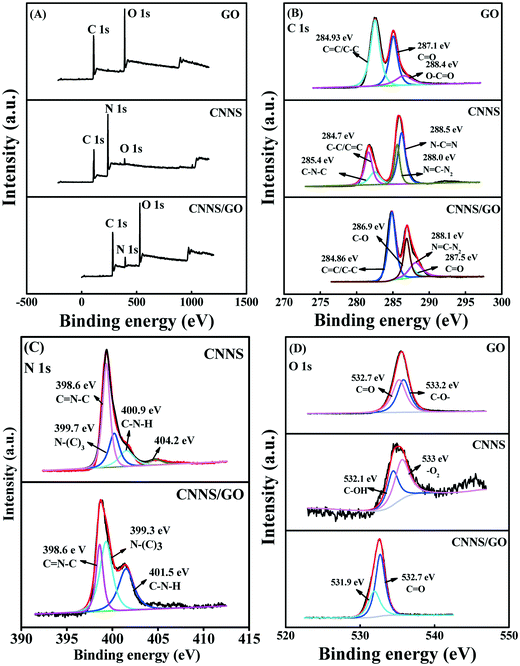 | ||
| Fig. 3 (A) XPS survey spectra of GO, CNNS and CNNS/GO. The corresponding detailed spectra of (B) C 1s, (C) N 1s and (D) O 1s. | ||
3.2 Electrochemical analysis
The mass ratio of CNNS and GO in the nanocomposite was assessed in order to comprehend the electrochemical behavior of CNNS/GO. Fig. 4 shows the peak current of diverse mass ratios of CNNS and GO (1![[thin space (1/6-em)]](https://www.rsc.org/images/entities/char_2009.gif) :
:![[thin space (1/6-em)]](https://www.rsc.org/images/entities/char_2009.gif) 1, 3
1, 3![[thin space (1/6-em)]](https://www.rsc.org/images/entities/char_2009.gif) :
:![[thin space (1/6-em)]](https://www.rsc.org/images/entities/char_2009.gif) 1, 5
1, 5![[thin space (1/6-em)]](https://www.rsc.org/images/entities/char_2009.gif) :
:![[thin space (1/6-em)]](https://www.rsc.org/images/entities/char_2009.gif) 1, 7
1, 7![[thin space (1/6-em)]](https://www.rsc.org/images/entities/char_2009.gif) :
:![[thin space (1/6-em)]](https://www.rsc.org/images/entities/char_2009.gif) 1) in the solution of AC and LEV (DPV voltammograms in Fig. S4(A)†). It was evidently seen that the maximum oxidation peak current responses were achieved at the ratio of 5
1) in the solution of AC and LEV (DPV voltammograms in Fig. S4(A)†). It was evidently seen that the maximum oxidation peak current responses were achieved at the ratio of 5![[thin space (1/6-em)]](https://www.rsc.org/images/entities/char_2009.gif) :
:![[thin space (1/6-em)]](https://www.rsc.org/images/entities/char_2009.gif) 1 (CNNS
1 (CNNS![[thin space (1/6-em)]](https://www.rsc.org/images/entities/char_2009.gif) :
:![[thin space (1/6-em)]](https://www.rsc.org/images/entities/char_2009.gif) GO). This is because when an appropriate amount of graphite carbon nitride nanosheets was added, it can effectively increase the specific surface area of the composite material and can provide more active sites, thereby increasing the electrical conductivity of the composite material, which is more beneficial to the electrochemical oxidation of LEV and AC. When excess CNNS was added, the decrease in the proportion of GO resulted in a reduction in the electrochemical effect on LEV and AC. Therefore, the 5
GO). This is because when an appropriate amount of graphite carbon nitride nanosheets was added, it can effectively increase the specific surface area of the composite material and can provide more active sites, thereby increasing the electrical conductivity of the composite material, which is more beneficial to the electrochemical oxidation of LEV and AC. When excess CNNS was added, the decrease in the proportion of GO resulted in a reduction in the electrochemical effect on LEV and AC. Therefore, the 5![[thin space (1/6-em)]](https://www.rsc.org/images/entities/char_2009.gif) :
:![[thin space (1/6-em)]](https://www.rsc.org/images/entities/char_2009.gif) 1 mass ratio of CNNS and GO was used to prepare modified electrodes.
1 mass ratio of CNNS and GO was used to prepare modified electrodes.
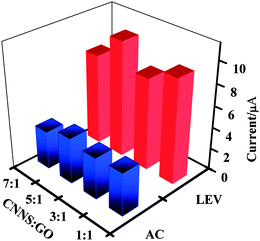 | ||
Fig. 4 The anode peak signals of different mass ratios of CNNS and GO (1![[thin space (1/6-em)]](https://www.rsc.org/images/entities/char_2009.gif) : :![[thin space (1/6-em)]](https://www.rsc.org/images/entities/char_2009.gif) 1, 3 1, 3![[thin space (1/6-em)]](https://www.rsc.org/images/entities/char_2009.gif) : :![[thin space (1/6-em)]](https://www.rsc.org/images/entities/char_2009.gif) 1, 5 1, 5![[thin space (1/6-em)]](https://www.rsc.org/images/entities/char_2009.gif) : :![[thin space (1/6-em)]](https://www.rsc.org/images/entities/char_2009.gif) 1 and 7 1 and 7![[thin space (1/6-em)]](https://www.rsc.org/images/entities/char_2009.gif) : :![[thin space (1/6-em)]](https://www.rsc.org/images/entities/char_2009.gif) 1) in the presence of AC (50 μM) and LEV (25 μM) containing 0.1 M PB solution (pH 5.0). 1) in the presence of AC (50 μM) and LEV (25 μM) containing 0.1 M PB solution (pH 5.0). | ||
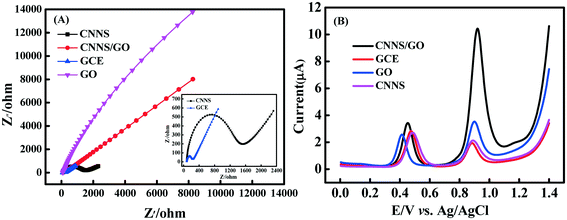
EIS technology is an effective tool for investigating the electrochemical behavior at the electrode–electrolyte interface of the various electrodes. Fig. 5(A) shows the Nyquist plot of bare GCE and various modified electrodes in 0.1 M KCl containing 5 mM [Fe(CN)6]3−/4− at 100 kHz to 0.1 Hz (inset: enlarged view of Nyquist plot (CNNS/GCE, GCE)). In addition, EIS of different electrodes (CNNS/GCE, CNNS/GO/GCE) and the Randles equivalent circuit model (inset) are shown in Fig. S4(C).† The obtained results show that the Ret value of bare GCE is about 253 Ω and the impedance spectrum exhibits a smaller semicircular domain, while the CNNS was modified to the GCE surface, the semicircular arc was significantly enlarged, and the Ret value increased greatly to about 1224.1 Ω, implying that CNNSs restrain the interfacial electron transfer between the solution and the electrode because of poor electrical conductivity. It is worth noting that the Ret value was significantly reduced to 152.3 Ω for the CNNS/GO-modified electrode. This result manifested that the introduction of GO enables efficient enhancement of the conductivity of the CNNS, benefiting peak current signal amplification.
Furthermore, the electrochemical behavior of different electrodes in the presence of AC (50 μM) and LEV (25 μM) containing 0.1 M PBS (pH 5.0) at a scan rate of 100 mV s−1 was then investigated by DPV and CV (Fig. 5(B) and S4(B)†). Both analytes revealed two well-defined anode current signals, at approximately 0.45 V for AC and 0.94 V for LEV. In addition, CV studies reveal that both analytes give only the anodic peak signals, demonstrating that the electro-oxidation of AC and LEV is an irreversible process. Additionally, the CNNS/GO material modified electrode presented a high electrochemical performance towards AC and LEV with a high anodic peak signal (3.177 μA and 9.325 μA) and the oxidation peak of AC and LEV at the CNNS/GO/GCE is at least 1.5- and 3.4-fold greater than those of other electrodes. At the same time, the current responses of different electrodes (GCE, CNNS/GCE, GO/GCE, CNNS/GO/GCE) were correlated with different concentrations of AC or LEV in 0.1 M PB solution (pH 5.0) with a scan rate of 100 mV s−1 (see Fig. S5†). It is clear that the sensor is much more sensitive to AC and LEV than other electrodes. The amazing electrochemical behaviors of CNNS/GO/GCE can be ascribed to the synergistic effect, including the surface interactions between CNNS and GO in the nanocomposite and the strong electrostatic interactions between CNNS and GO, which provide a higher specific surface area and abundant active sites for the electro-oxidation of AC and LEV and enhance the electron transfer efficiency. This suggests a more favorable electrochemical interaction of the analyte on the proposed modified electrode surface, indicating its potential to be used in the determination of the pharmaceutical molecule.
3.3 Optimization of the electrochemical measurement parameters
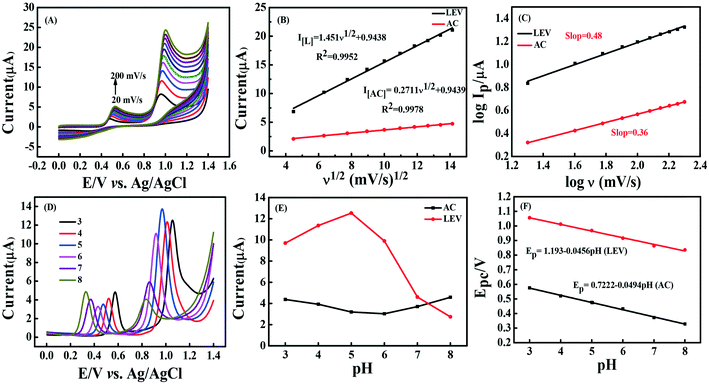
Generally, multiple factors affected the electrochemical properties of sensors for the detection of AC and LEV including the GCE loading amount (μL), the scan rate and the pH of the electrolyte.| [LEV]Ip (μA) = 1.451(ν)1/2 + 0.9438, R2 = 0.9952; |
| [AC]Ip (μA) = 0.2711(ν)1/2 + 0.9439, R2 = 0.9978. |
In addition, it is noteworthy from Fig. 6(C) that the log![[thin space (1/6-em)]](https://www.rsc.org/images/entities/char_2009.gif) Ipversus log
Ipversus log![[thin space (1/6-em)]](https://www.rsc.org/images/entities/char_2009.gif) ν plots were linear with close correlation coefficients, with the values for the slope of 0.48 for LEV and 0.36 for AC. The values of LEV (0.48) and AC (0.36) are close to the reported theoretical value (0.50) of the process of diffusion kinetics.36 Therefore, the observation implies that the reactions of both AC and LEV at CNNS/GO/GCE are typical diffusion-controlled processes.
ν plots were linear with close correlation coefficients, with the values for the slope of 0.48 for LEV and 0.36 for AC. The values of LEV (0.48) and AC (0.36) are close to the reported theoretical value (0.50) of the process of diffusion kinetics.36 Therefore, the observation implies that the reactions of both AC and LEV at CNNS/GO/GCE are typical diffusion-controlled processes.
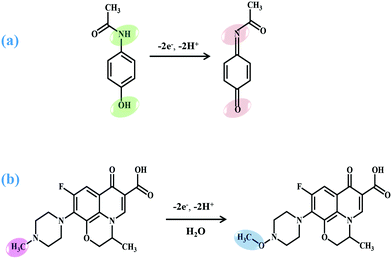
Concurrently, the number of electrons transferred (nα) in electrooxidation reactions of AC and LEV was calculated on the basis of the linear relationship between Ep and log![[thin space (1/6-em)]](https://www.rsc.org/images/entities/char_2009.gif) ν (see Fig. S7†). Ep is given in the ESI.† As the reaction is irreversible, the value of α is assumed to be 0.5.36,37 Then, the values of nα are estimated to be 2.47 (AC) and 2.36 (LEV) and the nα of two analytes involved in the rate-determining step is 2, which is concordant with earlier studies.6,38,39 The proposed corresponding mechanisms of the electrochemical reactions for AC and LEV using CNNS/GO/GCE are indicated in Scheme 2.
ν (see Fig. S7†). Ep is given in the ESI.† As the reaction is irreversible, the value of α is assumed to be 0.5.36,37 Then, the values of nα are estimated to be 2.47 (AC) and 2.36 (LEV) and the nα of two analytes involved in the rate-determining step is 2, which is concordant with earlier studies.6,38,39 The proposed corresponding mechanisms of the electrochemical reactions for AC and LEV using CNNS/GO/GCE are indicated in Scheme 2.
| Ep = −0.0456 pH + 1.193 (LEV) (R2 = 0.9939) |
| Ep = −0.0494 pH + 0.7222 (AC) (R2 = 0.9975) |
The slope values of −0.046 V/pH for LEV and −0.050 V/pH for AC were also observed, suggesting that the transfer of equal numbers of protons and electrons was involved for each molecule,40–42 which was concordant with earlier literature.39,43 The results obtained above demonstrate once again the mechanism proposed in Scheme 2.
3.4 Individual and simultaneous quantitative determination of AC and LEV
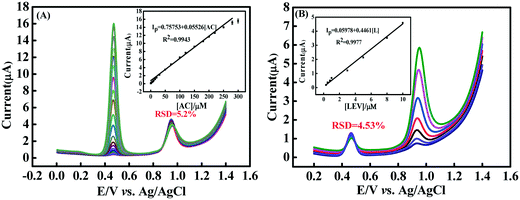
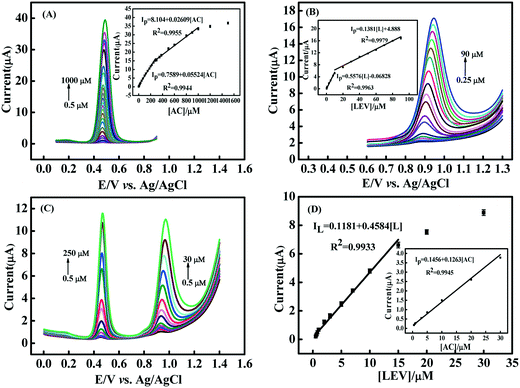
The peak current responses of the CNNS/GO/GCE towards oxidation of the mixture of AC and LEV, with the concentration of one drug changed while the concentration of another substance remained constant, was investigated via DPV technique in 0.1 M PBS (pH 5.0) under optimum experimental conditions. In Fig. 7(A), the AC concentration increased from 0.5 μM to 300.0 μM, with a fixed concentration of 5.0 μM LEV, and the relative standard deviation (RSD) obtained for fixed concentrations of LEV was 5.2%. Subsequently, the AC concentration was fixed at 10.0 μM and LEV increased within the range of 0.3 μM to 10.0 μM (Fig. 7(B)), while the current value of AC remained constant (RSD = 4.53%). The concentration of AC or LEV changed, which resulted in the increase of their respective oxidation current, and had no palpable effect on the anodic current of another ingredient. It indicates that simultaneous detection of the two drugs could be successfully achieved.AC and LEV were separately determined by the CNNS/GO/GCE in 0.1 M PBS (pH 5.0) at the concentration of AC and LEV in the range of 0.5–1000 μM and 0.25–90 μM, respectively (Fig. 8(A) and (B) and insets). A good linearity of the peak current against the concentrations of AC and LEV can be observed, which could be described as follows: Ip = 0.7589 + 0.05524 [AC] (R2 = 0.9944); Ip = 8.104 + 0.02609 [AC] (R2 = 0.9955) and Ip = −0.06828 + 0.5576 [L] (R2 = 0.9963); Ip = 4.888 + 0.1381 [L] (R2 = 0.9979), and the LOD of AC and LEV could be calculated to be 1.5 × 10⁻⁸ mol L−1 and 7.3 × 10⁻⁸ mol L−1 (S/N = 3), respectively. The sensing property of the CNNS/GO/GCE was further evaluated by simultaneously increasing the concentrations of AC (0.5–250 μM) and LEV (0.5–30 μM). Two distinctly separated peaks were obtained at +0.468 V for AC and +0.95 V for LEV in the simultaneous determination (Fig. 8(C)) and the Ip of the two analytes increased linearly with the concentration, as depicted in Fig. 8(D). The LODs for simultaneous electrooxidation analysis of AC and LEV were 1.7 × 10⁻⁸ and 7.9 × 10⁻⁸ mol L−1, respectively. The obtained analytical data of the as-prepared sensor were compared with those of other reported sensors, which are presented in Table S2.†
3.5 Potential interferents, repeatability and reproducibility
The influence of potential interferents on the properties of the CNNS/GO/GCE was investigated by DPV (n = 3) in AC (50 μM) and LEV (25 μM) containing 0.1 M PBS (pH 5.0). Fig. 9(A) shows the interference substances from some inorganic ions (K+, Mg2+), biological samples (glucose/Glu, cysteine/Cys) and several antibiotics (erythromycin/Eryc, amoxicillin/Amolin, tetracycline/TC and chloramphenicol/CPA), using a concentration ratio of 1![[thin space (1/6-em)]](https://www.rsc.org/images/entities/char_2009.gif) :
:![[thin space (1/6-em)]](https://www.rsc.org/images/entities/char_2009.gif) 1 (interferent
1 (interferent![[thin space (1/6-em)]](https://www.rsc.org/images/entities/char_2009.gif) :
:![[thin space (1/6-em)]](https://www.rsc.org/images/entities/char_2009.gif) AC), that were detected, which did not result in a marked change in AC and LEV original values. In addition, the AC and LEV detection was studied with other compounds including phenols (catechol, phenol, p-nitrophenol), hormones (estradiol, estriol), antibiotics with a chemical structure similar to levofloxacin (ciprofloxacin, enrofloxacin, ofloxacin) and uric acid (Fig. S8†). These compounds have no significant effect on the oxidation signal of AC and LEV. Hence, the obtained results manifest that CNNS/GO/GCE has good anti-interference characteristic for AC and LEV detection.
AC), that were detected, which did not result in a marked change in AC and LEV original values. In addition, the AC and LEV detection was studied with other compounds including phenols (catechol, phenol, p-nitrophenol), hormones (estradiol, estriol), antibiotics with a chemical structure similar to levofloxacin (ciprofloxacin, enrofloxacin, ofloxacin) and uric acid (Fig. S8†). These compounds have no significant effect on the oxidation signal of AC and LEV. Hence, the obtained results manifest that CNNS/GO/GCE has good anti-interference characteristic for AC and LEV detection.
The repeatability and reproducibility of electrochemical sensors are significant indicators in their practical applications. Therefore, the DPV response of the as-prepared sensor for AC (50 μM) and LEV (20 μM) in 0.1 M PBS (pH 5.0) is shown in Fig. 9(B) and (C). First, the repeatability was investigated by using the CNNS/GO/GCE sensor to perform five successive measurements (n = 5). As shown in Fig. 9(B), there is no apparent loss of signal and the obtained RSD values are lower than 5% for AC and LEV. Additionally, five CNNS/GO-modified electrodes were fabricated in different batches and employed for the determination of AC and LEV under the same test conditions, and the results are displayed in Fig. 9(C). It is evident from the above findings that the sensor possessed excellent repeatability and reproducibility.
3.6 Application of the CNNS/GO/GCE sensor using river water
In order to evaluate the practical applicability of the constructed sensor in practical sample analysis, Fenhe river water of Shanxi was chosen and analyzed to investigate the level of AC and LEV in the samples. Before analysis, the water sample was first centrifuged repeatedly to remove solid particles. Then, the supernatant obtained was filtered using a 0.22 μm membrane and diluted with 0.1 M PBS (pH 5.0). The DPV electrochemical responses were recorded after addition to the river water of quantitative AC and LEV within the active concentration ranges (Fig. S9†). Based on the experimental results in Table S3,† comparable recoveries of AC and LEV were obtained for DPV and HPLC techniques. This result manifests that the obtained assay results of the fabricated sensor are well consistent with those of HPLC. The average recovery values of the two methods varied from 95.6% to 111.8% and the RSDs were 1.03–5.01% (n = 7), which were reliable for practical matrix analysis.4. Conclusions
As far as we know, there are just a handful of reports on simultaneous determination of AC and LEV. Therefore, for the first time, this work provides a simple and environment-friendly electrochemical sensor for simultaneous detection of AC and LEV based on a CNNS/GO composite modified electrode. The composite was successfully prepared via immobilising the CNNS on the surface of GO, which exhibits superior electrochemical stability. Owing to the synergistic effects of layer-by-layer structures by charge-transfer interactions or π–π stacking, ultrathin CNNS/GO can enhance the conductivity and electrocatalytic property. The proposed sensor exhibits excellent electro-oxidation of AC and LEV with fully resolved anodic peaks, showing low detection limit, wide linear range, satisfactory selectivity, remarkable repeatability, excellent reproducibility and good anti-interference ability. It also has a good application prospect with a satisfactory recovery. Accordingly, the constructed sensing platform has potential application value for on-site detection of AC and LEV in environmental analysis.Author contributions
Wenwen Yi performed the experiment and contributed significantly to analysis and manuscript preparation; Chunxiao Han helped perform the data analyses; Zhongping Li contributed to the conception of the study, performed the data analyses and wrote the manuscript; Yujing Guo, Meng Liu and Chuan Dong helped perform the analysis with constructive discussions.Conflicts of interest
There are no conflicts to declare.Acknowledgements
We gratefully acknowledge the National Natural Science Foundation of China (No. 21775095), the Major Science and Technology Project of Shanxi Province (No. 20191102005) and the 12th “Hundred Talents Plan” in Shanxi Province (Meng Liu).References
- J. J. Xue, S. S. Ma, Y. M. Zhou, Z. W. Zhang and M. He, Facile Photochemical Synthesis of Au/Pt/g-C3N4 with Plasmon-Enhanced Photocatalytic Activity for Antibiotic Degradation, ACS Appl. Mater. Interfaces, 2015, 7, 9630–9637 CrossRef CAS PubMed.
- Y. C. Lin, T. H. Yu and C. F. Lin, Pharmaceutical contamination in residential, industrial, and agricultural waste streams: risk to aqueous environments in Taiwan, Chemosphere, 2008, 74, 131–141 CrossRef PubMed.
- J. I. Gowda, D. G. Gunjiganvi, N. B. Sunagar, M. N. Bhat and S. T. Nandibewoor, MWCNT-CTAB modified glassy carbon electrode as a sensor for the determination of paracetamol, RSC Adv., 2015, 5, 49045–49053 RSC.
- Y. F. Sun, J. B. He, L. H. Xu, H. Y. Zhang, X. G. Qiao and Z. X. Xua, A selective molecularly imprinted electrochemical sensor with GO@COF signal amplification for the simultaneous determination of sulfadiazine and acetaminophen, Sens. Actuators, B, 2019, 300, 126993 CrossRef CAS.
- K. L. Martin, D. Silva, R. P. Simões and I. Cesarino, Evaluation of Reduced Graphene Oxide Modified with Antimony and Copper Nanoparticles for Levofloxacin Oxidation, Electroanalysis, 2018, 30, 2066–2076 CrossRef.
- W. Wen, D. M. Zhao, X. H. Zhang, H. Y. Xiong, S. F. Wang, W. Chen and Y. D. Zhao, One-step fabrication of poly(o-aminophenol)/multi-walled carbon nanotubes Composite film modified electrode and its application for levofloxacin determination in pharmaceuticals, Sens. Actuators, B, 2012, 174, 202–209 CrossRef CAS.
- P. Suyana, G. Priyanka and M. Midhun, Photoregenerable, Bifunctional granules of carbon-doped g-C\r, 3\r, N\r, 4\r, as adsorptive photocatalyst for the efficient removal of tetracycline antibiotic, ACS Sustainable Chem. Eng., 2017, 5, 1610–1618 CrossRef.
- O. Szerkus, J. Jacyna, P. Wiczling, A. Gibas, M. Sieczkowski, D. Siluk, M. Matuszewski, R. Kaliszan and M. Markuszewski, Ultra-high performance liquid chromatographic determination of levofloxacin in human plasma and prostate tissue with use of experimental design optimization procedures, J. Chromatogr., B, 2016, 1029, 48–59 CrossRef.
- M. El-Kommos, N. Mohamed and A. A. Hakiem, Selective reversed phase high performance liquid chromatography for the simultaneous determination of some pharmaceutical binary mixtures containing nsaids, J. Liq. Chromatogr. Relat. Technol., 2012, 35, 2188–2202 CrossRef CAS.
- Y. Dong, M. Su, P. Chen and H. Sun, Chemiluminescence of carbon dots induced by diperiodato-nicklate (IV) in alkaline solution and its application to a quenchometric flow-injection assays of paracetamol, L-cysteine and glutathione, Microchim. Acta, 2015, 182, 1071–1077 CrossRef CAS.
- J. Lecordier, J. J. Lahet, C. Courderot-Masuyer, E. Beaudoin and B. Chaillot, Determination of acid base balance and oil water partition coefficient of an atopy patch test of levofloxacin, Biomed. Pharmacother., 2008, 62, 136–138 CrossRef CAS PubMed.
- E. Kazemi, S. Dadfarnia, A. M. H. Shabani, M. R. Fattahi and J. Khodaveisi, Indirect spectrophotometric determination of sulfadiazine based on localized surface plasmon resonance peak of silver nanoparticles after cloud point extraction, Spectrochim. Acta, Part A, 2017, 187, 30–35 CrossRef CAS PubMed.
- A. C. Huet, C. Charlier, S. A. Tittlemier, G. Singh, S. Benrejeb and P. Delahaut, Simultaneous determination of (fluoro)quinolone antibiotics in kidney, marine products, eggs, and muscle by enzyme-linked immunosorbent assay (ELISA), J. Agric. Food Chem., 2006, 54, 2822–2827 CrossRef CAS PubMed.
- R. Manel, M. B. Brahim and Y. Same, Electrochemical determination of levofloxacin antibiotic in biological samples using boron doped diamond electrode, J. Electroanal. Chem., 2017, 794, 175–181 CrossRef.
- A. Wong, A. M. Santos and O. Fatibello-Filho, Simultaneous determination of paracetamol and levofloxacin using a glassy carbon electrode modified with carbon black, silver nanoparticles and PEDOT:PSS film, Sens. Actuators, B, 2018, 255, 2264–2273 CrossRef CAS.
- C. Q. Liu, D. Xie, P. Liu, S. L. Xie, S. S. Wang, F. L. Cheng, M. Zhang and L. S. Wang, Voltammetric determination of levofloxacin using silver nanoparticles deposited on a thin nickel oxide porous film, Microchim. Acta, 2019, 186, 21 CrossRef PubMed.
- P. Balasubramanian, M. Annalakshmi, S. M. Chen and T. W. Chen, Sonochemical synthesis of molybdenum oxide (MoO3) microspheres anchored graphitic carbon nitride (g-C3N4) ultrathin sheets for enhanced electrochemical sensing of Furazolidone, Ultrason. Sonochem., 2019, 50, 96–104 CrossRef CAS PubMed.
- Y. L. Huang, Y. Tan, C. Q. Feng, S. Q. Wang, H. M. Wu and G. X. Zhang, Synthesis of CuO/g-C3N4 composites, and their application to voltammetric sensing of glucose and dopamine, Microchim. Acta, 2019, 186, 10 CrossRef PubMed.
- H. Gu, T. S. Zhou and G. Y. Shi, Synthesis of graphene supported graphene-like C3N4 metal-free layered nanosheets for enhanced electrochemical performance and their biosensing for biomolecules, Talanta, 2015, 132, 871–876 CrossRef CAS PubMed.
- N. Murugan, M. B. Chan-Park and A. K. Sundramoorthy, Electrochemical detection of uric acid on exfoliated nanosheets of graphitic-like carbon nitride (g-C3N4) based sensor, J. Electrochem. Soc., 2019, 166(9), 3163–B3170 CrossRef.
- T. Zhan, Z. W. Tan, X. J. Wang and W. G. Hou, Hemoglobin immobilized in g-C3N4 nanoparticle decorated 3D graphene-LDH network: Direct electrochemistry and electrocatalysis to trichloroacetic acid, Sens. Actuators, B, 2018, 255, 149–158 CrossRef CAS.
- R. Karthik, J. V. Kumar, S. M. Chen, C. Karuppiah, Y. H. Cheng and V. Muthuraj, A study of electrocatalytic and photocatalytic activity of cerium molybdate nanocubes decorated graphene oxide for the sensing, ACS Appl. Mater. Interfaces, 2017, 9, 6547–6559 CrossRef CAS PubMed.
- W. W. Yi, Z. P. Li, C. Dong, H. W. Li and J. F. Li, Electrochemical detection of chloramphenicol using palladium nanoparticles decorated reduced graphene oxide, Microchem. J., 2019, 148, 774–783 CrossRef CAS.
- P. Lei, Y. Zhou, R. Q. Zhu, Y. Liu, C. Dong and S. M. Shuang, Facile synthesis of iron phthalocyanine functionalized N, B–doped reduced graphene oxide nanocomposites and sensitive electrochemical detection for glutathione, Sens. Actuators, B, 2019, 297, 126756 CrossRef CAS.
- R. S. Sahua, Y. H. Shiha and W. L. Chen, New insights of metal free 2D graphitic carbon nitride for photocatalytic degradation of bisphenol A, J. Hazard. Mater., 2021, 402, 123509 CrossRef PubMed.
- H. W. Huang, K. Xiao, N. Tian, F. Dong, T. R. Zhang, X. Du and Y. H. Zhang, Template-free precursor-surface-etching route to porous, thin g-C3N4 nanosheets for enhancing photocatalytic reduction and oxidation activity, J. Mater. Chem. A, 2017, 5, 17452–17463 RSC.
- H. Q. Zhang, Y. H. Huang, S. R. Hu, Q. T. Huang, C. Wei, W. X. Zhang, W. Z. Yang, P. H. Dong and A. Y. Hao, Self-assembly of graphitic carbon nitride nanosheets–carbon nanotube composite for electrochemical simultaneous determination of catechol and hydroquinone, Electrochim. Acta, 2015, 176, 28–35 CrossRef CAS.
- H. Q. Zhang, Q. T. Huang, Y. H. Huang, F. M. Li, W. X. Zhang, C. Wei, J. H. Chen, P. W. Dai, L. Z. Huang, Z. Y. Huang, L. P. Kang, S. R. Hu and A. Y. Hao, Graphitic carbon nitride nanosheets doped graphene oxide for electrochemical simultaneous determination of ascorbic acid, dopamine and uric acid, Electrochim. Acta, 2014, 142, 125–131 CrossRef CAS.
- L. F. Fan, C. Y. Zhang, W. J. Yan, Y. J. Guo, S. M. Shuang, C. Dong and Y. P. Bi, Design of a facile and label-free electrochemical aptasensor for detection of atrazine, Talanta, 2019, 201, 156–164 CrossRef CAS PubMed.
- T. B. Nguyen, C. P. Huang and R. Doong, Enhanced catalytic reduction of nitrophenols by sodium borohydride over highly recyclable Au@graphitic carbon nitride nanocomposites, Appl. Catal., B, 2019, 240, 337–347 CrossRef CAS.
- D. Yang, L. L. Li, G. Xiao and S. Zhang, Steering charge kinetics in metal-free g-C3N4/melem hybrid photocatalysts for highly efficient visible-light-driven hydrogen evolution, Appl. Surf. Sci., 2020, 510, 145345 CrossRef CAS.
- J. J. Li, Y. P. Tang, R. Y. Jin, Q. H. Meng, Y. Y. Chen, X. Long, L. W. Wang, H. Guo and S. Zhang, Ultrasonic-microwave assisted synthesis of GO/g-C3N4 composites for efficient photocatalytic H2 evolution, Solid State Sci., 2019, 97, 105990 CrossRef CAS.
- J. Mao, T. Peng, X. Zhang, K. Li, L. Ye and L. Zan, Effect of graphitic carbon nitride microstructures on the activity and selectivity of photocatalytic CO2 reduction under visible light, Catal. Sci. Technol., 2013, 3, 1253–1260 RSC.
- Z. T. Wu, L. Gao, J. Wang, F. G. Zhao, L. L. Fan, D. Hua, S. Japip, J. R. Xiao and X. J. Xiao, Preparation of glycine mediated graphene oxide/g-C3N4 lamellar membranes for nanofiltration, J. Membr. Sci., 2020, 601, 117948 CrossRef CAS.
- M. Annalakshmi, S. Kumaravel, S. M. Chen, P. Balasubramanian and T. S. T. Balamurugan, A straightforward ultrasonic-assisted synthesis of zinc sulfide for supersensitive detection of carcinogenic nitrite ions in water samples, Sens. Actuators, B, 2020, 5, 127387 CrossRef.
- P. B. Deroco, R. C. Rocha-Filho and O. Fatibello-Filho, A new and simple method for the simultaneous determination of amoxicillin and nimesulide using carbon black within a dihexadecyl phosphate film as electrochemical sensor, Talanta, 2018, 179, 115–123 CrossRef CAS PubMed.
- N. S. Punde, A. S. Rajpurohit and A. K. Srivastava, Sensitive electrochemical platform based on nano-cylindrical strontium titanate/N-doped graphene hybrid composite for simultaneous detection of diphenhydramine and bromhexine, Electrochim. Acta, 2019, 319, 727–739 CrossRef CAS.
- Y. J. Han, R. Zhang, C. Dong, F. Q. Cheng and Y. J. Guo, Sensitive electrochemical sensor for nitrite ions based on rose-like AuNPs/MoS2/graphene composite, Biosens. Bioelectron., 2019, 142, 111529 CrossRef CAS PubMed.
- N. S. Anuar, W. J. Basirun, M. Ladan, Md. Shalauddin and M. S. Mehmood, Fabrication of platinum nitrogen-doped graphene nanocomposite modified electrode for the electrochemical detection of acetaminophen, Sens. Actuators, B, 2018, 266, 375–383 CrossRef CAS.
- D. Balram, K. Y. Lian and N. Sebastian, Ultrasound-assisted synthesis of 3D flower-like zinc oxide decorated fMWCNTs for sensitive detection of toxic environmental pollutant 4-nitrophenol, Ultrason. Sonochem., 2020, 60, 104798 CrossRef CAS PubMed.
- A. Wong, C. A. Razzino, T. A. Silva and O. Fatibello-Filho, Square-wave voltammetric determination of clindamycin using a glassy carbon electrode modified with graphene oxide and gold nanoparticles within a crosslinked chitosan film, Sens. Actuators, B, 2016, 231, 183–193 CrossRef CAS.
- P. Arul, E. Narayanamoorthi and S. Abraham John, Covalent organic framework film as an effective electrocatalyst for the simultaneous determination of dihydroxybenzene isomers in water samples, Sens. Actuators, B, 2020, 313, 128033 CrossRef CAS.
- C. Q. Liu, D. Xie, P. Liu, S. L. Xie, S. S. Wang, F. L. Cheng, M. Zhang and L. S. Wang, Voltammetric determination of levofloxacin using silver nanoparticles deposited on a thin nickel oxide porous film, Microchim. Acta, 2019, 186, 21 CrossRef PubMed.
Footnote |
| † Electronic supplementary information (ESI) available. See DOI: 10.1039/d0en00858c |
| This journal is © The Royal Society of Chemistry 2021 |

