
COVID-19 lockdowns induced land surface temperature variability in mega urban agglomerations in India
Dhruv
Nanda
a,
Deepk R.
Mishra
b and
Debadatta
Swain
 *a
*a
aSchool of Earth, Ocean and Climate Sciences, Indian Institute of Technology Bhubaneswar, Argul, Jatni, 752050, Odisha, India. E-mail: dswain@iitbbs.ac.in; dn13@iitbbs.ac.in
bDepartment of Geography, University of Georgia, Athens, GA 30602, USA. E-mail: dmishra@uga.edu
First published on 10th December 2020
Abstract
The COVID-19 pandemic forced a nationwide lockdown in India for months when close to 1.3 billion people were confined to their homes. An abrupt halt in the majority of the urban activities reduced the generation of anthropogenic heat which often exacerbates the Urban Heat Island (UHI) effect in the urban pockets of the country. We studied the lockdown impact on seven highly populated and polluted mega urban agglomerations across India, namely Delhi, Ahmedabad, Hyderabad, Kolkata, Mumbai, Bengaluru and Chennai, using near-anniversary Landsat 8 data. The results revealed that the lockdowns have improved the air quality and reduced the Land Surface Temperature (LST) and hence the UHI effect over these cities. Each of the cities experienced an improved Air Quality Index (AQI) ranging from 18 to 151 units except Chennai (with a marginal 8 units increase in AQI), a decrease in mean LST in the range of 0.27 °C to 7.06 °C except Kolkata which showed an increment by ∼4 °C, and a reduction in daily averaged air temperature ranging from 0.3 °C to 10.88 °C except Hyderabad which witnessed an increase of 0.09 °C during the lockdown (April 2020) compared to the previous years (April 2019 and 2018). Delhi exhibited the maximum positive impact of the lockdown in all aspects with two-fold improved air quality, and Ahmedabad showed the least improvement. In addition to the variations in regional land use and land cover and proportion of essential industries that remained operational throughout the lockdown, the geographic location, topography, local meteorology and climate were some of the other factors also responsible for either aiding or overcompensating the large scale LST variabilities observed in these cities. These results hint at an unprecedented opportunity to evaluate the effectiveness of periodic planned lockdowns as a possible mitigating measure to reduce LST spikes and degraded air quality in urban areas in the future.
Environmental significanceAnthropogenic heat is responsible for increased Land Surface Temperatures (LST) which exacerbates Urban Heat Island (UHI) effect in cities. The COVID-19 pandemic forced lockdown resulted in an abrupt halt in majority of urban activities reducing the generation of anthropogenic heat. This was shown to improve the air quality (by ∼31%), reduce LST (∼5.42%) on an average and consequently the UHI effect over the study regions which demonstrated the positive environmental impacts of contingency measures like lockdowns in minimizing environmental degradation. The results hint at an unprecedented opportunity to evaluate the effectiveness of periodic lockdowns in the future as a possible planned UHI and air pollution mitigating measure globally to contain the rapid warming of urban areas and deteriorating air quality. |
1. Introduction
In recent decades, large scale urbanization has been quite rapid, resulting in significant changes in local/regional environment and climate.1 Urbanization causes changes in the underlying surface as well as the release of anthropogenic heat and pollutants into the atmosphere through human metabolism, vehicles, industrial activities, and energy consumption in buildings including electricity and heating fuels.2,3 Urbanization and associated anthropogenic activities have resulted in land use changes, particularly involving depletion of vegetation cover and rapid increase of built-up areas in addition to increased anthropogenic loading of greenhouse gases.4,5 The anthropogenic alterations of surface morphology due to urbanization (increase in urban infrastructure) result in significant changes in the local surface energy balance.6–9 These have a direct effect on land surface temperature (LST) and heat fluxes giving rise to the urban heat island (UHI) effect apart from contributing to global warming.10,11 Increases in LST in the urban agglomerates are further exacerbated by modification of the land surface that uses materials that effectively retain heat due to different bulk thermal properties in addition to continued emission of heat by human activities.12,13 Considering the aspect of air pollution, large amounts of anthropogenic activities driven pollution and heat flux also affect urban air quality and boundary layer meteorology. Consequently, poor air quality represented by high values of air quality index (AQI) is the most common indicator in urban observation stations. These further alter the urban thermal environment affecting its microclimate.1,14Driven primarily by the widespread lockdowns globally, the world has witnessed a sudden reduction in anthropogenic activities due to the COVID-19 pandemic.15–19 India underwent an extensive and complete lockdown in April to contain the spread of COVID-19. The pandemic induced nation-wide lockdowns declared on 24th March 2020 initially for 21 days were extended for months in phases and resulted in more than 1.3 billion Indians staying home. This was followed by phases of “unlock” starting on 1st June 2020 with intermittent measures to date. These lockdowns had an impact, mostly positive, on the environment from improved air quality to reduced anthropogenic heat generation. Transport services (including road, water, and air), industrial20,21 and farming activities,22 and even household cooking23–25 are the major contributors of air pollution and sources of anthropogenic heat. Anthropogenic heat is well known to exacerbate UHI effect by raising urban temperatures and producing a warm air canopy over the city.11,14,26,27 This can easily raise the ambient air temperature (AT) by several degrees Celsius, depending on the location and time of the year. The widespread lockdowns have not only improved the air quality because of the reduction in overall greenhouse gas (GHG) emissions but also reduced the production of heat with most of the anthropogenic activities remaining suspended globally. Some of the early observations using Sentinel-5P satellite data revealed a notable drop in PM2.5 along with other air pollutants over India.28,29 Significant improvements in air and water quality have also been attributed to the massive decline in vehicular and air traffic, transportation services, industrial and other similar anthropogenic activities.16,19
Reduction in urban anthropogenic heating was expected to modify the UHI effects in Indian megacities which are among the most heavily polluted and populated in the world. In this study, we analyzed the spatial variability of LST as a proxy for UHI conditions in seven highly urbanized, populated and polluted mega agglomerations spread across India before and during the lockdown. The cities represented a wide variation in impervious cover, regional climatic zones, and terrain conditions. Comparison of pre-monsoon summer (April) LST between 2019 (baseline) and 2020 (during lockdown) insinuated the possible impacts of the lockdown induced fluctuations in the anthropogenic heat load on the urban environments. We hypothesized that reduced production of anthropogenic heat from an abrupt halt in urban transportation and other such activities reduced LST in known UHI environments during the lockdown (April 2020) compared to pre-pandemic near-anniversary dates (April 2019) and a comparative period in 2018 with similar meteorological conditions. The analysis provides a one-off opportunity to examine the impact of lockdowns on the possible reduction in anthropogenic heat and thus the cities' thermal environments.
2. Data and methods
Several earlier studies have utilized LST as a direct proxy for analyzing the impact of land use land cover (LULC) changes on the UHI effect.30–33 LST is an ideal parameter that reflects the impact of heat exchange as a response to rapidly changing urban environments. Even increasing AT due to heightened pollution translates into increased LST with more heat retained in the earth system and for longer periods. Landsat-8 data sets were primarily utilized to detect changes in LST during April 2020 vis-à-vis April 2019 to analyze the impact of recent lockdowns. Concurrent April 2018 data sets were also utilized to ensure that the results were not biased owing to any single anomalous year. Details on the study sites and the data sets are discussed in the following sub-sections.2.1 Study area
Our analysis considered seven cities representing India's wide geographical diversity (Fig. 1). The urban agglomerations so selected are also the megacities which have experienced the highest rates of urban population growth in addition to urbanization in the recent decades.34,35 These have also witnessed the impact of rising temperatures and enhanced UHI effects over the years owing to increased anthropogenic activities.11,36–42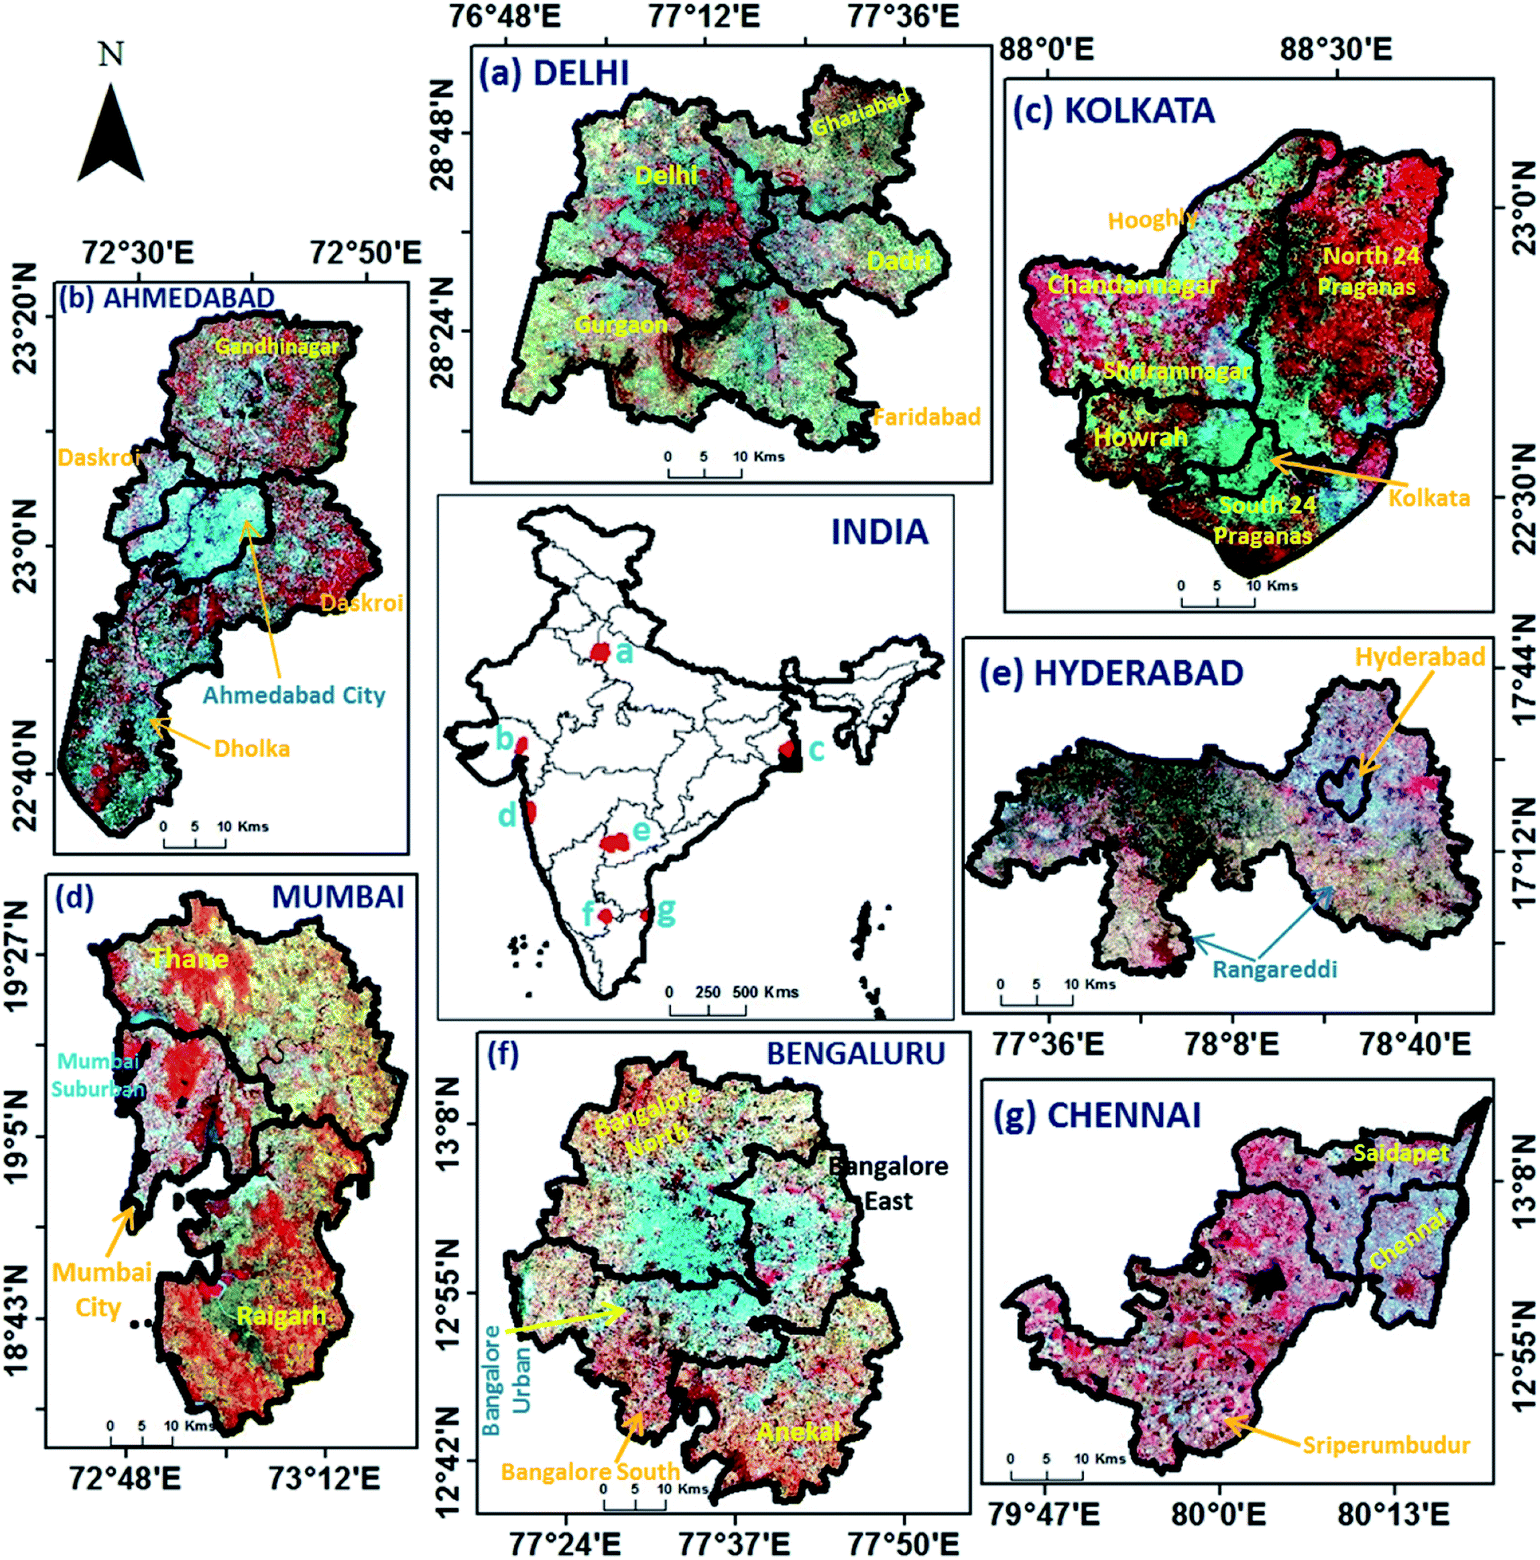 | ||
| Fig. 1 Landsat-8 False Color Composites (FCC) (R:G:B – bands 5:4:3) of the Indian cities selected for the analysis. | ||
The cities considered were Delhi, the landlocked metro capital of the country on the north relatively close to the Himalayas, Hyderabad with a hot arid climate, Bengaluru, one of the fastest-growing and information technology hub of the country. The three cities represented a fair latitudinal variability from north to south. Ahmedabad, a rapidly urbanizing, hot, semi-arid landlocked city on the west coast, Mumbai, the economic capital on the Arabian Sea coast on the west of India, and Kolkata, one of the oldest and densely populated metros in eastern Indian on the Bay of Bengal coast, presented a longitudinal spread of the country from west to east. And the seventh city selected was Chennai, the most densely populated coastal metro in the south of India. The demographic details of the cities and their surrounding areas are presented in Table 1 and illustrated in Fig. 1.
| Sl. no. | City (average elevation from MSL) | Total populationa | Population densitya (persons per km2) | Surroundings |
|---|---|---|---|---|
| a Source: CensusInfo India 2011 Dashboard (https://censusindia.gov.in/2011-Common/CensusInfo.html). | ||||
| 1 | Delhi (226 m) | 16![[thin space (1/6-em)]](https://www.rsc.org/images/entities/char_2009.gif) 787941 787941 |
11320 |
Dadri, parts of Ghaziabad, Gurgaon and Faridabad |
| 2 | Ahmedabad (53 m) | 7214225 |
890 | Gandhinagar and parts of Dolka |
| 3 | Kolkata (9.14) | 4496694 |
24306 |
Howrah, parts of Hugli and South 24 Parganas |
| 4 | Mumbai & suburban (14 m) | 12442373 |
20316 |
Thane and parts of Raighar |
| 5 | Hyderabad (536 m) | 3943323 |
18172 |
Rangareddi |
| 6 | Bengaluru (920 m) | 9621551 |
4393 | Urban and rural Bengaluru |
| 7 | Chennai (6.7 m) | 4646732 |
26705 |
Sriperumbudur and Saidapet |
2.2 Data used
Satellite as well as concurrent meteorological observations were utilized in the study. Secondary supporting data sets namely, census, city and district boundaries, main city area, and elevation from mean sea level (MSL) were also used.2.3 Methodology
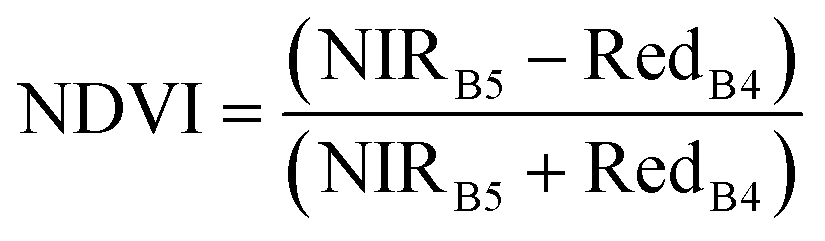
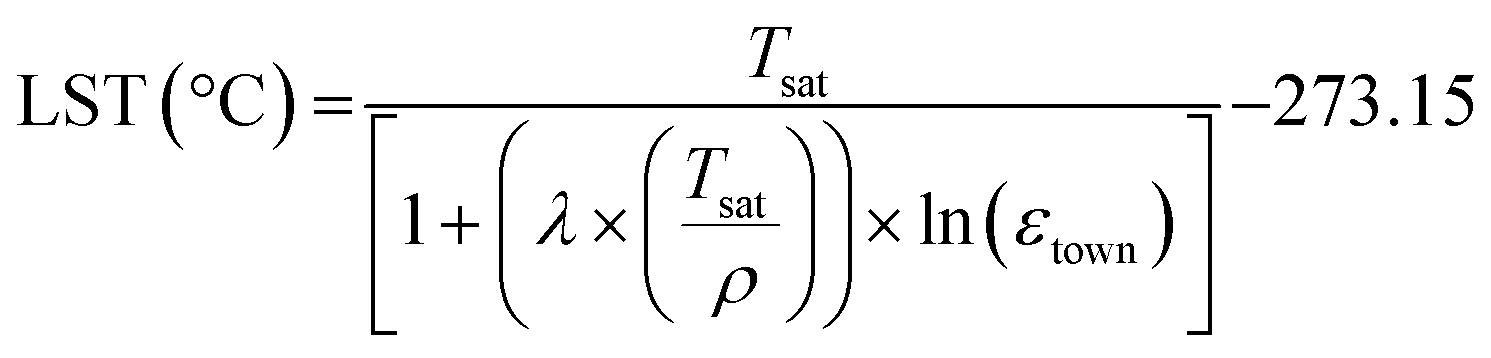
The first step of our analysis was the retrieval of LST from Landsat-8 for April 2018, April 2019 & April 2020 over the seven cities. This was followed by the application of basic quality control checks on the meteorological data sets and derived LST, and then an inter-comparison of LST over the seven mega agglomerations during lockdown (April 2020) and the pre-pandemic near anniversary dates in the previous years (April 2019 and 2018).LST for each city was derived from TIRS band 10, and OLI bands (bands 4 and 5) of Landsat-8, using the mono window algorithm47,48 from at-sensor or TOA brightness temperature (Tsat) and land surface emissivity (LSE, represented by ε). Tsat was obtained by processing band 10 of Landsat-8. We did not use the TIRS band 11 in our analysis due to the reported radiometric calibration issues (Landsat Missions).49 LSE was estimated from the proportion of vegetation calculated using the Normalized Difference Vegetation Index (NDVI) and an established algorithm as described below.
536. These were converted to TOA reflectance (Rλ) following the methodology discussed in.50
The TOA spectral radiance “Lλ” in W m−2 sr−1 μm−1 for band 10 was computed as:
| Lλ = MB10Qcal + AL | (1) |
Similarly, TOA planetary reflectance “Rλ” corrected for the sun angle were obtained using the rescaling coefficients as in eqn (2):
| Rλ = (MρQcal + Aρ)/sin(θSE) | (2) |
Thereafter, the thermal band data was converted from spectral radiance “Lλ” to TOA brightness temperatures “Tsat (in K)” as:
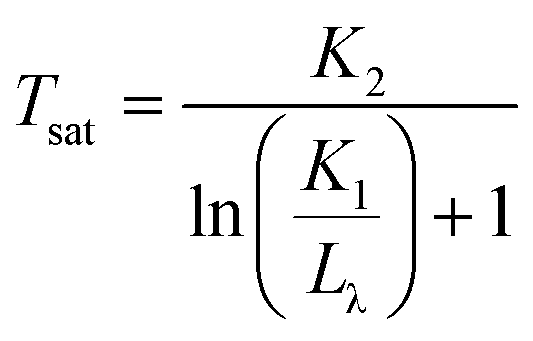 | (3) |
 | (4) |
This was followed by the computation of the proportion of vegetation “pv”53,54 considering NDVI for vegetation (NDVIV) and soil (NDVIS) as 0.5 and 0.2, respectively.54
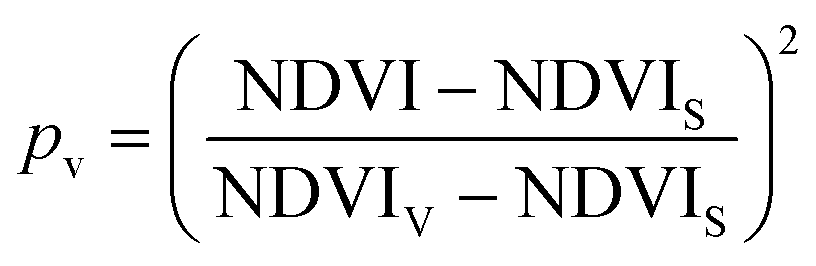 | (5) |
Since, our study primarily consisted of urban settlements, LSE for city area was calculated from the vegetational proportion “pv” using the suggested formulation.55,56
| εtown = 0.9608420 + 0.0860322pv − 0.0671580pv2 | (6) |
 | (7) |
LST was obtained from Landsat 8 data sets utilizing the above methodology for all seven megacities. The LST images were mapped by rescaling the range between minimum and maximum temperatures for each city for a comparative analysis between the different dates.
3. Results and discussion
Considerable variations in LST were observed between 2018, 2019 and 2020 for all cities. The LST maps for the seven cities are presented in Fig. 3–9 and the corresponding comparative statistics are listed in Table 2. It is relevant to mention that the present work does not attempt any intercomparison between the cities, rather the conditions during the three years over the same city were inter-compared. Significant contrasts exists between the cities in terms of climatological and geographic settings, LULC composition, the proportion of essential to non-essential industries, and local/state policies and regulations which are constraining factors preventing any inter-city comparisons. Consequently, the meteorological parameters and their interaction with other influential variables in different climate zones (or cities) would be much different and localized. The urban areas tend to have a localized and distinct set of climatic characteristics resulting from the inadvertent climate modification on a relatively small scale.55 Therefore, deviations observed in any city were analyzed based on the possible contributing factors for that particular city alone to account for the observed variabilities.| City (avg. elevation from MSL) | Date | AQIb | ΔAQIb | LST from Landsat 8 images (°C) | Meteorological data (daily spatial average) | ||||||||
|---|---|---|---|---|---|---|---|---|---|---|---|---|---|
| Ppt. (mm per day) | WS (m s−1) | RH (%) | AT (°C) | TOA Insol. (MJ per m2 per day) | NR (W m−2) | ||||||||
| Min. | Max. | Mean | ΔMean | ||||||||||
| a AQI: air quality index; ΔAQI = AQIYear2 − AQIYear1; LST: land surface temperature; ΔMean = MeanLSTYear2 − MeanLSTYear1; Ppt.: precipitation; WS: wind speed; RH: relative humidity; AT: air temperature; TOA Insol.: top of atmosphere insolation; NR: net radiation. b Average of observations from multiple stations concurrent with satellite pass timings. | |||||||||||||
| Delhi (226 m) | 30th Apr 2020 | 120 | −151 | 27.12 | 45.99 | 35.96 | −7.06 | 0.00 | 2.18 | 49.16 | 24.28 | 36.66 | 32.44 |
| 28th Apr 2019 | 271 | 16 | 28.76 | 54.76 | 43.02 | 0.51 | 0.29 | 2.94 | 22.49 | 35.16 | 38.16 | 41.89 | |
| 25th Apr 2018 | 255 | — | 28.27 | 54.75 | 42.51 | — | 0.00 | 2.62 | 10.21 | 33.74 | 38.09 | 37.48 | |
| Ahmedabad (53 m) | 28th Apr 2020 | 100 | −18 | 31.62 | 51.56 | 42.73 | −0.27 | 0.01 | 1.80 | 23.73 | 37.43 | 38.63 | 55.12 |
| 26th Apr 2019 | 118 | 32 | 31.31 | 53.17 | 43.00 | −0.78 | 0.00 | 2.89 | 21.73 | 37.73 | 38.47 | 55.10 | |
| 23rd Apr 2018 | 150 | — | 31.39 | 51.53 | 43.78 | — | 0.00 | 1.27 | 27.82 | 33.68 | 38.29 | 33.07 | |
| Kolkata (9.14 m) | 06th Apr 2020 | 80 | −38 | 28.00 | 50.42 | 36.33 | 3.91 | 0.08 | 1.77 | 36.29 | 30.17 | 37.02 | 72.76 |
| 20th Apr 2019 | 118 | 14 | 25.71 | 45.54 | 32.42 | 0.39 | 0.14 | 1.76 | 44.16 | 32.72 | 38.13 | — | |
| 17th Apr 2018 | 104 | — | 24.53 | 46.21 | 32.03 | — | 1.05 | 5.16 | 27.09 | 30.00 | 37.06 | 88.19 | |
| Mumbai (14 m) | 28th Apr 2020 | 53 | −59 | 27.98 | 47.71 | 37.30 | −1.85 | 0.01 | 3.50 | 65.59 | 31.59 | 38.51 | 79.37 |
| 26th Apr 2019 | 112 | 23 | 28.16 | 50.25 | 39.15 | −0.01 | 0.48 | 2.60 | 70.19 | 31.75 | 38.56 | 83.78 | |
| 23rd Apr 2018 | 89 | — | 26.92 | 51.88 | 39.16 | — | 0.00 | 3.34 | 61.88 | 31.35 | 38.39 | 75.37 | |
| Hyderabad (536 m) | 16th Apr 2020 | 71 | −25 | 21.58 | 50.08 | 39.28 | −2.68 | 0.00 | 2.33 | 26.04 | 35.39 | 38.12 | 68.35 |
| 14th Apr 2019 | 96 | 7 | 27.00 | 51.71 | 41.96 | 3.85 | 0.33 | 2.36 | 26.88 | 35.30 | 37.99 | 77.17 | |
| 27th Apr 2018 | 89 | — | 26.05 | 45.68 | 38.11 | — | 0.00 | 3.34 | 61.88 | 31.35 | 38.39 | 75.37 | |
| Bengaluru (920 m) | 16th Apr 2020 | 52 | −51 | 17.74 | 49.00 | 36.22 | −3.23 | 0.00 | 2.65 | 41.14 | 31.09 | 38.06 | 59.53 |
| 14th Apr 2019 | 103 | 1 | 17.12 | 48.48 | 39.45 | 4.03 | 0.00 | 3.08 | 26.14 | 32.21 | 38.01 | 50.71 | |
| 27th Apr 2018 | 102 | — | 20.01 | 45.23 | 35.42 | — | 0.08 | 3.89 | 26.51 | 37.38 | 38.5 | 42.01 | |
| Chennai (6.7 m) | 02nd Apr 2020 | 61 | 8 | 27.00 | 43.25 | 34.95 | −5.50 | 0.00 | 3.75 | 64.28 | 32.10 | — | 55.12 |
| 16th Apr 2019 | 53 | 5 | 28.92 | 50.49 | 40.45 | 9.40 | 0.00 | 4.00 | 62.84 | 32.62 | 38.08 | 63.94 | |
| 28th Mar 2018 | 58 | — | 21.21 | 44.04 | 31.05 | — | 0.00 | 3.30 | 64.70 | 29.40 | 38.16 | 81.57 | |
3.1 Land surface temperature analysis
The 2018–2019–2020 LST comparison allowed us to deduce the possible impact of lockdown and the associated reduction in anthropogenic activities on its variability. The percentage change in mean LST for each city for two time periods (2019 & 2020) is presented in Fig. 2. All the cities except Kolkata showed a clear reduction in the mean LST during the lockdown period as compared to the same period in the previous year (Table 2). The maximum decrease was observed for Delhi, whereas the least change was for Ahmedabad. Kolkata showed a clear increase in LST during 2020 as against the same period in 2019.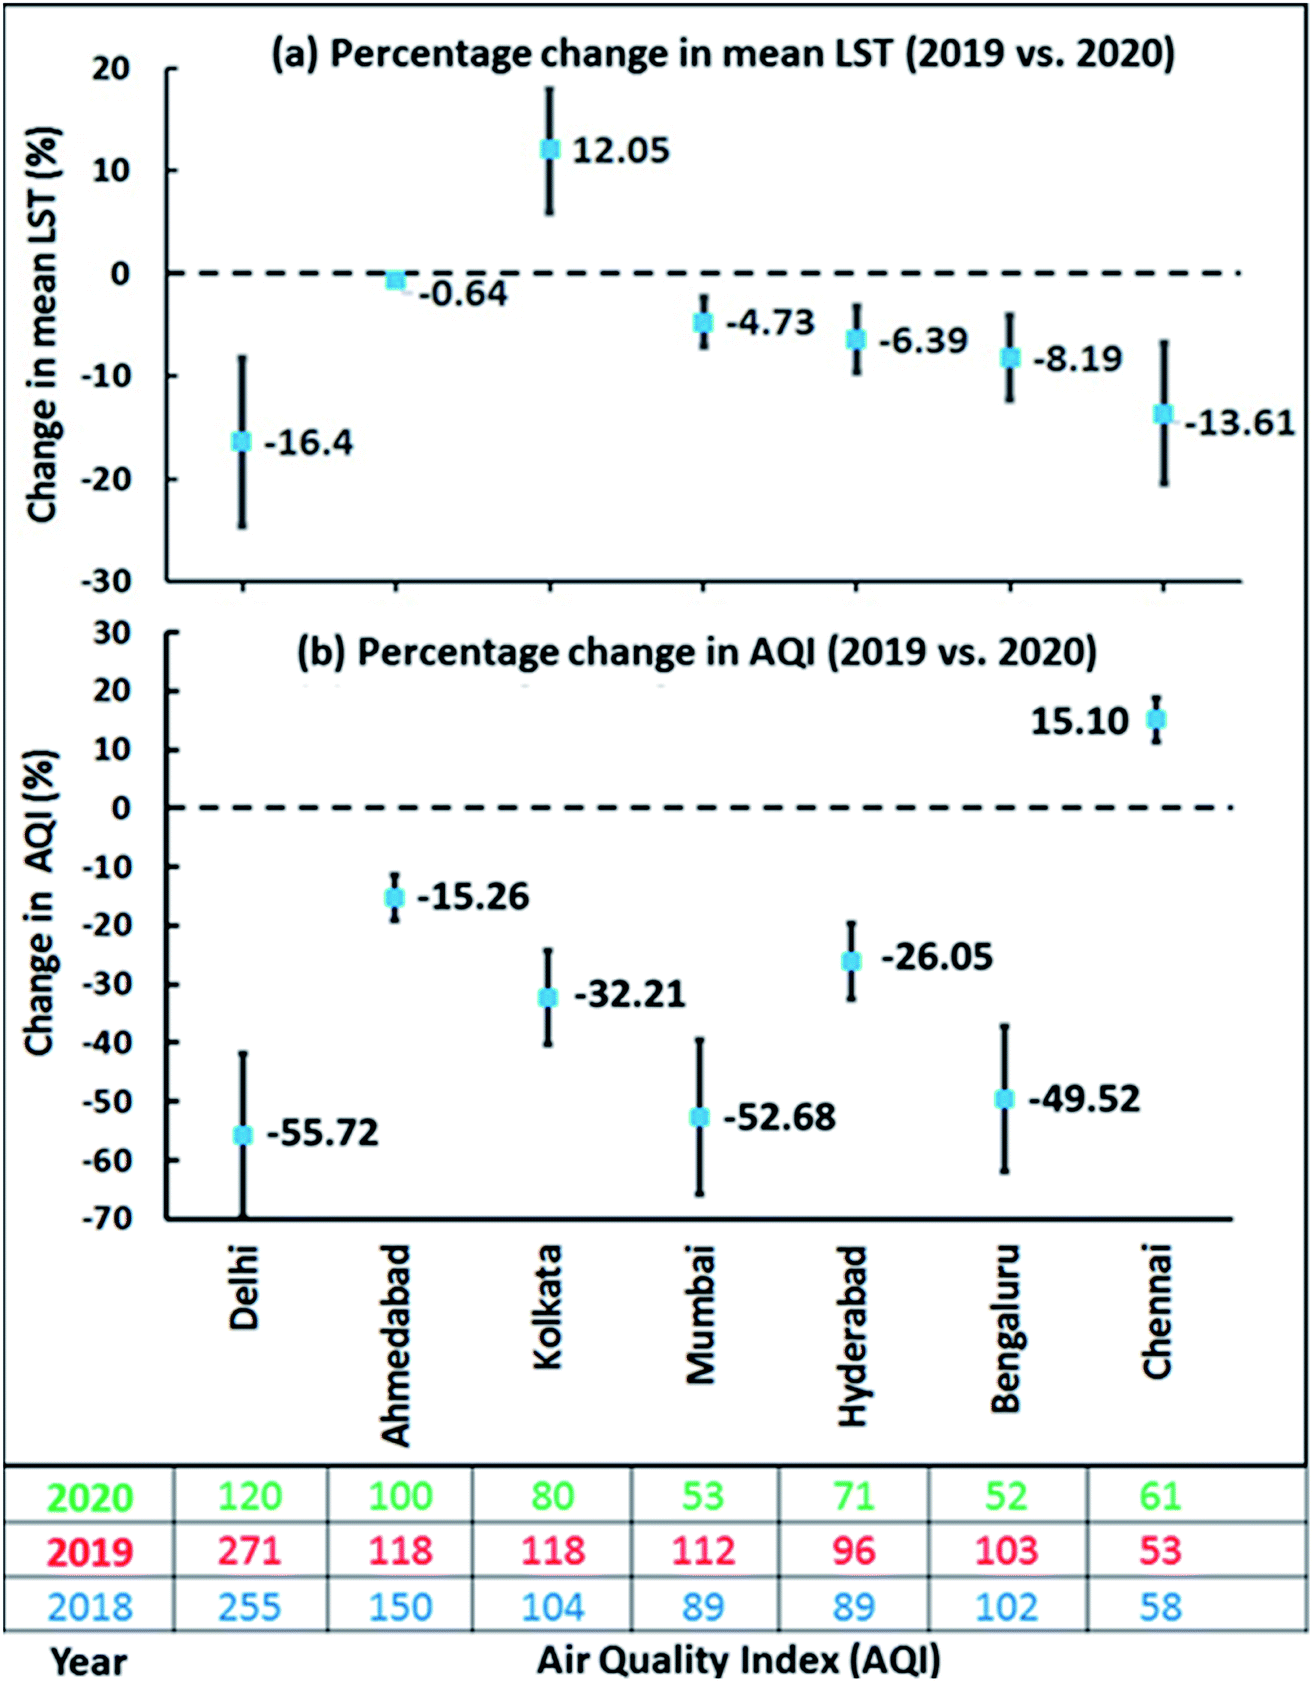 | ||
| Fig. 2 Percentage change in (a) mean land surface temperature, and (b) air quality index during lockdown (April 2020) concerning the same period in 2019. Absolute AQI values for corresponding periods in 2018, 2019 and 2020 are also listed. | ||
Another important aspect of the analysis is the fact that the seven mega urban agglomerations considered are at different elevations. The three coastal metros (Kolkata, Mumbai, and Chennai) are at less than 15 m elevations from MSL (Table 1). Ahmedabad which is at an elevation of 53 m from MSL is a hot landlocked and also the aridest city among the seven megacities considered. Hyderabad is located at an average elevation of 536 m from MSL. Bengaluru is at the highest altitude of 920 m and Delhi, the northernmost metro is at an average elevation of 226 m from MSL (Table 1). Elevation plays a crucial role in the LST distribution and hence UHI of the city. From an earlier analysis spread over three decades on various towns in the state of Odisha in India, the surface temperature trends were observed to vary at different rates depending on their elevations.57 LST spatial variability in urban environments is a highly complex phenomenon to be well represented by a single or even multiple weather station observations of a few meteorological parameters. It is rather dependent on a suite of environmental and biophysical drivers.58 The city-wise spatial distribution of LST and the prevailing meteorological conditions are discussed below.
The percent change in mean LST for the lockdown period with respect to 2019 and the associated change in AQI over the seven mega urban agglomerates are presented in Fig. 2. Delhi showed the maximum LST decrease of 16.4% and also the maximum improvement in AQI (55.72%) as compared to the rest of the cities (Fig. 2a). Ahmedabad showed the least change in LST at 0.64%. While all other cities showed an improvement in air quality during the lockdown, the AQI in the coastal megacity of Chennai rather deteriorated by 15.10%. The decrease in mean LST and AQI averaged over the seven study regions was 5.42% and 31%, respectively. The city-wise spatial distribution of LST and the prevailing meteorological conditions are discussed in the following sections.
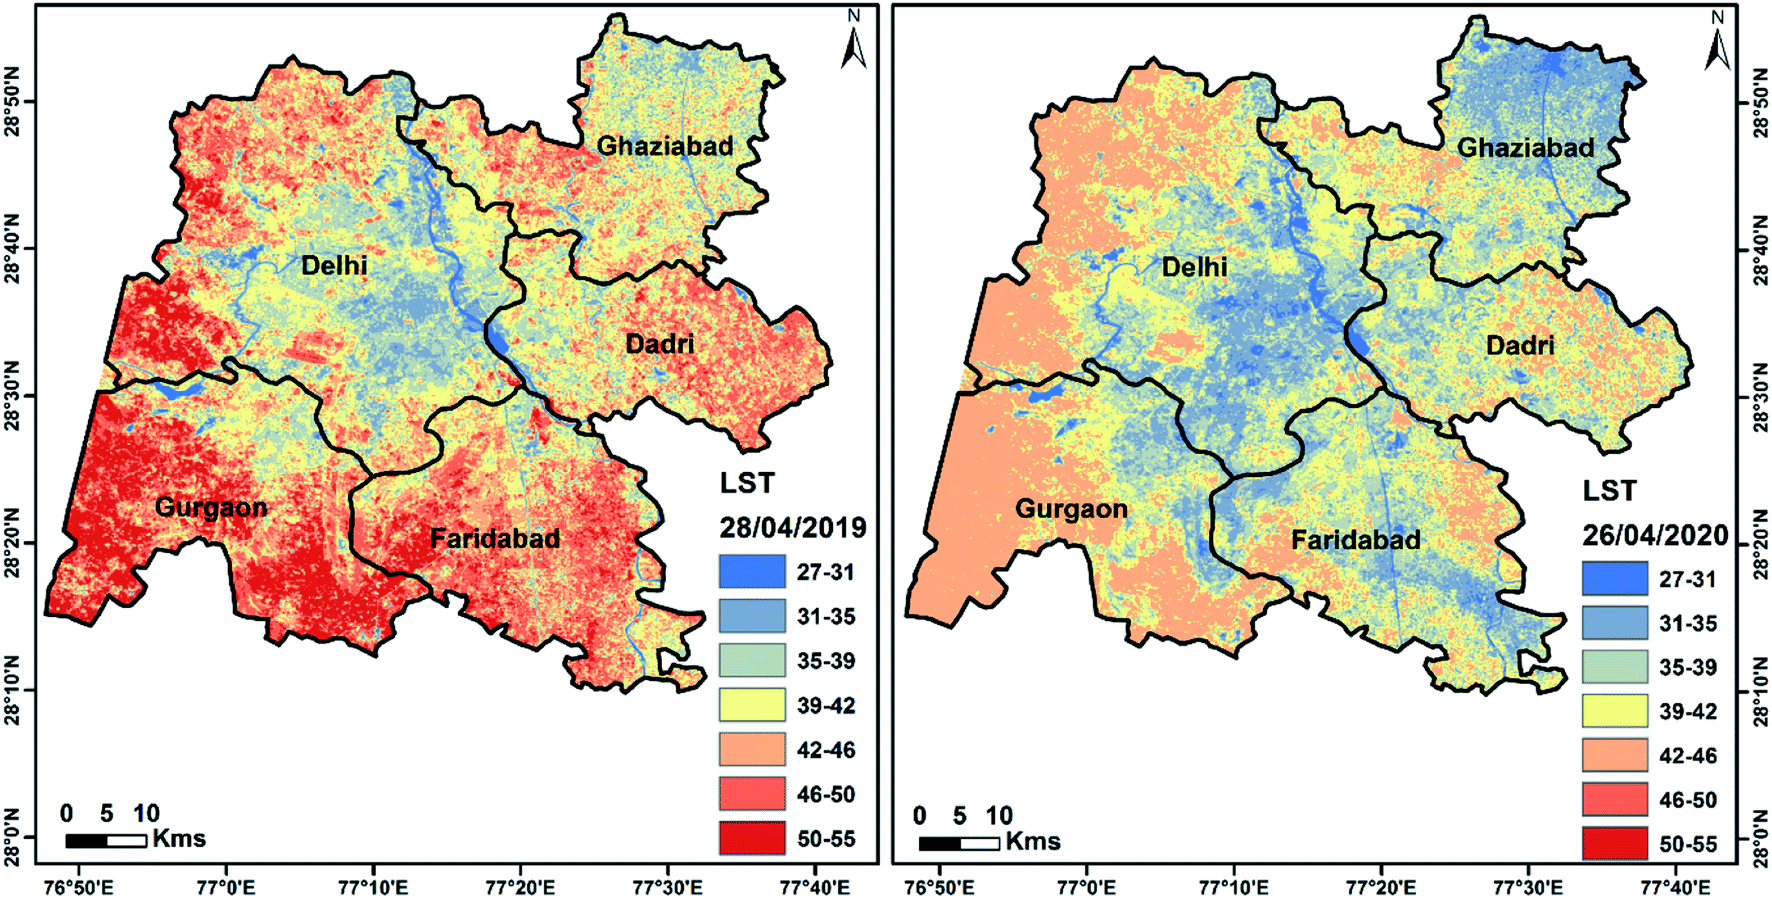 | ||
| Fig. 3 LST comparison for 28th April 2019 and 30th April 2020 over Delhi. | ||
Meteorological station reported data also showed a similar reduction from 35.16 °C in 2019 to 24.28 °C in 2020. Delhi experienced the largest improvement in air quality with AQI dropping more than two-fold (by ∼56%) in 2020 compared to the same time in 2019 or even 2018 (Table 2). Gautam28 also reported a reduction in air pollution by almost 50% over Delhi during the lockdown period. It is to be noted that the WS and TOA insolation were almost comparable for both the days in 2019 and 2020. AT and net radiation were lower in 2020 compared to 2019. The sharp change in AT at the peak of the lockdown is most likely related to the reduction in anthropogenic heat when all urban activities including a majority of urban transportation were halted. Precipitation of 0.29 mm per day was reported in 2019 compared to 0 mm per day in 2020, but the RH in 2020 was double that of the corresponding day in 2019. This corroborates with the observations by researchers who had reported an increase in mid-tropospheric RH during the lockdown using meteorological reanalysis data attributing it to increased atmospheric moisture coupled with stagnant circulation condition over central India.59 Delhi and its surroundings had the largest swing in LST, AT, RH, and other meteorological factors than any other city. As already mentioned, a large hike in RH in 2020 also saw a significant reduction in AT. Surface AT and RH have a non-linear relationship which is even strongly negative at the peak values.60 Therefore, it is not unusual to see such a drop in AT for Delhi when RH increased by more than two-fold. The role of lockdown in reducing the LST over Delhi and its suburbs is hence clearly appreciable from the analysis.
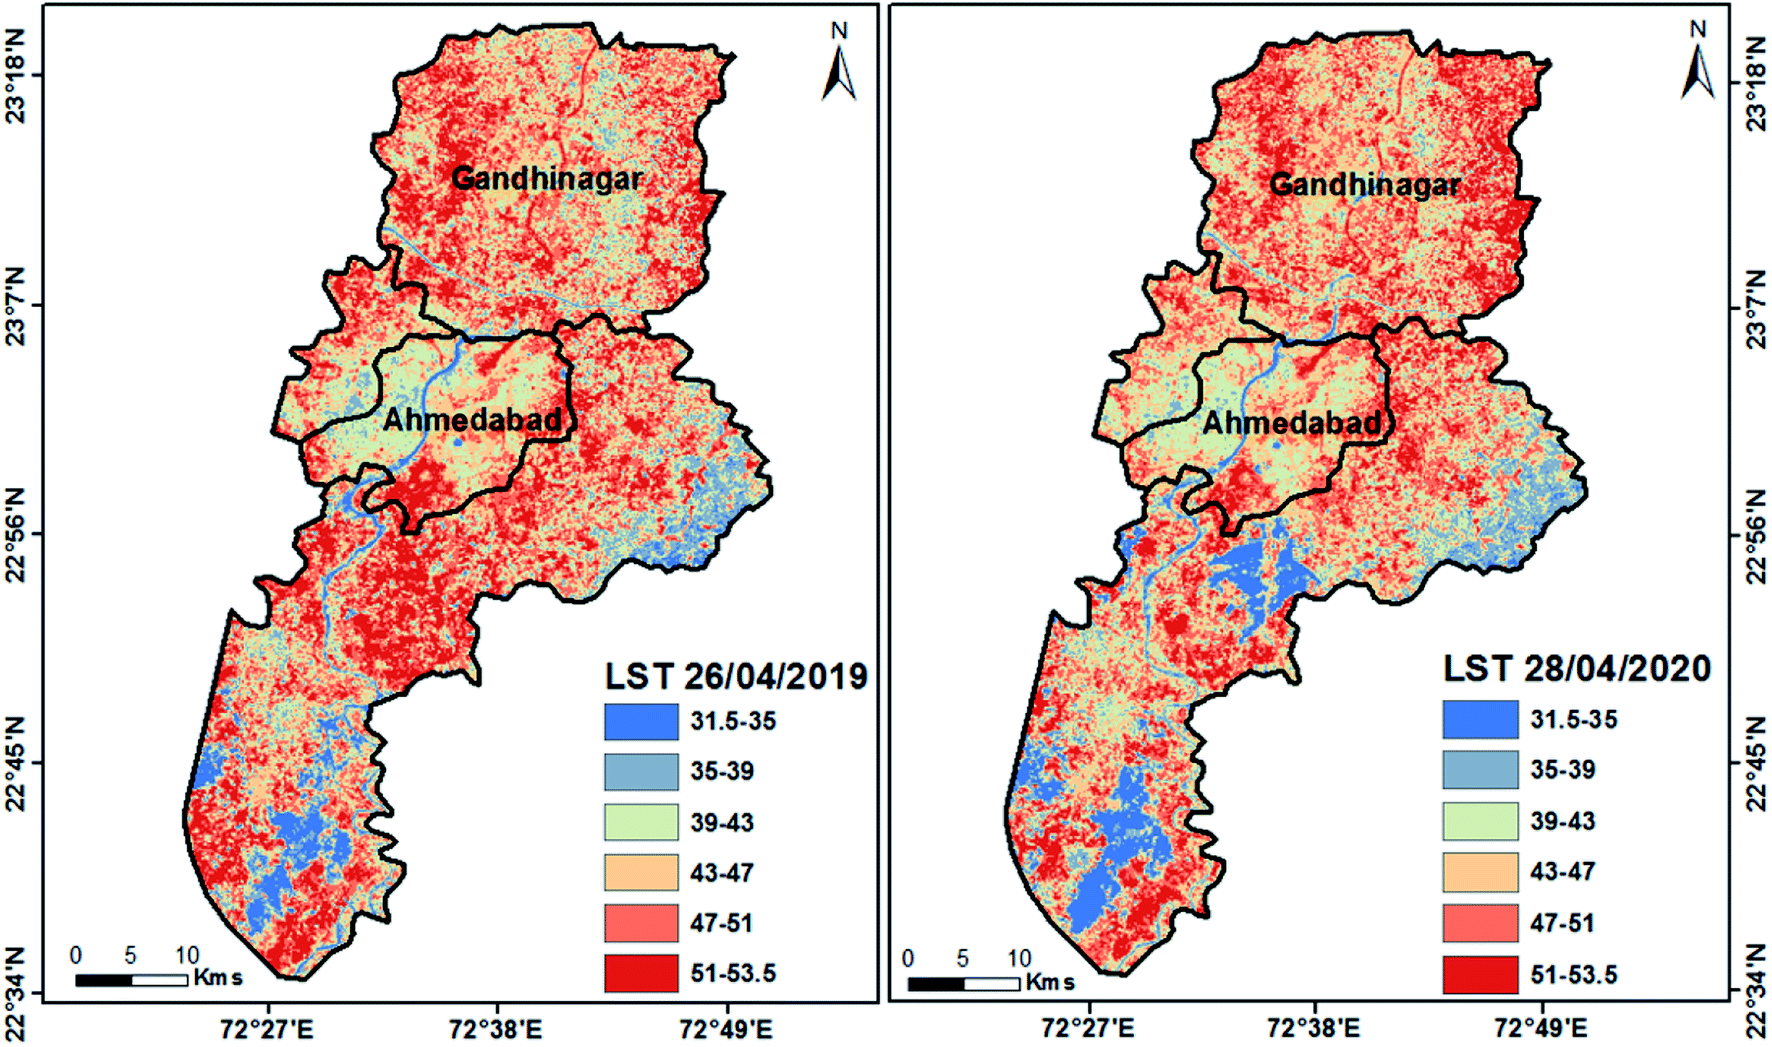 | ||
| Fig. 4 LST comparison for 26th April 2019 28th April 2020 over Ahmedabad. | ||
Ahmedabad is one of the largest inland industrialized cities in the country with a large portion of the industries (pharmaceuticals and chemical). Many of these deemed essential were kept running uninterrupted during the lockdowns even if at minimum production levels.61,62 That could be the reason for no significant changes observed in Ahmedabad. A similar observation was also made for the Hooghly (northern) district and western parts of Kolkata which houses thermal power plants and other industries that remained active during the lockdown.17
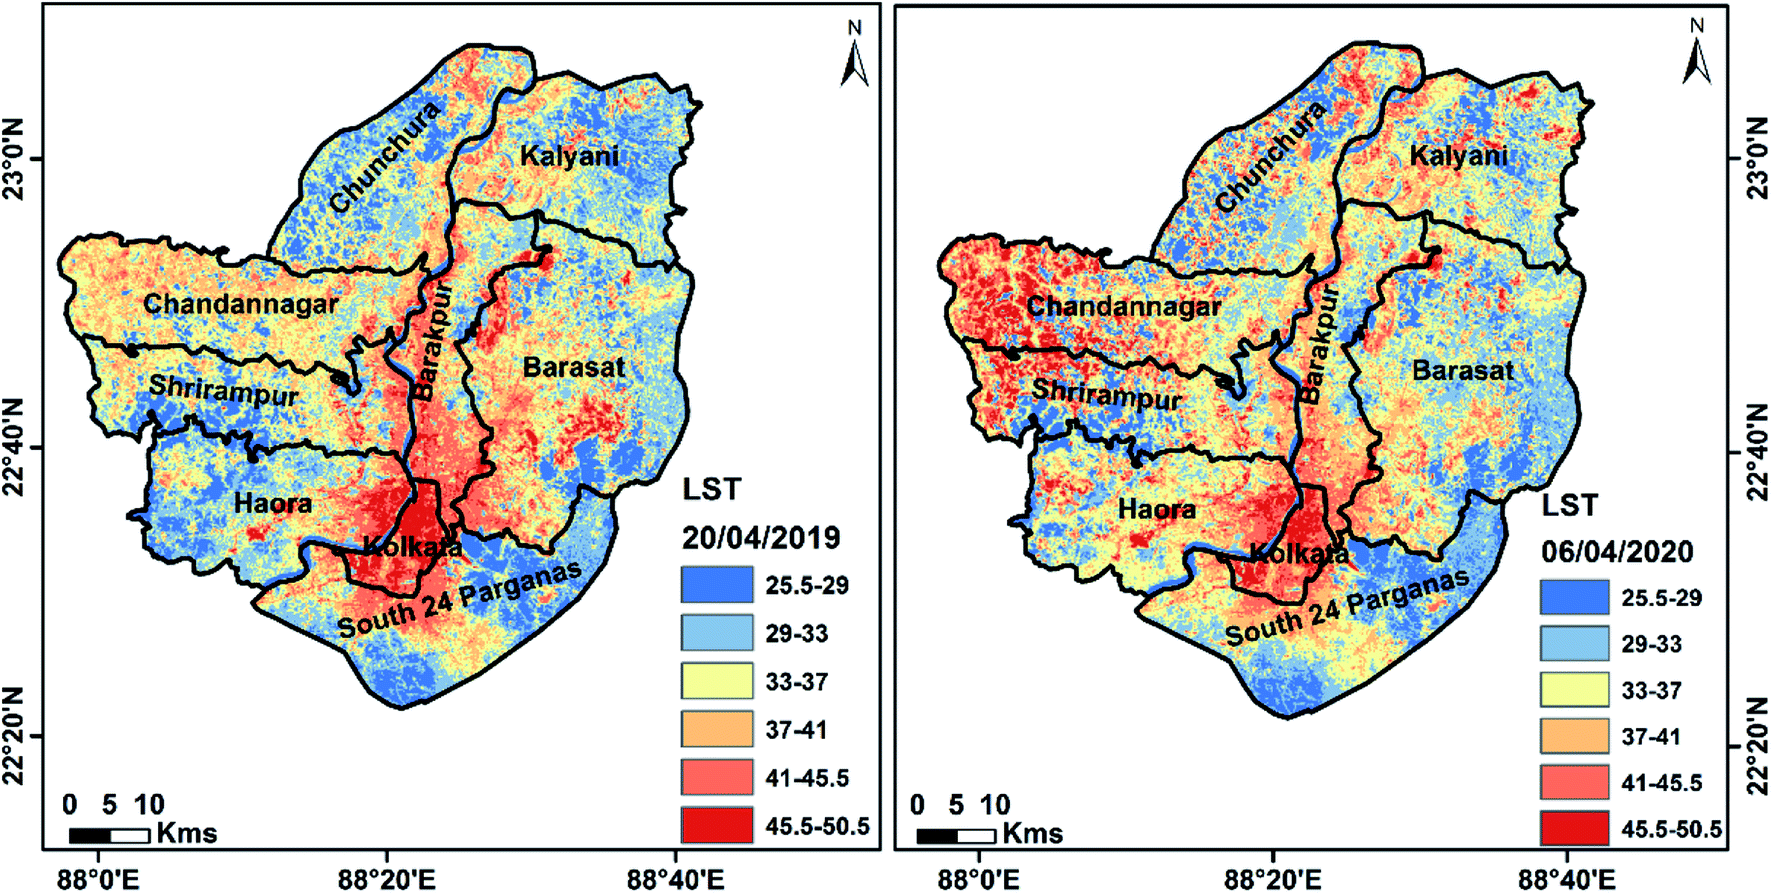 | ||
| Fig. 5 LST comparison for 20th April 2019 and 06th April 2020 over Kolkata. | ||
The Hooghly district, northwest of Kolkata is dominated by agricultural and industrial activities which did not stop during the lockdown, and therefore, the UHI effect was not significantly dampened. The strong control of agricultural and irrigation practices on UHI in India was clearly demonstrated by earlier works.63 Additional evidence emerges from the fact that the neighboring regions on the western and southern sides of the city house a number of thermal power plants which were active even during the lockdown. In fact, the work by Sharma et al.17 showed that while there was a decrease in CO concentration (produced largely from vehicular emissions) over east India coinciding with the lockdowns, there was an increase in some of the other gaseous pollutants in 2020 compared to 2019. Ozone (O3) increased by as much as 77% in 2020 as compared to 2019 and it is well known that chemicals reacting to form O3 originate from oil refining, printing, petrochemicals, aviation, bushfires, and burning off. They further indicated the increased dominance of regional transport compared to local contributions in the cities during the lockdowns.17 LST over this city did not reduce during the lockdown period. Further, Kolkata experienced lower average precipitation in 2020 compared to 2019 and 2018. It was already shown earlier that the UHI, surface types, and evaporation have dominant impacts on vertical ATs and air moisture conditions over Kolkata.39 However, further investigation is necessary to account for the comparative improvement in AQI during the lockdown with respect to its near-anniversary date in 2019 and 2018.
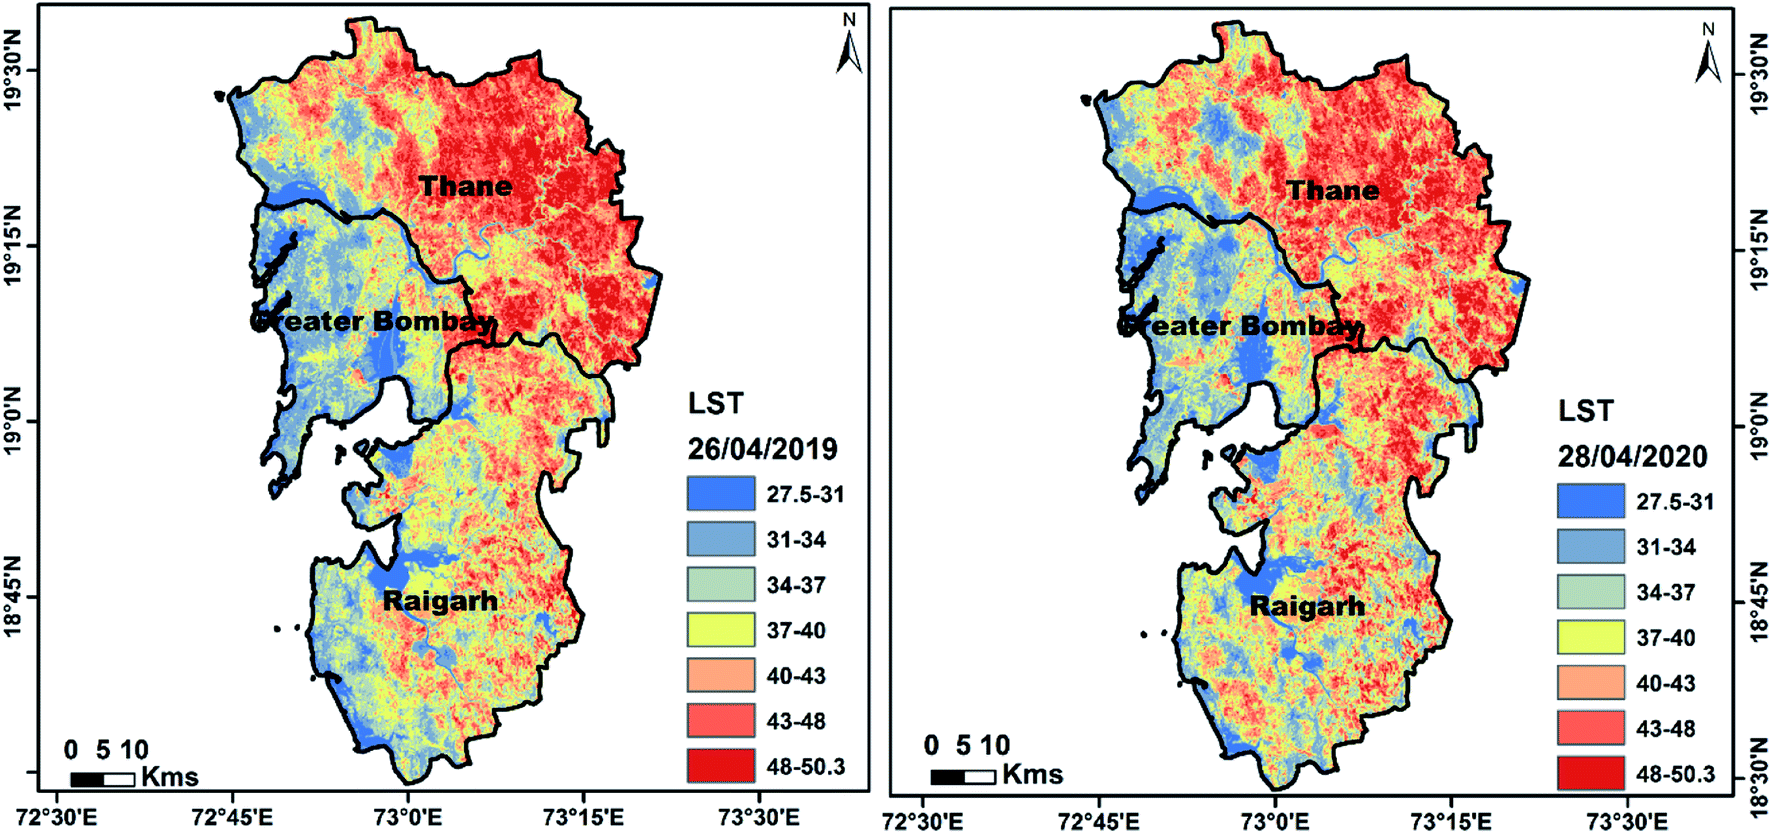 | ||
| Fig. 6 LST comparison for 26th April 2019 and 28th April 2020 over Mumbai. | ||
Mumbai, also the business capital of India is a coastal megacity at an elevation of only 14 m from MSL and most of the city is surrounded by inlets from the Arabian Sea. Hence, the city is primarily influenced by meteorology modulated by the oceans rather than pure terrestrial dynamics. The day of 26th April 2019 experienced precipitation of ∼0.5 mm per day (Table 2) and remained moist compared to 28th April 2020 (lockdown) which experienced rainfall of only 0.01 mm per day, average RH of ∼66% and net radiation of 79.3 W m−2 (all less than the day considered in 2019). However, irrespective of these, the AQI of 53 during the lockdown as against 112 for 2019 indicate the role of lockdowns on air quality as against LST.
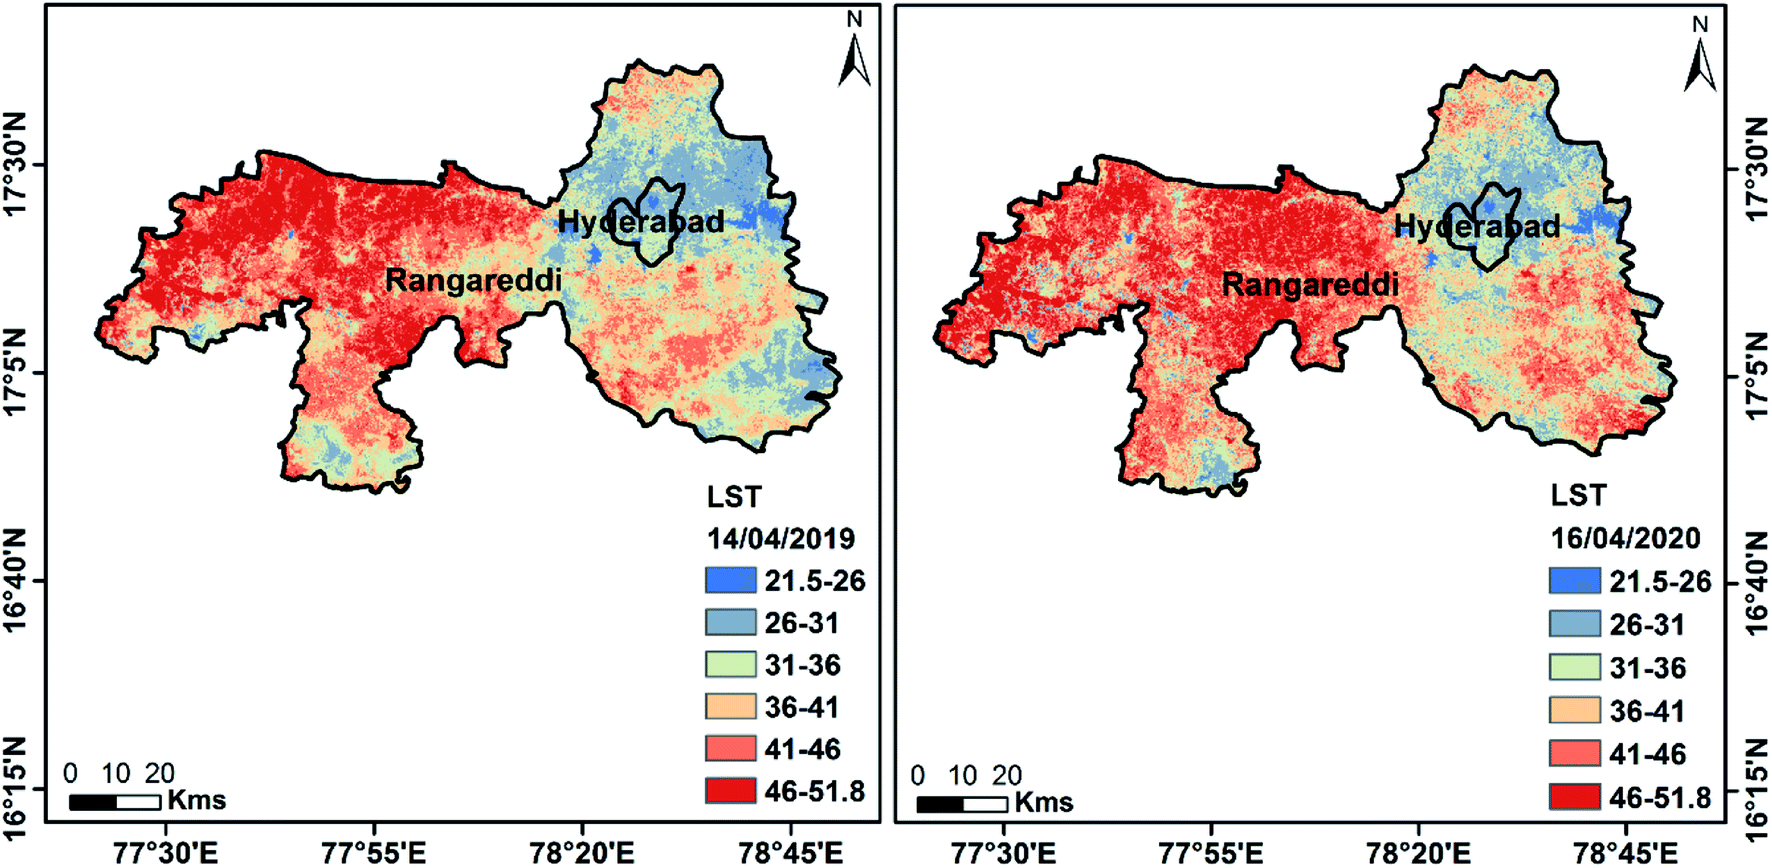 | ||
| Fig. 7 LST comparison for 14th April 2019 and 16th April 2020 over Hyderabad. | ||
The daily averaged meteorological data, precipitation, WS, RH, AT, TOA insolation were comparable except for the net radiation which was higher on 14th April 2019 compared to the lockdown period of 16th April 2020 (Table 2). The absence of any appreciable difference in these parameters for the lockdown period compared to the near-anniversary date in April 2019 indicates that LST changes in the region are predominantly influenced by long term climatological factors rather than short term meteorological changes. The regional meteorology and topography have a significant influence on the thermal characteristics of the already urbanized Hyderabad and its surrounding which has a strong arid climate as also previously observed.64 The months of April–May are the hottest times over this region with an average monthly temperature of around 34 °C. LST variability over Hyderabad is strongly driven by the topography and local meteorology to a large extent even during the lockdowns as compared to effects of pollution. The significance of the contribution of topographic variations to LST variability was also observed by Gogoi et al.57
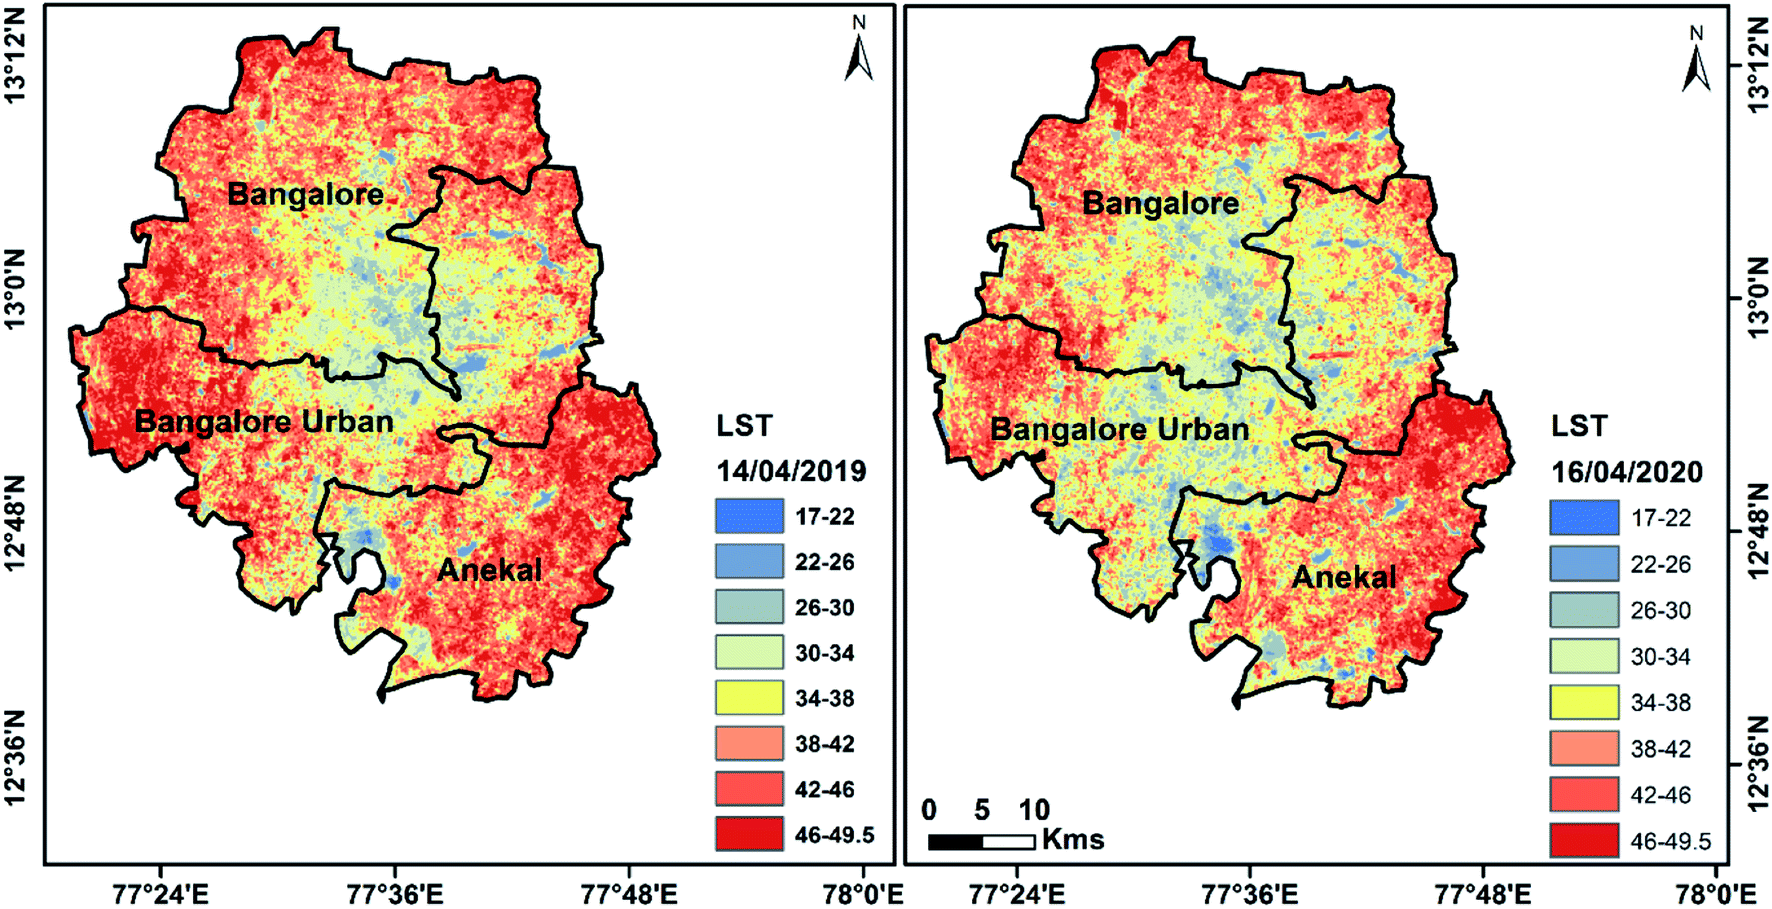 | ||
| Fig. 8 LST comparison for 14th April 2019 and 16th April 2020 over Bengaluru. | ||
The impact of the lockdown on LST is clearly observable in the city center. LST for Bengaluru ranged from 17.74 °C at minimum to a maximum of 39 °C in 2020 (Table 2), with the cooler areas expanding in 2020 by approximately two-fold (Fig. 8). The mean temperature in 2020 dropped by 3 °C compared to 2019, whereas there was no significant difference in minimum (<1 °C) and maximum (<2 °C) LST between 2019 and 2020.
The expansion of cooler pixels in 2020 drove the mean LST down by 3 °C. However, the study area has reported an improvement in air quality also by two-fold during the lockdown (AQI of 52 in 2020 as against 103 in 2019). Though, it is not possible to directly link the variabilities in LST with lockdown in the study region with other meteorological parameters, an improvement in air quality by two-fold (∼50% decrease in AQI as compared 2019 or 2018) and expansion of cooler areas (lower LST) in 2020 as compared to 2019 is an indication of the positive effect of the reduced air pollution on LST (Fig. 2 and 3).
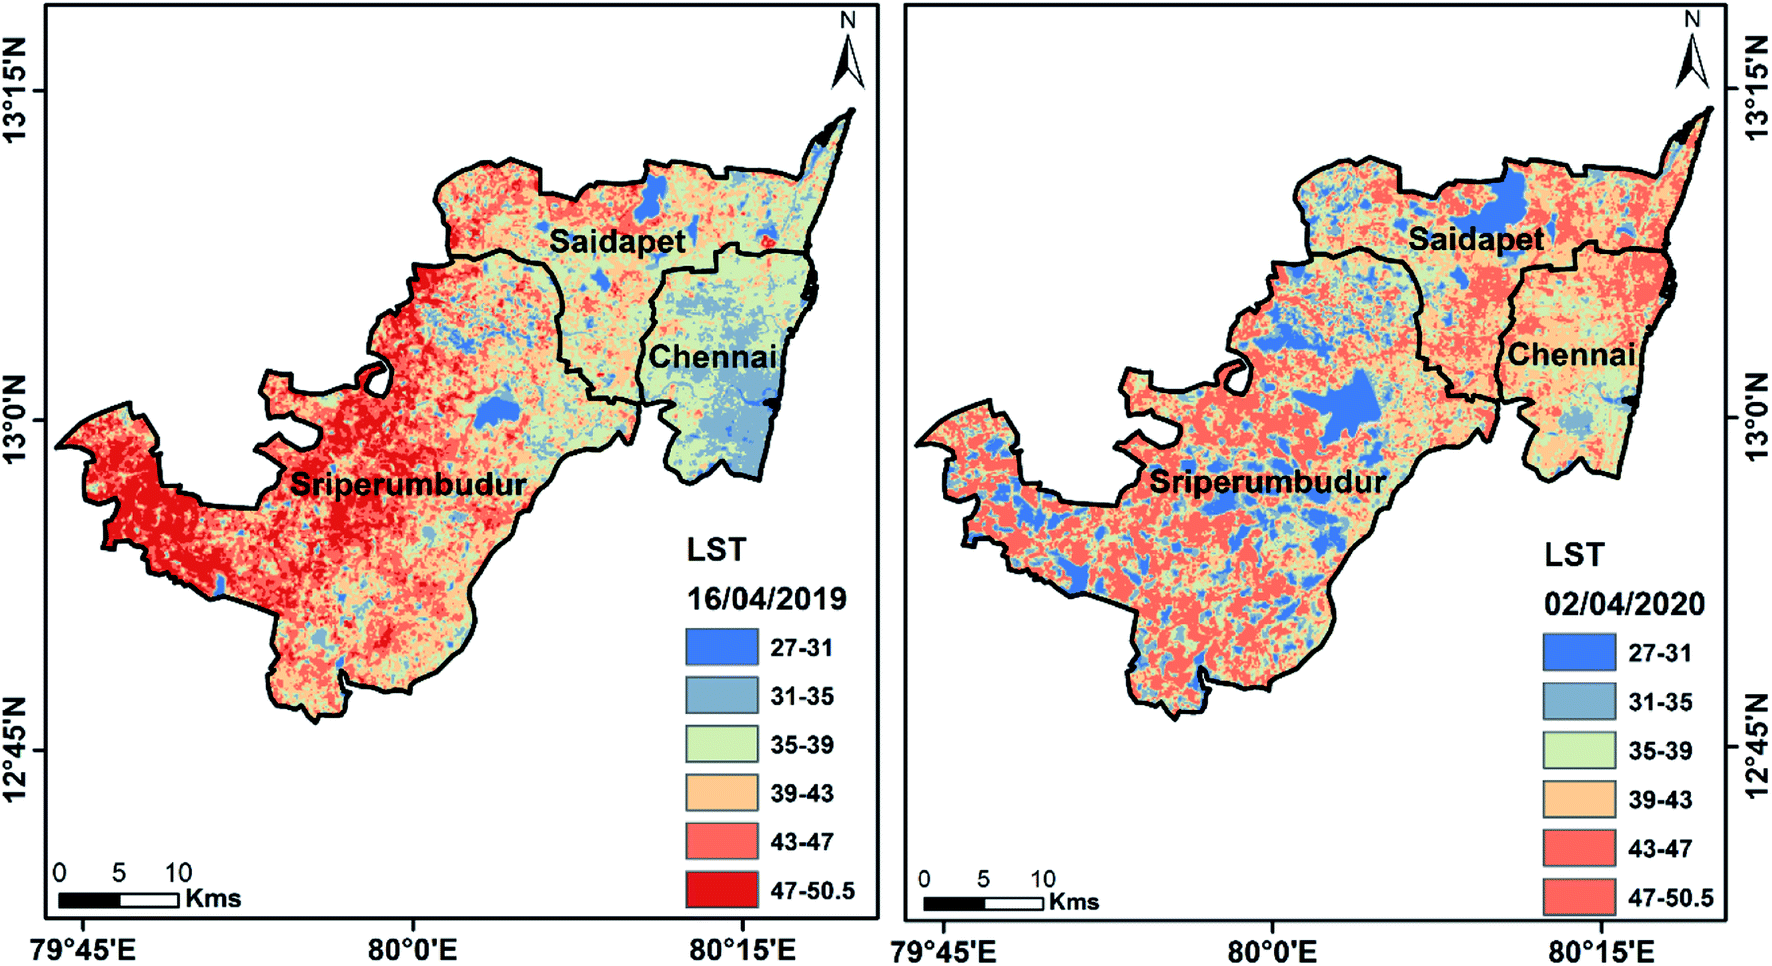 | ||
| Fig. 9 LST comparison for 16th April 2019 and 02nd April 2020 over Chennai. | ||
Sriperumbudur area west of Chennai experienced the largest decline in LST during the lockdown, whereas central Chennai behaved much like Hyderabad showing an increase in LST in 2020. Chennai is the only city that reported a deterioration in air quality during the lockdown compared to the same time in 2019 (from 53 in 2019 to 61 in 2020), but which is not substantial (Table 2). Sharma et al.17 have indicated a decrease in NO, NO2, and O3 during the lockdown period, while a clear increase in CO in southern India.
3.2 Role of uncertainties
Satellite observations and retrievals are subjected to several errors which need to be corrected and compensated. Considering the sensors, one major source of error in Landsat-8 TIRS arises from stray light which affects the absolute accuracy of TIRS bands.50 Even though the products are stray light corrected, it could only be reduced from 2.1 K at 300 K with no stray light correction to 0.3 K with the corrections for band 10. However, he variability of the errors ranged from 0.87 K to 0.52 K at 300 K.50 This can affect the retrieval of LST, if not very significantly. Similarly, the radiometric bias in TIRS band 10 (used in our analysis) and hence bias in temperature derived from this instrument for typical Earth scenes could only be minimized but not eliminated with a current uncertainty of ±1 K for band 10.50 These uncertainties can easily translate to LST retrieval, hence limiting the accuracy of retrieved LST. Additional errors in LST retrieval also arise from the pixel-mixing effect in the estimation of LSE. It has been shown that compared to ground measurements, the retrieved LST errors could range between 0.7 °C to 5 °C with estimation accuracy in some areas showing a difference of ±2 °C with actual ground temperature measurements.48,66,67 Hence, the LSTs retrieved in our case are also limited to the above range of errors compared to actual ground observations.3.3 Efficacy of lockdowns
The anthropogenic heat flux depends on climate, population density, and intensity of industrial and commercial activities and also has seasonal and diurnal scale variabilities.2,68 Differences in topography, meteorological conditions, anthropogenic emissions and boundary layer dynamics strongly control the air quality and their impacts on the larger troposphere.69 In addition, transboundary air pollution from large city clusters is responsible for introducing complex long-range patterns which can seriously deteriorate the air quality over extended regions of hundreds of kilometers. Anthropogenic activities such as transportation, industries, and energy demand have increased in the urban agglomerations in recent years due to population growth and unsustainable urban development. This has led to increasing levels of air pollution subjecting the residents to the health risks associated with harmful pollutants, and imposing heavy economic and social costs.1Analyzing the LST changes in the megacities and its neighbourhoods across India, it could be shown that the COVID-19 induced lockdowns and the associated reduction in anthropogenic activities and pollution were responsible for the improvement in AQI producing large scale variability in LST to a good extent as evident in Fig. 2. In some cities, the LST reduction or variability signal is not prominent which is due to a whole host of reasons such as climatological drivers, geographic setting, less pronounced improvement in air quality, and amount of essential industrial activities, all of which need further investigation. A previous study70 also concluded that restrictions on human and vehicular movements and decreasing economic activities during the COVID-19 lockdowns assisted in minimizing the environmental degradation in four Indian megacities (Delhi, Kolkata, Mumbai and Chennai).
Although, this is a limited study, we conclude that the lockdown measures were indeed responsible for improving air quality, and reducing LST in most cities as evident from the results. Similar findings on positive environmental impacts of lockdowns have been reported from other regions of the world. A quantitative analysis of air pollution in 44 cities in northern China71 had concluded that the reduction of air pollution in these cities was strongly associated with travel restrictions during this pandemic. Human movements restricted to as high as 69.5% by the lockdowns in these 44 cities improved the AQI by decreasing air pollutants which were partially mediated by human mobility.71 Zambrano-Monserrate et al.27 also concluded that there is a significant relationship between contingency measures like lockdowns and improvement in air quality, clean beaches, and environmental noise reduction. Consequently, voluntary implementation of short-term lockdowns could be considered by urban authorities as a viable future option in containing the rapid warming of urban areas and deteriorating air quality. Although the costs of enforcing these preventive measures are undoubtedly enormous as pointed out by an earlier study,15 the measures could considerably improve the quality of the environment which would partially offset the costs of such drastic measures. Even though, such measures do come with negative secondary aspects such as an increase in waste and reduced recycling which further endangers the environment through contamination of water, land, and air, they could unintentionally bring about substantial social benefits.27
3.4 Need for additional supporting data
Our analysis of the Indian megacities and their neighbourhoods hints at the possible impact of reduced anthropogenic activities on air quality and reduction in LST. However, quality-controlled in situ observations of various other terrestrial parameters including weather station observations through a well-distributed network would help delineate and quantify the exact lockdown impact. With the strong heterogeneity of land cover in these cities, the 30 m spatial resolution of Landsat-8 observations is not optimal for characterizing the impervious city surfaces. High-resolution observations from other satellite platforms such as the Sentinel-2A and B (10 m spatial resolution) would improve the accuracy of the analysis. Regional meteorology and topography are significant controllers of the environmental conditions in most of these cities.55 The coastal cities are also strongly influenced by land and sea breeze. Other meteorological phenomena like upper-level circulations, moisture variability, cyclonic activity in the nearby oceans, the mid and lower tropospheric coupling would be critical in modifying the thermodynamics of a region. The LST variabilities in all the megacities below 250 m from MSL except Bengaluru (average elevation of 920 m above MSL) and Hyderabad (average elevation of 536 m above MSL) could be accounted for by their anthropogenic diversity. However, since limited meteorological data sets and that too daily averages are utilized in the present analysis, a better estimate of their role can be made if data sets were exactly concurrent with the satellite overpass times.It must be mentioned here that although in situ observations are the best possible data sets for such analysis, the COVID-19 induced lockdowns had made it impossible to collect field data. Meteorological observations collected through automatic weather stations were also limited being point measurements only or were not adequately quality controlled due to the absence of localized manpower rendering the satellite observations as the only viable alternative under such conditions. In this study, average AQIs from multiple stations (but concurrent with Landsat 8 data acquisition times) spread over the entire city domains are considered instead of single stations to avoid uncertainties that could arise with observations limited to different station locations/surroundings, data sparsity, and time lags. The primary objective of the present work was to ascertain the net influence rather than shorter-term variabilities. The same analysis pattern has been followed for other parameters as well for the sake of uniformity. Nevertheless, a comprehensive analysis of a multitude of data including field observations, weather stations, high-resolution remote sensing observations, aerosol data, and actual vehicular traffic information and domestic fuel consumption estimates during these periods would be ideal in quantifying the exact impact of lockdowns on anthropogenic heat and LST, but for the limitations discussed. The utilization of model and reanalysis data sets also could improve the analysis. Such approaches would go a long way in being able to simulate the existing conditions as well as “what-if” scenarios to assess the impacts of the recent and hence efficacy of future lockdowns in case implemented voluntarily as a part of climate change mitigation measures.
4. Conclusions
We analyzed seven megacities in this study to isolate the impact of lockdown and associated reduction in anthropogenic heating on LST. The geographic, climatic, topography, meteorological, LULC (including vegetation types), soil types, pollution or air quality, and industrial activities (including the proportion of essential to non-essential industries), and local/state policies and regulations vary widely amongst these cities. The microclimates are known to vary significantly within cities and even at neighbourhood scales depending on many such factors.72 These significant contrasts between the study regions necessitate localized temporal analysis of each city rather than an inter-comparison to fulfil our objective.Except for Kolkata, all other cities considered showed an overall trend of LST decline in April 2020 as compared to April 2019 or 2018. However, Kolkata showed an increase in LST in 2020 compared to 2019 and 2018. One reason for this could be the temporal mismatch in the image acquisition dates where the 2018 and 2019 images were acquired a little bit deeper into the summer season compared to the 2020 image, which was acquired at the beginning of the summer season. The relation between meteorological parameters and their influence is rather complex and non-linear depending strongly on the climate and micro-climatic zones. For the city of Kolkata, a low elevation coastal city, Khan and Chatterjee39 had shown that the UHI, surface types, and evaporation have dominant impacts on vertical ATs and air moisture conditions further complicating standard trends. Certain cities like Ahmedabad witnessed an uninterrupted running of industries (pharmaceuticals, chemicals, etc.) which were labelled essential, resulting in hardly any appreciable improvement in AQI owing to the lockdowns. Consequently, the magnitude of LST changes varied widely amongst cities, with southern cities such as Chennai and Hyderabad and north-western Ahmedabad not showing a significant decline, but Delhi exhibiting the sharpest decline of greater than 8 °C in LST and ∼10 °C in AT. The strongest reduction in LST in New Delhi which also experienced the largest improvement in AQI, signifies the linkage between LST and air quality. Based on this limited evidence, it can be theorized that to achieve any significant reduction in LST within a known UHI, the air quality has to be improved by a certain threshold. The threshold may vary from city to city depending on their geographic and climatic settings. Examining the threshold and LST–AQI linkage would be an exciting avenue for future research.
Overall, we conclude that the lockdown played a role in reducing the mean LST of cities but that reduction is not similar in magnitude from city to city. There could be two drivers of this variability in impact between cities. First, improvement in air quality which could have overcompensated the UHI effect as previous studies have demonstrated, and second, the variable volume of activities such as agriculture, industrial, and critical transportation which were deemed essential and exempted from the lockdown in different cities. Additionally, Sharma et al.17 also attribute the improvement of overall air quality in many Indian cities to more dispersion during the pre-monsoon period when this lockdown happened (March–April–May), thus favorable meteorology.
The forced lockdowns in India provided a unique opportunity to study the role of anthropogenic heat generated from urban activities at the peak of the summer in controlling the magnitude and intensity of LST in several metropolitan cities. A more critical analysis of activities that remained operational during the lockdown is needed to justify the variability observed between cities. Also, denser surface AT data are required to understand the small-scale spatial variability in LST in urban centers. In summary, the COVID-19 lockdown not only had a positive impact on air quality but UHI effects as well in the Indian cities. The results would serve as an important input to simulate and quantify the effectiveness of various planned UHI mitigating measures such as alterations to landscapes, reduction of vehicular traffic, and even short-period voluntary lockdowns in controlling anthropogenic heat. Such measures would be of immense value to the rapidly urbanizing Indian and global cities.
Author contributions
DS & DRM conceptualized the work and developed the methodology; data curation and visualisation was carried out by DN & DS, formal analysis, and writing the original draft was by all the authors while reviewing and editing was by DRM and DS. DS was responsible for funding acquisition.Conflicts of interest
There are no conflicts to declare.Acknowledgements
The authors acknowledge all the organizations for the data used in this analysis made freely available through their websites. This work was partially sponsored by SPLICE/DST (Dept. of Science & Technology, Ministry of Science & Technology, Govt. of India) through grant No. DST/CCP/NUC/150/2018(G), dated 04.02.2019. DN was supported by a fellowship under this grant. The authors gratefully acknowledge DST and IIT Bhubaneswar for facilitating the research. The authors thank the editorial board consisting of the handling editors and anonymous reviewers whose comments and suggestions have helped in improving the manuscript substantially.References
- R. Liu and Z. Han, The effects of anthropogenic heat release on urban meteorology and implication for haze pollution in the Beijing–Tianjin–Hebei region, Adv. Meteorol., 2016, 6178308, DOI:10.1155/2016/6178308.
- D. J. Sailor and L. Lu, A top-down methodology for developing diurnal and seasonal anthropogenic heating profiles for urban areas, Atmos. Environ., 2004, 38(17), 2737–2748 CrossRef CAS.
- G. Ulpiani, On the linkage between urban heat island and urban pollution island: three-decade literature review towards a conceptual framework, Sci. Total Environ., 2021, 751, 141727, DOI:10.1016/j.scitotenv.2020.141727.
- P. A. Stott, S. F. B. Tett, G. S. Jones, M. R. Allen, J. F. B. Mitchell and G. J. Jenkins, External control of 20th century temperature by natural and anthropogenic forcings, Science, 2000, 290, 2133–2137 CrossRef CAS.
- G. A. Meehl, J. M. Arblaster and C. Tebaldi, Contributions of natural and anthropogenic forcing to changes in temperature extremes over the United States, Geophys. Res. Lett., 2007, 34, L19709, DOI:10.1029/2007GL030948.
- A. M. Coutts, J. Beringer and N. J. Tapper, Impact of increasing urban density on local climate: spatial and temporal variations in the surface energy balance in Melbourne, Australia, J. Appl. Meteorol. Climatol., 2007, 46, 477–493, DOI:10.1175/JAM2462.1.
- M. Roth, Review of urban climate research in (sub) tropical regions, Int. J. Climatol., 2007, 27, 1859–1873, DOI:10.1002/joc.1591.
- M. A. Hart and D. J. Sailor, Quantifying the influence of land-use and surface characteristics on spatial variability in the urban heat island, Theor. Appl. Climatol., 2009, 95, 397–406, DOI:10.1007/s00704-008-0017-5.
- A. Middel, A. J. Brazel, P. Gober, S. W. Myint, H. Chang and J. Duh, Land cover, climate, and the summer surface energy balance in Phoenix, AZ, and Portland, OR, Int. J. Climatol., 2012, 32(13), 2020–2032, DOI:10.1002/joc.2408.
- S. D. Chakraborty, Y. Kant and D. Mitra, Assessment of land surface temperature and heat fluxes over Delhi using remote sensing data, J. Environ. Manage., 2015, 148, 143–152, DOI:10.1016/j.jenvman.2013.11.034.
- S. Raj, S. K. Paul, A. Chakraborty and J. Kuttippurath, Anthropogenic forcing exacerbating the urban heat islands in India, J. Environ. Manage., 2020, 257, 110006 CrossRef.
- A. K. Srivastava, J. Voogt, S. R. Kshirsagar and K. Srivastava, Heat islands over Mumbai as revealed by autorecorded thermograph data, J. Earth Syst. Sci., 2016, 125(1), 85–93 CrossRef.
- B. Anasuya, D. Swain and V. Vinoj, Rapid urbanization and associated impacts on land surface temperature changes over Bhubaneswar urban district, India, Environ. Monit. Assess., 2019, 191, 790, DOI:10.1007/s10661-019-7699-2.
- D. Swain, G. J. Roberts, J. Dash, K. Lekshmi, V. Vinoj and S. Tripathy, Impact of rapid urbanization on the city of Bhubaneswar, India, Proc. Natl. Acad. Sci., India, Sect. A, 2017, 87(4), 845–853, DOI:10.1007/s40010-017-0453-7.
- G. He, Y. Pan and T. Tanaka, The short-term impacts of COVID-19 lockdown on urban air pollution in China, Nat. Sustain., 2020, 3, 1005–1011, DOI:10.1038/s41893-020-0581-y.
- D. R. Mishra, A. Kumar, P. Muduli, Sk. Md. Equeenuddin, G. Rastogi, T. Acharyya and D. Swain, COVID-19 Lockdown highlights the role of urban-borne nutrients in Indian coastal zones, Remote Sens., 2020, 12(16), 2584, DOI:10.3390/rs12162584.
- S. Sharma, M. Zhang, Anshika, J. Gao, H. Zhang and S. H. Kota, Effect of restricted emissions during COVID-19 on air quality in India, Sci. Total Environ., 2020, 728, 138878, DOI:10.1016/j.scitotenv.2020.138878.
- V. Vinoj and D. Swain, Did COVID-19 lockdown brew “Amphan” into a super cyclone?, Preprints, 2020, 2020070033, DOI:10.20944/preprints202007.0033.v1.
- A. P. Yunus, Y. Masago and Y. Hijioka, COVID-19 and surface water quality: Improved 540 lake water quality during the lockdown, Sci. Total Environ., 2020, 731, 139012, DOI:10.1016/j.scitotenv.2020.139012.
- B. R. Gurjar, K. Ravindra and A. S. Nagpure, Air pollution trends over Indian megacities and their local-to-global implications, Atmos. Environ., 2016, 142, 475–495 CrossRef CAS.
- S. K. Guttikunda, K. A. Nishadh and P. Jawahar, Air pollution knowledge assessments (APnA) for 20 Indian cities, Urban Clim., 2019, 27, 124–141 CrossRef.
- J. Singh, Paddy and wheat stubble blazing in Haryana and Punjab states of India: a menace for environmental health, Environ. Qual. Manag., 2018, 28(1), 47–53 CrossRef.
- Z. A. Chafe, M. Brauer, Z. Klimont, R. Van Dingenen, S. Mehta, S. Rao, K. Riahi, F. Dentener and K. R. Smith, Household cooking with solid fuels contributes to ambient PM2.5 Air pollution and the burden of disease, Environ. Health Perspect., 2014, 122, 1314–1320, DOI:10.1289/ehp.1206340.
- J. Lelieveld, J. S. Evans, M. Fnais, D. Giannadaki and A. Pozzer, The contribution of outdoor air pollution sources to premature mortality on a global scale, Nature, 2015, 525, 367–371, DOI:10.1038/nature15371.
- M. Sharma and O. Dikshit, Comprehensive study on air pollution and greenhouse gases (GHGs) in Delhi, Report submitted to Government of NCT Delhi and DPCC Delhi, Delhi, 2016, pp. 289 Search PubMed.
- P. Shahmohamadi, A. I. Che-Ani, K. N. A. Maulud, N. M. Tawil and N. A. G. Abdullah, The Impact of Anthropogenic Heat on Formation of Urban Heat Island and Energy Consumption Balance, Urban Studies Research, 2011, 497524, DOI:10.1155/2011/497524.
- M. A. Zambrano-Monserrate, M. A. Ruanob and L. Sanchez-Alcalde, Indirect effects of COVID-19 on the environment, Sci. Total Environ., 2020, 728, 138813, DOI:10.1016/j.scitotenv.2020.138813.
- S. Gautam, The Influence of COVID-19 on Air Quality in India: A Boon or Inutile, Bull. Environ. Contam. Toxicol., 2020, 104, 724–726, DOI:10.1007/s00128-020-02877-y.
- K. D. Kanniah, N. A. F. K. Zaman, D. G. Kaskaoutis and M. T. Latif, COVID-19's impact on the atmospheric environment in the Southeast Asia region, Sci. Total Environ., 2020, 736, 1–11, DOI:10.1016/j.scitotenv.2020.139658.
- X. L. Chen, H. M. Zhao, P. X. Li and Z. Y. Yin, Remote sensing image-based analysis of the relationship between urban heat island and land use/cover changes, Remote Sens. Environ., 2006, 104, 133–146 CrossRef.
- C. J. Tomlinson, L. Chapman, J. E. Thornes and C. Baker, Remote sensing land surface temperature for meteorology and climatology: a review, Meteorol. Appl., 2011, 18, 296–306, DOI: .
- C. B. Karakuş, The impact of Land Use/Land Cover (LULC) changes on Land Surface Temperature in Sivas city center and its surroundings and assessment of Urban Heat Island, Asia-Pac. J. Atmos. Sci., 2019, 55, 669–684, DOI:10.1007/s13143-019-00109-w.
- R. Wang, H. Hou, Y. Murayama and A. Derdouri, Spatiotemporal analysis of Land Use/Cover patterns and their relationship with Land Surface Temperature in Nanjing, China, Remote Sens., 2020, 12, 1–17, DOI:10.3390/rs12030440.
- M. Mohan, A. Kandya and A. Battiprolu, Urban Heat Island Effect over National Capital Region of India: A Study using the Temperature Trends, J. Environ. Prot., 2011, 2, 465–472, DOI:10.4236/jep.2011.24054.
- IOM, World Migration Report 2015: Migrants and Cities – New Partnerships to Manage Mobility, UN, New York, 2015, pp. 225, DOI:10.18356/be2a2be6-en.
- M. D. Devadas and A. L. Rose, Urban factors and the intensity of heat island in the city of Chennai, presented in part at the 7th International Conference on Urban Climate, Yokohama, Japan, June-July, 2009 Search PubMed.
- S. Ambinakudige, Remote sensing of land cover's effect on surface temperatures: a case study of the urban heat island in Bangalore, India, Appl. GIS, 2011, 7, 1–12 Search PubMed.
- S. D. Chakraborty, Y. Kant and D. Mitra, Assessment of land surface temperature and heat fluxes over Delhi using remote sensing data, J. Environ. Manage., 2015, 148, 143–152 CrossRef.
- A. Khan and S. Chatterjee, Numerical simulation of urban heat island intensity under urban–suburban surface and reference site in Kolkata, India, Model. Earth Syst. Environ., 2016, 2, 2–11 CrossRef.
- S. Sannigrahi, S. Rahmat, S. Chakraborti, S. Bhatt and S. Jha, Changing dynamics of urban biophysical composition and its impact on urban heat island intensity and thermal characteristics: the case of Hyderabad City, India, Model. Earth Syst. Environ., 2017, 3, 647–667, DOI:10.1007/s40808-017-0324-x.
- P. Mohammad, A. Goswami and S. Bonafoni, The Impact of the Land Cover Dynamics on Surface Urban Heat Island variations in semi-arid cities: a case study in Ahmedabad city, India, using multi-sensor/source data, Sensors, 2019, 19, 1–20, DOI:10.3390/s19173701.
- H. S. Sussman, A. Raghavendra and L. Zhou, Impacts of increased urbanization on surface temperature, vegetation, and aerosols over Bengaluru, India, Remote Sensing Applications: Society and Environment, 2019, 16, 100261, DOI:10.1016/j.rsase.2019.100261.
- USGS Earth Explorer, https://earthexplorer.usgs.gov, accessed July 2020.
- NASA-POWER, https://power.larc.nasa.gov, accessed July 2020.
- NEO, https://neo.sci.gsfc.nasa.gov, accessed July 2020.
- CPCB-MoEF&CC, https://app.cpcbccr.com/AQI_India, accessed July 2020.
- F. Wang, Z. Qin, C. Song, L. Tu, A. Karnieli and S. Zhao, An improved mono-window algorithm for land surface temperature retrieval from Landsat 8 thermal infrared sensor data, Remote Sens., 2015, 7, 4268–4289 CrossRef.
- G. Rongali, A. K. Keshari, A. Gosain and R. Khosa, A Mono-Window Algorithm for Land Surface Temperature Estimation from Landsat 8 Thermal Infrared Sensor Data: A Case Study of the Beas River Basin, India, Pertanika J. Sci. Technol., 2018, 26, 829–840 Search PubMed.
- Landsat Missions, https://www.usgs.gov/land-resources/nli/landsat/landsat-8-oli-and-tirs-calibration-notices, accessed July 2020 Search PubMed.
- USGS, Landsat 8 (L8) Data Users Handbook, ver. 5.0, Department of the Interior U.S. Geological Survey, LSDS-1574, South Dakota, November 2019, pp. 106, https://www.usgs.gov/media/files/landsat-8-data-users-handbook, accessed July 2020 Search PubMed.
- H. D. Bendib and M. I. Kalla, Contribution of Landsat 8 data for the estimation of land surface temperature in Batna city, Eastern Algeria, Geocarto Int., 2017, 32, 503–513, DOI:10.1080/10106049.2016.1156167.
- J. C. Jimenez-Munoz, J. A. Sobrino, A. Gillespie, D. Sabol and W. T. Gustafson, Improved land surface emissivities over agricultural areas using ASTER NDVI, Remote Sens. Environ., 2006, 103, 474–487, DOI:10.1016/j.rse.2006.04.012.
- T. N. Carlson and D. A. Ripley, On the relation between NDVI, fractional vegetation cover, and leaf area index, Remote Sens. Environ., 1997, 62, 241–252, DOI:10.1016/S0034-4257(97)00104-1.
- J. A. Sobrino, J. C. Jiménez-Muñoz and L. Paolini, Land surface temperature retrieval from Landsat TM 5, Remote Sens. Environ., 2004, 90, 434–440, DOI:10.1016/j.rse.2004.02.003.
- M. Stathopoulou and C. Cartalis, Daytime urban heat islands from Landsat ETM+ and Corine land cover data: an application to major cities in Greece, Sol. Energy, 2007, 81, 358–368, DOI:10.1016/j.solener.2006.06.014.
- L. Yang, Y. Cao, X. Zhu, S. Zeng, G. Yang, J. He and X. Yang, Land surface temperature retrieval for arid regions based on Landsat-8 TIRS data: a case study in Shihezi, Northwest China, J. Arid Land, 2014, 6, 704–716, DOI:10.1007/s40333-014-0071-z.
- P. P. Gogoi, V. Vinoj, D. Swain, G. Roberts, J. Dash and S. Tripathy, Land use and land cover change effect on surface temperature over eastern India, Sci. Rep., 2019, 9, 1–10, DOI:10.1038/s41598-019-45213-z.
- Y. Yin, N. Hashemi, A. Grundstein, D. R. Mishra, L. Ramaswamy and J. Dowd, Urban ambient air temperature estimation using hyperlocal data from smart vehicle-borne sensors, Comput. Environ. Urban Syst., 2020, 84, 101538, DOI:10.1016/j.compenvurbsys.2020.101538.
- S. K. Pandey and V. Vinoj, Surprising increase in aerosol amid widespread decline in pollution over India during the COVID19 lockdown, EarthArXiv, 2020, 1–29, DOI:10.31223/osf.io/5kmx2.
- M. P. Byrne and P. A. O'Gorman, Trends in continental temperature and humidity directly linked to ocean warming, Proc. Natl. Acad. Sci. U. S. A., 2018, 115(19), 4863–4868, DOI:10.1073/pnas.1722312115.
- https://www.thehindu.com/news/national/coronavirus-lockdown-some-industries-have-begun-operations-in-sanand-gujarat-mha/article31455275.ece, accessed October 2020.
- https://www.business-standard.com/article/companies/industry-in-ahmedabad-face-first-day-jitters-of-complete-lockdown-120050701398_1.html, accessed October 2020.
- R. Kumar, V. Mishra, J. Buzan, R. Kumar, D. Shindell and M. Huber, Dominant control of agriculture and irrigation on urban heat island in India, Sci. Rep., 2017, 7, 1–10, DOI:10.1038/s41598-017-14213-2.
- S. K. Kharol, D. G. Kaskaoutis, A. R. Sharma and R. P. Singh, Long-Term (1951–2007) Rainfall Trends around Six Indian Cities: Current State, Meteorological, and Urban Dynamics, Adv. Meteorol., 2013, 572954, DOI:10.1155/2013/572954.
- S. Khare, S. Siber, S. P. Singh and S. S. Amir, A review and examination of Urban Heat Island UHI in urban cities Delhi, Ahmedabad, Bangalore in India utilizing Landsat 8 and MODIS, Int. Res. J. Eng. Technol., 2020, 7, 1317–1324 Search PubMed.
- P. Srivastava, T. J. Majumdar and A. K. Bhattacharya, Surface temperature estimation in Singhbhum shear zone of India using Landsat-7 ETM+ thermal infrared data, Adv. Space Res., 2009, 43, 1563–1574 CrossRef CAS.
- Z. L. Li, B. H. Tang, H. Wu, H. Ren, G. Yan, Z. Wan, H. Ren, G. Yan, Z. Wan, I. F. Trigo and A. J. Sobrino, Satellite-derived land surface temperature: Current status and perspectives, Remote Sens. Environ., 2013, 131, 14–37 CrossRef.
- H. Fan and D. J. Sailor, Modeling the impacts of anthropogenic heating on the urban climate of Philadelphia: a comparison of implementations in two PBL schemes, Atmos. Environ., 2009, 39(1), 73–84 CrossRef.
- A. J. Haagen-Smit, Chemistry and Physiology of Los Angeles Smog, Ind. Eng. Chem., 1952, 44(6), 1342–1246, DOI:10.1021/ie50510a045.
- S. Ghosh, A. Das, T. K. Hembram, S. Saha, B. Pradhan and A. M. Alamri, Impact of COVID-19 induced lockdown on environmental quality in four Indian megacities using Landsat 8 OLI and TIRS-derived data and mamdani fuzzy logic modelling approach, Sustainability, 2020, 12(13), 5464, DOI:10.3390/su12135464.
- R. Bao and A. Zhang, Does lockdown reduce air pollution? Evidence from 44 cities in northern China, Sci. Total Environ., 2020, 731, 1–12, DOI:10.1016/j.scitotenv.2020.139052.
- S. J. Hall, J. Learned, B. Ruddell, K. L. Larson, J. Cavender-Bares, N. Bettez, P. M. Groffman, J. M. Grove, J. B. Heffernan, S. E. Hobbie, J. L. Morse, C. Neill, K. C. Nelson, J. P. M. O'Neil-Dunne, L. Ogden, D. E. Pataki, W. D. Pearse, P. C. Polsky, R. Roy Chowdhury, M. K. Steele and T. L. E. Trammell, Convergence of microclimate in residential landscapes across diverse cities in the United States, Landsc. Ecol., 2016, 31, 101–117, DOI:10.1007/s10980-015-0297-y.
| This journal is © The Royal Society of Chemistry 2021 |