
Femtosecond photodecarbonylation of photo-ODIBO studied by stimulated Raman spectroscopy and density functional theory†
Learnmore
Shenje
a,
Yingqi
Qu
a,
Vladimir
Popik
 b and
Susanne
Ullrich
*a
b and
Susanne
Ullrich
*a
aDepartment of Physics and Astronomy, University of Georgia, Athens, Georgia 30602, USA. E-mail: ullrich@uga.edu
bDepartment of Chemistry, University of Georgia, Athens, Georgia 30602, USA
First published on 16th November 2021
Abstract
Photo-oxa-dibenzocyclooctyne (Photo-ODIBO) undergoes photodecarbonylation under UV excitation to its bright S2 state, forming a highly reactive cyclooctyne, ODIBO. Following 321 nm excitation with sub-50 fs actinic pulses, the excited state evolution and cyclopropenone bond cleavage with CO release were characterized using femtosecond stimulated Raman spectroscopy and time-dependent density functional theory Raman calculations. Analysis of the photo-ODIBO S2 C![[double bond, length as m-dash]](https://www.rsc.org/images/entities/char_e001.gif) O Raman band revealed multi-exponential intensity, peak splitting and frequency-shift dynamics. This suggests a stepwise cleavage of the two C–C bonds in the cyclopropenone structure that is completed within <300 fs after excitation. Evidence of intramolecular vibrational relaxation on the S2 state, concurrent with photodecarbonylation, with dynamics matching previous electronic transient absorption spectroscopy, was also observed. This confirms an excited state, as opposed to ground state, photodecarbonylation mechanism resulting in a vibronically excited photoproduct, ODIBO.
O Raman band revealed multi-exponential intensity, peak splitting and frequency-shift dynamics. This suggests a stepwise cleavage of the two C–C bonds in the cyclopropenone structure that is completed within <300 fs after excitation. Evidence of intramolecular vibrational relaxation on the S2 state, concurrent with photodecarbonylation, with dynamics matching previous electronic transient absorption spectroscopy, was also observed. This confirms an excited state, as opposed to ground state, photodecarbonylation mechanism resulting in a vibronically excited photoproduct, ODIBO.
Introduction
Reactions employed for dynamic in vivo bioimaging must meet two main requirements. (1) They must be fast compared to time-scales for cellular processes, and (2) they must not be harmful to the cells, i.e., they must be selective towards the target and not the surrounding environment.1–3 An ideal component for such reactions is the azide group, chiefly because of its small size and bioorthogonality, i.e., non-reactivity towards cellular biological functionalities.2 As such, azide–alkyne cycloadditions resulting in triazoles are at the forefront of biorthogonal reactions, often referred to as “the cream of the crop” of click chemistry.4 The reaction of terminal acetylenes with azides, however, requires Cu(I) catalysis, but the use of copper catalysts violates requirement (2) due to its toxicity.1,5 The recently developed strain-promoted azide–alkyne cycloaddition (SPAAC) offers a biocompatible version of the click-reactions as it doesn’t require any catalysts. In light-activated SPAAC reagents, an added benefit is the ability to enable direct control of the reaction with light activation through photodecarbonylation from cyclopropenones leading to spatiotemporal in situ protein and cell labeling.6,7One-photon and multiphoton photodecarbonylation of photo-ODIBO have been demonstrated to produce the cycloalkyne ODIBO efficiently (see Scheme 1). Furthermore, while photo-ODIBO does not react with organic azides or endogenous nucleophiles, the photoconversion product, ODIBO, is highly reactive towards azides. As such, photo-ODIBO is a promising reagent for applications as described above. Further optimization of cycloaddition reaction rates consequently relies on accelerating ODIBO photogeneration which is paramount to the overall reaction kinetics.
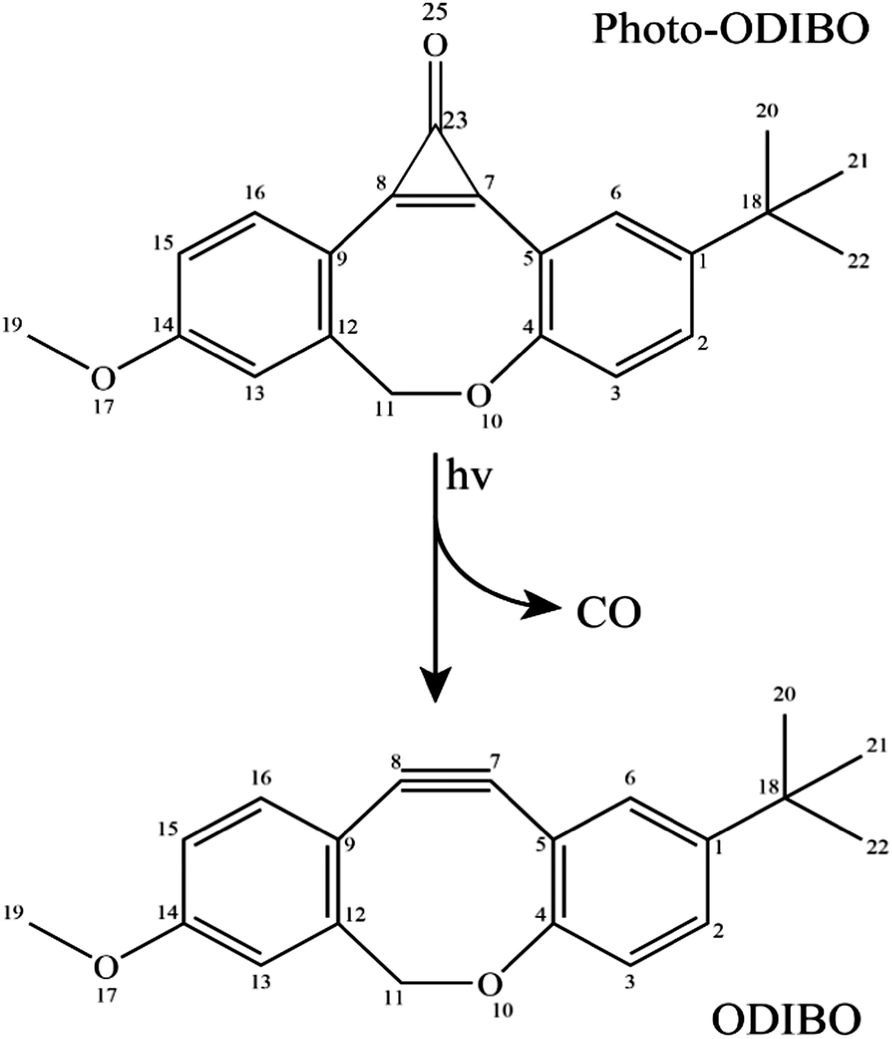 | ||
| Scheme 1 Reaction scheme for photo-ODIBO photodecarbonylation under UV excitation. | ||
Mechanistic studies on the photoconversion of cyclopropenones have primarily focused on electronic absorption spectroscopy supported by theory. However, the broad and overlapping electronic absorption bands of these molecules and ultrafast kinetics render it challenging to resolve the dynamics of cycloalkyne formation fully.3,8,9 Previously, Transient Absorption Spectroscopy (TAS) studies were undertaken to elucidate the photodecarbonylation mechanism. This study revealed that ODIBO formation under 321 nm illumination of photo-ODIBO occurs within less than 294 fs, consistent with the time-scale of an excited state, as opposed to ground state, dissociation process.10 The derived model concurs that the photoexcited S2 state, which is bright in absorption due to its ππ* character, undergoes intramolecular vibrational relaxation to the state minimum concurrent with CO release and formation of the ODIBO product in its lowest excited ππ* state, S1. The quantum yield for photodecarbonylation amounts to approximately 14%. On picosecond and longer time-scales the unconverted photo-ODIBO and newly formed ODIBO subsequently undergo internal conversion and intersystem crossing back to their electronic ground states. The same TAS study revealed an entirely different mechanism following 350 nm photoexcitation. In this case photodecarbonylation and product formation occur on the ground state, via an intermediate and on much longer, nanosecond timescales. This latter pathway resembles the mechanisms reported for related cyclopropenone containing molecular systems. The initial photoinduced ring-opening step results from C–C bond cleavage according to Norrish type I photochemistry and subsequent ground state photodecarbonylation mediated either by a singlet or triplet intermediate.11–13
Femtosecond Stimulated Raman Spectroscopy (FSRS) provides a new avenue for acquiring a deeper insight into the ultrafast photodecarbonylation processes. This technique combines high temporal resolution with superior spectral resolution by using a third, narrowband (0.8 nm) Raman pump beam, in addition to the pump and probe beams used in conventional TAS. This combination allows for the revelation of photochemical reaction dynamics from a vibrational motion perspective.14,15 Utilizing FSRS for direct observation of reaction product formation and molecular dissociation dynamics has also been the subject of numerous studies in the literature because of the exceptional sensitivity and tunability.16–18 With this powerful technique, excited-state vibrational Raman signatures can be monitored with a similar time resolution compared to electronic absorption. Consequently, FSRS data allows the structural evolution (bond cleavage) to be observed with femtosecond resolution, thereby providing valuable and unambiguous insights into reaction kinetics.16,18–21 Cyclopropenones have a three-membered carbon ring structure with an underlying CC double bond, with the third carbon bonded to an oxygen atom (carbonyl group). The release of the carbonyl group during decarbonylation results in a C![[triple bond, length as m-dash]](https://www.rsc.org/images/entities/char_e002.gif) C triple bond, signifying a dramatic change in the molecular structure. Monitoring the Raman active conjugated CC and CO bonds of photo-ODIBO, specifically the –C7C8–C23 three-membered ring (see Fig. 1) stretching modes can offer valuable information about the molecular structural evolution leading to CO release with greater spectral resolution than conventional TAS.22 At the same time, the appearance dynamics of the CC triple bond stretch elucidates on the ODIBO formation mechanism.
C triple bond, signifying a dramatic change in the molecular structure. Monitoring the Raman active conjugated CC and CO bonds of photo-ODIBO, specifically the –C7C8–C23 three-membered ring (see Fig. 1) stretching modes can offer valuable information about the molecular structural evolution leading to CO release with greater spectral resolution than conventional TAS.22 At the same time, the appearance dynamics of the CC triple bond stretch elucidates on the ODIBO formation mechanism.
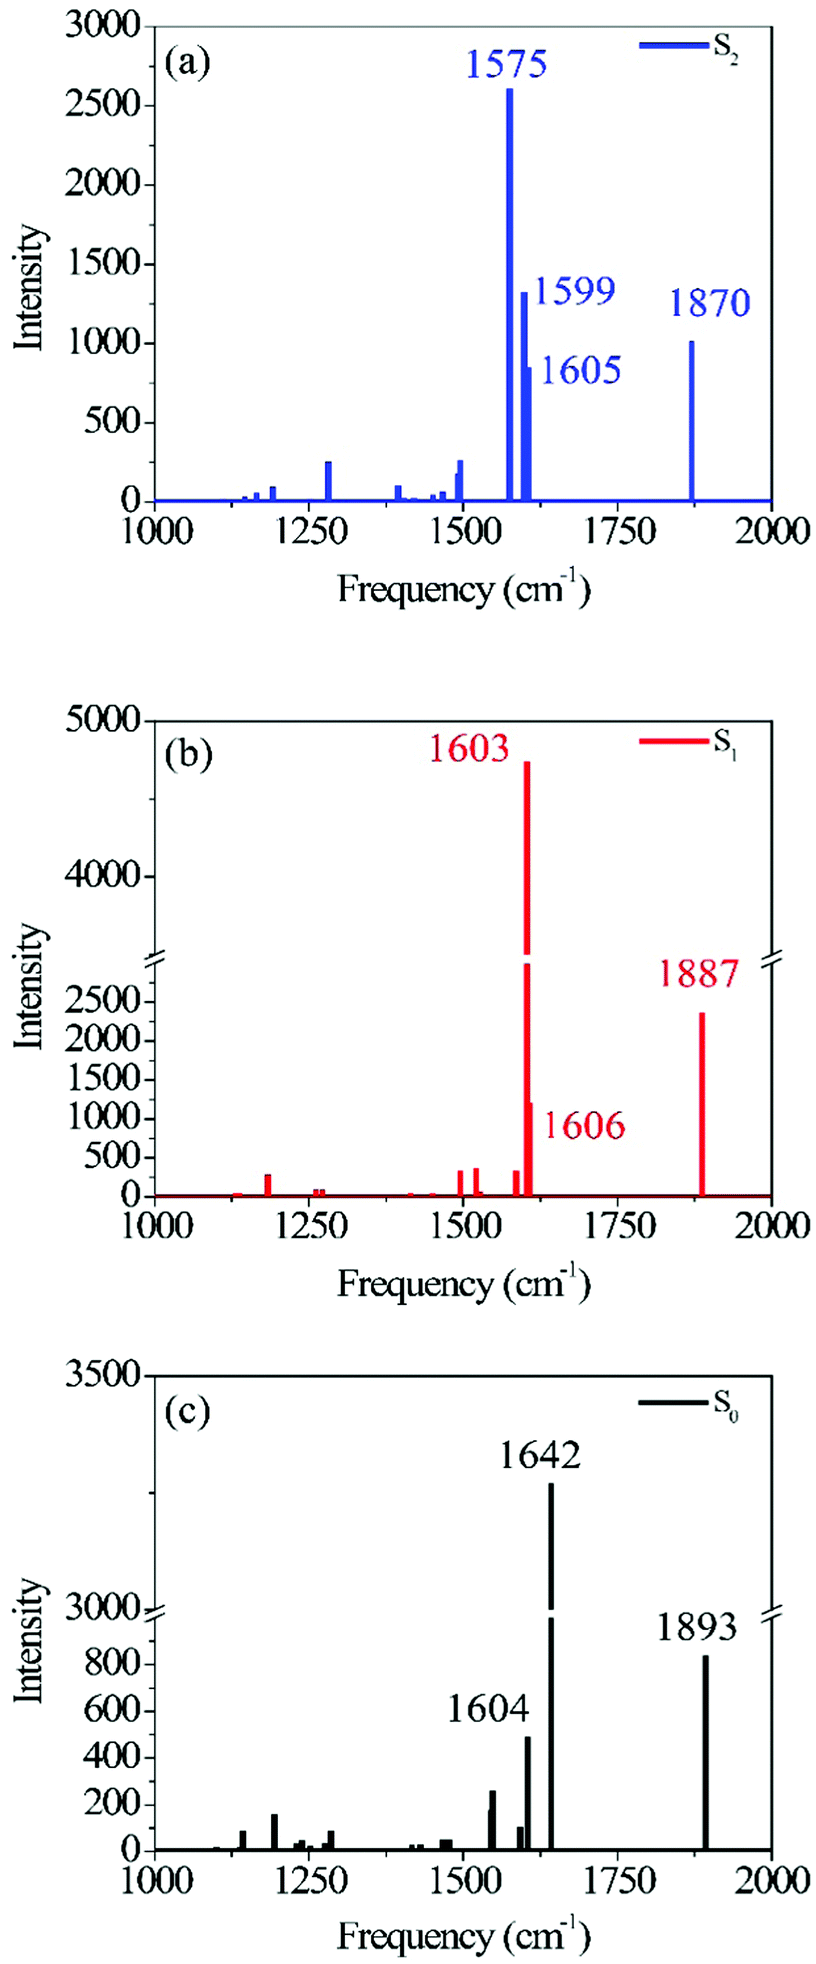 | ||
| Fig. 1 Photo-ODIBO S2 (a), S1 (b) and S0 (c) Raman spectra calculated using B3LYP TD-DFT. Normal mode identification matching the peak frequency labels in (a), (b), and (c) are provided in Table 1, together with their respective intensities. | ||
Pursuant to the goal of unraveling the photodecarbonylation mechanism using insights from vibrational dynamics, FSRS experiments with 321 nm excitation were performed on photo-ODIBO and ODIBO. In addition, complimentary ground and excited state Time-Dependent Density Functional Theory (TD-DFT) Raman calculations facilitated the identification and assignment of experimental Raman bands. The combined experimental and theoretical approach leads to a frame-by-frame femtosecond visualization of the CO release and its associated sequence of bond fission and bond formation steps. Ultimately, such molecular level understanding of the photodecarbonylation process can inform the molecular design of cyclopropenone-based photoactive molecules for increased photodecarbonylation efficiency.
Experimental and computational details
FSRS development, principles, and applications have been adequately addressed by Kukura et al.14,15,23,24 Here, a Coherent Inc. Ti:Sapphire Mira oscillator and Legend Elite HE amplifier system were employed to generate 1 kHz, 800 nm 130 fs pulses. The Legend output was split into three beams; one beam was used to pump a TOPAS-C optical parametric amplifier (OPA) for the generation of 321 nm pulses. For improved time resolution, the 130 fs, 321 nm TOPAS OPA output was passed through an argon-filled hollow-core fiber to temporally compress the pulses to 45 fs.25 The short actinic pump pulses were then used to excite photo-ODIBO to its second excited singlet state (S2), i.e. its lowest state that is bright in absorption. The stimulated Raman probe is based on a two-pulse scheme of a narrowband Raman pump pulse that is time-synchronized to a broadband probe. For this purpose, a second 800 nm beam was passed through a BBO (Beta Barium Borate) crystal to generate second harmonic, 400 nm pulses which were then pointed into a grating-based spectral filter to generate narrowband 400 nm Raman pump pulses.26 A third low-intensity 800 nm beam was focused into a CaF2 crystal for continuum probe pulse generation in the range from 370–760 nm. The observable frequency window of the Raman spectrum, which is determined by the whitelight spectral bandwidth, was selected on the longer wavelength side of the Raman pump, corresponding to a 600–3100 cm−1 Stokes vibrational range. The spectrometer utilizes a single, 500 Hz chopper scheme that modulates the Raman pump as outlined in more detail by Kovalenko et al.27 The time delay between the Raman pump and probe was kept constant, while the delay with respect to the 321 nm actinic pump was varied by translating a retroreflector mounted on a motorized stage. In this scheme, the time-dependent vibrational structure is then superimposed on the broadband TAS spectrum but modulated at 500 Hz. Ground state Raman spectra were collected using the same set-up but with the actinic pump blocked. The resulting spectra are subsequently baseline-corrected using low-order polynomial baseline fitting. This method for polynomial baseline correction for Raman spectra has been widely employed in FSRS spectra found in the literature and therefore provides a reliable method to remove the unwanted baseline shifts.18,19,28–30During the FSRS measurement, a 50 mM solution of either photo-ODIBO or 1 mM ODIBO in methanol was continuously circulated through a 3 mm pathlength quartz cuvette using a peristaltic pump.
Theoretical Raman calculations were performed in the ORCA quantum chemistry package using density functional theory (DFT).31,32 First, the ground state molecular structures were fully optimized using the Becke, 3-parameter, Lee–Yang–Parr (B3LYP) functional and Split Valence Polarization (SVP) basis set combination.33–36 Frequencies were also computed at the same level of theory to verify that there were no imaginary modes at the final relaxed structure. Next, the time-dependent DFT (TD-DFT) method was used to calculate vertical excitation for the three lowest singlets (S1, S2, and S3) for Photo-ODIBO and ODIBO. Excited-state geometry optimization was selected for the S1 and S2 states for the parent molecule photo-ODIBO and only S1 for ODIBO. Finally, the optimized ground state and excited state geometries were used as inputs for Raman calculations. A scaling factor of 0.9614 was applied to the calculated normal mode frequencies for comparison to experimental data, as reported in the literature.37,38 The same scaling factor was used for similar studies of large multi-ring molecules like flavins and coumarins utilizing the same level of DFT theory.37,39–41
Results and discussion
Calculated Raman spectra
Fig. 1 shows the calculated photo-ODIBO spectrum for the ground, first, and second singlet excited states in the Raman frequency range from 1000 cm−1 to 2000 cm−1. The higher activity Raman peaks are labeled for better identification, and all these Raman spectra are presented with their calculated intensities. For the S2 state of photo-ODIBO, four dominant Raman modes are obtained at 1575, 1605, 1599, and 1870 cm−1 (see Fig. 1a). The S1 Raman spectrum is governed by three modes at 1603, 1606, and 1887 cm−1, as plotted in Fig. 1b. The ground state shows a similar spectrum with prominent 1604, 1642, and 1893 cm−1 modes (Fig. 1c). Clearly, the Raman spectra for the first three singlet states display similar patterns involving dominant but overlapping vibrations around 1550–1650 cm−1 and vibrations at around 1870–1895 cm−1 with lower intensities. The mode around 1870–1895 cm−1 is, however, well separated from other vibrational peaks. From this point forward, the Raman modes will be labeled with singlet state, dominant vibrational character, and molecule abbreviation for clarity. For example, a ring mode frequency in the S2 will be denoted S2νring[PO], and likewise, a ring mode for ground state ODIBO will be represented as S0νring[OD].
Fig. 2 depicts the most relevant normal modes for photo-ODIBO (S2νCC[PO] – 1575 cm−1, S2νring[PO] – 1599 cm−1, S2νring[PO] – 1605 cm−1, and S2νCO[PO] – 1870 cm−1) and a table summarizing their local mode contributions is provided in the ESI.† It should be noted that S2νCO[PO] involves significant contributions from the three-membered ring with C7 C8–C23 atoms and, as such, it is not a pure carbonyl stretch which explains this mode's Raman activity. From these representations, it is evident that vibrations involving the carbonyl group and the underlying C7C8 double bond (see Scheme 1) in the three-membered ring dominate the spectra in Fig. 1. The Raman frequency for a conjugated carbonyl group falls in the 1600–1900 cm−1 for most compounds containing this type of chromophore.40,42 Among many other factors, this variation in frequency has been attributed to the number of ring attachments, substituents in the molecular structure, and strain in the molecules.41 Galabov et al. also showed that the carbonyl stretch frequency observed from 1715–1822 cm−1 depends on the C–CO–C angle in cyclic ketones. Smaller angles were associated with higher stretch frequencies. Since the C–CO–C angle in the photo-ODIBO S2 structure is relatively small (59.0° at the optimized geometry), the S2νCO[PO] frequency of 1870 cm−1 can be explained by this greater degree of angular strain compared to other cyclic systems.43 The C–CO–C angle at the S0 geometry is 56.9°, shifting the frequency farther to 1893 cm−1 in the calculated Raman spectrum for the S0 state. As shown in Fig. 2, the S2νCC[PO] stretching motion is also coupled with ring modes which could shift these frequencies from pure CC mode positions. The rest of the spectra show contributions from ring and C–H modes as the molecule vibrates in and out of the plane (in and out of the page). The mode visualizations for the S0 and S1 states are similar to Fig. 2 and are provided in ESI† Fig. S2 and S3.
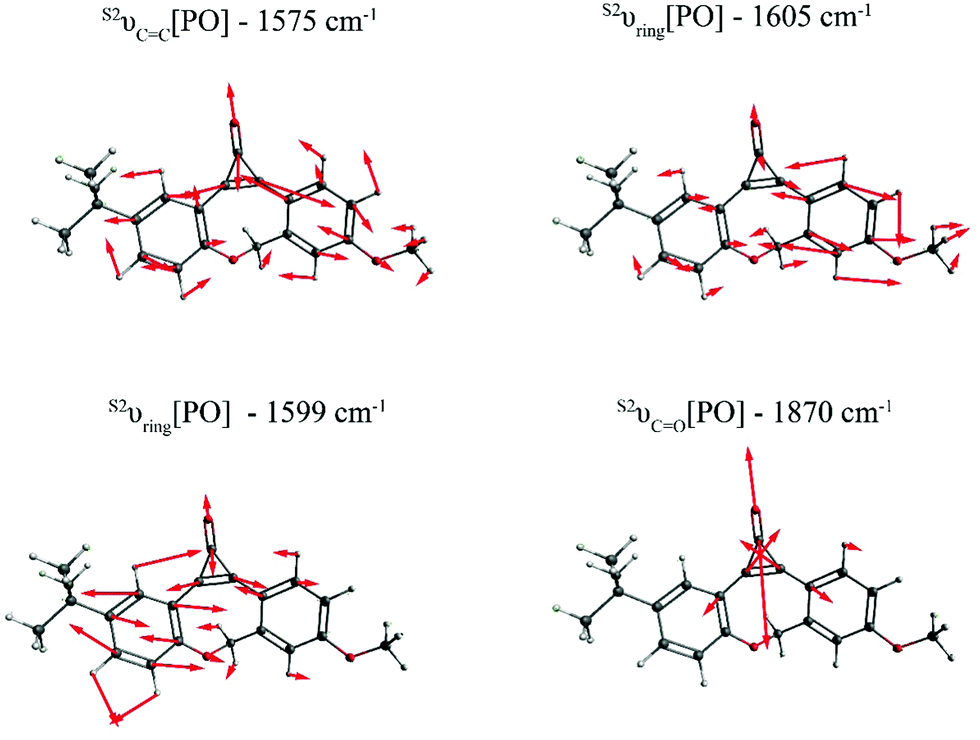 | ||
| Fig. 2 Visualization of the dominant normal modes in the calculated S2 Raman spectrum of photo-ODIBO. The red bonds in the wireframes represent oxygen atoms and arrows show direction of displacements for each frequency. Modes for the S0 and S1 state of photo-ODIBO are similar and provided in the ESI.† | ||
Table 1 lists the calculated Raman frequencies, intensities, and a description of the dominant displacements as a summary to Fig. 2 and ESI† Fig. S2, and S3 showing the primary normal modes for photo-ODIBO at the optimized geometries corresponding to the first three singlet states. Starting from the S2, the SnνCC[PO] and SnνCO[PO] (n = 0, 1, 2) modes systematically shift to higher frequencies for the lower-lying states. Since the normal mode frequencies are inversely proportional to bond lengths, the systematic shortening of the CC double bond explains the blueshift of the SnνCC[PO] mode. As discussed above the CO stretch frequency is also sensitive to the C–CO–C angle which induces strain into the three-membered ring as the angle decreases. Overall, the frequency shift of the SnνCO[PO] mode is less pronounced. In the S0, both single bonds are elongated while the CC double bond is shortened, hence leading to a smaller angle compared to the excited states (see ESI† Table S1) and a blueshift of the S0νCO[PO] mode. However, these simplistic explanations do not fully describe the frequency shifts of the CC and CO stretch modes due to local mode displacements involving the entire ring system (see local mode decompositions in ESI†). In the case of the SnνCO[PO] mode, for example, the localization on the carbonyl stretch changes upon electronic excitation and amounts to only 14% in the S2, 13% in S1, but 48% in S0. Not only frequencies but also Raman intensities are related to bond length parameters. Since Raman intensities are proportional to the magnitude of change in polarizability, longer bond lengths are correlated with higher intensity features due their increased polarizability. This effect is most apparent for the CO bond which has the largest length in S1 and the S1νCO[PO] intensity is more than doubled compared to the other states. The S1νCC[PO] intensity is similarly affected due to a strong involvement of the CO stretch in this mode. Furthermore, the intensities for the calculated modes listed in Table 1 are consistently higher in the S1 state compared to the S2 and S0 states, with the S0 state having the lowest intensities. Such a trend could also be related to a general shortening of bond lengths in S0. In the ground state electrons are confined to the valence orbitals whereas in the electronic excited states photoexcited electrons occupy additional previously unoccupied orbitals leading to increased polarizability.
| Photo-ODIBO | Frequency (cm−1) | Intensity | Mode |
|---|---|---|---|
| S0 | 1604 | 494 | Ring |
| 1642 | 3271 | CC stretch |
|
| 1893 | 838 | CO stretch |
|
| S1 | 1603 | 4745 | CC stretch |
| 1606 | 1200 | Ring | |
| 1887 | 2371 | CO stretch |
|
| S2 | 1575 | 2607 | CC stretch |
| 1599 | 1325 | Ring | |
| 1605 | 853 | Ring | |
| 1870 | 1018 | CO stretch |
Raman calculations for the photoproduct ODIBO were also undertaken to gain insight into the molecular Raman signatures after CO removal. The ground state spectrum showed an intense 2223 cm−1 vibration of the CC bond (S0νCC[OD]). Other low-intensity ring modes (1612 and 1629 cm−1) and C–H (1172 cm−1) modes were also observed (Fig. 3). For comparison, a combined plot of the Raman spectra for photo-ODIBO S2, S1, and ODIBO S0 is provided in ESI† Fig. S4. Optimization of the S1 state of ODIBO converges with a double bond between C7 and C8, where a triple bond was expected. This optimized structure results in an inconsistent Raman spectrum as a result of this double bond. Therefore, only the S0 Raman calculations are provided. Assuming the same trend as observed in photo-ODIBO calculations, it is expected that the S1νCC[OD] frequency will also be red-shifted with respect to the S0 frequency.
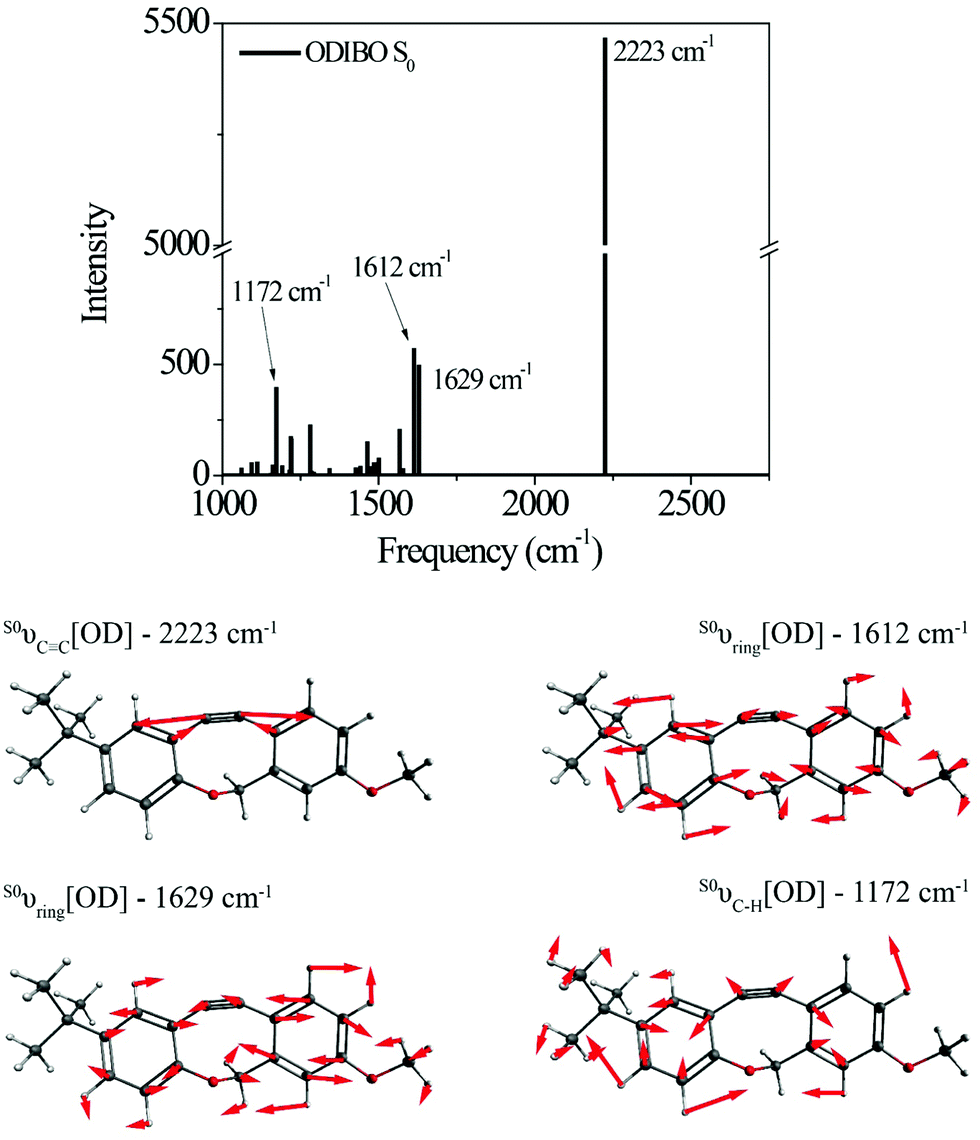 | ||
| Fig. 3 Raman spectrum and visualizations of the molecular displacements for the dominant normal modes in ODIBO ground state. | ||
Experimental FSRS spectra
1. Photo-ODIBO Raman peak assignments
Raman spectra at various delay-times after excitation to the S2 state with a 321 nm actinic pump pulse are presented in Fig. 4. For comparison, the ground state Raman spectrum, recorded without the actinic pump, is also shown. These spectra include a methanolic feature at 1483 cm−1 (black stars in Fig. 4), consistent with the known Raman frequencies for the methanol CH bending mode.44,45 At early delay-times, the prominent peaks in the spectra, at 1600 and 1868 cm−1 are consistent with the expected S2 frequencies for the ring, CC and CO vibrations obtained from the Raman calculations. The 1868 cm−1 ((1) in Fig. 4) peak is therefore ascribed to the S2νCO[PO] mode calculated at 1870 cm−1. As expected, this peak is also red-shifted with respect to the ground state frequency at 1911 cm−1 labeled (2) in Fig. 4. In the 213 fs spectrum, the S2νCO[PO] peak has split into a pair of peaks, the first shifting in frequency between 1835–1842 cm−1 and a second between 1868–1898 cm−1. The splitting is tentatively assigned to structural changes in photo-ODIBO as a precursor to C–C bond rupture for the former and simultaneous vibrational relaxation on S2 and internal conversion to S1 for the latter (discussed further in Section 3). The spectral resolution of the FSRS experimental setup was insufficient to fully separate the theoretically predicted modes at 1575, 1599, and 1605 cm−1 and close-lying methanol peak at 1483 cm−1. As such, the 1600 cm−1 feature (6) comprises a combination of the S2νCC[PO] and two ring modes, S2νring[PO], at 1575, 1605, and 1599 cm−1, respectively. Additional Raman features are present in the photo-ODIBO FSRS spectrum that are not observed in the Raman calculations, thereby hindering their assignment to normal modes of photo-ODIBO (or the ODIBO product). These include the 2080 cm−1 peak (3) in the S0 spectra and 2052 and 2384/2428 cm−1 peaks in the excited state spectra (see Fig. 4). Such vibrational features may be overtones or combination bands arising from low-frequency modes (<1200 cm−1), expected in the frequency range above 2000 cm−1, as described by Kukura et al.14 The calculated spectra presented here are based on transition polarizability components involving singly excited vibrational states (fundamentals), which is unable to predict doubly excited states of two modes that give rise to overtones and combination bands.46
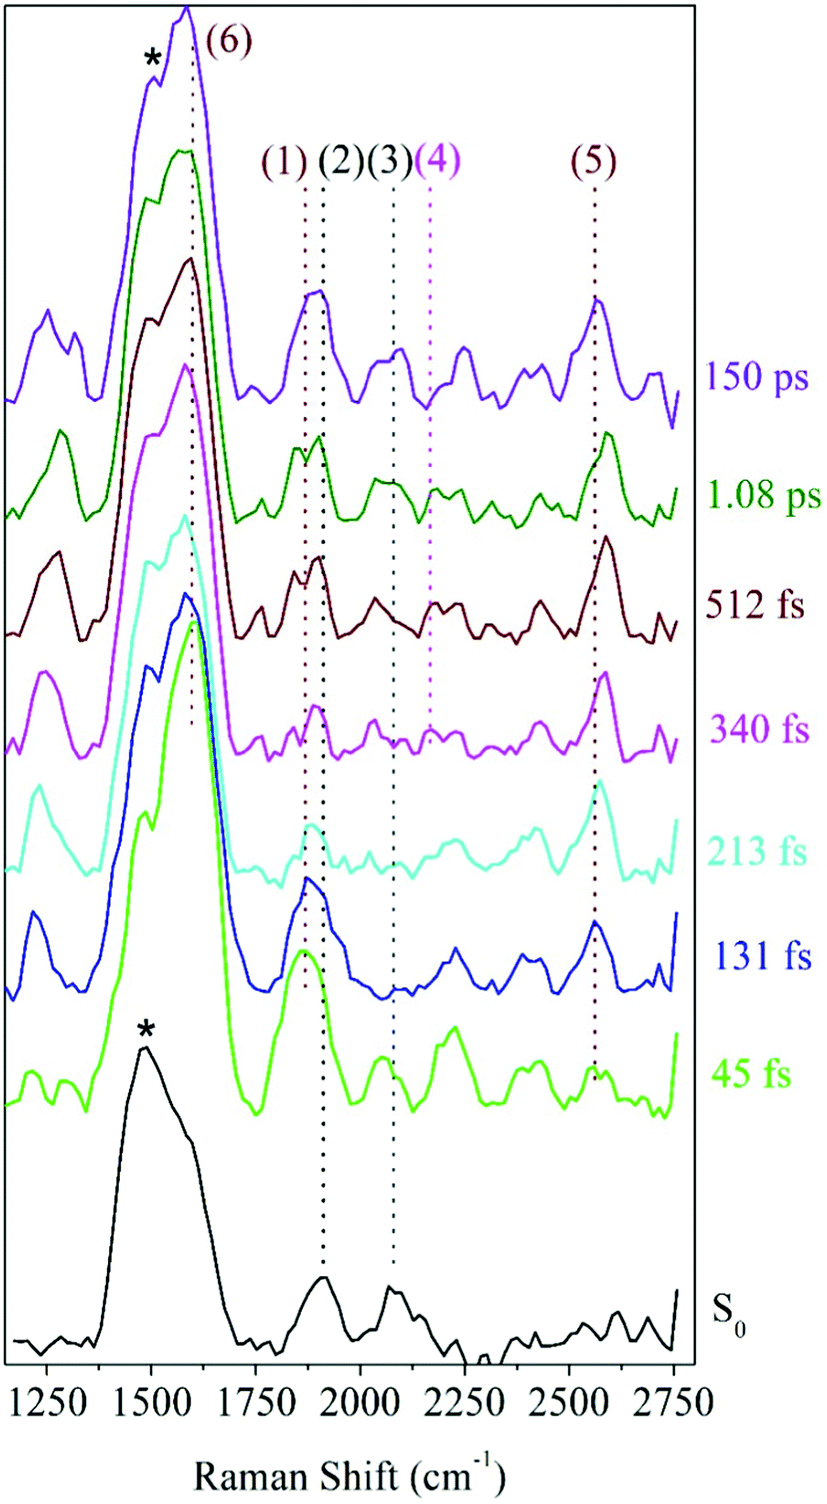 | ||
| Fig. 4 Photo-ODIBO FSRS spectra at various time delays after 321 nm excitation and ground state spectrum (black lines). The important marker modes S2νCO[PO], S2νCC[PO], and S1νCC[OD] correspond to (1), (6), and (4), respectively. Ground state peak frequency positions: (2) – 1911 cm−1 and (3) – 2080 cm−1. Excited state peak frequency positions: (1) – 1868, (4) – 2165, (5) – 2556, and (6) – 1600 cm−1. The black stars denote a methanolic peak at 1483 cm−1. | ||
Rising peaks in the FSRS spectrum of photo-ODIBO are of particular interest as potential indicators of ODIBO photoproduct formation. Specifically, observation of the ODIBO CC bond stretch mode, which is expected around the 2100–2250 cm−1 region, would provide unambiguous evidence for the presence of ODIBO.47 Given that the ODIBO quantum yield is low, some of the smaller features are inspected and discussed next. Starting at around 213 fs, a peak at 2165 cm−1 (4) appeared in the spectrum as shown in Fig. 4 and is the most likely candidate for assignment to the S1νCC[OD] mode in the product, ODIBO, because it falls within the expected frequency range and also rises in intensity. For now, this peak is tentatively assigned to S1νCC[OD], but the ODIBO FSRS spectrum discussed in section 2 provides additional confirmation. The ODIBO product formation will also be further quantified by analyzing the rise-time of this S1νCC[OD] peak in Section 3.
Also visible in the Raman spectra are the growth of the 1215 (unmarked) and 2556 cm−1 (5) Raman bands around 131 fs. The lower frequency band falls in the frequency range for ring C–H vibrations and appears to blue-shift from 1215 to 1289 cm−1 in the time range of 1.1 ps, as shown. Such modes are expected for the parent and product molecules and not suitable as markers for characterization of the photodecarbonylation. The higher frequency peak at 2556 cm−1 also shows a blue shift in the 1.1 ps experimental time window; however, the peak position does not match any of the calculated Raman modes for photo-ODIBO S0, S1 or S2, or ODIBO S0. As such, its assignment remains unknown.
2. ODIBO Raman peak assignments
To further facilitate the identification of potential ODIBO features in the photo-ODIBO FSRS spectra, ODIBO FSRS data after 321 nm excitation to its S1 state were also collected and are presented in Fig. 5. Due to a lower ODIBO concentration (1 mM) used in this measurement, the Raman spectra are subject to a lower signal-to-noise ratio and Raman peaks are less apparent compared to photo-ODIBO FSRS spectra (Fig. 4). These spectra, nevertheless, reveal clear peaks around 2206, 2399, and 2578 cm−1 (2, 3, and 4, respectively in Fig. 5) after excitation to S1, and the ground state Raman spectrum shows peaks around 1601, 2206, and 2582 cm−1 (1, 2, 4, respectively). These vibrational markers can therefore aid with the identification of S0 and S1 ODIBO signatures in the photo-ODIBO FSRS. Based on the calculated spectrum presented in Fig. 3, the 1601 cm−1 peak (1) can be assigned to S0νring[OD]. This ring mode is expected to retain this frequency in the excited state (S1), similar to the photo-ODIBO ring modes at 1605 ± 1 cm−1 in the S0, S1, and S2 states. However, this ODIBO mode was not clearly observed in the FSRS spectra of the S1 state, suggesting that its intensity may be too low to resolve from the background noise. The peak at 2206 cm−1 (2) corresponds to the S0νCC[OD] mode calculated at 2223 cm−1 and, as discussed above, is of paramount interest to the characterization of photoproduct formation. Upon photoexcitation to S1, it remains essentially unshifted and the peak around 2206 cm−1 is assigned to S1νCC[OD]. This leads to the conclusion that ODIBO does not undergo any significant geometric changes during photoexcitation or relaxation that would cause a frequency shift. Additional bands in both S0 and S1 ODIBO FSRS at 2582 cm−1 and 2578 cm−1, respectively, were absent from DFT calculations but also observed as a rising, redshifted peak in the photo-ODIBO FSRS. The origin of the 2399 cm−1 peak is unknown but again might be a combination band or overtone.
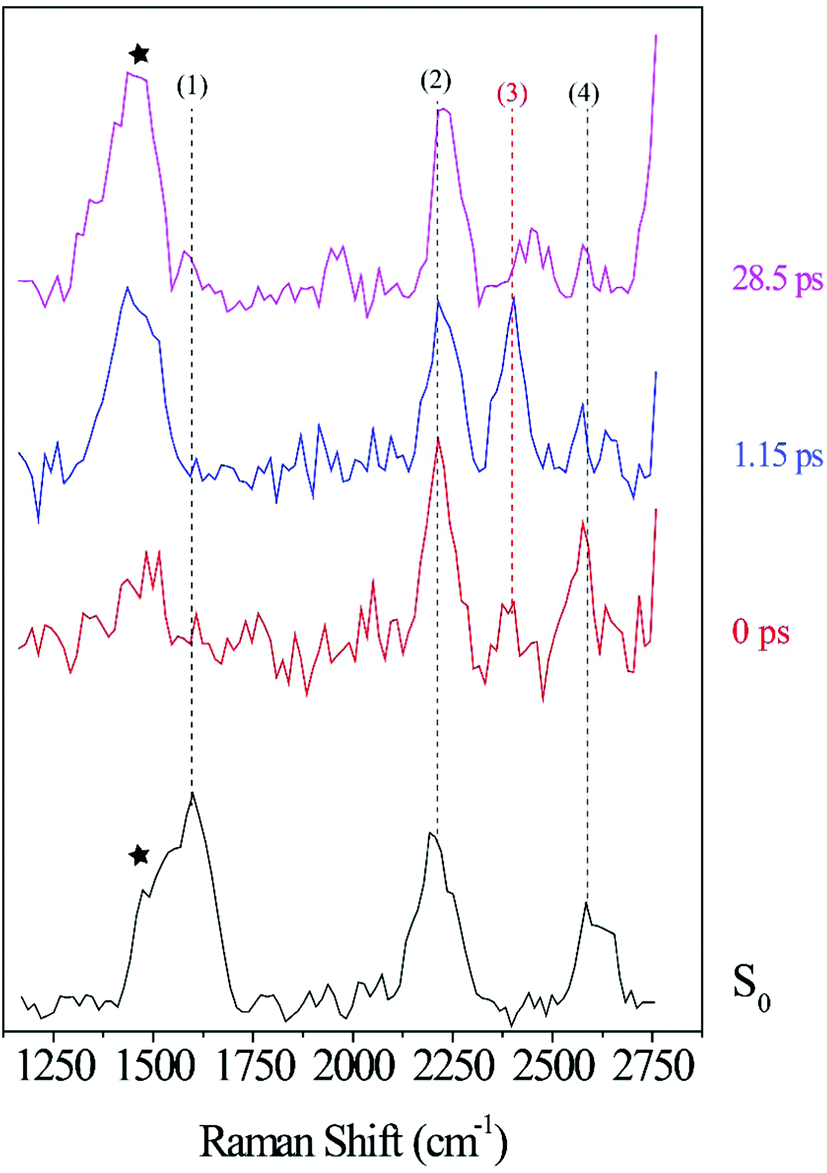 | ||
| Fig. 5 ODIBO FSRS spectra after 321 nm excitation at 0, 1.15 and 28.5 ps delay-times with peaks at 2206, 2399 and 2578 cm−1 at 0 ps labeled (2), (3), and (4), respectively. The ground state spectrum (black) without actinic excitation is also provided with 1601, 2206 and 2582 cm−1 peaks labeled (1), (2) and (4) respectively. The black stars denote a methanolic peak at 1483 cm−1. | ||
The FSRS spectra combined with Raman calculations for ODIBO clearly indicate that the CC stretch marker mode can provide additional evidence for ODIBO formation upon photodecarbonylation of photo-ODIBO. The observation of this mode, given the low concentration of ODIBO, suggests that it should also be detectable in the photo-ODIBO FSRS. However, it is expected that the structure of ODIBO formed upon decarbonylation will differ drastically from the structure of the directly excited product. The molecular backbone attached to the three-membered ring is significantly twisted out of plane (i.e., about the axis of the CO bond) in the photo-ODIBO S2 from which ODIBO will be formed. The decarbonylation product could then inherit this twisted backbone structure as it is formed on ultrafast time scales. Furthermore, the decarbonylation process itself involves a sequence of structural changes starting with bond fissions to release the carbonyl group followed by formation of the CC triplet bond. As the bond between C7 and C8 transitions from a double to a triple bond, the S1νCC[OD] vibrational feature is expected to appear at a frequency that is initially redshifted compared to the ODIBO FSRS. The S1νCC[OD] peak subsequently blueshifts toward the expected position with increasing bond strength. Therefore, the S1νCC[OD] Raman peak observed at 2206 cm−1 in the ODIBO FSRS lends support for assignment of the 2165 cm−1 peak in the photo-ODIBO FSRS to the same mode. A similar structural discrepancy between a decarbonylation product and the direct excitation counterpart was also observed in diphenylcyclopropenone photodecarbonylation by Kuramochi et al.22
3. Photo-ODIBO peak frequency and intensity dynamics
Further insight into the mechanistic details of the photodecarbonylation process can be derived from peak frequency shifts and intensity dynamics of the marker modes, e.g., the photo-ODIBO CO stretch (Fig. 6) and ODIBO C7C8 stretch (Fig. 7). Frequency shifts are typical signatures of structural evolution, whereas intensity decays result from internal conversion or other means of state depopulation as well as changes in polarizability. FSRS peak intensity can also be influenced by factors including pulse power, concentrations, and resonance conditions.19,48
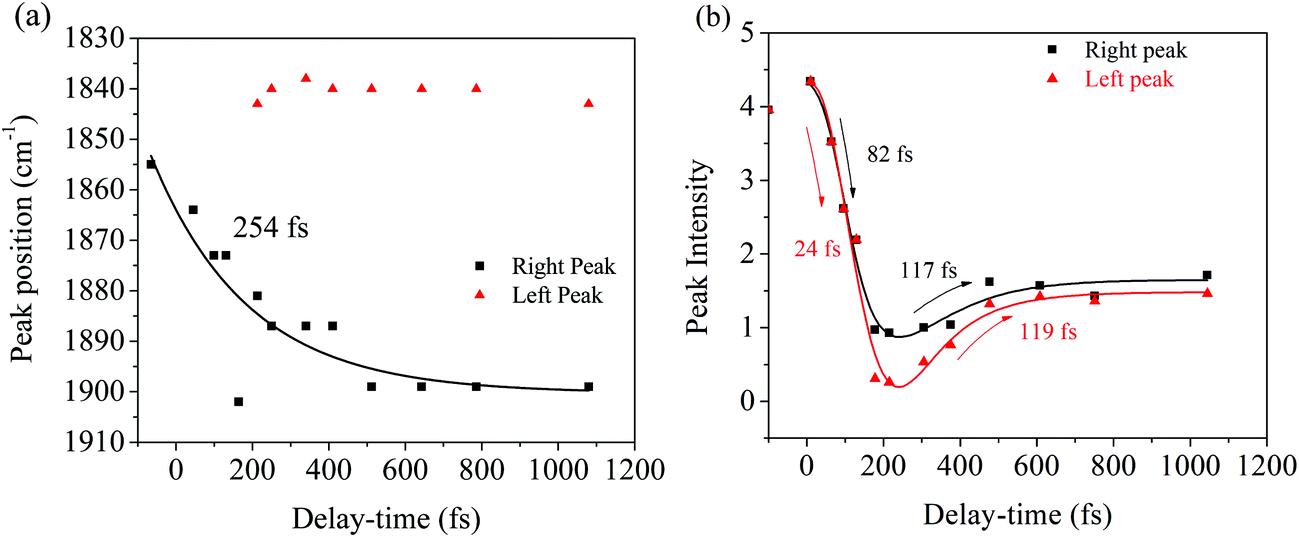 | ||
| Fig. 6 Kinetics for the peak intensity and frequency of the peak in the Photo-ODIBO FSRS. (a) Frequency peak dynamics of the carbonyl (CO) stretching mode. A single exponential fit with the indicated time constant was used to describe the dynamics. The peak splitting is also shown with the resulting peaks indicated in black (right peak) and red (left peak). (b) Intensities for the left and right peaks plotted as a function of delay-time, including the decay and rise times extracted with biexponential fitting. | ||
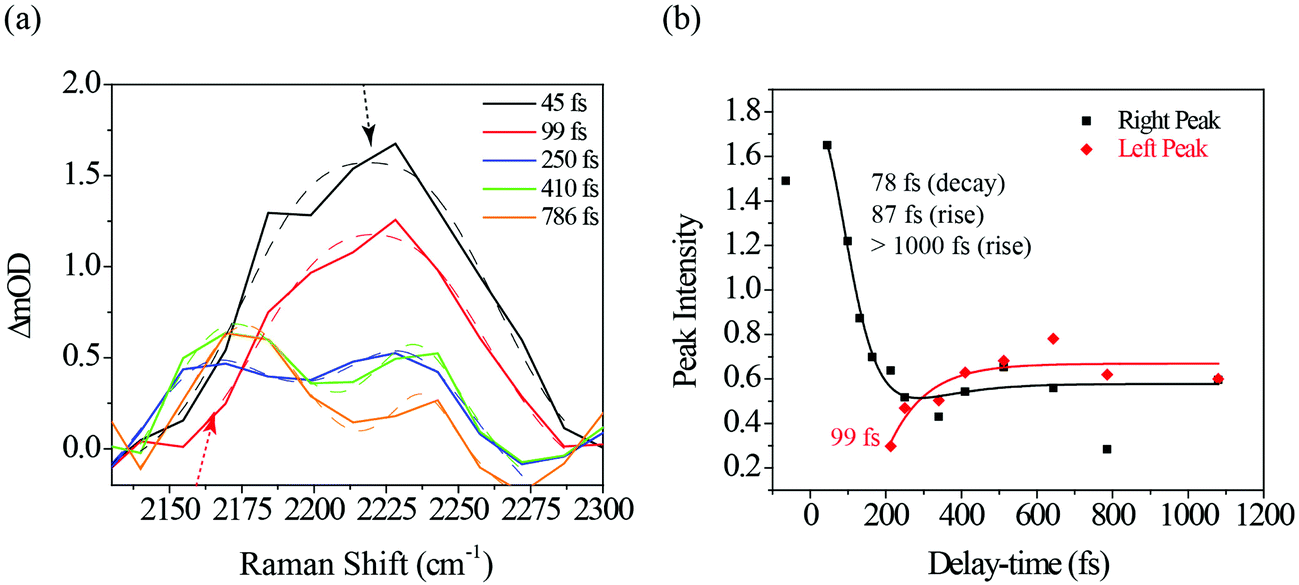 | ||
| Fig. 7 (a) Closeup of the Raman shift region around 2100–2300 cm−1 where the ODIBO S1νCC feature is expected. The spectra at the different time-delays are fit with single and double Gaussians (dotted lines) to describe the peak's change from a single to double-peak feature at ∼200 fs delay time. (b) Intensity dynamics of the left (2165 cm−1) band and right (2230 cm−1) band fit with a single and three-component exponential model, respectively (solid curves). | ||
Fig. 6a illustrates a splitting of the S2νCO[PO] band into two: a red-shifting band between 1835–1842 cm−1 (left peak) and a second peak blue-shifting in the 1868–1898 cm−1 range (right peak). At 1.1 ps, the lower frequency peak remained around 1842 cm−1 while the higher frequency had shifted to 1898 cm−1. The observed blue-shift for the S2νCO[PO] Raman peak (right peak) is analyzed first. Fig. 6a shows a progressive ∼30 cm−1 net blue shift with increasing delay-time described by a 254 fs time constant, closely matching the dynamics of the first, ultrafast component of the electronic TA spectrum (294 fs, ESI† Fig. S1, for details also see ref. 10). These matching time constants could indicate that the same process is responsible for the shift observed here, i.e., the 254 fs time constant can be assigned to intramolecular vibrational relaxation on the S2 directly after 321 nm excitation, in line with the TAS assignment.10,19,48–51 Due to anharmonicity of vibrational modes, transition frequencies between adjacent vibrational levels decrease for higher quanta of excitation. This results in a time-dependent blueshift of vibrational bands in FSRS spectra during vibrational cooling processes. Cooling either occurs through intramolecular vibrational energy redistribution to other modes (fs–ps timescales) or vibrational energy transfer to the solvent (longer ps timescales). For example, similar peak position blue-shifts have been previously observed in FSRS and time-resolved infrared spectroscopies of the para-nitroaniline NO2 stretch mode by Schrader et al. and were assigned to vibrational cooling involving energy transfer to solvent molecules. The blue-shifting trend was also observed in the CC stretch mode in β-carotene and was similarly assigned.23 Additionally, from the DFT Raman calculation in Table 1, it is also evident that internal conversion from the initially excited S2 state to S1 will likewise blue shift the CO stretch mode, because of its higher frequency in S1 compared to S2. Therefore, an admixture of the decreasing S2 population and increasing population of the S1 state could result in a time-dependent gradual shift of the right peak toward higher frequency due to close-lying and unresolved S2 and S1 CO stretches. Such excited state population changes also impact the observed decrease in intensity of Raman modes, especially for this marker S2νCO[PO] mode, which is discussed below. Overall, the blue shift dynamics of the right peak in Fig. 6a are therefore associated with S2 vibrational cooling and internal conversion dynamics of S2, i.e., SN2 → S02 vibrational relaxation occur on similar timescales as S2 → S1 internal conversion, where N represents a higher-lying vibrational level.52
A possible explanation of the splitting, which leads to an additional red-shifted peak around 1842 cm−1 could be structural changes in photo-ODIBO on the S2 state that are precursors to decarbonylation. For example, lengthening the C7–C23 and C8–C23 bonds in the three-membered ring and increasing the C–CO–C angle will cause a small red-shift (∼7 cm−1) of the S2νCO[PO] feature. This suggests the decarbonylation process competes with and occurs in parallel to the S2 vibrational cooling and internal conversion processes.
Excited-state dynamics after 321 nm excitation are analyzed further by following the intensity of the S2νCO[PO] mode as a function of pump–probe delay. Fig. 6b shows a decrease in intensity with 24–82 fs time constants for both left and right peaks discussed above; afterward, both peaks indicate similar intensity rises described by 117–119 fs time constants. The decay dynamics are ascribed to a change in polarizability during vibrational cooling, the initiation of decarbonylation on S2, and S2 → S1 internal conversion, with the latter process leading to a depopulation of the photo-ODIBO S2 state. In the case of internal conversion, the slight rise in intensity (117, 119 fs time constants, Fig. 6b) could result from the increase in photo-ODIBO S1 population consistent with the observation in the DFT Raman calculations, which showed an enhanced intensity for the S1νCO[PO] compared to the S2νCO[PO] mode. In the case of decarbonylation, the slight intensity increase with around 117, 119 fs time constants can be explained by an aborted decarbonylation in some parent molecules and re-formation of the C–C bond after initial fission. Such increase in S2 population of the original photo-ODIBO parent molecules would also increase the intensity of the measured S2νCO[PO] mode.51,53
Fig. 7a shows a portion of the photo-ODIBO Raman spectrum expanded to highlight the 2100–2300 cm−1 region peaks. Clearly, the right peak (2230 cm−1) decreases in intensity, but at 250 fs a rising peak (left) at 2165 cm−1 is observed and assigned to S1νCC[OD]. This latter peak, which is attributed to the presence of ODIBO in the photo-ODIBO FSRS, is also chosen for further dynamics analysis. The S1νCC[OD] growth is fit with a ∼99 fs rise-time, plotted in red in Fig. 7b. Notably, the rise of this mode is delayed, i.e. becomes a distinguishable feature around ∼200 fs, which is consistent with the subsequent formation of the triple bond after the bond-elongation dynamics shown in Fig. 6b. The kinetics of the 2230 cm−1 (right peak) band intensity is also plotted in black in Fig. 7b. However, the 78 fs decay and 87 fs rise time constants suggest that this 2230 cm−1 band might be unrelated to the product formation but instead represents vibrational cooling and internal conversion dynamics on the S2 state of photo-ODIBO.
Table 2 presents a summary of these primary marker modes, SnνCO[PO] and S1νCC[OD], observed in the photo-ODIBO FSRS spectra. The table also includes the expected peak positions based on TD-DFT calculations.
O[PO] and S1νCC[OD] peak positions and delay-times at which they appear in the photo-ODIBO FSRS spectra after 321 nm excitation. The SnνCO[PO] splits into two peaks, which are referred to as left (l) and right (r), after 213 fs. For comparison the S1νCC[OD] peak position shift for direct 321 nm photoexcitation of ODIBO is also given
| State and mode | Calculated (cm−1) | Experiment (cm−1) | Delay-time range |
|---|---|---|---|
| Photo-ODIBO S2 CO |
1870 | 1868–1881 (r) | −65–213 fs |
| 1835–1842 (l) | ∼213 fs–1.08 ps | ||
| Photo-ODIBO S1 CO |
1887 | 1882–1898 (r) | ∼213 fs–150 ps |
| 1840 (l) | ∼213 fs–1.08 ps | ||
| ODIBO S1 CC decarbonylation of photo-ODIBO |
— | 2165–2211 | ∼213 fs–150 ps |
| ODIBO S1 CCdirect photoexcitation |
— | 2206–2228 | 0 fs–29 ps |
4. Photodecarbonylation mechanism
The peak frequency and intensity dynamics of the S2νCO[PO] marker mode, discussed in detail above, indicate that an excited state photodecarbonylation process is at play. In parallel to internal conversion and vibrational cooling of the S2 state, decarbonylation is initiated on ultrafast timescales by elongation of C7–C8 and C6–C8 bonds. The delayed rise of the S1νCC[OD] peak alluded to the presence of ODIBO product at later times. The question whether the single bond fissions leading to the carbonyl group's release occur simultaneous or sequential however remains unanswered in this analysis.
Photodecarbonylation involves a drastic change of the three-membered ring with the underlying C6C7 bond (see Scheme 1). Although the interpretation of the CC stretch (S2νCC[PO] mode), is ambiguous due to overlap with other vibrational features, it may provide additional hints as to the mechanistic details. Given that the two bands S2νCO[PO] and S2νCC[PO] (see Fig. 6b and ESI† Fig. S7) show different time constants (24–82 fs and 151 fs, respectively), a two-step decarbonylation mechanism with sequential single bond fissions is considered the most likely. Poloukhtine et al. proposed a step-wise decomposition for a series of cyclopropenones, and Elroby et al. also used this model to explain phenylcyclopropenone (IO) and cyclopropenone (HC(CO)CH) decarbonylation.54,55 Their computational results pointed to a sequential elongation of the C–C bonds in the three-membered ring resulting in CO release.55,56 According to Elroby et al.'s simulation, the C7C8 bond remains intact through the elongation of this first single bond resulting in an intermediate with one ruptured C–C bond in (place of the three-membered ring C7C8–C23). This step is followed by lengthening and eventual breaking of the next C–C bond releasing CO. Throughout this process, the underlying C7C8 bond extends slightly until the carbonyl is released and a C7C8 bond is formed.55,56 A similar model could explain the time evolution of the marker bands in the photo-ODIBO Raman spectra presented in this study. The S2νCO[PO] carbonyl stretch intensity decreases faster (24–83 fs time constant) compared to the S2νCC[PO] band (151 fs time constant) as either C7–C23 or C8–C23 elongates initially and breaks. Meanwhile, the underlying CC bond is retained until the lengthening and fission of the next C–C bond, explaining the longer lifetime for the CC bond stretch Raman intensity. With this proposal in mind, the discrepancy in the dynamics of the primary marker mode S2νCO[PO] (Fig. 6b) and S2νCC[PO] (ESI† Fig. S7) is attributed to a sequential bond fission process. With fission of the second bond, the CC bond forms and the S1νCC[OD] mode of the ODIBO product rises in ∼99 fs in the photo-ODIBO spectrum.
Scheme 2 presents a summary of the relaxation and decarbonylation processes extracted from the FSRS spectra of photo-ODIBO. Immediately after excitation, S2νCO[PO] and S2νCC[PO] mode intensities decreased with 24–82 and ∼151 fs time constants, respectively, followed by a ∼99 fs rise in the S1νCC[OD] mode, indicating the presence of the ODIBO product. The different time constants for CO and CC peak intensity alluded to a step-wise mechanism beginning with elongation of one of the two C–C bonds in the three-membered ring (C8–C23 or C7–C25) and their fission was completed within 151 fs. Subsequent CO release would then follow, leading to a delayed appearance of the rising S1νCC[OD] mode. Since only a small fraction of photo-ODIBO is converted, relaxation dynamics of the photo-ODIBO parent are also observed. Peak splitting of the S2νCO[PO] mode and blue-shifting with a 254 fs time constant matches the decay of the first ultrafast absorption spectrum in the TAS experiment, which solidified its assignment to vibrational cooling dynamics on the S2 state. Intensity dynamics of the feature indicate that S2 → S1 internal conversion may also contribute on these ultrafast timescales.
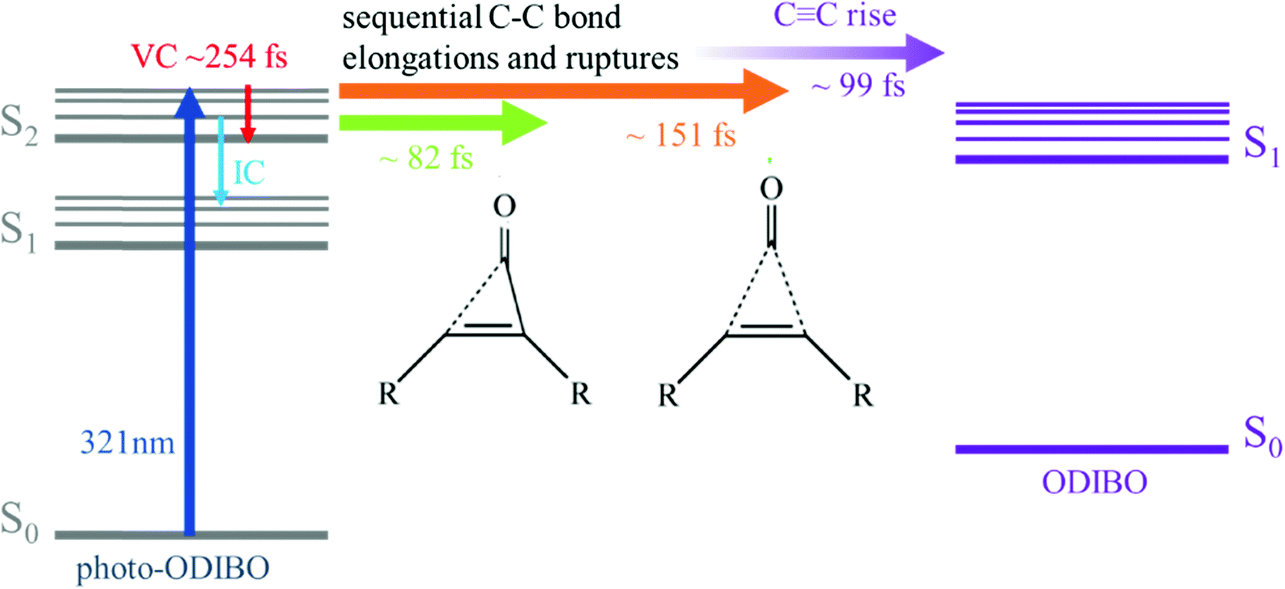 | ||
| Scheme 2 Summary of the proposed decarbonylation and relaxation mechanism based on interpretation of the photo-ODIBO FSRS spectra after 321 nm photoexcitation (dark blue). The proposed sequential excited state process involves ring-opening after fission of the first C–C bond (green) followed by rupture of second C–C bond (orange), and CC bond formation in the ODIBO product (purple). Competing ultrafast processes in the unconverted photo-ODIBO include vibrational cooling (red) on S2 and S2 → S1 internal conversion (light blue). | ||
Conclusion
In summary, Femtosecond Stimulated Raman Spectroscopy has been employed to investigate the photodecarbonylation process in photo-ODIBO. It has been shown that by analyzing the time evolution of specific vibrational marker bands such as the photo-ODIBO CO and CC and ODIBO CC stretching modes, mechanistic details of the photodecarbonylation dynamics and product formation can be resolved. TD-DFT excited state geometry optimization and subsequent Raman calculation of the S2, S1, and S0 photo-ODIBO states were used to facilitate the assignment of the Raman spectra obtained. The band assigned to CO stretch also showed a frequency shift with dynamics matching the previously measured time constant for vibrational relaxation on the S2 state immediately after excitation, obtained from electronic transient absorption spectroscopy. Furthermore, these vibrational dynamics coincided with decarbonylation and internal conversion occurring 24–82 fs lifetimes, as determined by the intensity dynamics of marker CO mode. The delayed rise of the CC mode time was then used to characterize the product formation. Finally, this work demonstrates that FSRS, combined with DFT, is suitable for the study of cyclopropenone photodecarbonylation, and photoinduced molecular structural changes in general. Furthermore, the mechanistic insights obtained can facilitate the design of superior cyclopropenones for spatially and temporally resolved SPAAC reactions.
Conflicts of interest
There are no conflicts to declare.Acknowledgements
This work was supported by the National Science Foundation grants CHE-1362237 (SU), CHE-1800050 (SU), and CHE-1900464 (VVP)References
- J. M. Baskin, J. A. Prescher, S. T. Laughlin, N. J. Agard, P. V. Chang, I. A. Miller, A. Lo, J. A. Codelli and C. R. Bertozzi, Copper-Free Click Chemistry for Dynamic in Vivo Imaging, Proc. Natl. Acad. Sci. U. S. A., 2007, 104(43), 16793–16797 CrossRef CAS PubMed.
- J. C. Jewett and C. R. Bertozzi, Cu-Free Click Cycloaddition Reactions in Chemical Biology, Chem. Soc. Rev., 2010, 39, 1272–1279 RSC.
- C. D. McNitt and V. V. Popik, Photochemical Generation of Oxa-Dibenzocyclooctyne (ODIBO) for Metal-Free Click Ligations, Org. Biomol. Chem., 2012, 10, 8200–8202 RSC.
- H. C. Kolb, M. G. Finn and K. B. Sharpless, Click Chemistry: Diverse Chemical Function from a Few Good Reactions, Angew. Chem., Int. Ed., 2001, 40, 2004–2021 CrossRef CAS.
- E. M. Sletten and C. R. Bertozzi, A Hydrophilic Azacyclooctyne for Cu-Free Click Chemistry, Org. Lett., 2008, 10(14), 3097–3099 CrossRef CAS.
- C. D. McNitt, H. Cheng, S. Ullrich, V. V. Popik and M. Bjerknes, Multiphoton Activation of Photo-Strain-Promoted Azide Alkyne Cycloaddition “click” Reagents Enables in Situ Labeling with Submicrometer Resolution, J. Am. Chem. Soc., 2017, 139(40), 14029–14032 CrossRef CAS PubMed.
- S. Arumugam, S. V. Orski, N. E. Mbua, C. McNitt, G. Boons, J. Locklin and V. V. Popik, Photo-Click Chemistry Strategies for Spatiotemporal Control of Metal-Free Ligation, Labeling, and Surface Derivatization, Pure Appl. Chem., 2013, 85(7), 1499–1513 CAS.
- M. Martínek, L. Filipová, J. Galeta, L. Ludvíková and P. Klán, Correction to Photochemical Formation of Dibenzosilacyclohept-4-Yne for Cu-Free Click Chemistry with Azides and 1,2,4,5-Tetrazines, Org. Lett., 2019, 21(20), 8506 CrossRef PubMed.
- S. Takeuchi and T. Tahara, Femtosecond Absorption Study of Photodissociation of Diphenylcyclopropenone in Solution: Reaction Dynamics and Coherent Nuclear Motion, J. Chem. Phys., 2004, 120, 4768–4776 CrossRef CAS PubMed.
- L. Shenje, W. Thompson, Z. Ren, N. Lin, V. Popik and S. Ullrich, Ultrafast Transient Absorption Spectroscopy of the Photodecarbonylation of Photo-Oxadibenzocyclooctyne (Photo-ODIBO), J. Chem. Phys., 2021, 154, 074302 CrossRef CAS PubMed.
- M. Kao, R. K. Venkatraman, M. N. R. Ashfold and A. Orr-Ewing, Effects of Ring-Strain on the Ultrafast Photochemistry of Cyclic Ketones, Chem. Sci., 2020, 11, 1991–2000 RSC.
- S. J. Léger, B. Marchetti, M. N. R. Ashfold and T. N. V. Karsili, The Role of Norrish Type-I Chemistry in Photoactive Drugs: An Ab Initio Study of a Cyclopropenone-Enediyne Drug Precursor, Front. Chem., 2020, 8, 596590 CrossRef PubMed.
- B. Marchetti, T. N. V. Karsili and M. N. R. Ashfold, Exploring Norrish Type I and Type II Reactions: An Ab Initio Mechanistic Study Highlighting Singlet-State Mediated Chemistry, Phys. Chem. Chem. Phys., 2019, 21, 14418–14428 RSC.
- P. Kukura, D. W. McCamant and R. A. Mathies, Femtosecond Stimulated Raman Spectroscopy, Annu. Rev. Phys. Chem., 2007, 58(1), 461–488 CrossRef CAS PubMed.
- D. R. Dietze and R. A. Mathies, Femtosecond Stimulated Raman Spectroscopy, ChemPhysChem, 2016, 17, 1224 CrossRef CAS PubMed.
- T. Nelson, J. Bjorgaard, M. Greenfield, C. Bolme, K. Brown, S. McGrane, R. J. Scharff and S. Tretiak, Ultrafast Photodissociation Dynamics of Nitromethane, J. Phys. Chem. A, 2016, 120(4), 519–526 CrossRef CAS PubMed.
- M. Jen, K. Jeon, S. Lee, S. Hwang, W. Chung and Y. Pang, Ultrafast Intramolecular Proton Transfer Reactions and Solvation Dynamics of DMSO, Struct. Dyn., 2019, 6, 064901 CrossRef PubMed.
- C. Fang and L. Tang, Mapping Structural Dynamics of Proteins with Femtosecond Stimulated Raman Spectroscopy, Annu. Rev. Phys. Chem., 2020, 71(1), 239–265 CrossRef CAS PubMed.
- C. Ferrante, E. Pontecorvo, G. Cerullo, M. H. Vos and T. Scopigno, Direct Observation of Subpicosecond Vibrational Dynamics in Photoexcited Myoglobin, Nat. Chem., 2016, 8, 1137–1143 CrossRef CAS PubMed.
- G. Batignani, C. Ferrante and T. Scopigno, Accessing Excited State Molecular Vibrations by Femtosecond Stimulated Raman Spectroscopy, J. Phys. Chem. Lett., 2020, 11(18), 7805–7813 CrossRef CAS PubMed.
- S. Tahara, H. Kuramochi, S. Takeuchi and T. Tahara, Protein Dynamics Preceding Photoisomerization of the Retinal Chromophore in Bacteriorhodopsin Revealed by Deep-UV Femtosecond Stimulated Raman Spectroscopy, J. Phys. Chem. Lett., 2019, 10(18), 5422–5427 CrossRef CAS PubMed.
- H. Kuramochi, S. Takeuchi and T. Tahara, Ultrafast Photodissociation Dynamics of Diphenylcyclopropenone Studied by Time-Resolved Impulsive Stimulated Raman Spectroscopy, Chem. Phys., 2018, 512, 88–92 CrossRef CAS.
- D. W. McCamant, P. Kukura and R. A. Mathies, Femtosecond Stimulated Raman Study of Excited-State Evolution in Bacteriorhodopsin, J. Phys. Chem. B, 2005, 109(20), 10449–10457 CrossRef CAS PubMed.
- T. Schmierer, S. Laimgruber, K. Haiser, K. Kiewisch, J. Neugebauer and P. Gilch, Femtosecond Spectroscopy on the Photochemistry of Ortho-Nitrotoluene, Phys. Chem. Chem. Phys., 2010, 12, 15653–15664 RSC.
- S. Hädrich, J. Rothhardt, T. Eidam, J. Limpert and A. Tünnermann, High Energy Ultrashort Pulses Via Hollow Fiber Compression of a Fiber Chirped Pulse Amplification System, Opt. Express, 2009, 17, 3913–3922 CrossRef PubMed.
- S. Shim and R. A. Mathies, Generation of Narrow-Bandwidth Picosecond Visible Pulses from Broadband Femtosecond Pulses for Femtosecond Stimulated Raman, Appl. Phys. Lett., 2006, 89, 121124 CrossRef.
- S. A. Kovalenko, A. L. Dobryakov and N. P. Ernsting, An Efficient Setup for Femtosecond Stimulated Raman Spectroscopy, Rev. Sci. Instrum., 2011, 82, 063102 CrossRef CAS PubMed.
- C. R. Hall, I. A. Heisler, G. A. Jones, J. E. Frost, A. A. Gil, P. J. Tonge and S. R. Meech, Femtosecond Stimulated Raman Study of the Photoactive Flavoprotein AppABLUF, Chem. Phys. Lett., 2017, 683, 365–369 CrossRef CAS.
- J. Lee, J. R. Challa and D. W. McCamant, Ultraviolet Light Makes dGMP Floppy: Femtosecond Stimulated Raman Spectroscopy of 2′-Deoxyguanosine 5′-Monophosphate, J. Phys. Chem. B, 2017, 121(18), 4722–4732 CrossRef CAS PubMed.
- S. Karmakar, A. Ambastha, A. Jha, A. Dharmadhikari, J. Dharmadhikari, R. Venkatramani and J. Dasgupta, Transient Raman Snapshots of the Twisted Intramolecular Charge Transfer State in a Stilbazolium Dye, J. Phys. Chem. Lett., 2020, 11(12), 4842–4848 CrossRef CAS PubMed.
- F. Neese, Software Update: The ORCA Program System, Version 4.0, 2012 DOI:10.1002/wcms.1327.
- F. Neese, The ORCA Program System, 2012 DOI:10.1002/wcms.81.
- A. D. Becke, A New Mixing of Hartree–Fock and Local Density-functional Theories, J. Chem. Phys., 1993, 98, 1372 CrossRef CAS.
- C. Lee, W. Yang and R. G. Parr, Development of the Colle-Salvetti Correlation-Energy Formula into a Functional of the Electron Density, Phys. Rev. B, 1988, 37, 785 CrossRef CAS PubMed.
- A. Schäfer, C. Huber and R. Ahlrichs, Fully Optimized Contracted Gaussian Basis Sets of Triple Zeta Valence Quality for Atoms Li to Kr, J. Chem. Phys., 1994, 100, 5829 CrossRef.
- R. Chidthong and S. Hannongbua, Excited State Properties, Fluorescence Energies, and Lifetimes of a Poly(Fluorene-Phenylene), Based on TD-DFT Investigation, J. Comput. Chem., 2010, 31(7), 1450–1457 CAS.
- A. P. Scott and L. Radom, Harmonic Vibrational Frequencies: An Evaluation of Hartree–Fock, Møller–Plesset, Quadratic Configuration Interaction, Density Functional Theory, and Semiempirical Scale Factors, J. Phys. Chem., 1996, 100(41), 16502–16513 CrossRef CAS.
- L. Tang, L. Zhu, M. A. Taylor, Y. Wang, S. J. Remington and C. Fang, Excited State Structural Evolution of a GFP Single-Site Mutant Tracked by Tunable Femtosecond-Stimulated Raman Spectroscopy, Molecules, 2018, 23(9), 2226 CrossRef PubMed.
- M. Alcolea Palafox and F. J. Meléndez, A Comparative Study of the Scaled Vibrational Frequencies in the Local Anesthetics Procaine, Tetracaine and Propoxycaine by Means of Semiempirical Methods: AM1, PM3 and SAM1, J. Mol. Struct.: THEOCHEM, 1999, 459(1–3), 239–271 CrossRef CAS.
- F. Han, W. Liu, L. Zhu, Y. Wang and C. Fang, Initial Hydrogen-Bonding Dynamics of Photoexcited Coumarin in Solution with Femtosecond Stimulated Raman Spectroscopy, J. Mater. Chem. C, 2016, 4, 2954–2963 RSC.
- P. C. Andrikopoulos, Y. Liu, A. Picchiotti, N. Lenngren, M. Kloz, A. S. Chaudhari, M. Precek, M. Rebarz, J. Andreasson and J. Hajdu, Femtosecond-to-Nanosecond Dynamics of Flavin Mononucleotide Monitored by Stimulated Raman Spectroscopy and Simulations, Phys. Chem. Chem. Phys., 2020, 22, 6538–6552 RSC.
- L. Zhu, S. Saha, Y. Wang, D. A. Keszler and C. Fang, Monitoring Photochemical Reaction Pathways of Tungsten Hexacarbonyl in Solution from Femtoseconds to Minutes, J. Phys. Chem. B, 2016, 120(51), 13161–13168 CrossRef CAS PubMed.
- B. Galabov and D. Simov, The Stretching Vibration of Carbonyl Groups in Cyclic Ketones, Chem. Phys. Lett., 1970, 5, 549–551 CrossRef CAS.
- K. E. Thorn, N. R. Monahan, S. Prasad, K. Chen and J. M. Hodgkiss, Efficient and Tunable Spectral Compression using Frequency-Domain Nonlinear Optics, Opt. Express, 2018, 26, 28140–28149 CrossRef CAS PubMed.
- A. Arencibia, M. Taravillo, M. Cáceres, J. Núñez and V. G. Baonza, Pressure Tuning of the Fermi Resonance in Liquid Methanol: Implications for the Analysis of High-Pressure Vibrational Spectroscopy Experiments, J. Chem. Phys., 2005, 123, 214502 CrossRef CAS PubMed.
- B. de Souza, G. Farias, F. Neese and R. Izsák, Efficient Simulation of Overtones and Combination Bands in Resonant Raman Spectra, J. Chem. Phys., 2019, 150, 214102 CrossRef PubMed.
- L. J. Bellamy, Alkynes and Allenes, The Infra-Red Spectra of Complex Molecules, Springer, 1975, pp. 64–71 Search PubMed.
- C. Chen, L. Zhu, M. S. Baranov, L. Tang, N. S. Baleeva, A. Y. Smirnov, I. V. Yampolsky, K. M. Solntsev and C. Fang, Photoinduced Proton Transfer of GFP-Inspired Fluorescent Superphotoacids: Principles and Design, J. Phys. Chem. B, 2019, 123(17), 3804–3821 CrossRef CAS PubMed.
- C. Fang, L. Tang, B. G. Oscar and C. Chen, Capturing Structural Snapshots during Photochemical Reactions with Ultrafast Raman Spectroscopy: From Materials Transformation to Biosensor Responses, J. Phys. Chem. Lett., 2018, 9(12), 3253–3263 CrossRef CAS PubMed.
- J. Zhou, W. Yu and A. E. Bragg, Structural Relaxation of Photoexcited Quaterthiophenes Probed with Vibrational Specificity, J. Phys. Chem. Lett., 2015, 6(17), 3496–3502 CrossRef CAS PubMed.
- D. Murdock, S. J. Harris, J. Luke, M. P. Grubb, A. Orr-Ewing and M. N. R. Ashfold, Transient UV pump–IR Probe Investigation of Heterocyclic Ring-Opening Dynamics in the Solution Phase: The Role Played by Nσ* States in the Photoinduced Reactions of Thiophenone and Furanone, Phys. Chem. Chem. Phys., 2014, 16, 21271–21279 RSC.
- H. Tseng, J. Shen, T. Kuo, T. Tu, Y. Chen, A. P. Demchenko and P. Chou, Excited-State Intramolecular Proton-Transfer Reaction Demonstrating Anti-Kasha Behavior, Chem. Sci., 2016, 7, 655–665 RSC.
- J. M. Papanikolas, V. Vorsa, M. E. Nadal, P. J. Campagnola, H. K. Buchenau and W. C. Lineberger, I−2 Photodissociation and Recombination Dynamics in Size-selected I−2(CO2)N Cluster Ions, J. Chem. Phys., 1993, 99, 8733 CrossRef CAS.
- A. Poloukhtine and V. V. Popik, Mechanism of the Cyclopropenone Decarbonylation Reaction. A Density Functional Theory and Transient Spectroscopy Study, J. Phys. Chem. A, 2006, 110(5), 1749–1757 CrossRef CAS PubMed.
- S. A. Elroby, S. G. Aziz and R. Hilal, Electronic Structure and Decomposition Reaction Mechanism of Cyclopropenone, Phenylcylopropenone and their Sulfur Analogues: A Theoretical Study, J. Mol. Model., 2013, 19(3), 1339–1353 CrossRef CAS PubMed.
- S. A. K. Elroby, O. I. Osman and S. G. Aziz, Theoretical Investigation of the Photochemical Reaction Mechanism of Cyclopropenone Decarbonylation, Mol. Phys., 2011, 109(14), 1785–1795 CrossRef CAS.
Footnote |
| † Electronic supplementary information (ESI) available: Raman pump and probe spectra, photo-ODIBO and ODIBO geometries, photo-ODIBO S1 and S0 mode visualizations, local mode decompositions of normal modes, and additional FSRS peak kinetics. The fit model used to describe the three-component kinetics of the Raman intensities. See DOI: 10.1039/d1cp03512f |
| This journal is © the Owner Societies 2021 |