
 Open Access Article
 This Open Access Article is licensed under a
 Creative Commons Attribution 3.0 Unported Licence
Spectroscopy and photochemistry of copper nitrate clusters†
Tobias F.
Pascher
 ,
Milan
Ončák
*,
Christian
van der Linde
and
Martin K.
Beyer
*
,
Milan
Ončák
*,
Christian
van der Linde
and
Martin K.
Beyer
*
Institut für Ionenphysik und Angewandte Physik, Universität Innsbruck, Technikerstraße 25, 6020 Innsbruck, Austria. E-mail: Milan.Oncak@uibk.ac.at; Martin.Beyer@uibk.ac.at
First published on 6th April 2021
Abstract
The investigation of copper nitrate cluster anions Cu(II)n(NO3)2n+1−, n ≤ 4, in the gas phase using ultraviolet/visible/near-infrared (UV/vis/NIR) spectroscopy provides detailed insight into the electronic structure of the copper salt and its intriguing photochemistry. In the experimentally studied region up to 5.5 eV, the spectra of copper(II) nitrate exhibit a 3d–3d band in the vis/NIR and well-separated bands in the UV. The latter bands originate from Ligand-to-Metal Charge Transfer (LMCT) as well as n–π* transitions in the nitrate ligands. The clusters predominantly decompose by loss of neutral copper nitrate in the electronic ground state after internal conversion or via the photochemical loss of a neutral NO3 ligand after a LMCT. These two decomposition channels are in direct competition on the ground state potential energy surface for the smallest copper nitrate cluster, Cu(II)(NO3)3−. Here, copper nitrate evaporation is thermochemically less favorable. Population of π* orbitals in the nitrate ligands may lead to N–O bond photolysis. This is observed in the UV region with a small quantum efficiency, with photochemical loss of either nitrogen dioxide or an oxygen atom.
Introduction
Copper and copper oxide nanoparticles are used in industry for many oxidation1–3 and reduction processes4,5 due to their favorable catalytic properties.6,7 As a coinage metal, copper exhibits a very distinct chemistry acting as an electron donor.8,9 It is particularly useful in methanol synthesis,10,11 carbon dioxide activation12,13 and hydrogen storage applications.14–16 Copper salts are typically used in the production of heterogeneous catalysts via a calcination process.17–20 Copper nitrate is the most widely used copper salt due to its stability, high availability and comparatively low cost.21From a fundamental point of view, the photochemistry of nitrate is of high interest in its own right since it plays a key role in our atmosphere as trace compound.22 In the photochemistry of snow and ice, nitrate photolysis leads to very reactive products.23–25 The photochemistry of systems can be challenging to describe by quantum chemical methods since excited state calculations are still much more demanding than calculations on the electronic ground state.26,27 The photochemistry of nitrate has been investigated experimentally in aqueous solution, leading to very reactive OH radicals, among other products.28 The photolysis of the isolated nitrate anion in the gas phase has only been investigated theoretically, predicting N–O bond photolysis with the negative charge remaining on either fragment,29 while experimental data on isolated nitrate or on nitrate ligands coordinated to metal centers is still missing. Well-defined gas-phase experiments can provide valuable insight into reaction mechanisms on a molecular level,30–32 while spectroscopy based experiments can yield detailed insight into the molecular and electronic structure.33,34
In the gas phase, many molecular mechanisms involving the activation of methane,35,36 carbon dioxide37–40 and elementary steps of hydrogen storage applications41–43 have successfully been studied. Ultraviolet/visible/near-infrared (UV/vis/NIR) photodissociation spectroscopy is a very powerful tool to characterize the complex electronic structure of transition metal complexes and clusters in the gas phase.44–54 We recently investigated photochemical hydrogen evolution from hydrated magnesium,55,56 the effect of salt environments on the reactions and photolysis of organic substances,57–59 as well as the evolution of the hydration environment of a single electron60 or a carbon dioxide radical anion61 using action spectroscopy.
Only recently, CuO+ ligated with acetonitrile has been investigated spectroscopically, showing a very complex interaction with the additional ligand changing the biradical-oxygen character of bare Cu(I)+O partially to Cu(II)2+O−.62 Our investigation of copper formate by infrared multiple photon dissociation (IRMPD) revealed a complex vibrational signature involving Fermi interactions.63–65 The formation of formic acid upon IRMPD depends strongly on the available energy and the oxidation state of the copper centers. Furthermore, UV/vis photodissociation of copper(II) formate provided detailed insights into its photochemistry.66 Internal conversion dominates after exciting 3d–3d excitations in the visible region and Ligand-to-Metal Charge Transfer (LMCT) excitations in the UV, which additionally allowed the photochemical loss of the neutral ligand.66 In contrast, in a previous UV/vis study of Cu(II)(NO3)3− the 3d–3d excitations expected for the [Ar]3d9 configuration of copper(II) have not been reported.67 Two bands in the UV were observed in this study, along with a single decomposition fragment, Cu(I)(NO3)2−.67 However, decomposition of Cu(II)(NO3)3− in the electronic ground state following collisional activation revealed nitrate anion formation as a competing second channel, which is even preferred at lower energies.68 Further decomposition of Cu(I)(NO3)2− results in CuO(NO3)− + NO2 or Cu(I)NO3 + NO3−.68
Here, we investigate Cu(II)n(NO3)2n+1−, n = 1–4, using UV/vis/NIR action spectroscopy and quantum chemical calculations. Detailed insight into the electronic configuration, the photochemistry of copper nitrate as well as its decomposition on the ground state potential energy surface is obtained. In addition, the results provide valuable insight into the photochemistry of nitrate anions.
Experimental & theoretical methods
Mass selected copper nitrate anions Cu(II)(NO3)3− are introduced into the gas phase via electrospray ionization (ESI). For this purpose, copper nitrate (Sigma Aldrich) is dissolved at a concentration of about 5 mmol l−1 in a solution consisting of 50% water and 50% methanol (HPLC-Grade, Carl Roth). For larger clusters, isotopic enrichment is advantageous to increase the signal-to-noise ratio. To this end, the sample is prepared by reacting isotopically enriched 63-copper oxide (98.6% enrichment, Isotope JSC) at a concentration of 200 mmol l−1 with nitric acid at 60 °C in a solution of 80% water and 20% nitric acid (70%, Carl Roth) to isotopically enriched 63Cu(II)(NO3)2. For ESI, this solution is then diluted in a 1![[thin space (1/6-em)]](https://www.rsc.org/images/entities/char_2009.gif) :19 ratio with acetonitrile (HPLC grade, Merck), adding 3% in total volume of nitric acid to support the clustering to larger copper nitrate clusters. This allows to investigate up to 63Cu4(NO3)9− in our experiment.
:19 ratio with acetonitrile (HPLC grade, Merck), adding 3% in total volume of nitric acid to support the clustering to larger copper nitrate clusters. This allows to investigate up to 63Cu4(NO3)9− in our experiment.
The ions formed by ESI are transferred to the cell of a commercial Bruker APEX Qe 9.4 Tesla Fourier-Transform Ion Cyclotron Resonance (FT-ICR) mass spectrometer described in more detail elsewhere.57,58,63 Here, the trapped clusters are irradiated from 225 to 1650 nm for up to 20 s with pulsed laser light at a repetition rate of 20 Hz provided by an EKSPLA NT342B optical parametric oscillator. The photodissociation spectra are corrected for fragmentation caused by black body infrared radiative dissociation (BIRD)69–74 and collisions with the background gas, while the photodissociation cross sections are calculated as described in detail before.66,75 Hereby, the beam profile is estimated as Gaussian beam and a correction factor is applied to the measured laser power after each mass spectrum to account for losses in beam steering optics and windows. An additional correction factor is applied to compensate for the beam walk-off upon switching between the OPO regions, signal to idler at 710 nm, sum frequency generation to signal at 410 nm, and second harmonic generation to sum frequency generation at 296 nm, as described before.66
For the ground-state calculations of copper nitrate clusters, density functional theory (DFT) within the B3LYP/def2TZVP level is used for geometry optimization, based on extensive benchmarking with the previously studied copper salt, copper formate.63–66 The good performance of the B3LYP method was independently assessed in the decomposition of copper nitrate.68 Initially, several different structures are investigated with intact nitrate ligands and the nitrate photolysis products O− and NO2− in different binding motifs towards the copper centers. All the calculated reaction energies are corrected for zero-point effects, and the stability of the ground state wave function was tested for all optimized structures.
The excited states are investigated using Equation of Motion – Coupled Cluster Singles and Doubles (EOM-CCSD) calculations for Cu(NO3)3−.76,77 The time dependent density functional theory (TD-DFT) with the BMK functional, TD-BMK, provided results close to the ones of EOM-CCSD, with small shifts towards lower energies. The aug-cc-pVDZ basis set seems sufficient to describe the electronic configuration as it yields results close to the triple-zeta basis set, see Table S1 and Fig. S5 in the ESI.† All excited states up to an excitation energy of at least 6 eV are considered. Due to computational efficiency, TD-BMK is applied in the investigation of Cu2(NO3)5−. The character of the electronic excitations is investigated for Cu(II)(NO3)3− using the Natural Transition Orbital (NTO) scheme.78 The modelled excitation spectrum was obtained via a molecular dynamics run on the B3LYP/def2TZVP level of theory at a temperature of 300 K over the course of 101 ps at a step size of 100 a.u. (about 2.4 fs; note that no hydrogen atoms are present in the studied systems and thus a larger step size might be used). The first 8000 steps are discarded for thermalization. The electronic excitations are calculated every 50 steps using TD-BMK/aug-cc-pVDZ with 50 electronic states. The calculated peaks are convoluted with Gaussian functions at a width of 0.3 eV to produce the spectra.
All calculations were carried out with the Gaussian 16 program79 in combination with the ABIN code80 for the molecular dynamics.
Results and discussion
Photodissociation spectra
We start our investigation of the copper nitrate system with UV/vis/NIR action spectroscopy experiments on Cu(II)(NO3)3−, Cu(II)2(NO3)5−, Cu(II)3(NO3)7− and Cu(II)4(NO3)9−. The resulting total photodissociation cross sections σ are illustrated in Fig. 1. For the two smallest clusters, the calculated oscillator strength f of the electronic transitions is shown for the energetically lowest lying isomer along with the predicted structure.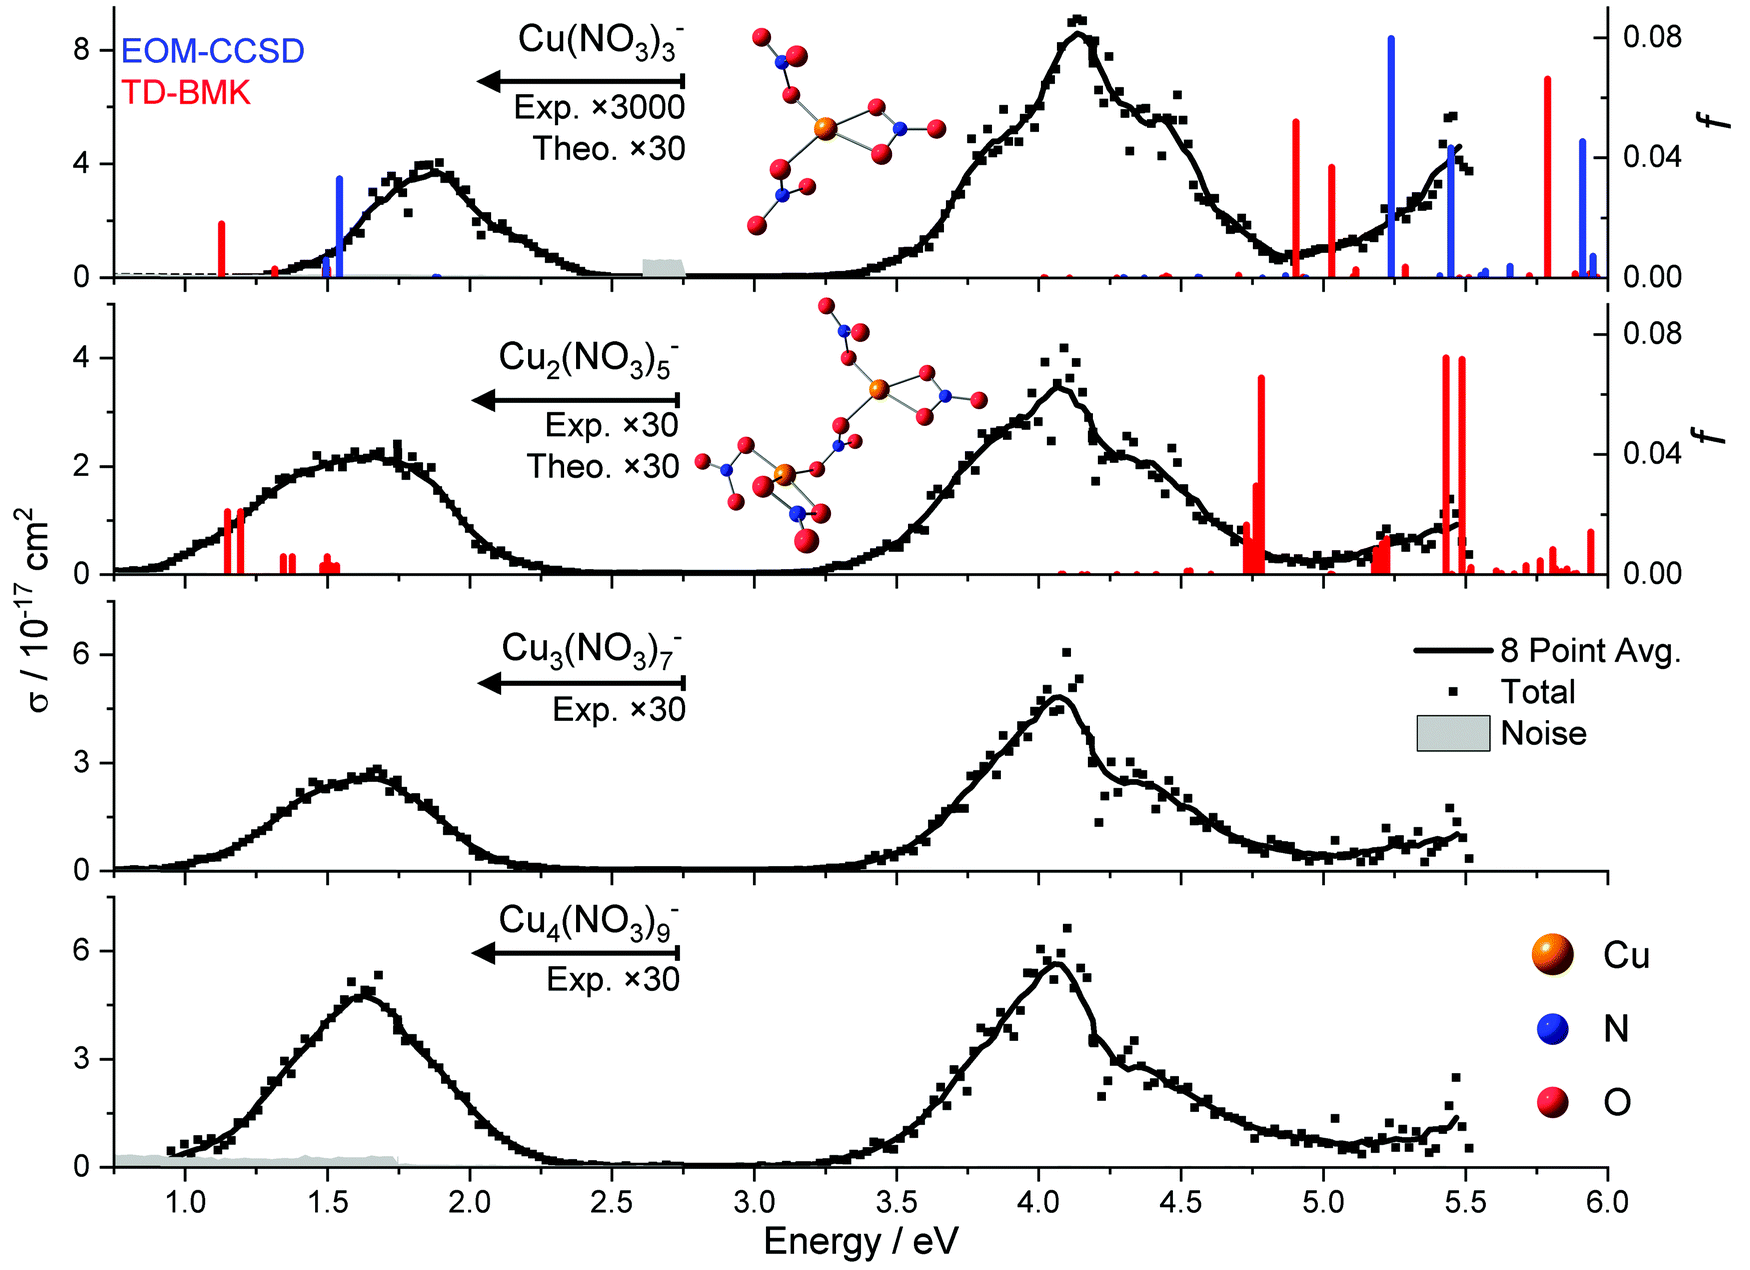 | ||
| Fig. 1 The photodissociation cross section σ of Cu(II)(NO3)3−, Cu(II)2(NO3)5−, Cu(II)3(NO3)7− and Cu(II)4(HCO2)9− along with the calculated electronic transitions for the energetically most favorable isomer of the two smallest clusters. The high level of theory EOM-CCSD/aug-cc-pVDZ//B3LYP/def2TZVP was used for Cu(II)(NO3)3−. TD-BMK/aug-cc-pVDZ//B3LYP/def2TZVP calculations were performed for Cu(II)(NO3)3− and Cu(II)2(NO3)5−. The calculated oscillator strength f is displayed by vertical lines. The section below 2.75 eV has been scaled for better visibility. | ||
For each cluster size, one can find two well-separated bands along with the flank of a third band in the deep UV above 5 eV. With the exception of Cu(II)(NO3)3−, the low-energy band peaks at about 1.6 eV in the NIR. It almost does not shift with cluster size, and its width changes only slightly. The band in the UV peaks at about 4.1 eV, featuring a roughly 30–60 times higher transition intensity than that of the vis/NIR band for n ≥ 2. Also, the characteristic shape of the UV band hardly changes with cluster size. For Cu(II)(NO3)3−, the low-energy band peaks at about 1.9 eV, and is roughly 6000 times less intense than the UV band. In addition, its width is significantly reduced compared to the larger clusters. Both properties indicate that this band originates from a multi-photon process.
Our experimental spectrum of Cu(II)(NO3)3− is comparable to the earlier measurement of Kaufman and Weber, covering the photon energy range of 3.0–5.6 eV.67 They observed a very broad band around 4.5 eV, with a hint of a shoulder at 3.8 eV. This band lies in the onset of a very intense transition deeper in the UV. However, the reflectron-time-of-flight (RETOF) setup used by Kaufman and Weber lacks a thermalization region, and they report metastable decay of some ions. This indicates that the ions in their experiment had significantly higher internal energy than in the present work, where the ions are thermalized to room temperature in the hexapole collision cell and by exchange of infrared radiation in the almost collision-free environment of the ICR cell. This explains the significantly broader, less structured band in the RETOF work. Due to the experimental setup, only one laser pulse can be applied for photodissociation in the RETOF work, which probably renders the very weak absorption in the vis/NIR region inaccessible. To detect this band, we irradiated the ions for up to 20 s at a pulse repetition rate of 20 Hz, i.e., with up to 400 laser pulses.
Excited state calculations
Theoretical calculations on the B3LYP/def2TZVP level of theory predict one energetically low-lying isomer for Cu(II)(NO3)3− with C2 symmetry, shown in Fig. 1. In this structure, one nitrate acts as a bidentate ligand, while the other two nitrate ligands form one short Cu–O bond with the metal center. Minimizing Coulomb repulsion between these two nitrate ligands and maximizing the Coulomb attraction with the Cu(II) center determines their alignment relative to one another. Similar structural motifs are present in the lowest energy structure found for Cu(II)2(NO3)5−. Both Cu(II) centers have one bidentate ligand. The Cu(II) centers are connected via a bridging bidentate nitrate ligand, while the remaining nitrate ligands form one Cu–O bond. Overall, the calculated structures reflect the preferred square-planar coordination of the [Ar]3d9 configuration of Cu(II).The highest level of theory that we managed to apply to the Cu(II)(NO3)3− ion was EOM-CCSD/aug-cc-pVDZ. While the calculations predict well-separated bands in the vis/NIR and within the UV, the energetic position deviates from experiment. Even on the EOM-CCSD/aug-cc-pVDZ level of theory, the discrepancy of the first band is about 0.3 eV, and the shift is even higher with at least 1.1 eV in the UV if we consider only spin-allowed transitions between doublet states. While zero-point effects will shift the calculated energies of dissociative excited states to somewhat lower values due to the kinetic energy correction,81 one can expect these effects to be in the range of about 0.2–0.4 eV. TD-DFT calculations on the TD-BMK/aug-cc-pVDZ//B3LYP/def2TZVP level of theory reproduce the trends of EOM-CCSD/aug-cc-pVDZ relatively well for a transition metal complex, with small shifts towards lower energies.
For the larger cluster, Cu(II)2(NO3)5−, the theoretical calculations at the minimum-energy geometry of the ground state, i.e. in the Franck–Condon (FC) point, predict a very similar situation compared to Cu(II)(NO3)3−, with minor energetic shifts. This can be expected since a nitrate ligand inserts between the two copper ions in the energetically most favorable isomer, see Fig. 1. For this cluster size, the experimental and theoretical intensities agree relatively well between the vis/NIR and the UV band, which is additional evidence for the involvement of a multiple-photon dissociation in the vis/NIR band of Cu(II)(NO3)3−. The energetic position of the vis/NIR band in the TD-DFT calculations matches well with our experiment after considering the shift towards higher energies in the higher level method. The absence of a copper–copper bond further explains why the spectra remain largely unchanged for larger copper nitrate clusters. The same behavior was observed previously with copper formate clusters.66 However, the computationally predicted position of the UV band here still deviates significantly from experiment.
Molecular dynamics of Cu(II)(NO3)3− performed at 300 K using TD-BMK/aug-cc-pVDZ//B3LYP/def2TZVP suggest that the first three intense UV transitions merge to one broad UV band, as displayed in Fig. 2. The UV band is shifting to slightly lower excitation energies compared to the excitations in the FC point. Another high-energy band arises in these calculations from significantly more intense transitions even deeper in the UV. Interestingly, the structure is very flexible in the dynamics. In particular, a Cu–O bond to the bidentate ligand may break, and one of the monodentate ligands may turn bidentate by forming a new Cu–O bond. This mechanism affords complete randomization of the ligands. Overall, the modelled absorption spectra exhibit a comparable shape to the experimental photodissociation action spectrum of clusters with n ≥ 2, with transition intensities in the same order of magnitude, while the experimental cross section in the vis/NIR of Cu(II)(NO3)3− is significantly smaller. In this energy range, the cross section is lower because the photodissociation of Cu(II)(NO3)3− requires the sequential absorption of two photons in order to gain sufficient energy to decompose, which is discussed in detail below.
 | ||
| Fig. 2 The modelled photodissociation cross section σtheo of Cu(II)(NO3)3−via a molecular dynamics run at 300 K over 101 ps at the TD-BMK/aug-cc-pVDZ//B3LYP/def2TZVP level of theory along with the oscillator strength of the electron excitations in the FC point for comparison. | ||
A possible explanation for the energetic discrepancy of the transitions in copper nitrate anions in the UV are multi-reference effects, which a single-reference based method like EOM-CCSD and TD-BMK cannot describe properly. Copper as transition metal is well-known to be difficult to calculate, and potential charge-transfer excitations involving the nitrate anion with many degenerate excited states pose additional challenges to theory. Multi-reference calculations are required to properly describe these excitations, with many other states being close in this energy range.27,82 However, single-reference based methods worked relatively well for a different copper salt, copper formate.66
An alternative explanation for the discrepancy is inaccurate oscillator strengths due to the involvement of quartet states of copper nitrate clusters, which lie in the energy range of the experimental UV band. Upon considering spin–orbit coupling, they might mix with the intense, spin-allowed excitations deeper in the UV and borrow a part of their oscillator strength.83,84 However, the theoretical description of the multi-reference character and spin–orbit coupling remains challenging, and our attempts in this direction were thus far not successful. For a meaningful multi-reference calculation, a relatively large active space including copper's active 3d, 4s and 4p orbitals along with all participating nitrate orbitals is required. Such calculations with a reliable method, for example the Multi-Reference Configuration Interaction (MRCI) level of theory, are computationally not feasible for a system of this size. In addition, calculations including spin–orbit coupling in open-shell systems are currently not implemented across the quantum chemical program packages accessible to us in a way that would allow for a treatment of even the smallest copper nitrate cluster anion. Therefore, a definitive assignment of the bands remains challenging. The interpretation of the experiments here relies on comparison to similar cases, while the theoretical results using single-reference based methods without spin–orbit coupling can only yield semi-quantitative support.
Excitation character
The character of the excitations is analyzed for Cu(II)(NO3)3− using natural transition orbitals on the TD-BMK/aug-cc-pVDZ//B3LYP/def2TZVP level of theory, see Fig. 3. The first band in the experiment corresponds to the first four calculated transitions. These are 3d–3d excitations from one of the four doubly occupied 3d orbitals into the singly occupied 3dxy orbital of Cu(II), resulting in the excited states D1–D4. Interestingly, the lowest excitation energies are calculated for excitation from the 3dz2 and 3dx2−y2 orbital, leading to excited states D1 and D2, respectively. In this case, the electron density in the xy plane, i.e., the plane of coordination, is not significantly increased. Significantly more energy is required for excitation from the 3dxz and 3dyz orbital, which feature nodes in the xy plane, corresponding to the excited states D3, D4. In this case, the electron density at the copper center increases in the excited state in the xy plane, which weakens the coordinate bonds with the nitrate ligands. | ||
| Fig. 3 The original and final electron orbitals are shown for the first six electronic excitations along with the most intense UV transitions below 6.0 eV in Cu(II)(NO3)3−. Natural transition orbitals are calculated at the TD-BMK/aug-cc-pVDZ//B3LYP/def2TZVP level of theory. For nearly degenerate transitions, orbitals of different symmetry mix; then, only the most important component is shown. | ||
The lowest lying excited states in the UV, D5 and D6, exhibit a biradical character and share the configuration with the quartet states Q1,2. They correspond to n–π* excitations of the nitrate ligands, which energetically fit well to the first UV band. While they exhibit a relatively low oscillator strength, they play an important role in the photochemistry of the system, see below. Deeper in the UV beyond 6 eV, more intense transitions within the nitrate ligands can be found, which could contribute to the flank at the upper energy limit of the experiment.
The three lowest-lying strong transitions with oscillator strengths f > 0.01 correspond to a UV band in the experiment, involving excited states D8, D9 and D12. They have LMCT character from the doubly occupied n orbitals of the nitrate ligands towards the singly occupied 3d orbital in copper(II). The interpretation of the excitation character involving LMCT excitations along with excitations within the nitrate ligand deeper in the UV agrees with the previous assignment of the Cu(II)(NO3)3− spectrum by Kaufman and Weber.67 However, with spin–orbit coupling also the low-lying quartet states might play a role in the first UV band. Comparison to copper(II) formate clusters with similar absorption bands in the vis and early UV shows very analogous excitation characters, with energetically low-lying 3d–3d excitations along with LMCT excitations in the UV while the high-energy band in the UV observed here is missing.66 This indicates that the latter excitation arises from excitations within the nitrate ligand, since the electronic structure of the formate ligand differs considerably, and excitations are much higher in energy.
As the copper centers do not interact directly with each other in larger clusters and the experimental spectra are very similar, the character of the excitations is not expected to change with cluster size.
Photochemistry
To investigate the photochemistry of copper nitrate clusters, selected partial photodissociation cross sections of Cu(II)(NO3)3− and Cu(II)2(NO3)5− are displayed in Fig. 4a and b, respectively. In the low-energy band, Cu(II)(NO3)3− only decomposes into the energetically most favorable products, namely NO3− and Cu(I)(NO3)2−via reaction (1) and (2), respectively, see Table 1. However, two photons are required since the photon energy lies far below the energy threshold of the reactions. In the UV band, Cu(I)(NO3)2− is clearly dominant. Cu(I)(NO3)O− is most likely formed sequentially via reaction (3a) after absorption of a second photon, as the photon energy is not sufficient for reaction (3b) at the start of the band.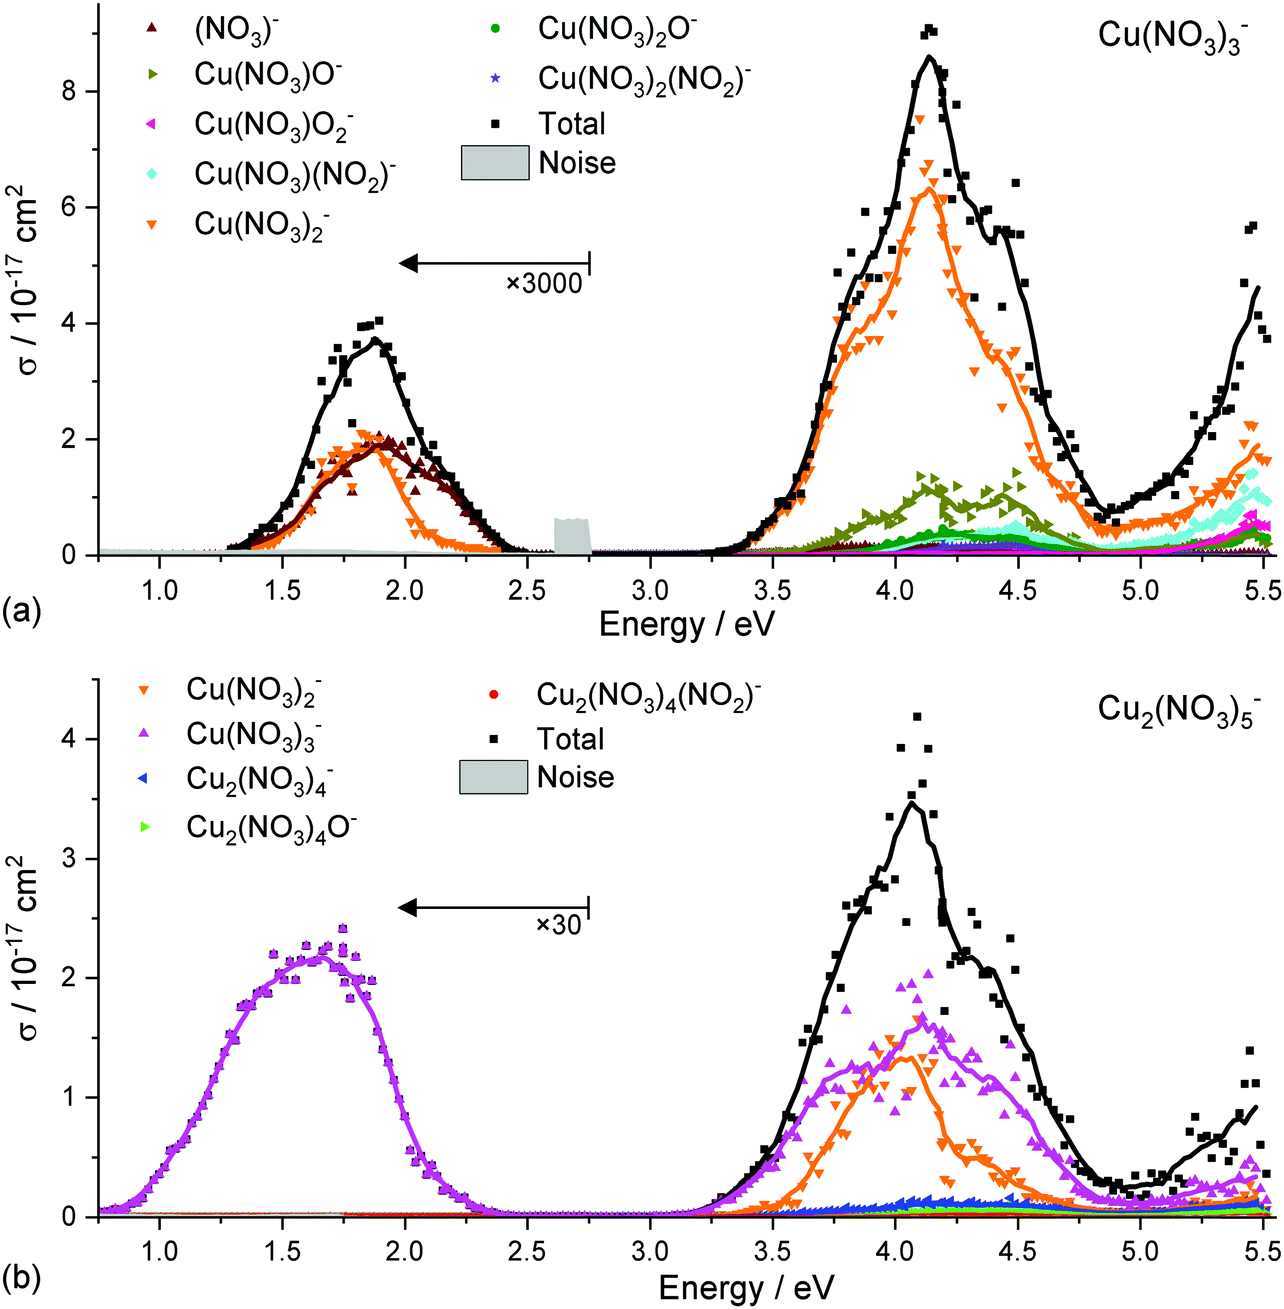 | ||
| Fig. 4 The experimental spectra of Cu(II)(NO3)3− in (a) and Cu(II)2(NO3)5− in (b) as total dissociation cross section plus selected partial cross sections. A running average of eight data points is used in addition to a multiplication factor of 3000 and 30, respectively, below 2.75 eV for visibility. | ||
| Reaction | Reactant | Products | E A/eV | E theo/eV |
|---|---|---|---|---|
| (1) | Cu(NO3)3− | NO3− + Cu(NO3)2 | 1.3 | 2.00 |
| (2) | Cu(NO3)2− + NO3 | 1.4 | 2.05 | |
| (3a) | Cu(NO3)O− + NO3 + NO2 | 3.3 | 4.78 | |
| (3b) | Cu(NO3)O− + N2O5 | 3.3 | 4.09 | |
| (4) | Cu(NO3)2O− + NO2 | 3.5 | 2.57 | |
| (5) | Cu(NO3)2(NO2)− + O(3P2) | 3.9 | 3.39 | |
| (6) | Cu(NO3)O2− + 2(NO2) | 3.4 | 3.82 | |
| (7) | Cu(NO3)(NO2)− + NO3 + O(3P2) | 3.7 | 5.52 | |
| (8) | Cu2(NO3)5− | Cu(NO3)3− + Cu(NO3)2 | 0.7 | 0.83 |
| (9a) | Cu(NO3)2− + Cu(NO3)2 + NO3 | 3.2 | 2.87 | |
| (9b) | Cu(NO3)2− + Cu(NO3)3 | 3.2 | 2.58 | |
| (10) | Cu2(NO3)4− + NO3 | 3.3 | 1.85 | |
| (11) | Cu2(NO3)4O− + NO2 | 3.8 | 1.85 | |
| (12) | Cu2(NO3)4(NO2)− + O(3P2) | 4.0 | 3.33 |
Cu(II)2(NO3)5− decomposes in the 3d–3d band exclusively to Cu(II)(NO3)3−via the energetically most favorable reaction (8) by loss of neutral Cu(II)(NO3)2, requiring only 0.83 eV. In the UV band, however, this product exhibits significant sequential fragmentation into Cu(I)(NO3)2−via reaction (9a), afforded by the excess photon energy and potentially also secondary photofragmentation of the dominant Cu(II)(NO3)3− product. Direct loss of Cu(III)(NO3)3 is also possible with the available photon energy via reaction (9b).
It is noteworthy that the copper(I) nitrate products can sequentially decompose predominantly via NO2 loss leading towards the copper oxide CuO2− or even Cu2O3− while copper(II) nitrate predominantly loses a neutral nitrate radical or copper nitrate, see Fig. S1–S4 (ESI†) for a full fragment list across all investigated clusters. For clusters with a single copper center, these decomposition pathways compete with the direct loss of the negatively charged nitrate ligand. The predominantly observed decomposition pathways of Cu(II)(NO3)3− are matching the fragmentation observed in CID experiments, with Cu(I)(NO3)O− followed by Cu(II)O2− as sequential products of initial Cu(I)(NO3)2− formation, which compete with NO3− loss.68 Furthermore, the predominant generation of Cu(I)(NO3)2− in the UV is in agreement with the result from Kaufman and Weber,67 who only observed the Cu(I)(NO3)2− ion with single-pulse irradiation. The predominant fragmentation of Cu(II)(NO3)3− and Cu(II)2(NO3)5−via the energetically most favorable channels points towards fast internal conversion upon photoexcitation, followed by statistical decomposition in the ground state. This decomposition pathway along with the cluster size and oxidation state dependence of the decomposition mirrors the behavior of the previously studied copper formate clusters.63,64,66
The branching ratio of reactions (1) and (2) in the low-energy band of Cu(II)(NO3)3− in Fig. 4a is 50:50 up to ∼1.7 eV. Towards higher energies, the NO3− fragment becomes strongly preferred. Reaction (1) is the energetically most favorable decomposition channel and requires 2.00 eV while reaction (2) is slightly higher at 2.05 eV. The decomposition requires more energy than provided by a photon at the center of the band, pointing towards a multiple-photon process. This explains why the intensity of the low-energy band is significantly lower than in the spectra of larger clusters, when a single photon is sufficient to evaporate a neutral copper nitrate unit. With the excess energy available after two photon excitation, statistical decomposition into the two almost isoenergetic products explains the 50:50 branching ratio. The high-energy flank of the vis/NIR band exhibits a clear shoulder, indicating that specific transitions are responsible for the preferential formation of NO3− in this range. As discussed above, the D3, D4 excitations result in an increased electron density in the plane of coordination, which leads to a repulsion foremost of the bidentate nitrate ligand. This would tentatively rationalize the preferential formation of NO3− as a consequence of the ultrafast dynamics initiated by the excitation.
In the UV bands, however, NO3− formation does not play a significant role, the predominant decomposition channel is by far reaction (2) leading to Cu(I)(NO3)2−. This is explained in a straightforward manner by the LMCT character of the excitations in this energy range or by an accessible conical intersection towards these states. The charge transfer states photochemically prepare a (NO3)[Cu(I)(NO3)2]− structure which can then easily decompose via reaction (2). Direct nitrate loss can also be observed in low intensities in the UV bands of Cu(II)2(NO3)5−, reaction (10), where it is energetically very unfavorable compared to copper nitrate loss via reaction (8).
In the UV bands of Cu(II)(NO3)3− and Cu(II)2(NO3)5−, fragments which correspond to decomposition of the nitrate ligand via loss of NO2 or an oxygen atom are observed in smaller amounts. Namely Cu(NO3)2O−, Cu(NO3)2(NO2)−, Cu(NO3)O2− and Cu(NO3)(NO2)− are observed as products of Cu(II)(NO3)3−, reactions (4)–(7). These product channels were not observed in previous experiments employing single-pulse laser irradiation.67 For Cu(II)2(NO3)5−, Cu2(NO3)4O− and Cu2(NO3)4(NO2)− are found, reaction (11) and (12), among many more fragments in the larger clusters, see Fig. S1–S4 (ESI†) for a comprehensive list of fragments and partial photodissociation spectra.
To investigate these decomposition channels computationally, we followed the two N–O dissociation coordinates for a nitrate ligand of Cu(II)(NO3)3− in the lowest-lying quartet state Q1, d(Cu(NO3)2O−–NO2) in Fig. 5a and d(Cu(NO3)2(NO2)−–O) in Fig. 5b. The lowest-lying excited states in the UV region are the D5,6 and Q1,2 states which exhibit a biradical character. This allows a relaxed PES scan in the lowest lying state of the quartet manifold to directly investigate the photochemistry of the nitrate ligand in the excited state, without employing computationally expensive excited state methods like EOM-CCSD. In the quartet state, one nitrate ligand has two unpaired electrons and relaxes to a non-planar structure, which corresponds to a local minimum on the Q1 surface as depicted in Fig. 5. Due to the biradical character of the NO3− ligand, the N–O bonds are slightly lengthened by up to about 0.1 Å. This local minimum lies substantially below the excitation energy in the FC point, red triangle down in Fig. 5. The relaxation from the FC point to the local minimum thus releases significant excess energy, which is more than sufficient to overcome the minor energetic barriers of about 0.2 eV and 0.4 eV along the dissociation coordinates in Fig. 5a and b, leading to NO2 and O loss, respectively.
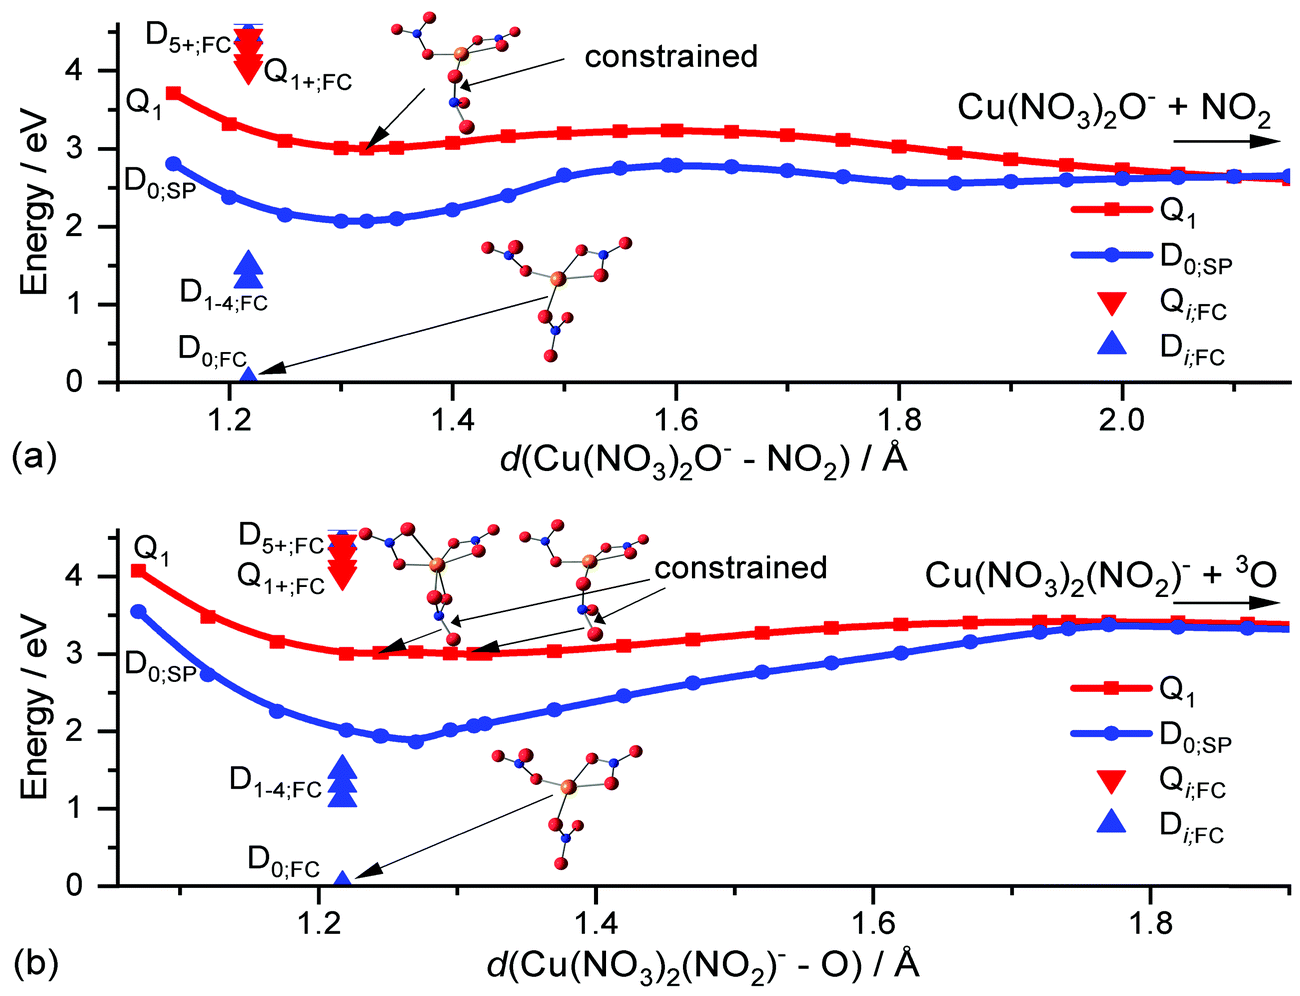 | ||
| Fig. 5 Relaxed potential energy surface scan of Cu(II)(NO3)3− in the Q1 state and the corresponding single-point energies of D0, D0;SP, on the B3LYP/def2TZVP level of theory b-splined along the decomposition coordinate of a nitrate ligand; (a) d(Cu(NO3)2O−–NO2) and (b) d(Cu(NO3)2(NO2)−–O). Additionally, the energy of the ground state D0 in the FC point and the corresponding vertical excitation energies Qi;FC and Di;FC on the TD-BMK/aug-cc-pVDZ//B3LYP/def2TZVP level of theory is shown along with structures in the Q1 minima and the FC point. | ||
Therefore, after an excitation in the UV, a nitrate ligand can decompose via reaction (4) and (5), respectively, if the excited electron ends up in its π* orbital, either directly via an n–π* transition or via internal conversion through one or more conical intersections following an LMCT transition. Alternatively, the photochemical loss of the nitrate ligand as a neutral radical is possible if the electron is instead transferred to the copper center. As a third option, the ion can relax through a conical intersection into the manifold of the D0–4 states, where all nitrate ligands are in their ground state configuration and the excitation is localized on the Cu(II) center. This leads eventually to statistical decomposition on the ground state potential energy surface. The latter two decomposition pathways are very similar to the Cu(II) formate system, where fast internal conversion into the ground state has been observed in addition to direct loss of the formate ligand as formyloxyl radical after a LMCT excitation.66 Furthermore, the observed decomposition of the nitrate ligand along an N–O bond is in good agreement with the theoretically predicted decomposition channels of NO3− into reactive NO2− or O− anions.29 Thus, excitation of copper nitrate in the UV is also an indirect probe of the photochemistry of the nitrate anion. Similar N–O bond photolysis may occur in atmospherically more relevant species containing nitrate, like nitric acid trihydrate aerosols85,86 or sea-salt aerosols with traces of nitrate.87
Conclusion
The observed vis/NIR band of Cu(II)n(NO3)2n+1−, n ≤ 4, up to 2.5 eV corresponds to a 3d–3d band, consistent with a [Ar]3d9 electronic configuration of the copper centers without copper–copper bonding interactions. For n ≥ 2, two Cu(II) centers are bridged by a bidentate nitrate ligand. Two bands in the UV, starting around 3.25 eV, arise from a complex interaction of the excited states involving a LMCT character and n–π* transitions of the nitrate ligands. Since the transitions are strongly localized, the spectra of all clusters are very similar, especially for n ≥ 2. The only pronounced exception is the weakness of the d–d band for n = 1, which occurs because two photons are required for dissociation in this case.The photochemistry is dominated by fast internal conversion followed by statistical decomposition in the ground state. Photochemical loss of a nitrate radical occurs through LMCT excitations in the UV or internal conversion from higher lying states into the LMCT states. The fragmentation of copper nitrate in the ground state is highly size and oxidation state dependent. While large clusters predominantly lose neutral Cu(II) nitrate, nitrate radical evaporation is competitive in small clusters, e.g. Cu(II)(NO3)3− to Cu(I)(NO3)2−. For Cu(I) nitrate clusters, decomposition of the nitrate ligands results in copper nitrate–oxide mixtures, which can eventually lead to pure copper oxides like CumOm+1− (m = 1, 2) in sequential photolysis steps.
A very intriguing feature in the photochemistry of copper nitrate clusters is that N–O bond photolysis occurs after population of a π* orbital in the UV bands. These channels lead to the decomposition of the corresponding NO3− ligand and the formation of reactive species.
Author contributions
Tobias F. Pascher: data curation; formal analysis; investigation; project administration; visualization; writing – original draft; Milan Ončák: conceptualization; methodology; software; supervision; validation; writing – review & editing; Christian van der Linde: data curation; methodology; project administration; visualization; writing – review & editing; Martin K. Beyer: conceptualization; funding acquisition; software; supervision; writing – review & editing.Data availability
The data that supports the findings of this study are available within the article and its ESI.†Conflicts of interest
There are no conflicts of interest to declare.Acknowledgements
The computational results presented have been achieved using the HPC infrastructure LEO of the University of Innsbruck. The tunable OPO systems are part of the Innsbruck Laser Core Facility, financed by the Austrian Federal Ministry of Education, Science and Research. Preliminary data for this study was acquired by Nathalie Nipp.References
- D. Delimaris and T. Ioannides, Appl. Catal., B, 2009, 89, 295 CrossRef CAS.
- S. Royer and D. Duprez, ChemCatChem, 2011, 3, 24 CrossRef CAS.
- M. S. Kamal, S. A. Razzak and M. M. Hossain, Atmos. Environ., 2016, 140, 117 CrossRef CAS.
- G. Xie, Z. Liu, Z. Zhu, Q. Liu, J. Ge and Z. Huang, J. Catal., 2004, 224, 42 CrossRef CAS.
- P. Granger and V. I. Parvulescu, Chem. Rev., 2011, 111, 3155 CrossRef CAS PubMed.
- C. E. Elwell, N. L. Gagnon, B. D. Neisen, D. Dhar, A. D. Spaeth, G. M. Yee and W. B. Tolman, Chem. Rev., 2017, 117, 2059 CrossRef CAS PubMed.
- M. B. Gawande, A. Goswami, F.-X. Felpin, T. Asefa, X. Huang, R. Silva, X. Zou, R. Zboril and R. S. Varma, Chem. Rev., 2016, 116, 3722 CrossRef CAS PubMed.
- A. J. Jordan, G. Lalic and J. P. Sadighi, Chem. Rev., 2016, 116, 8318 CrossRef CAS PubMed.
- H. Häkkinen, M. Moseler and U. Landman, Phys. Rev. Lett., 2002, 89, 33401 CrossRef PubMed.
- A. Álvarez, A. Bansode, A. Urakawa, A. V. Bavykina, T. A. Wezendonk, M. Makkee, J. Gascon and F. Kapteijn, Chem. Rev., 2017, 117, 9804 CrossRef PubMed.
- K. C. Waugh, Catal. Lett., 2012, 142, 1153 CrossRef CAS.
- J. Artz, T. E. Müller, K. Thenert, J. Kleinekorte, R. Meys, A. Sternberg, A. Bardow and W. Leitner, Chem. Rev., 2018, 118, 434 CrossRef CAS PubMed.
- A. Goeppert, M. Czaun, J.-P. Jones, G. K. Surya Prakash and G. A. Olah, Chem. Soc. Rev., 2014, 43, 7995 RSC.
- M. Grasemann and G. Laurenczy, Energy Environ. Sci., 2012, 5, 8171 RSC.
- D. Mellmann, P. Sponholz, H. Junge and M. Beller, Chem. Soc. Rev., 2016, 45, 3954 RSC.
- R. S. Dhayal, W. E. van Zyl and C. W. Liu, Dalton Trans., 2019, 48, 3531 RSC.
- S. Fujita, S. Moribe, Y. Kanamori, M. Kakudate and N. Takezawa, Appl. Catal., A, 2001, 207, 121 CrossRef CAS.
- R. Prasad and P. Singh, Catal. Sci. Technol., 2013, 3, 3326 RSC.
- J. M. Dumas, C. Geron, A. Kribii and J. Barbier, Appl. Catal., 1989, 47, L9–L15 CrossRef CAS.
- R. Prasad and P. Singh, Bull. Chem. React. Eng. Catal., 2011, 6, 63 Search PubMed.
- M. Gao, R. Ye, W. Shen and B. Xu, Org. Biomol. Chem., 2018, 16, 2602 RSC.
- J. Schuttlefield, G. Rubasinghege, M. El-Maazawi, J. Bone and V. H. Grassian, J. Am. Chem. Soc., 2008, 130, 12210 CrossRef CAS PubMed.
- A. M. Grannas, A. E. Jones, J. Dibb, M. Ammann, C. Anastasio, H. J. Beine, M. Bergin, J. Bottenheim, C. S. Boxe, G. Carver, G. Chen, J. H. Crawford, F. Dominé, M. M. Frey, M. I. Guzmán, D. E. Heard, D. Helmig, M. R. Hoffmann, R. E. Honrath, L. G. Huey, M. Hutterli, H. W. Jacobi, P. Klán, B. Lefer, J. McConnell, J. Plane, R. Sander, J. Savarino, P. B. Shepson, W. R. Simpson, J. R. Sodeau, R. von Glasow, R. Weller, E. W. Wolff and T. Zhu, Atmos. Chem. Phys., 2007, 7, 4329 CrossRef CAS.
- H.-W. Jacobi and B. Hilker, J. Photochem. Photobiol., A, 2007, 185, 371 CrossRef CAS.
- R. E. Honrath, M. C. Peterson, S. Guo, J. E. Dibb, P. B. Shepson and B. Campbell, Geophys. Res. Lett., 1999, 26, 695 CrossRef CAS.
- S. Mai and L. González, Angew. Chem., Int. Ed., 2020, 59, 16832 CrossRef CAS PubMed.
- H. Lischka, D. Nachtigallová, A. J. A. Aquino, P. G. Szalay, F. Plasser, F. B. C. Machado and M. Barbatti, Chem. Rev., 2018, 118, 7293 CrossRef CAS PubMed.
- P. Warneck and C. Wurzinger, J. Phys. Chem., 1988, 92, 6278 CrossRef CAS.
- O. Svoboda and P. Slavíček, J. Phys. Chem. Lett., 2014, 5, 1958 CrossRef CAS PubMed.
- H. Schwarz, Coord. Chem. Rev., 2017, 334, 112 CrossRef CAS.
- H. Schwarz, Catal. Sci. Technol., 2017, 7, 4302 RSC.
- H. Schwarz, S. Shaik and J. Li, J. Am. Chem. Soc., 2017, 139, 17201 CrossRef CAS PubMed.
- J. Roithová, Chem. Soc. Rev., 2012, 41, 547 RSC.
- F. Gunzer, S. Krüger and J. Grotemeyer, Mass Spectrom. Rev., 2019, 38, 202 CrossRef CAS PubMed.
- H. Schwarz, P. González-Navarrete, J. Li, M. Schlangen, X. Sun, T. Weiske and S. Zhou, Organometallics, 2017, 36, 8 CrossRef CAS.
- H. Schwarz, Angew. Chem., Int. Ed., 2011, 50, 10096 CrossRef CAS PubMed.
- J. M. Weber, Int. Rev. Phys. Chem., 2014, 33, 489 Search PubMed.
- E. Barwa, M. Ončák, T. F. Pascher, A. Herburger, C. van der Linde and M. K. Beyer, Chem. – Eur. J., 2020, 26, 1074 CrossRef CAS PubMed.
- E. Barwa, T. F. Pascher, M. Ončák, C. van der Linde and M. K. Beyer, Angew. Chem., Int. Ed., 2020, 59, 7467–7471 CrossRef CAS PubMed.
- T. F. Pascher, E. Barwa, C. van der Linde, M. K. Beyer and M. Ončák, Theor. Chem. Acc., 2020, 139, 127 Search PubMed.
- A. Zavras, M. Krstić, P. Dugourd, V. Bonačić-Koutecký and R. A. J. O’Hair, ChemCatChem, 2017, 9, 1298 Search PubMed.
- R. A. J. O’Hair, A. Mravak, M. Krstić and V. Bonačić-Koutecký, ChemCatChem, 2019, 11, 2443 Search PubMed.
- M. Krstić, Q. Jin, G. N. Khairallah, R. A. J. O’Hair and V. Bonačić-Koutecký, ChemCatChem, 2018, 10, 1173 Search PubMed.
- S. Xu, J. E. T. Smith, S. Gozem, A. I. Krylov and J. M. Weber, Inorg. Chem., 2017, 56, 7029 CrossRef CAS PubMed.
- S. Xu, J. E. T. Smith and J. M. Weber, J. Phys. Chem. A, 2016, 120, 7650 CrossRef CAS PubMed.
- S. Xu, J. E. T. Smith and J. M. Weber, J. Chem. Phys., 2016, 145, 24304 CrossRef PubMed.
- C. S. Byskov, J. M. Weber and S. B. Nielsen, Phys. Chem. Chem. Phys., 2015, 17, 5561 RSC.
- M. Förstel, K. M. Pollow, K. Saroukh, E. A. Najib, R. Mitric and O. Dopfer, Angew. Chem., Int. Ed., 2020, 59, 21403 CrossRef PubMed.
- M. Förstel, W. Schewe and O. Dopfer, Angew. Chem., Int. Ed., 2019, 58, 3356 CrossRef PubMed.
- B. K. A. Jaeger, M. Savoca, O. Dopfer and N. X. Truong, Int. J. Mass Spectrom., 2016, 402, 49 CrossRef CAS.
- M. A. Ashraf, J. Kozubal and R. B. Metz, J. Chem. Phys., 2018, 149, 174301 CrossRef PubMed.
- M. D. Johnston, M. R. Gentry and R. B. Metz, J. Phys. Chem. A, 2018, 122, 8047 CrossRef CAS PubMed.
- W. L. Pearson, C. Copeland, A. Kocak, Z. Sallese and R. B. Metz, J. Chem. Phys., 2014, 141, 204305 CrossRef PubMed.
- J. S. Daluz, A. Kocak and R. B. Metz, J. Phys. Chem. A, 2012, 116, 1344 CrossRef CAS PubMed.
- M. Ončák, T. Taxer, E. Barwa, C. van der Linde and M. K. Beyer, J. Chem. Phys., 2018, 149, 44309 CrossRef PubMed.
- T. Taxer, M. Ončák, E. Barwa, C. van der Linde and M. K. Beyer, Faraday Discuss., 2019, 217, 584 RSC.
- N. K. Bersenkowitsch, M. Ončák, C. van der Linde, A. Herburger and M. K. Beyer, Phys. Chem. Chem. Phys., 2018, 20, 8143 RSC.
- N. K. Bersenkowitsch, M. Ončák, J. Heller, C. van der Linde and M. K. Beyer, Chem. – Eur. J., 2018, 24, 12433 CrossRef CAS PubMed.
- N. K. Bersenkowitsch, M. Ončák, J. Heller, T. F. Pascher, C. van der Linde and M. K. Beyer, Phys. Chem. Chem. Phys., 2020, 22, 12028–12038 RSC.
- A. Herburger, E. Barwa, M. Ončák, J. Heller, C. van der Linde, D. M. Neumark and M. K. Beyer, J. Am. Chem. Soc., 2019, 141, 18000 CrossRef CAS PubMed.
- A. Herburger, M. Ončák, C.-K. Siu, E. G. Demissie, J. Heller, W. K. Tang and M. K. Beyer, Chem. – Eur. J., 2019, 25, 10165 CrossRef CAS PubMed.
- M. Srnec, R. Navrátil, E. Andris, J. Jašík and J. Roithová, Angew. Chem., Int. Ed., 2018, 57, 17053 CrossRef CAS PubMed.
- T. F. Pascher, M. Ončák, C. van der Linde and M. K. Beyer, ChemPhysChem, 2019, 20, 1420 CAS.
- T. F. Pascher, M. Ončák, C. van der Linde and M. K. Beyer, ChemistryOpen, 2019, 8, 1453–1459 CrossRef CAS PubMed.
- T. F. Pascher, M. Ončák, C. van der Linde and M. K. Beyer, J. Chem. Phys., 2020, 153, 184301 CrossRef CAS PubMed.
- T. F. Pascher, M. Ončák, C. van der Linde and M. K. Beyer, Chem. – Eur. J., 2020, 26, 8286–8295 CrossRef CAS PubMed.
- S. H. Kaufman and J. M. Weber, J. Phys. Chem. A, 2014, 118, 9687 CrossRef CAS PubMed.
- C. J. M. Pruitt and D. J. Goebbert, J. Phys. Chem. A, 2015, 119, 4755 CrossRef CAS PubMed.
- R. C. Dunbar, Mass Spectrom. Rev., 2004, 23, 127 CrossRef CAS PubMed.
- T. Schindler, C. Berg, G. Niedner-Schatteburg and V. E. Bondybey, Chem. Phys. Lett., 1996, 250, 301 CrossRef CAS.
- W. D. Price, P. D. Schnier, R. A. Jockusch, E. F. Strittmatter and E. R. Williams, J. Am. Chem. Soc., 1996, 118, 10640 CrossRef CAS PubMed.
- D. Thölmann, D. S. Tonner and T. B. McMahon, J. Phys. Chem., 1994, 98, 2002 CrossRef.
- M. Sena and J. M. Riveros, Rapid Commun. Mass Spectrom., 1994, 8, 1031 CrossRef CAS.
- B. S. Fox, M. K. Beyer and V. E. Bondybey, J. Phys. Chem. A, 2001, 105, 6386 CrossRef CAS.
- A. Herburger, C. van der Linde and M. K. Beyer, Phys. Chem. Chem. Phys., 2017, 19, 10786 RSC.
- H. Koch and P. Jørgensen, J. Chem. Phys., 1990, 93, 3333 CrossRef CAS.
- J. F. Stanton and R. J. Bartlett, J. Chem. Phys., 1993, 98, 7029 CrossRef CAS.
- R. L. Martin, J. Chem. Phys., 2003, 118, 4775 CrossRef CAS.
- M. J. Frisch, G. W. Trucks, H. B. Schlegel, G. E. Scuseria, M. A. Robb, J. R. Cheeseman, G. Scalmani, V. Barone, G. A. Petersson, H. Nakatsuji, X. Li, M. Caricato, A. V. Marenich, J. Bloino, B. G. Janesko, R. Gomperts, B. Mennucci, H. P. Hratchian, J. V. Ortiz, A. F. Izmaylov, J. L. Sonnenberg, D. Williams-Young, F. Ding, F. Lipparini, F. Egidi, J. Goings, B. Peng, A. Petrone, T. Henderson, D. Ranasinghe, V. G. Zakrzewski, J. Gao, N. Rega, G. Zheng, W. Liang, M. Hada, M. Ehara, K. Toyota, R. Fukuda, J. Hasegawa, M. Ishida, T. Nakajima, Y. Honda, O. Kitao, H. Nakai, T. Vreven, K. Throssell, J. A. Montgomery Jr, J. E. Peralta, F. Ogliaro, M. J. Bearpark, J. J. Heyd, E. N. Brothers, K. N. Kudin, V. N. Staroverov, T. A. Keith, R. Kobayashi, J. Normand, K. Raghavachari, A. P. Rendell, J. C. Burant, S. S. Iyengar, J. Tomasi, M. Cossi, J. M. Millam, M. Klene, C. Adamo, R. Cammi, J. W. Ochterski, R. L. Martin, K. Morokuma, O. Farkas, J. B. Foresman and D. J. Fox, Gaussian 16, Revision A.03, Gaussian Inc., Wallingford CT, 2016 Search PubMed.
- D. Hollas, O. Svoboda and M. Ončák, ABIN, Source code available at https://github.com/PHOTOX/ABIN.
- S. Y. Lee, R. C. Brown and E. J. Heller, J. Phys. Chem., 1983, 87, 2045 CrossRef CAS.
- F. Neese, T. Petrenko, D. Ganyushin and G. Olbrich, Coord. Chem. Rev., 2007, 251, 288 CrossRef CAS.
- M. Gerloch and E. C. Constable, Transition Metal Chemistry: The Valence Shell in d-Block Chemistry, Wiley-VCH, Weinheim, New York, 1994 Search PubMed.
- T. Schwab, M. Niedermaier, G. A. Zickler, M. Ončák and O. Diwald, Chem. – Eur. J., 2020, 26, 16049 CrossRef CAS PubMed.
- F. Weiss, F. Kubel, Ó. Gálvez, M. Hoelzel, S. F. Parker, P. Baloh, R. Iannarelli, M. J. Rossi and H. Grothe, Angew. Chem., Int. Ed., 2016, 55, 3276 CrossRef CAS PubMed.
- A. K. Bertram and J. J. Sloan, J. Geophys. Res., 1998, 103, 13261 CrossRef CAS.
- P. Kasibhatla, T. Sherwen, M. J. Evans, L. J. Carpenter, C. Reed, B. Alexander, Q. Chen, M. P. Sulprizio, J. D. Lee, K. A. Read, W. Bloss, L. R. Crilley, W. C. Keene, A. A. P. Pszenny and A. Hodzic, Atmos. Chem. Phys., 2018, 18, 11185 CrossRef CAS.
Footnote |
| † Electronic supplementary information (ESI) available. See DOI: 10.1039/d1cp00629k |
| This journal is © the Owner Societies 2021 |